
Abstract
This article examined generational inequity in social spending between the elderly and children using both country-level aggregate and household-level survey data. We calculated the allocation of social spending towards the elderly and children in 13 OECD countries based on OECD Social Expenditure Database (SOCX). We also presented the age-profile of social transfers for the same countries utilizing data from the Luxembourg Income Study (LIS). The results showed that the allocation of social spending in the United States was tilted toward the elderly compared to other countries. Policy implications for the United States are further discussed.
The divergent paths of well-being between the elderly and children, in relation to the unequal allocation of social spending between these two groups, have been one of the main concerns among researchers and policy makers in the United States. During the 1980s and 1990s, US social welfare programs were faced with the pressure of retrenchment and concerns for the fairness in distribution of public resources between generations emerged, in conjunction with the declining economic status of children in comparison with the elderly. Proponents of generational inequity argument often assert that poverty in the United States is concentrated among children since they are not supported by social welfare programs as much as elderly people are (Brady, 2004; Kingson and Williamson, 1993; Page and Simmons, 2000).
Since Preston’s Population Association of America (PAA) presidential address (1984) brought attention to generational inequity in the United States, research has confirmed that US children fare worse than the elderly. Ozawa (1999) and Ozawa and Kim (1998), for example, argued that during the 1970s to 1980s, the United States raised the economic status of elderly people by enacting a series of governmental programs and that, during the same period, the relative economic status of children deteriorated. This situation remains unchanged today (see Figure 1). As of 2005, the child poverty rate in the United States was 17.8%, whereas the elderly poverty rate was 9.8%. If federal and state income taxes, payroll taxes, and noncash benefits are considered, the elderly and child poverty rates decreased to 6.6% and 13.9%, respectively, showing that the gap still exists (US Census Bureau, 2006).
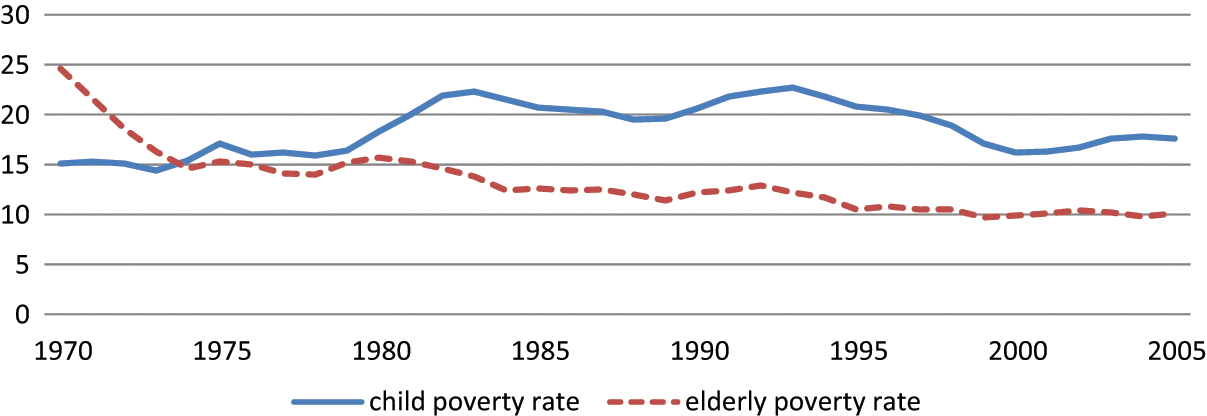
Trends of child and elderly poverty rate in the United States (1970-2005)
While concerns over divergent economic well-being of the elderly and children have been documented in other affluent countries (Myles and Quandagno, 1991; Smeeding et al., 2001), there is a variation across countries. In Canada and the Netherlands, for example, child poverty rates are much higher than elderly poverty rates but the opposite is true for Scandinavian countries such as Sweden and Finland (Smeeding, 2006). In some Continental European countries such as Germany and Austria, child and elderly poverty rates are similar (Smeeding, 2006). What may account for these variations? While several factors such as labor market situations or family structures are widely believed to influence one’s economic well-being, social spending by a series of governmental policies and programs is one of the crucial elements. A large body of research has supported the role of social spending in accounting for one’s economic status, and this is more so for the elderly and children since they are the main dependent groups in the society (Pampel, 1994; Preston, 1984; Rainwater and Smeeding, 2003).
This article examines how public resources are allocated between the elderly and children in the United States and other affluent countries as an underlying reason for divergent paths of well-being of these two groups. We utilized two different datasets to investigate the allocation of social spending: (1) country-level, aggregate data from the OECD Social Expenditure Dataset (SOCX) and (2) household-level survey data from the Luxembourg Income Study (LIS). By utilizing both macro and micro-level datasets, this article provides a comprehensive portrait of resource allocation in the United States in comparison with other affluent countries.
Review of the literature
Before reviewing the extant research on generational inequity in social spending, it is worthwhile to clarify the concept of generational inequity since it can be used in several different contexts. According to Moon (1993), generational equity issues can be framed at least three different ways: (1) comparing different age groups at one time point, (2) comparing cohorts at similar states in their life cycles, and (3) comparing the lifetimes of different generations (e.g., generational accounting approach). In this article, we take the first approach explicitly focusing on the distribution of public resources between different age-groups at one time point.
It was Preston (1984) who first formulated the concern of divergent economic status between the elderly and children in relation to the relative allocation of social spending. He argued that throughout the 1970s and early 1980s, the well-being of children deteriorated, whereas the well-being of the elderly improved. The growth of the elderly population gave the elderly more political power, which in turn resulted in governmental programs and policies favoring the elderly (Preston, 1984). During the 1970s, the federal government enacted a series of public programs to ensure income and health security for elderly people, such as 100% of the primary insurance amount for some qualified widow; the Employee Retirement Income Security Act of 1974 (ERISA), which boosted vesting rights of private pensions. Supplemental Security Income, which was enacted in 1972, and social security, together, made the concept of an effective guaranteed income a reality (Ozawa, 1999). These developments were instrumental in the emergence of generational inequity, in which the elderly came to have considerably low rates of poverty despite the increasing number of elderly people (Ozawa and Kim, 1998). Since Preston’s seminal work, a series of empirical studies have confirmed his argument (e.g., Blank, 1997; Ozawa, 1999; Page and Simmons, 2000).
There are several recent studies that directly calculated social spending on children and the elderly in the United States (Congressional Budget Office, 2000; Issacs, 2009a; Pati, Alessandrini and Schwarz, 2004). Although the exact figures were slightly different across studies due to the use of different methodology and data, these studies indicated that US social spending was slanted to the elderly. The ratio of elderly to child spending was 2.7 in Congressional Budget Office (2000), 3.1 in Pati and associates (2004), and 2.4 in Issacs (2009a). If only considering federal spending, these ratios become much higher (Issacs, 2009a).
Although these studies provide empirical evidence of unequal allocation of social spending between two groups, they only include the United States in their analysis. Is this divergent allocation of social spending seen in other countries? O’Higgins (1988) examined how countries treated the elderly and children differently for 10 OECD countries from 1960 to 1980. According to his overall findings, resources were shifted in the direction of favoring elderly people, indicating that Preston’s argument was supported to a great extent. Preston’s argument is also partially applicable to 14 affluent countries that Gornick (2006) studied; that is, social spending for the elderly persistently increased on the basis of per capita averages, even though the number of an elderly population increased.
While these studies show how social spending is oriented to the elderly among affluent countries, they did not pay much attention to the variation among them. The one exception is Lynch’s work (2001), where she demonstrated the age-orientation of social welfare policies using aggregate social spending data from 21 OECD countries. She concluded that, although every country in the study tended to spend more on the elderly compared to the non-elderly, there was a wide difference among countries. For example, Greece, Japan, Italy, Spain and the United States had the most elderly-oriented social policy regimes, whereas the Netherlands, Ireland, Canada, and the Scandinavian countries had more age-neutral social policy regimes. Issacs (2009b) further refined Lynch’s measure in several ways. She calculated social spending on children for several affluent countries including tax breaks, education and health spending as well as spending on cash benefits or services allocated to families with children. Her calculation suggests that, if all components above are included, the United States is one of the large spenders on children. She also presented the ratio of social spending on the elderly and children based on Lynch’s measures. If comparing social spending on the elderly to children (not non-elderly to children as in the Lynch’s measure) including spending on education, the United States is in the middle of the range among 21 OECD countries, spending 2.5 times as much on the elderly as on children.
While most research reviewed above utilized country-level, aggregate data to measure generational inequity in social spending, Corak and his colleagues (2005) explored the distribution of social transfers and taxes across age groups for 16 European countries, applying the micro-simulation model. They calculated disposable incomes for households from a representative set of survey data, and combined them with the taxes and transfers which were simulated by the model. Although the United States is not included in the analysis, their findings provide consistent evidence for other countries. Elderly people received more benefits and paid far less taxes compared to people in younger age groups. A few countries such as Sweden, Denmark, Finland, and the United Kingdom, however, exhibit an apparent preference for children over the elderly in their tax and transfer systems.
In sum, literature has suggested that most rich countries including the United States spend more on the elderly than on children, but there is a variation across countries. Building on this literature, main objectives of this study are: (1) to empirically explore the extent to which social spending is oriented towards the support for the elderly and children in the United States and other rich countries, and (2) to examine how the age-orientation in social spending has changed over time during the 1990s and 2000s. We use two different large-scale datasets, country-level, aggregate data and household-level survey data. Each dataset captures different aspects of social spending and has its own advantages and limitations; thus, by utilizing both datasets, we may provide more comprehensive portraits of generational inequity in social spending.
Method
To explore the distribution of social spending across age groups in the United States and other affluent countries, we utilized the OECD Social Expenditure Database (SOCX) and data from the Luxembourg Income Study (LIS).
Analyses using aggregate social spending data, such as the OECD SOCX, provide a direct comparison of governments’ efforts on behalf of the elderly and children. The OECD SOCX provides data on total social spending as well as on sub-categories of social spending, such as old age, survivors, family, health, and unemployment benefits. We were interested in the categories that are financially identifiable as those for the elderly and children: old age and survivors benefits for the elderly and family benefits for children. The categories of old age and survivors include cash benefits for the elderly and survivors (e.g., old age pension) and in-kind services (e.g., residential care, home-help services). The category of family includes family cash benefits (e.g., family allowance for children, family support benefits, maternity and parental leave benefits) and in-kind family services (e.g., formal day care, personal services, household services).
We did not consider social spending on health and education in our analysis. The OECD SOCX does not provide the information on health spending by different age-groups. Educational spending was also excluded from our analysis on the basis that they do not provide direct benefits to families with children; instead, substantial portion is directed to teachers or school employees (Pampel, 1994). Although US social welfare programs such as tax expenditures, Earned Income Tax Credit (EITC) or food stamp apparently benefit families with children, OECD SOCX does not include them as components of a family spending category. Therefore, the impact of inclusion of these components is also discussed.
One of the limitations using aggregate data such as the OECD SOCX is that it is difficult to separate other categories of social spending between children and the elderly (Gornick, 2006). Due to these difficulties, we excluded other categories of social spending from the analysis, although they may benefit the elderly or children. Social spending that is not directly targeted to the elderly or children may also influence them through resource allocations within families (Corak et al., 2005). For instance, non-elderly parents may spend some of their money realized by other social programs on nurturing their children or supporting the elderly, but we are not able to consider this resource allocation with the OECD SOCX. These limitations inherent in using aggregate data can be relieved by using the household-level survey data as discussed below.
The LIS data are comparable, large-scale household-level survey data of member countries, and they provide information on how much social transfers each household obtains. Social transfers in the LIS include social insurance benefits (e.g., state old age and survivors benefits, sickness benefits, occupational injury and disease benefits, disability benefits, maternity and other family leave benefits, military/veterans/war benefits, child/family benefits, and unemployment compensation) and social assistance transfers (e.g., social assistance cash benefits and near-cash benefits). In order to show the distribution of social transfers across age groups, we calculated the average social transfers received by each age group based on the LIS data. We, first, equalized household-level social transfers by dividing each household’s total social transfers by the square root of the number of persons in the household. On the basis of these individualized social transfers, we calculated social transfers per person for each age group, expressed as percentages of per person social transfers for the population as a whole. The underlying assumption of these procedures is that social transfers are equally distributed among household members; therefore, all members of a household have the same amount of social transfers. In this way, it is possible to consider a wide range of social spending components that may be directly or indirectly allocated to the elderly or children. One limitation of using the LIS data includes that social transfers in the LIS data only contain cash or near-cash benefits. Although both the OECD SOCX and the LIS data have limitations, analyses using both data-sets yield a better understanding of the generational inequity in resource allocation.
We limited our analysis to 13 OECD countries on the basis of data availability from both the OECD SOCX and LIS datasets. More importantly, we selected countries so that all four types of welfare state regimes noted by Esping-Andersen (1990, 1999) could be included.
Findings
Table 1 presents the amount of social spending allocated to the category of old age and family benefits, expressed as a percentage of the gross domestic product (GDP). Table 1 shows that the United States spends less on both old age and family benefits than do other countries. Throughout the study years, for example, large spenders for old age benefits included France (11.1% - 12.7%), Germany (9.5% - 11.5%), and Italy (10.5% - 14.1%), and small spenders included the United States (5.9% - 6.4%), the United Kingdom (5.6% - 6.1%), and Canada (4.2% - 4.5%). With regard to social spending on family benefits, Norway (2.8% - 3.2%), Sweden (3.1% - 4.8%), and Denmark (3.3% - 3.4%) allocated relatively large amounts of their GDPs to family benefits, whereas the United States (0.6% - 0.8%), Spain (0.3% – 1.2%), and Canada (0.6% - 1.1%) allocated small amounts. To investigate the relative allocation of social spending for the elderly and children, we calculated the ratio between the two categories of spending. In the United States, the ratio of social spending on old age benefits to family benefits was 10.7 in 1991, or the third highest following Spain and Italy. In 2001, the ratio decreased to 7.4, but the United States still ranked the third highest among the 13 countries. This figure increased again to 8.4 (the second highest) in 2005. In contrast, in Sweden, Denmark, Finland, and Norway, this ratio ranged from 2.0 to 3.1 throughout the study years, which indicates that these countries spent substantially more resources on children and their families.
Social spending on the elderly and family as a share of GDP

Source: 1) Social expenditure and Gross Domestic Product (GDP) were retrieved from the OECD Stat Extracts (http://stats.oecd.org/Index.aspx); 2) The data on the Earned Income Tax Credit (EITC) were from FY 2000-2006 U.S. Budgets and IRS Statistics on Income data.
The Continental European countries such as Germany, France, Belgium, and Netherlands were found to allocate a moderate-level of spending on family benefits, thus indicating the ratios of social spending on old age benefits to family benefits ranged from 3.4 to 5.7.
Next, to control for different demographic compositions among countries, we calculated per elderly and per child measures of social spending and results are presented in Table 2. Consistent with findings in Table 1, the United States still has one of the highest ratios of social spending on old age benefits to family benefits. In 1991, for example, the United States spent US$14,408 per elderly person and US$748 per child, and the ratio between the two was 19.3. The ratio decreased to 13.6 in 2001, partly due to more spending on family benefits, but increased again to 15.6 in 2005.
Old age spending per elderly and family spending per child (PPPs)
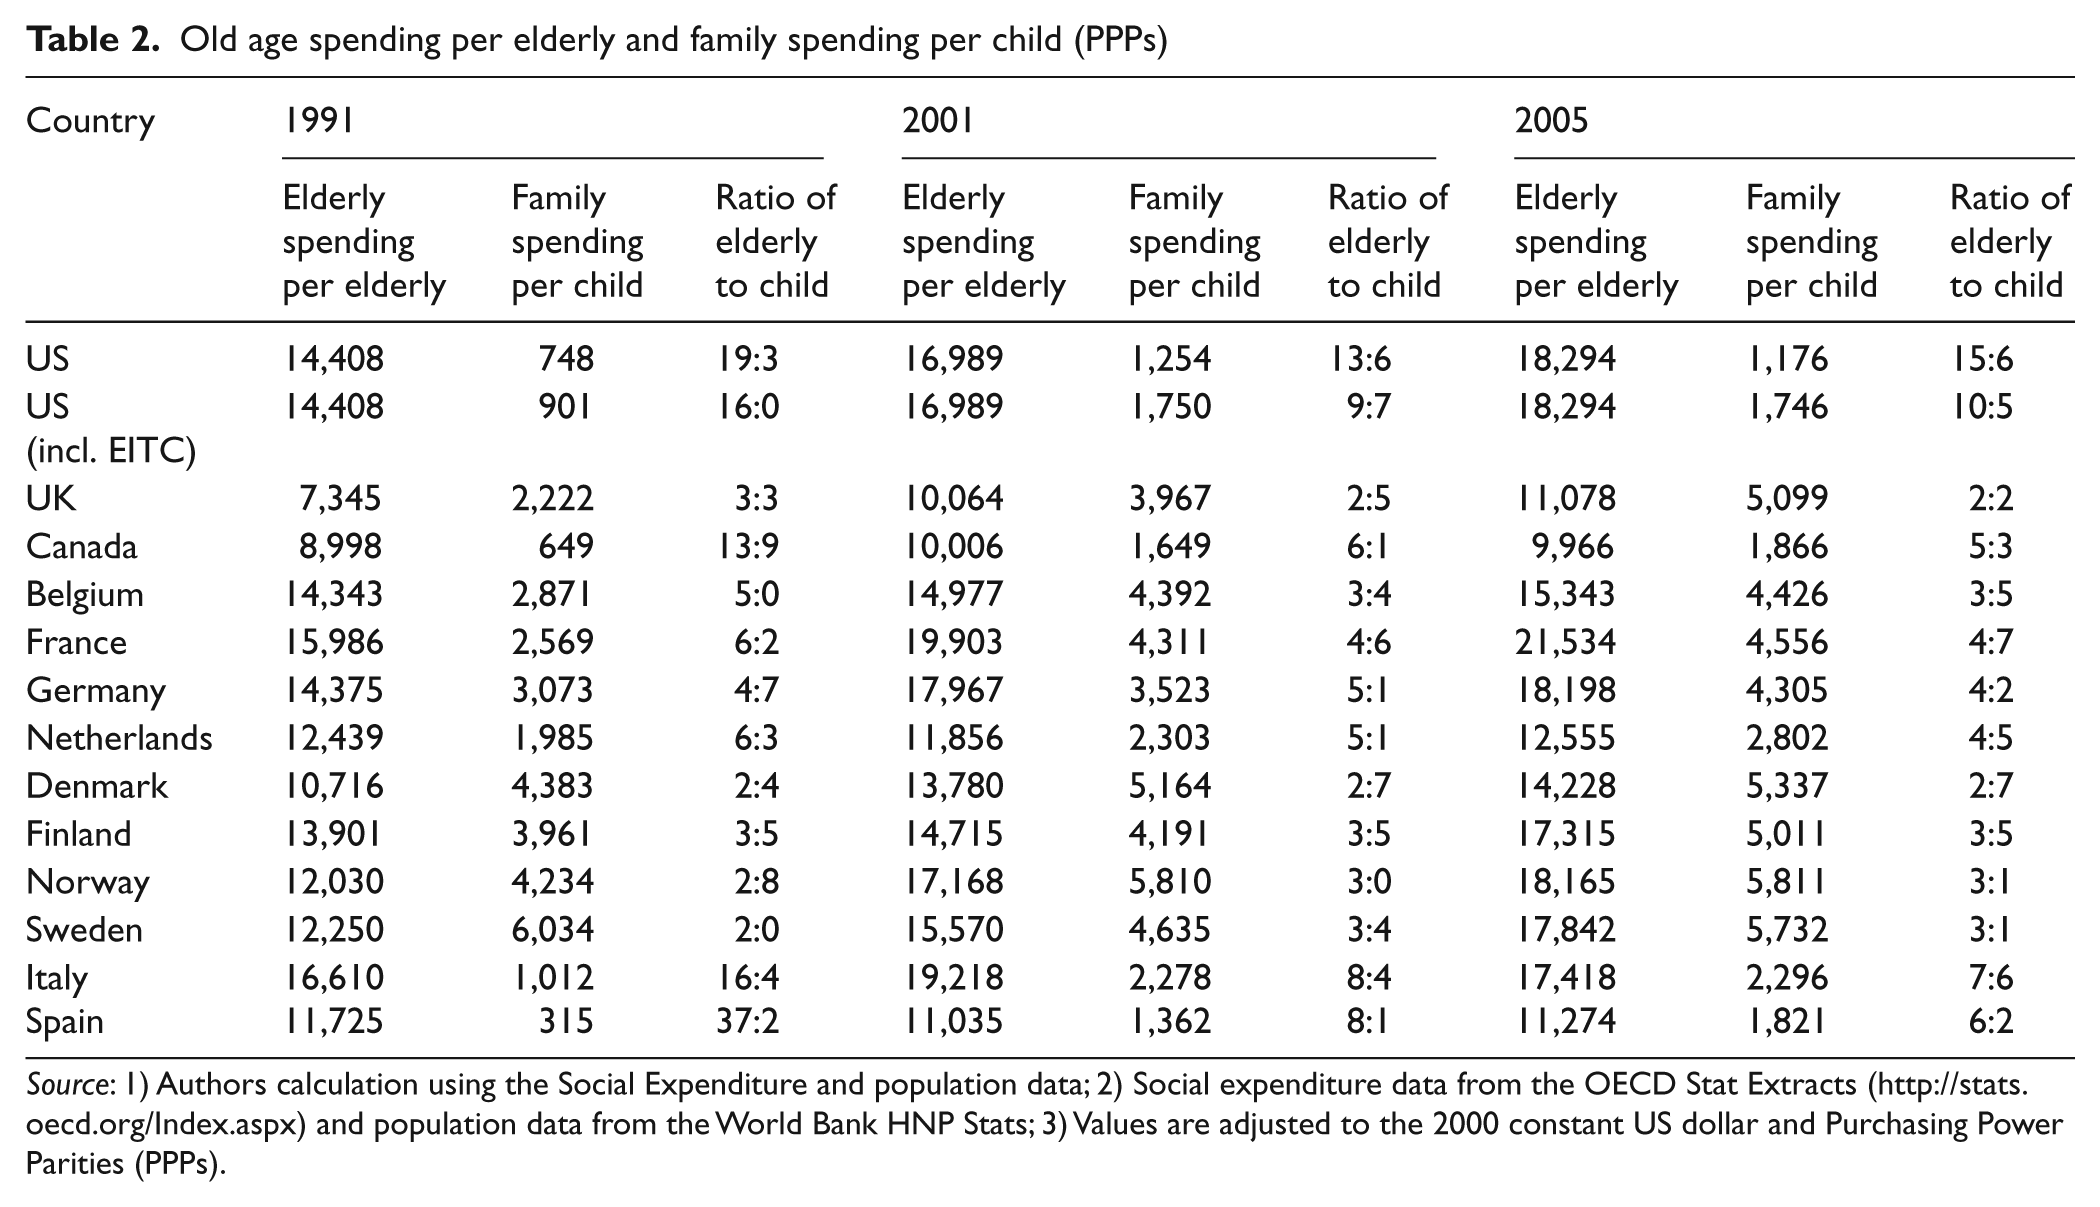
Source: 1) Authors calculation using the Social Expenditure and population data; 2) Social expenditure data from the OECD Stat Extracts (http://stats.oecd.org/Index.aspx) and population data from the World Bank HNP Stats; 3) Values are adjusted to the 2000 constant US dollar and Purchasing Power Parities (PPPs).
The EITC is one of the largest anti-poverty policies for low-income, working families with children in the United States. Since the EITC is not included in the category of family benefits in the OECD SOCX, we additionally calculated the US spending on family benefits including the EITC. The results indicate that social spending on family benefits in the United States substantially increased when the EITC was considered; thus, the ratio between old age and family benefits decreased. For example, in 2001, social spending on family benefits increased from 0.8 to 1.1 and thus the ratio decreased from 7.4 to 5.4 (See Table 1). In the same year, per child spending on family benefits increased from US$1,254 to US$1,750 and the ratio decreased from 13.6 to 9.7 (See Table 2). The United States, however, is one of countries with highest ratios although the gap with other countries narrowed to a large extent.
Next, we investigated the distributional pattern of social transfers by age groups based on the LIS dataset. As Figure 2 shows, in all 13 countries, elderly people tend to receive more social transfers than do children. However, there is a huge variation among countries in the degree of differences between the two groups. As Figure 2 indicates, the age profile of social transfers is very much tilted toward elderly people in the United States, as reflected by the steep slope of the profile at older ages. Elderly people in the United States receive about 500% of social transfers that average person receives, whereas children receive less than 100%. In Sweden, Finland, Denmark, and Norway, in contrast, the slopes of the profiles are much less steep at older ages. Overall, elderly people in these countries receive about 200% to 300% of the average social transfers, and more or less 100% of average social transfers are allocated to children.
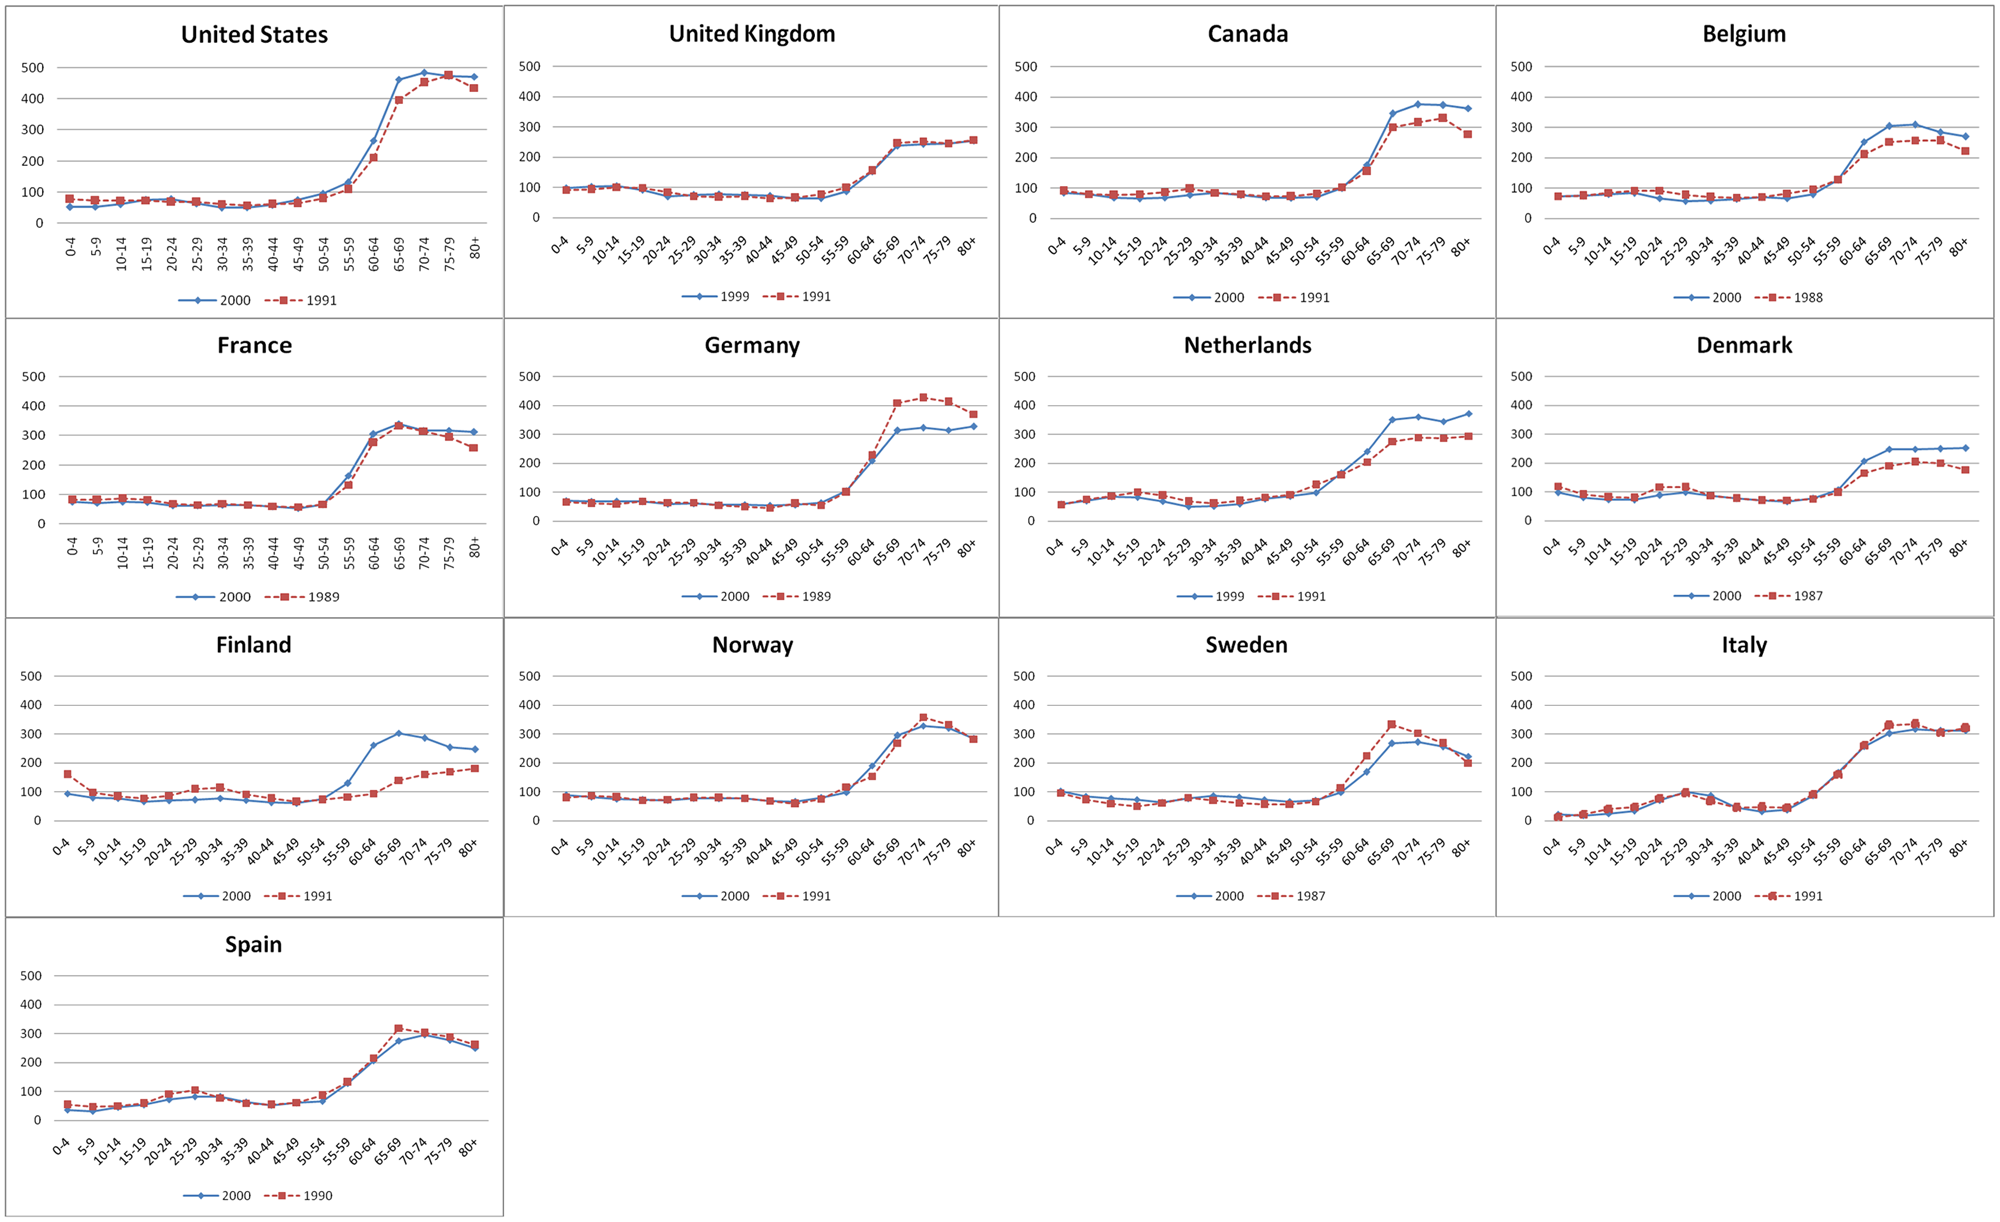
Age-profile of social transfers in the United States and other industrialized countries
To examine the relative distribution of social transfers between the elderly and children more clearly, we calculated the ratio between per capita social transfers received by the elderly aged 65 or older and those received by children from birth to age 17. The results are presented in Table 3. Consistent with the results in Tables 1 and 2, based on OECD SOCX, the United States is in the group with the highest ratios. For example, in 1990, the ratio in the United States was 5.8, compared to 2.6, 3.7, 4.0, and 2.1 for the United Kingdom, France, Sweden, and Denmark, respectively. In 2000, this ratio increased to 8.12 in the United States, and the corresponding figures for the United Kingdom, France, Sweden, and Denmark were 2.4, 4.4, 3.0, and 3.0, respectively. The United States ranked the fourth highest in 1990 and the second highest in 2000 among the 13 industrialized countries we studied.
The ratio of social transfers between the elderly and children
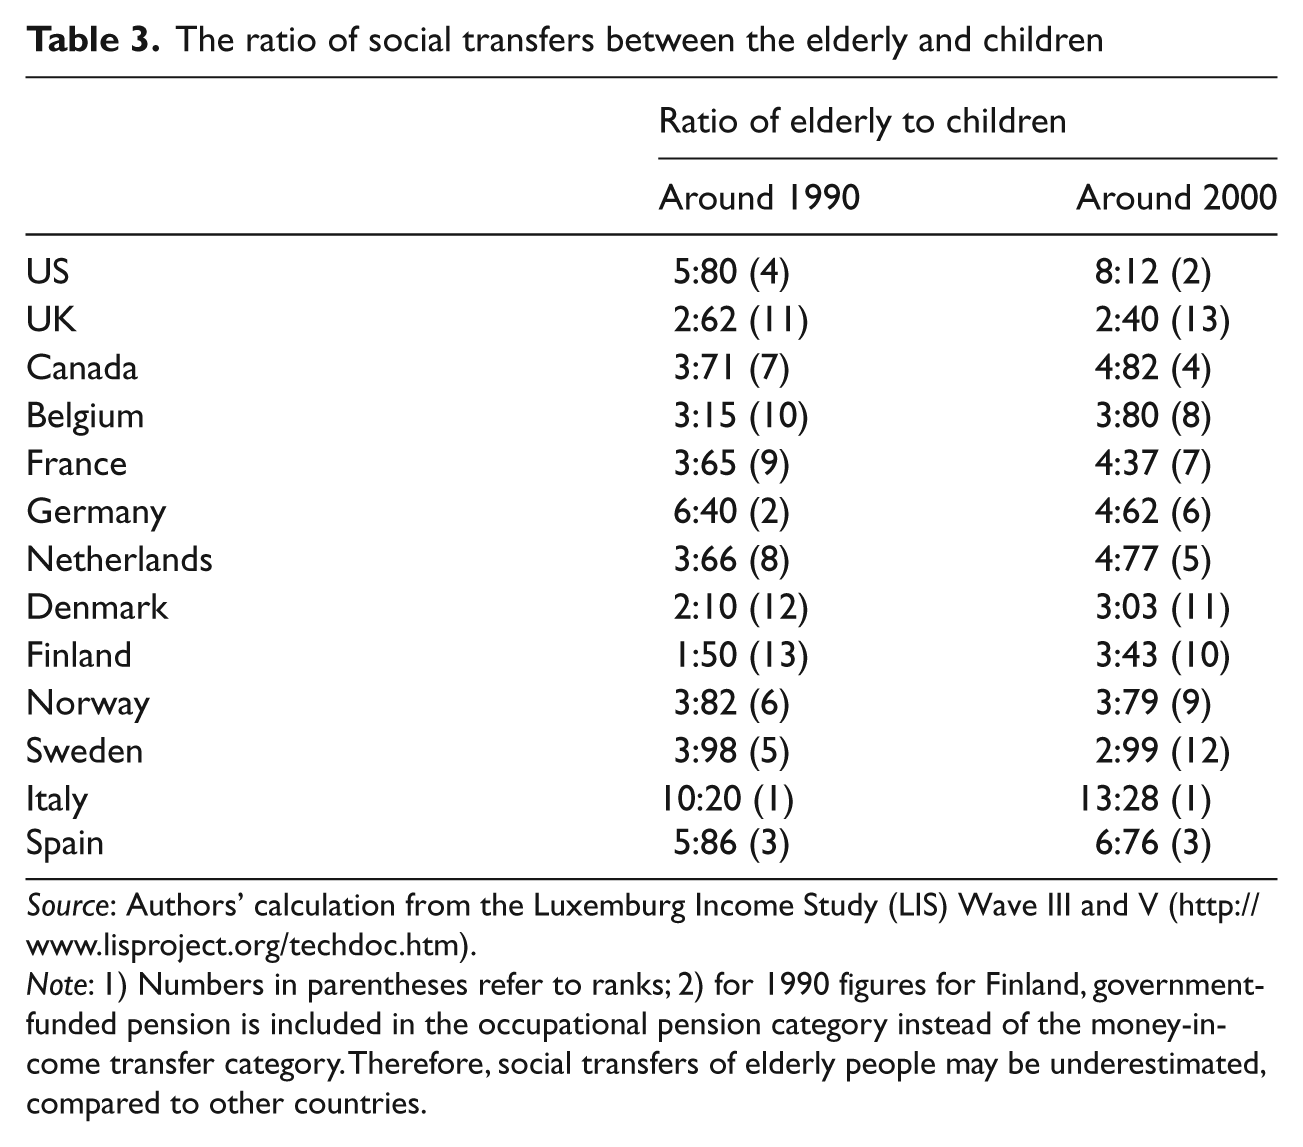
Source: Authors’ calculation from the Luxemburg Income Study (LIS) Wave III and V (http://www.lisproject.org/techdoc.htm)
Note: 1) Numbers in parentheses refer to ranks; 2) For 1990 figures of Finland, government funded pension is included in the occupational pension category instead of the money-income transfer category. Therefore, social transfers of elderly people may be underestimated, compared to other countries.
Discussion
This article explored how public resources were allocated to the elderly and children in the United States and other rich countries. To achieve this purpose, we provided three different measures of the age-orientation in social spending using both macro and micro-level datasets throughout the period of the 1990s and 2000s.
Even though each measure of the age orientation of social spending produced slightly different figures, the overall pattern was consistent across measures. All things taken together, findings demonstrate that, in all 13 countries studied, more resources tend to be allocated to elderly people than to children, but that the relative allocation of social spending between the elderly and children varies. The United States is one of the most elderly-oriented, whereas the Scandinavian countries allocate more resources to children and their families, reflected by relatively low ratios between social spending on the elderly and children. The Continental European countries tend to lie between these two extremes.
The United States spends less for both elderly people and children compared to other rich countries. However, amounts of public resources allocated to children and their families are disproportionately low and this is the main source of generational imbalance in US social spending. Findings also indicate that the elderly-oriented nature of US social spending has been persistent over time during the study period (1990s to 2000s). In most countries included in this study, social spending on families and children tended to increase between 1990 and 2005. Although US social spending on family benefits increased during this period, the degree of an increase is below the average of other countries.
It is often argued that the United States is one of the large spenders on children if tax breaks related to children or other spending are included (Issacs, 2009b). To address this issue, we additionally calculated the age-orientation in social spending including the EITC. As of 2009, the US government spent about US$50 billion on the EITC (Joint Committee on Taxation, 2008), and 6.5 million people including 3.3 million children were lifted from the poverty line due to this program (Williams and Johnson, 2009). Our analysis including the EITC confirms Issacs’ argument (2009b) to some extent. However, even after considering the EITC, the United States is still one of the most elderly-oriented although the gap with other countries diminishes.
Study limitation
Several limitations need to be mentioned before further discussing these results and policy implications. First, as noted earlier, only old age, survivors, and family categories in the OECD SOCX data were analysed since it was not possible to classify other categories of social spending by age. By using the LIS data, we could include a wide range of social spending under the assumption of a resource allocation among household members. However, the LIS data only include cash and near-cash benefits, so in-kind benefits were excluded from the analyses. Similarly, several components of social spending such as tax expenditures or the EITC were not considered in the analysis of the OECD SOCX dataset although it seems to be clear that these programs play a huge role in the United States. Our additional calculation included the EITC because it is one of the largest programs in the United States; however, other programs that possibly affect children or their families need to be included for more accurate results.
Last, the main purpose of this study is to show the age-orientation in social spending in the United States and other countries in a descriptive-level, and to draw policy implications from the findings. We did not examine other important topics such as: How is the age-orientation associated with differential well-being of the elderly and children? What are the main sources of different age-orientations across countries? These questions need to be addressed in the future study.
Policy implication for the United States
Taken together, findings of this study suggest that the United States needs to develop a more comprehensive social policy for children and their families. Balancing social spending between the elderly and children by raising public resources allocated to children can be justified by at least two reasons. First, children have human rights just as adults or elderly people, and their special needs should be met (Ringen, 1997). Considering children have little control over their circumstances under which they are brought up, society has a moral responsibility to enhance children’s capabilities, and child well-being is an indication of a society’s moral worth (England and Folbre, 1999; Ringen, 1997). Second, children are also a human capital, the most important resource for a society’s future; that is, young workers with high-level of human capital are crucial for the nation’s economic sustainability. Therefore, any efforts to enhance child well-being are today’s investment yielding future returns by producing a healthy and productive workforce (Blank, 1997).
Even though it is one of the central issues for most countries to properly nurture their children, international comparisons of child well-being show that US children fare worst among rich countries. UNICEF (2007) recently reported that the United States ranked low across most domains of child well-being such as material well-being, health, education, behaviors and risks, and subjective well-being. Overall, the United States ranked 20th of 21 countries.
The current situation of US children coupled with the elderly-oriented nature of social spending call for more investment in children through public policies and programs. The United States is one of the few countries that do not have explicit universal family policies for working parents and their children (Kamerman and Kahn, 2001; Ozawa, 2004). In contrast, many European countries spend more on families and their children through adopting a wide set of family policy such as universal child/family allowance, paid maternity/parental leave, and publicly funded child care.
A large body of research has shown that these policies are effective in dealing with the dilemma of enhancing both work incentive for parents and the well-being of their children. For example, Ozawa and Hong (2003) discussed the distributive effect of introducing a modest child allowances program in the United States. Other family policies such as paid maternity/parental leave and publicly funded child care have been proved to be effective in increasing economic status and well-being for both parents and children (Ferrarini, 2006; Gornick and Meyers, 2004; Ruhm, 2000; Tanaka, 2005). Therefore, such a comprehensive family policy suggested here could be built upon what the United States already has such as the EITC, TANF, Food Stamps and others.
Conclusion
With all limitations in our study, it is clear that the American system of social spending is tilted toward the elderly. This finding does not necessarily argue for that the United States should spend less on the elderly for the sake of children. The major question is that, if the United States increases the pie of total social spending from one of the lowest to a larger percentage of GDP, are we going to increase the size of public resources for children, or are we maintaining the current share of social spending? The findings from this study suggest that what the United States can do is to increase social spending allocated to children.
Important issues that need to be addressed include whether it is feasible to ensure balanced social spending by increasing the share for children and their families under the current social, economic, and political environment of the United States, and whether a European-style, comprehensive family policy is effective for the United States. We are not able to fully discuss these issues here, but we argue that the prospects for more spending on children and family policy expansion may be better than previously thought. As discussed earlier, considerable research has shown that US children fare worst among rich countries and US researchers and policy-makers have concerned about this situation in conjunction with unequal resource allocations among different age-groups. Social spending on children and their families can be conceived as investment for future development and there is a wide agreement that public intervention on early stages of the life is far more effective and it could substantially reduce future costs (OECD, 2009). Several researchers also argue that many American parents and policy makers are expressing support for more extensive family policies and a comprehensive family policy are far more fit to the United States than conventional wisdom often suggests (Gornick and Meyers, 2004; Kamerman, 1996).
It is a central issue in most contemporary societies to properly nurture their children and enhance children’s well-being since children have human rights just as adults or elderly people. More importantly, children are also a human capital, the most important resource for a society’s future. Therefore, our goal should be to ensure that the needs for both children and the elderly be met.
Footnotes
Funding
This research received no specific grant from any funding agency in the public, commercial, or not-for-profit sectors.