



Abstract
The purpose of this study is to assess the dynamics of multidimensional poverty and inequality among middle-aged and older adults. The findings demonstrate that most people may experience multidimensional poverty in old age. Social participation plays a crucial role in contributing to overall poverty. The most prominent factor of inequality among those in poverty is sex, and the greatest disparity in the multidimensional poverty across subgroups is education. This study offers empirical evidence on the old age poverty profile from a multidimensional perspective and helps to target disadvantaged groups and regions.
Introduction
Poverty no longer only specifically refers to a lack of economic resources; its complex definition challenges the interpretation of poverty and increases the difficulty of data collection and the elimination of poverty. Therefore, research on poverty in the West has undergone considerable transformation since the 1980s in terms of the theories, methodologies and policy practices introduced. The transition from focusing on unidimensional poverty to multidimensional poverty demonstrates that using only one factor to measure poverty, such as income or consumption expenditure, is ineffective for reflecting the complex concept of poverty (Chen et al., 2016). Compared with the traditional unidimensional concept of poverty, the assumption of a diverse and multidimensional perspective enables comprehensive interpretation of how poverty is experienced by real individuals and families as well as further reflects their well-being.
A multitude of studies worldwide have considered poverty from a multidimensional perspective, primarily through the use of non-monetary indicators to measure poverty, such as deprivation and social exclusion (Bossert et al., 2007; Jana et al., 2012; Saunders, 2008; Townsend, 1987). For example, the United Nations Development Programme (UNDP) used the global multidimensional poverty index to analyse the situation of multiple deprivations confronted by individuals or families living in poverty in terms of their health, education and quality of life (UNDP, 2019). The use of more than two measurement elements can more accurately reflect the reality of poverty, and measuring poverty from a multidimensional perspective enables the obtainment of results with high reliability and validity (Bradshaw and Finch, 2003).
In Taiwan, few empirical studies have been conducted on multidimensional poverty because of the limited amount of available data. Only a small number of studies have even used factors other than income, such as deprivation and social exclusion, to measure poverty and its influential factors (Lee, 2007; Leu et al., 2016). For example, Leu et al. (2016) analysed the relationship among consensuses on necessities, deprivation and social exclusion, as well as their influential factors, to explore the social disadvantages of families with children. However, poverty is characterized by diversity, and therefore requires integrated indicators to holistically characterize its multiple aspects. Chen et al. (2016) adopted the measurement method for multidimensional poverty to analyse poverty in cities, counties and local areas. They observed a discrepancy in the measurement results obtained from using diverse indicators and a single indicator of income. However, the representation of poverty in their study was still limited.
There has been far less research on the multidimensional perspective among older adults in Taiwan. In addition, the inequality among the population of people who experience multidimensional poverty could not be adequately portrayed, and the amount of longitudinal research data for analysing the dynamics of poverty has been lacking. According to Chen et al. (2016), the age groups of 50–59, 60–69 and ⩾ 70 years achieved the top three scores in the multidimensional poverty index. Those who were older confronted more serious problems of multidimensional poverty. Therefore, adopting a multidimensional perspective to analyse poverty in middle-aged and older adults is imperative. To understand multidimensional poverty among middle-aged and older adults, the Alkire–Foster (AF) counting methodology was adopted in this study to measure multidimensional poverty in Taiwan, and longitudinal data was used to measure the level and disparity of multidimensional poverty in middle-aged and older adults.
The primary research questions to be addressed in this article are as follows: (a) What does the poverty profile represent among middle-aged and older adults? (b) What has happened to inequality among middle-aged and older adults in poverty? (c) How do the poverty profile and disparity change over time? Finally, we also provide policy implications on multidimensional poverty in old age based on the findings.
Literature review
The theory and measurement method of multidimensional poverty were initially based on the definition of poverty proposed by Amartya Sen, a winner of the Nobel Prize in Economics. He introduced the capability approach into poverty analysis, asserting that individual poverty is not limited to a lack of income, but also includes the deprivation of basic capability (Sen, 1999). Basic capability refers to the ability to satisfy functionings up to a minimally adequate level. Individuals are considered deprived when their capabilities are lower than the minimally adequate level (Sen, 1993). Sen believed that development is a process through which humans expand their real freedom. Real freedom is not only the means but also the goal of development. Capabilities are combinations of functionings. Basic functioning includes the aspects of excellent nutrition and health as well as the prevention of premature death; complex functioning involves the aspects of dignity and community involvement (Sen, 1993, 1999). Because capabilities are the real freedoms with which individuals achieve well-being, a capability set represents the freedom of an individual to select from combinations of functionings. Therefore, rich people and poor people possess different capability sets. The nutrition intake of a rich person who is on a diet and a poor person who lives in hunger may be similar, but the rich person can decide whether to diet and has control over the nutritional value and amount of food they consume. Conversely, the poor person is not presented with this opportunity to decide (Sen, 1999). In other words, rich people can achieve a certain functioning when they make decisions and are not considered to be poor, regardless of what they choose.
Sen’s capability approach rejects the traditional definition of poverty that is based on income or consumption expenditure, and this rejection constitutes the basis of developing the theory of multidimensional poverty. The University of Oxford established the Oxford Poverty and Human Development Initiative in 2007, of which Sabina Alkire serves as director. On the basis of Sen’s capability approach, Alkire and her colleagues were dedicated to developing measurement methods and tools for multidimensional poverty (Oxford Department of International Development, 2017). Thus, the AF methodology has gradually become a measurement approach that is commonly used by international organizations and researchers. The human development index, human poverty index and multidimensional poverty index used by the UNDP are also measurement and monitoring tools for multidimensional poverty (UNDP, 1997, 2019).
Because income and consumption expenditure do not reflect the nature of poverty, an increasing number of studies have used non-monetary indicators to measure poverty, such as capability, deprivation and social exclusion (e.g. Nolan and Whelan, 2010; Saunders, 2008; Townsend, 1987). The researchers of these studies have also analysed the relationship between poverty and deprivation, revealing that definitions of poverty according to income and according to deprivation characterize two different groups of people (Gordon, 2006; Nolan and Whelan, 1996; Whelan et al., 2004). Using a survey conducted by the Economic and Social Research Institute of Ireland in 1987, Nolan and Whelan (1996) determined that poverty can be more accurately defined using both income and deprivation indicators than by using the income indicator alone. They noted that approximately half of all households were below the income poverty threshold and experienced deprivation, but that many households that were above the income poverty threshold were also deprived. Some studies have employed more than two indicators to analyse the differences among populations of people considered to be in poverty (Bradshaw and Finch, 2003; Saunders, 2011; Saunders et al., 2014). Notably, Saunders (2011) analysed the difference between three socially disadvantaged groups in terms of income poverty, deprivation, social exclusion and influential factors.
The aforementioned studies indicated that poverty is multidimensional and cannot be clearly portrayed using a simple income or consumption-expenditure indicator. However, although researchers have attempted to use non-monetary indicators to understand poverty, an overall indicator for representing multidimensional poverty has yet to be proposed. Therefore, numerous studies have adopted multidimensional measurement methods to analyse poverty and have primarily targeted developing and least developed countries. Commonly adopted indicators include quality of life, education and health (Alkire and Santos, 2014; Batana, 2013; Mitra et al., 2013; Qi and Wu, 2015; Yu, 2013). Seth and Alkire (2014a, 2014b) developed measures for inequality in multidimensional poverty and analysed the disparity in poverty across population subgroups as well as the deterioration of deprivation.
A small number of studies worldwide have adopted a multidimensional perspective to analyse poverty in older adults. For example, deprivation was used as the measurement indicator for assessing the deprivation and experience of older adults (Olivera and Tournier, 2016). The relationship between income poverty and material deprivation were also compared (Bartlett et al., 2013; Hick, 2013; Kotecha et al., 2013). Through an analysis of indicators of deprivation in older adults, McKay (2008) identified suitable indicators to improve the measurement of material deprivation among older adults.
Examining poverty from a multidimensional perspective can increase the complexity of measurements (Van Praag and Ferrer-i-Carbonell, 2008). Operationalization is affected by the selected theories and methods, and the selection of theories and methods is related to data collection, measurement dimensions, indicators and the assessment of weights (Dewilde, 2004). However no consensus has been reached regarding which method is the most effective for measuring multidimensional poverty. Currently, the methods for measuring multidimensional poverty include the dominance approach, statistical approaches, the fuzzy sets approach and the axiomatic approach (Alkire and Foster, 2007, 2011a). The AF methodology based on the axiomatic approach was adopted in this study.
The axiomatic approach emphasizes the axiomatic characteristic of poverty measurement. Specifically, multidimensional poverty measures must satisfy axiomatic requirements for representing the characteristics of poverty indices and serve as the criteria for evaluating poverty indices. The axiomatic requirements for multidimensional poverty measurement are stricter than those for unidimensional poverty indices (Alkire et al., 2015a). Ideally, the measurement method should be selected according to the axiom. The axiomatic approach retains the steps of poverty identification and aggregation, and applies joint distribution to these two steps. Moreover, the axiomatic approach is flexible and can satisfy various types of data (including discrete and continuous data). Therefore, policy-makers and researchers can select measurement methods in accordance with the relevant axiomatic principle (e.g. weak monotonicity) and data characteristics (Alkire et al., 2015a, 2015c). However, data collection has some limitations. All variables should be obtained from the same source and based on the same observation unit (e.g. individuals or households). In addition, the samples and variables of the different databases must also be the same when the databases are combined (Alkire and Foster, 2011b). This ensures that the multidimensional poverty indices reflect the combination of multiple deprivations among various groups living in poverty, and policy-makers can provide distinct welfare services for different groups according to their deprivation situations.
The advantage of the AF methodology is that its poverty identification function is relatively flexible and satisfies most of the axioms of multidimensional poverty measurement. In other words, the AF methodology is characterized by the functions of poverty identification, decomposition and aggregation (Alkire and Foster, 2009). Because the AF methodology uses a clear and specific axiomatic system, when the same indicators are adopted for measuring multidimensional and unidimensional poverty, the measurement results can be compared with the results obtained using the Foster–Greer–Thorbecke (FGT) indices, which are conventionally used to measure unidimensional poverty. In terms of policy application, the AF methodology is easy to understand and apply, and the poverty dimensions and indicators reflect the priorities of public policies. Through the deconstruction of poverty characteristics and elements, the contributions of various population groups and indicators to multidimensional poverty are measured, and the results can be used as a reference for examining the effectiveness of poverty monitoring and reduction policies (Salazar et al., 2013). Accordingly, the axiomatic approach is relatively persuasive in theories, empirical research and policy implementation.
Methods
Data
The data used in this study were obtained from the Taiwan Longitudinal Study on Ageing (TLSA) conducted by the Health Promotion Administration, Ministry of Health and Welfare (Health Promotion Administration, 2014, 2015). The longitudinal survey was initiated in 1989, and eight waves have been conducted. The last waves of the database (2007 and 2011) have also been available. However, only two waves (1999 and 2003) were analysed in the study because (a) not all questions used in the study were asked in each wave and (b) the key variables were not released in 2007 and 2011, and therefore we could not link data.
The TLSA with three-stage stratified sampling designs was a representative national survey. The aim of the survey was to collect information related to the health and living status of middle-aged and older adults, such as health status, household information, living arrangements, social support, leisure activities and economic status. The sample size was 3163. All respondents who participated in the 1999 survey were also required to participate in the 2003 survey. The ages ranged from 57 to 101 years.
Analysis
This study focused on multidimensional poverty measurement and inequality among middle-aged and older adults in Taiwan and thus applied two analytical methods. First, the well-known AF methodology proposed by Alkire and Foster (2011a) was utilized to capture multidimensional poverty among the middle-aged and older adults. The AF methodology satisfies numerous axiomatic properties, which is helpful for poverty identification, aggregation and decomposition (Alkire and Foster, 2007; Alkire et al., 2015c). The identification approach, namely the dual-cut-off approach, refers to two steps: deprivation cut-off and poverty cut-off. Deprivation cut-off determines whether a person is deprived in each deprivation dimension. Each person then obtains a weighted deprivation score that reflects the breadth of deprivation. Poverty cut-off identifies who qualifies for multidimensional poverty by setting a poverty threshold, denoted by k. No normative principles are in place for the selection of the k value. A suitable method for selecting a proper k value is testing the robustness of poverty comparisons across all k values (Alkire and Foster, 2011a; Salazar et al., 2013). In the aggregation approach, we use an aggregate poverty index based on the FGT class of measures to construct a multidimensional poverty profile. This study involved the calculation of three multidimensional poverty measures: incidence of multidimensional poverty (H), intensity of multidimensional poverty (A), and the multidimensional poverty index (MPI). H, also referred to as the headcount ratio, is the proportion of poor people. A represents the average deprivation scores among those in poverty. The MPI referred to as the adjusted headcount ratio is defined and represented as

where q is the number of people in poverty determined using the dual-cut-off approach and n is the total population.
A represents the average deprivation scores among those in poverty, and is defined as

where
MPI is referred to as the adjusted headcount ratio. H violates the monotonicity axiom. The level of poverty does not change in accordance with the increase in the number of people who experience deprivation; therefore, in addition to H, A was also considered. MPI is defined as

In terms of poverty decomposition, the AF measures satisfy the property of dimensional breakdown and population subgroup decomposability, which is helpful for policy analysis (Alkire et al., 2015d). The dimensional breakdown of property enables us to calculate the contribution of each dimension in the MPI. Similarly, population subgroup decomposability enables an understanding of the contribution of each subgroup to the overall MPI (Alkire et al., 2015c).
Another method based on AF methodology was developed by Seth and Alkire (2014a, 2014b) to analyse multidimensional poverty inequality and thereby assess inequality among the poor and poverty disparity across population subgroups. Inequality measures also help to determine whether deprivation among the poor deteriorates. Two inequality measures were applied in this study: inequality among the poor and MPI disparity. The inequality among the poor, denoted by

where
The disparity in MPI

Deprivation dimensions and indicators
Table 1 lists 5 deprivation dimensions and 11 indicators. Each dimension was equally weighted, and the sum of the weights was one. The five dimensions were as follows: health, ability, medical care, social participation and economic security. The health dimension comprised self-rated health, health risk and health behaviour. First, the respondents were considered deprived if they self-rated their health as poor or very poor. The cut-off for being considered deprived in terms of health risk was possessing one or more of the following habits: smoking, drinking and chewing betel nut. Regarding health behaviour, not exercising regularly was the deprivation cut-off.
Dimensions, indicators and deprivation cut-off and weight.

IADLs: instrumental activities of daily living; ADLs: activities of daily living.
We used basic activities of daily living (ADLs) and instrumental activities of daily living (IADLs) as ability indicators. ADLs were measured as fundamental functioning to determine whether the individual performed basic activities independently in daily life (Katz et al., 1963). IADLs related to personal independence emphasized the ability to live at home and in the community independently without assistance from others (see Lawton and Brody, 1969). In this study, ADLs included six items: bathing, dressing, eating, mobility, walking and using the restroom. Six items were assessed using more complex activities: shopping, handling finances, transportation, heavy cleaning, housekeeping and using the telephone. The respondents were considered to experience deprivation if they had difficulty performing at least one of the six ADLs or IADLs.
Medical care consisted of two indicators: health management and access to medical care. The government provides free health examination once every 3 years to people aged 40–64 years and once per year for people aged 65 years and older (Health Promotion Administration, 2017). The survey asked participants whether they had undergone a health examination in the past 3 years, and those who responded that they had not were considered to experience deprivation regarding health management. Access to medical care referred to the convenience of seeking medical care. Respondents with no access to medical care were identified as deprived.
Social participation refers to voluntary service and social activity. Respondents were considered to be deprived if they were not currently participating in volunteer activities and had no access to medical care. Finally, economic security was measured according to economic well-being and living expenses. Economic well-being was defined using a five-point scale: very satisfied, satisfied, average, not satisfied and very dissatisfied. Middle-aged and older adults were considered deprived in economic well-being if their rating was not satisfied or very dissatisfied, and respondents who were unable to meet their monthly living expenses were also considered deprived.
Population subgroups
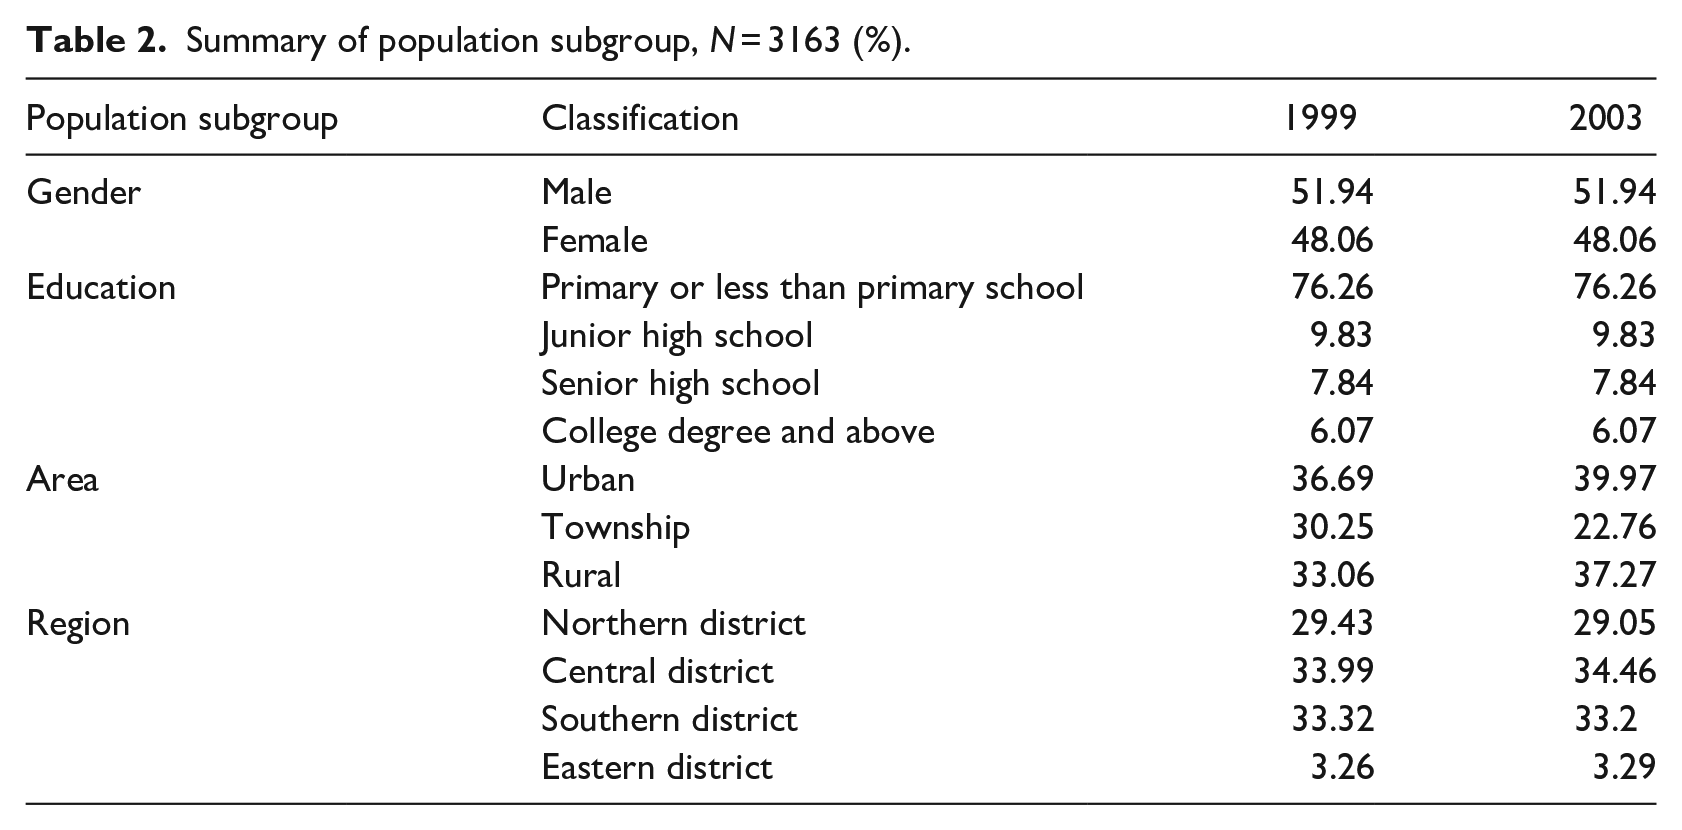
Four population subgroups (sex, education, area and region) were used to examine the contribution of each dimension to the MPI. Table 2 presents the classifications and a summary of descriptions for all population subgroups. Regarding sex, a greater percentage of respondents were men (51.94%) than women (48.06%). Education was classified into four groups: up to and including primary school, junior high school, senior high school and college degree or higher. Most respondents had lower education levels. Areas included urban, township and rural. Minor differences were observed regarding the proportion of respondents living in these three areas. The highest percentage of respondents (36.69% and 39.97%) lived in urban areas in 1999 and 2003, respectively. The percentage of respondents living in urban and rural areas has increased, but that of respondents living in townships has declined. Finally, region was divided into the northern, central, southern and eastern districts. With the exception of the eastern district, differences between 1999 and 2003 regarding the ratios of respondents across regions were subtle. Most respondents lived in the central district (33.99% and 34.46%), followed by the southern district (33.32% and 33.2%). Less than 5 percent lived in the eastern district, which was considered the remote district.
Summary of population subgroup, N = 3163 (%).
Results
Results of the multidimensional poverty measures
Table 3 and Figure 1 present the results of the multidimensional poverty analysis at various levels of poverty cut-offs (k values). As expected, the MPI and H decreased with increased k values, whereas A increased with increased poverty cut-off. A slight increase in the three multidimensional poverty measures were observed among middle-aged and older adults between 1999 and 2003, indicating that multidimensional poverty has been worsening over time. In terms of MPI, a statistically significant increase was noted for all k values at least at the 1 percent level.
Change in multidimensional poverty measures for different k values, 1999–2003.
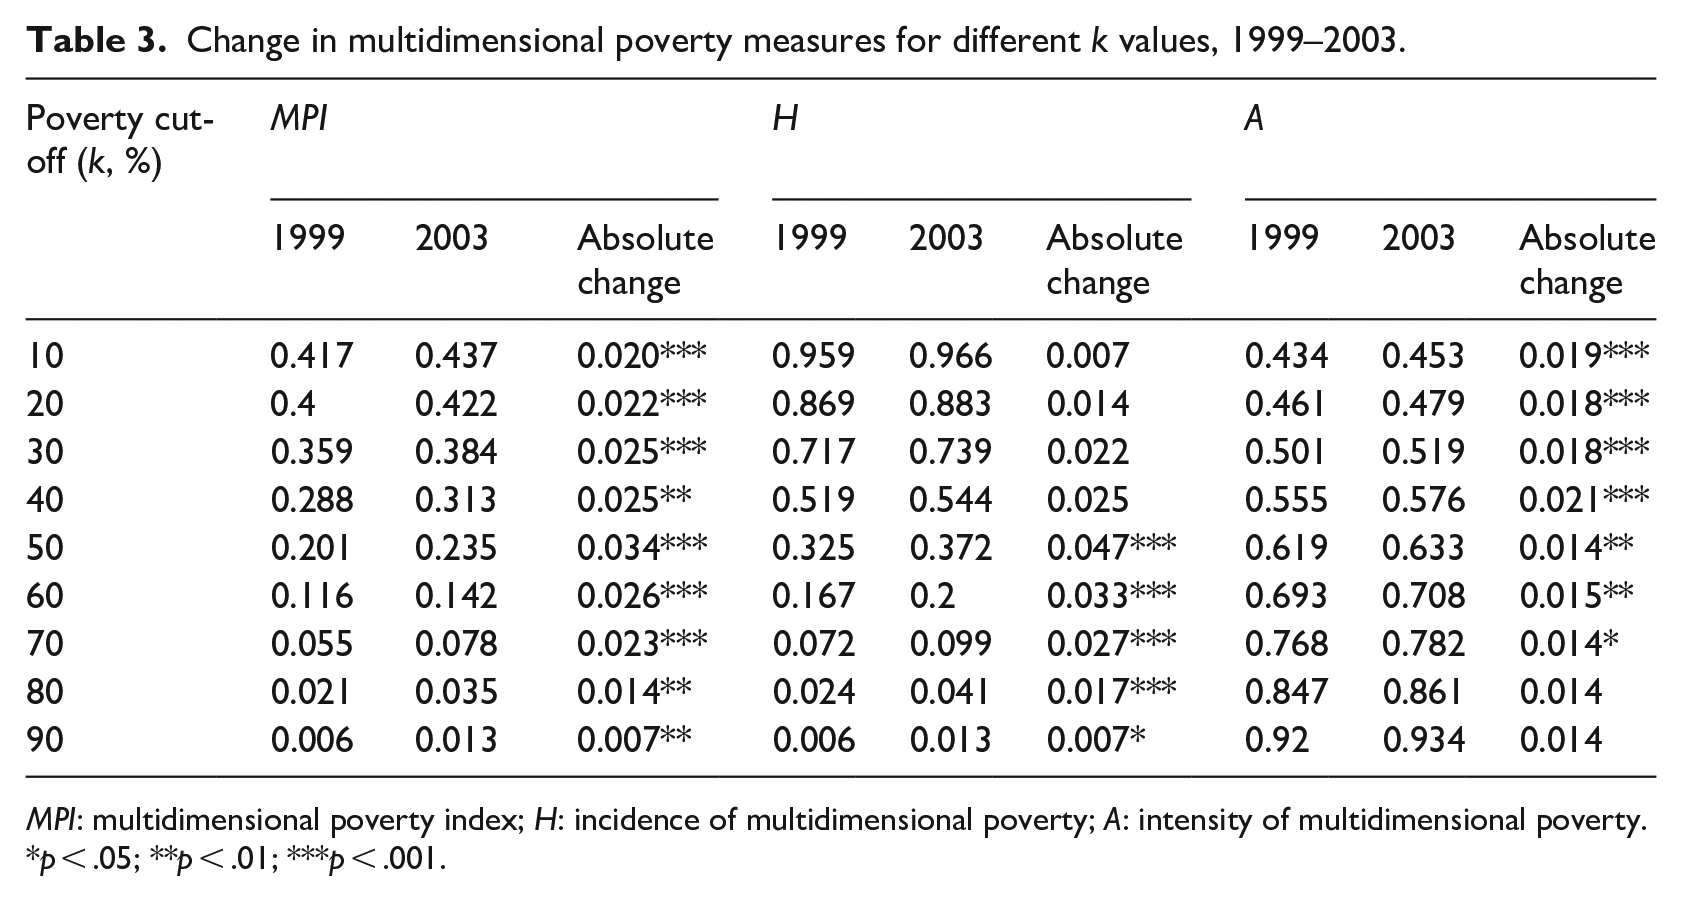
MPI: multidimensional poverty index; H: incidence of multidimensional poverty; A: intensity of multidimensional poverty.
p < .05;
p < .01;
p < .001.

Robustness checks of different k values in change in multidimensional poverty, 1999–2003.
A robustness analysis was performed to determine whether poverty comparisons in 1999 and 2003 were robust regarding the selection of the poverty cut-off. Figure 1 presents robustness assessments of different k values over time for MPI, H and A. The estimated levels of MPI, H and A in 2003 were always higher than those of the three measures in 1999, indicating that multidimensional poverty comparisons are robust to various poverty cut-offs. In addition, we calculated the Spearman’s rank correlation coefficient and Kendall’s rank correlation coefficient to examine the robustness of poverty rankings for MPI in 1999 and 2003 across different cut-offs (Alkire et al., 2015b). We discovered that all of the Spearman and Kendall’s rank correlation coefficients in both 1999 and 2003 were statistically significant at the 1 percent level and exceeded 0.8 between k = 10 percent and k = 40 percent, suggesting that the poverty rankings were relatively robust to poverty cut-offs for the interval from 10 percent to 40 percent. In particular, two Spearman’s rank correlations between k = 20 percent and k = 30 percent (0.970 and 0.986) and k = 10 percent and k = 30 percent (0.969 and 0.986) were high in 1999 and 2003, respectively. The Kendall’s rank coefficients were also large between k = 20 percent and k = 30 percent (0.90 and 0.92) in 1999 and 2003. As a result, 30 percent is an appropriate poverty cut-off for identifying people who experience at least one-third of the weighted indicators for multidimensional poverty.
When k = 30 percent, we observed statistically significant differences in MPI and A between the 2 years. The proportion of older people who were deprived in terms of multidimensional poverty increased from 35.9 percent in 1999 to 38.4 percent in 2003, exhibiting an increase of 2.5 percent. Similarly, over the course of 4 years, H and A increased by 2.2 percent and 1.8 percent, respectively. These results reveal that multidimensional poverty among middle-aged and older adults has worsened over this period.
We further analysed the multidimensional poverty trajectory between 1999 and 2003. These results are summarized in Figure 2. Middle-aged and older adults who have never experienced multidimensional poverty comprise 15.08 percent, indicating that more than 80 percent of respondents had experienced poverty at least once during this period. Only approximately 13 percent of respondents had overcome multidimensional poverty, but approximately 14 percent newly experienced multidimensional poverty and approximately 59 percent experienced persistent poverty.
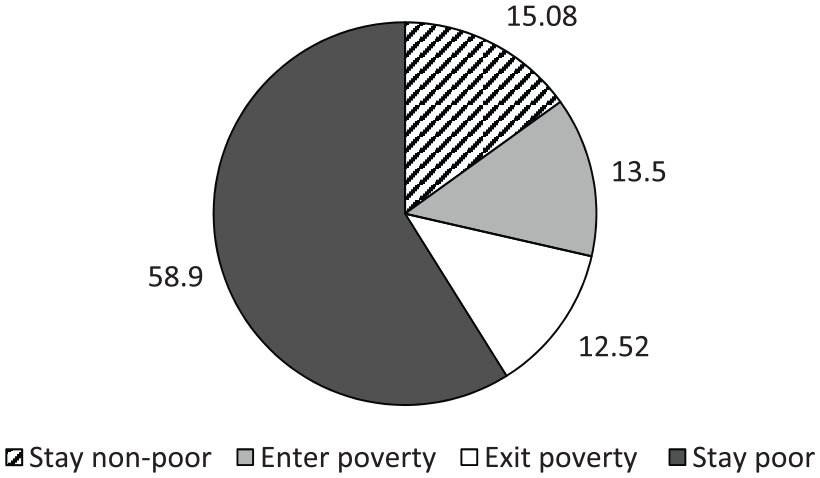
Multidimensional poverty trajectory, 1999–2003 (in %).
Results of the multidimensional poverty measures by subgroup
The results are summarized in Table 4. First, we estimated the MPI, H and A of the five population subgroups for sex, education, area and region. The adjusted headcount ratios for respondents who were women, less educated, living in rural areas and living in the eastern district were relatively high. A similar pattern was observed for the estimates of H and A.
Change in MPI, H and A by subgroup, 1999–2003 (k = 30%).

MPI: multidimensional poverty index; H: incidence of multidimensional poverty; A: intensity of multidimensional poverty.
p < .05;
p < .01;
p < .001.
Table 4 also compares the absolute change of multidimensional poverty measures by subgroup. The subgroup living in rural areas demonstrated absolute reductions in MPI and H; the group living in the southern district had absolute reductions in H, but without statistical significance. The proportion of other subgroups that were identified as multidimensional poor increased during the two time points for MPI and H, indicating a continual deterioration in multidimensional poverty among these subgroups. Middle-aged and older people who were men, had senior high school-level education and lived in urban areas had the largest and most statistically significant absolute rise in MPI poverty. Moreover, the H for men, people living in urban areas and those living in the northern district demonstrated an influence over changes in MPI. Conversely, the A for women, people with an education level of up to and including primary school, and those living in the eastern district demonstrated a profound effect on the variation in MPI.
Decompositions of multidimensional poverty measures by subgroup
We used dimensional breakdown properties to further examine how different subgroups had different dimensional contributions over time (see Table 5). Overall, the contributions of health, medical care and economic security decreased, whereas those of ability and social participation increased. In particular, the most significant variation was in the deprivation of ability, which exhibited a national increase from 9.3 percent in 1999 to 14.3 percent in 2003. Moreover, the most substantial contributions of social participation to overall poverty were 30.9 percent and 31.5 percent in 1999 and 2003, respectively, followed by deprivation in economic security.
Dimension contributions to MPI by subgroup, 1999–2003 (k = 30%).
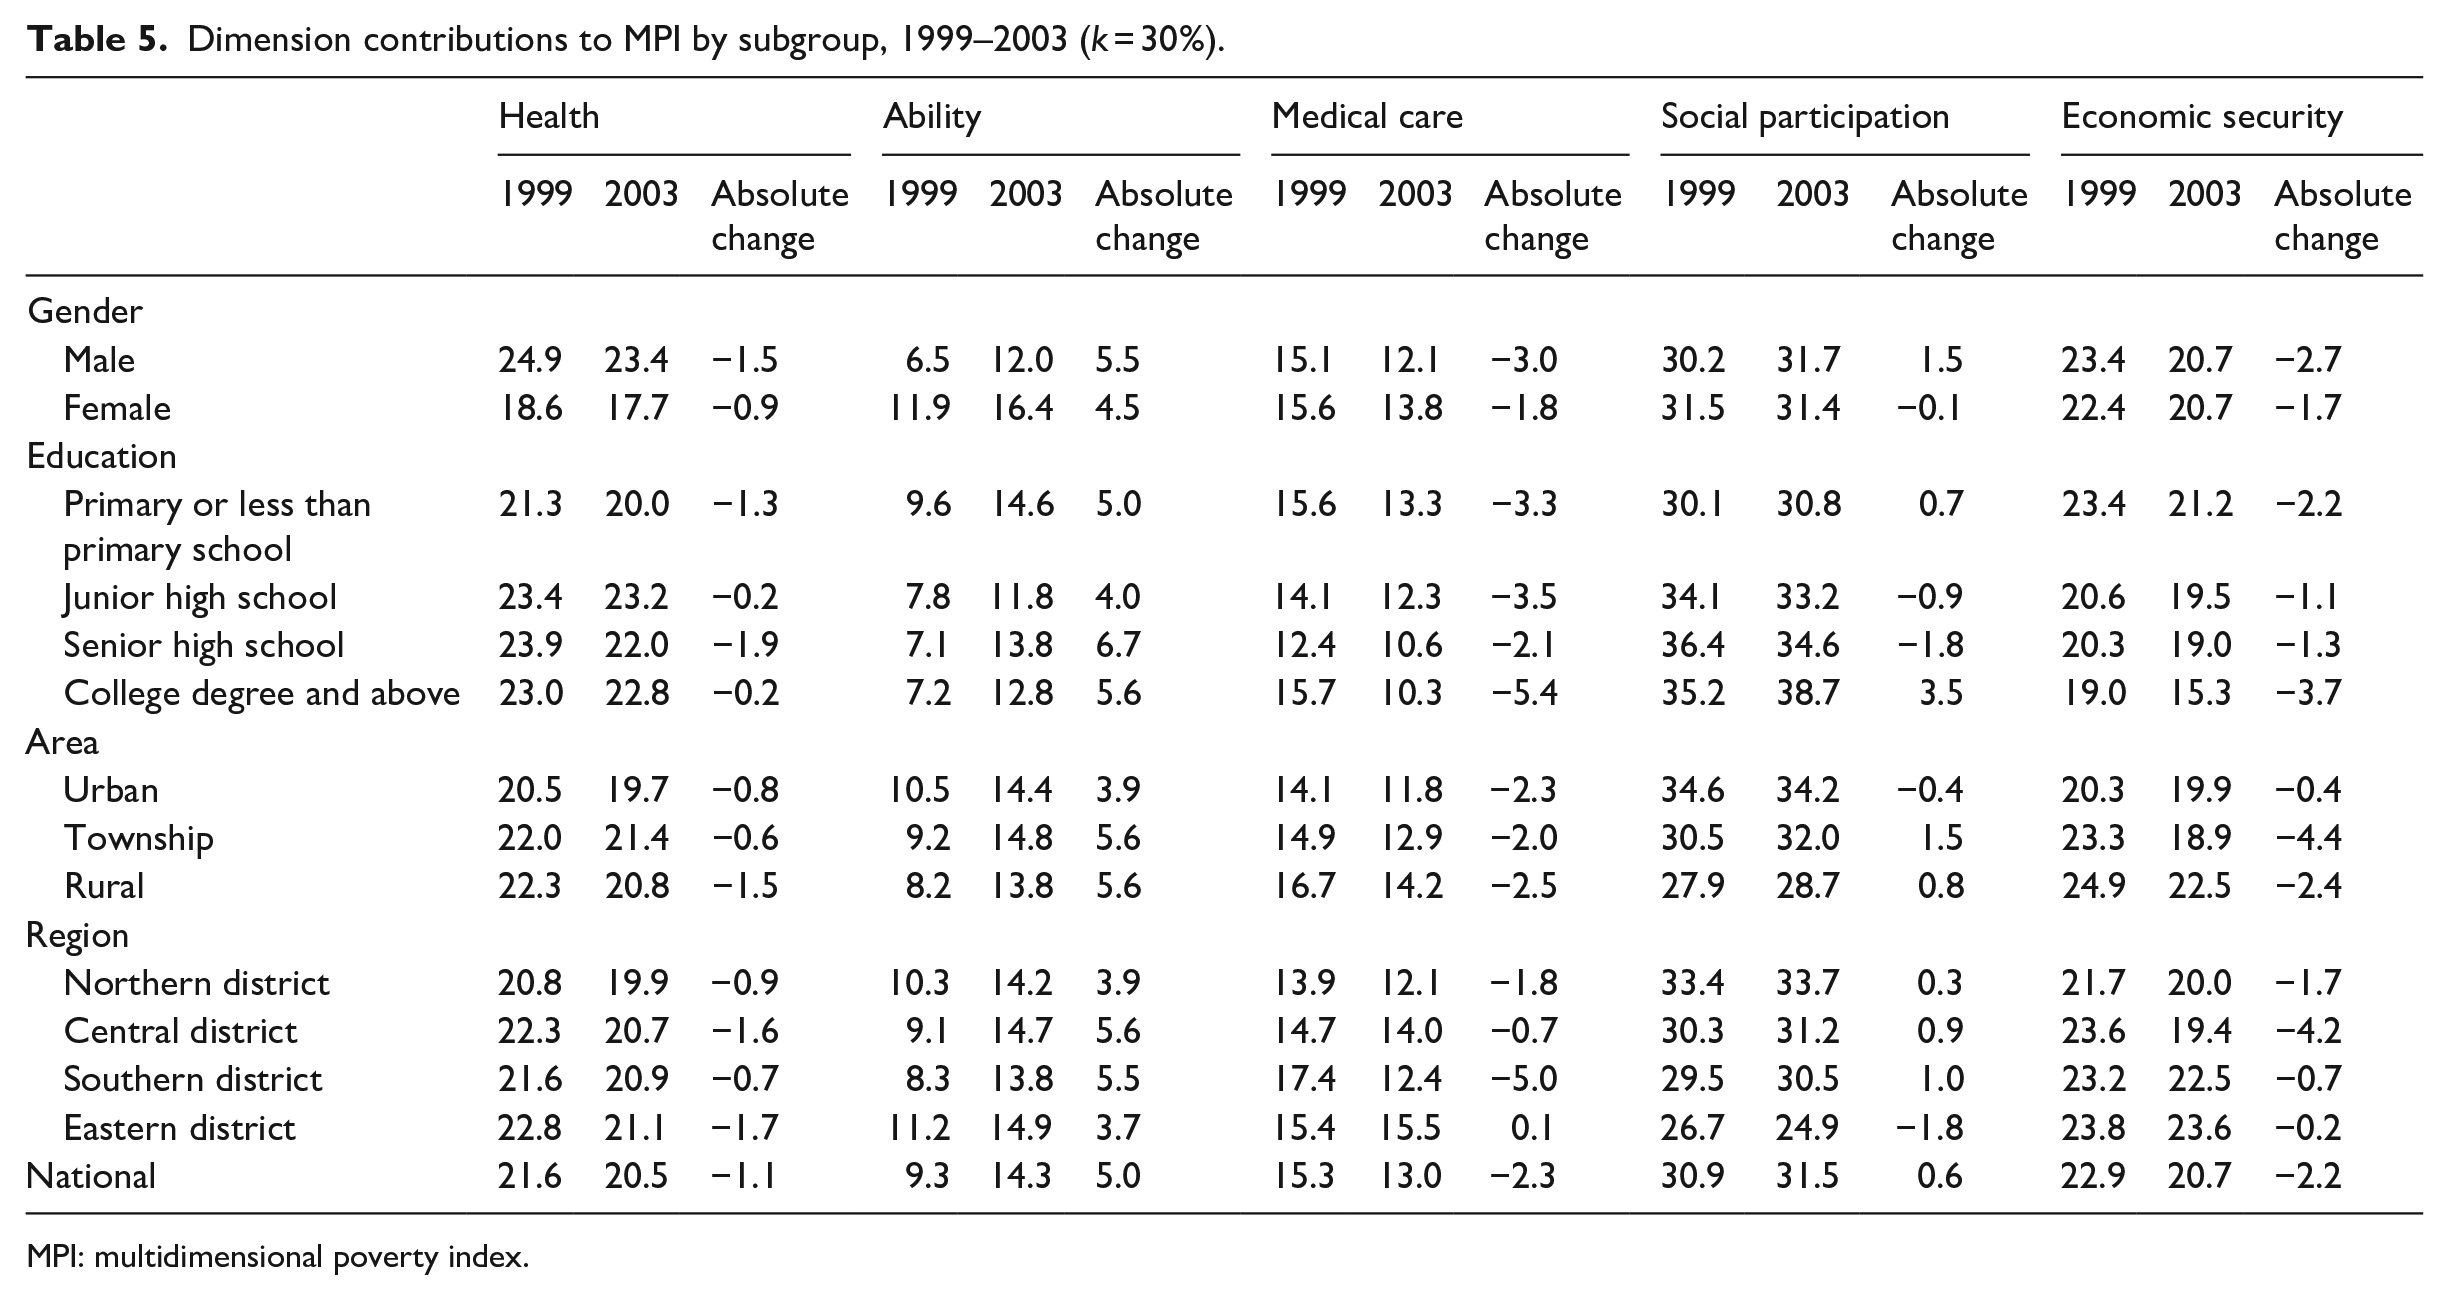
MPI: multidimensional poverty index.
In terms of the change in the contribution of each dimension by subgroup, deprivation ability exhibited the greatest increase across all subgroups in the given period. Regarding sex, the major contributions came from social participation, followed by health among male middle-aged and older adults. Social participation was also ranked first in the poverty composition of female middle-aged and older adults, followed by economic security.
The contributions to overall poverty among middle-aged and older people with an education level of junior high school or higher were similar, which indicated that the two most significant contributions were social participation and health. For those with an education level up to and including primary school, economic security also played a crucial role in poverty compositions. Similar to results at the national level, respondents at all levels of education demonstrated the largest increase in ability and largest reduction in medical care.
Social participation similarly made a significant contribution to multidimensional poverty across different areas and regions. Furthermore, ability and medical care prompted this change. Regarding the contributions by area, economic security was expected to contribute more to poverty in rural areas than in the other two areas. Regarding region, little difference was observed among the four districts.
Multidimensional poverty inequality
Table 6 presents inequality among people in poverty and the disparity across subgroups. Inequality among those in poverty, which was used to analyse the intensity of poverty across the subgroups, reflects the total intragroup inequality and intergroup inequality. We discovered that the highest level of inequality among those in poverty both in 1999 and 2003 was in terms of sex (0.0655 and 0.0747). The overall inequality demonstrated a statistically significant increase across all subgroups, with the largest increase in inequality among people in poverty being in terms of education (0.0104), with the variation primarily originating from the total intragroup inequality. The greatest inequality in 1999 and 2003 was in education level and sex, respectively. Moreover, both the total intragroup and intergroup inequality for all subgroups increased during this period.
Change in inequality among people in poverty, 1999–2003 (k = 30%).
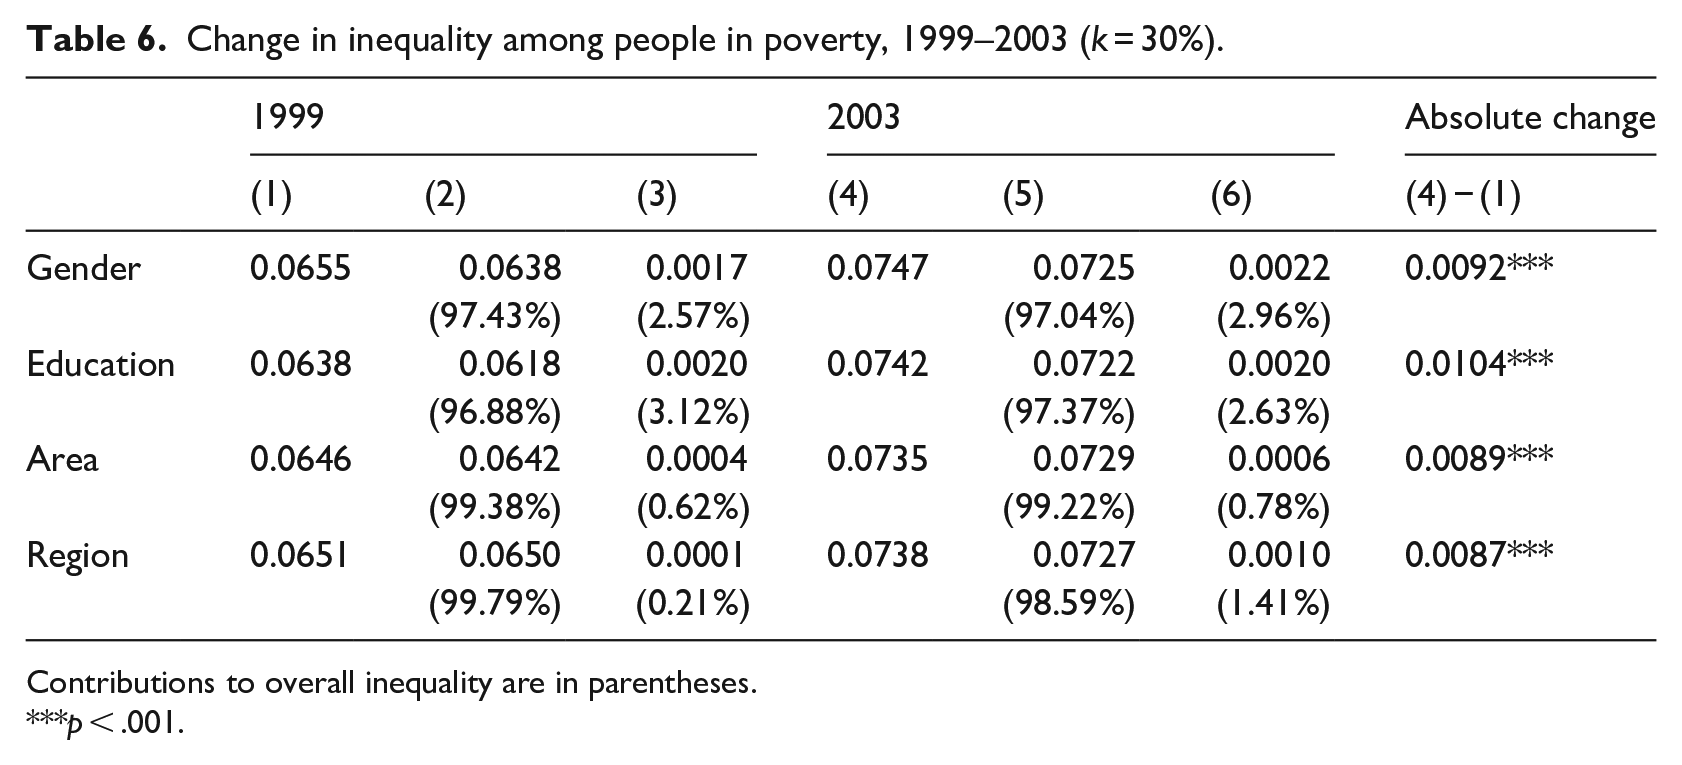
Contributions to overall inequality are in parentheses.
p < .001.
The disparity across subgroups comprises two parts: total intragroup multiplied by population share of people in poverty and the inequality among the MPIs of subgroups. Table 7 indicates that overall, the MPI disparity across subgroups demonstrated a statistically significant increase, and the greatest reduction in the disparity across regional groups was a decrease of 0.0103. In particular, the MPI disparity contributed substantially to the absolute change across regional groups. Education exhibited the highest level of inequality between the 2 years, but also the lowest reduction. Furthermore, the total intragroup inequality increased, but the disparity among the MPIs of subgroups decreased, with the exception of region. The greatest total intragroup inequality was observed for sex, which increased from 0.047 to 0.0552. Education had the greatest MPI disparity, which decreased from 0.0205 to 0.0131.
Changes in MPI disparity, 1999–2003 (k = 30%).

MPI: multidimensional poverty index. Contributions to overall inequality are in parentheses.
p < .001.
Conclusion
This study applied the AF methodology and the concept of multidimensional poverty inequality to present the multidimensional poverty profile of middle-aged and older adults in Taiwan. The primary findings are summarized as follows. First, people may be at greater risk for multidimensional poverty in old age. Approximately 40 percent of middle-aged and older adults were discovered to be in multidimensional poverty in 1999 and 2003. According to the results of the multidimensional poverty trajectory, 85 percent of middle-aged and older adults experienced poverty once. In particular, approximately 60 percent of middle-aged and older adults were in persistent poverty. The results revealed that most middle-aged and older people may have at least one form of disadvantage and suffer multiple forms of deprivation.
Furthermore, dimensional decomposition was conducted to estimate the relative contribution of overall poverty. This illustrated the contribution of deprivation dimensions to poverty and changes in their contributions over time. Social participation was an influential contributor to overall poverty, followed by economic security in both years. However, the greatest increase in contribution was observed for the ability dimension. As mentioned, the relative changes in deprivation rates for IADLs and ADLs were considerable, indicating a rapid deterioration in the ability to perform the basic and instrumental ADLs. People face an increased number of difficulties regarding self-care and the ability to maintain independence in old age.
Finally, inequality measures have helped to examine how inequality among people in poverty and the disparity across subgroups change over time. Overall inequality has been increasing over time. The inequality among people in poverty with respect to sex was greatest in 1999 and 2003, but the increase in inequality with respect to education was substantial between the 2 years. Conversely, the inequalities in MPIs across educational groups were substantial in both years. A considerable variation in MPI was discovered in terms of regional inequality.
This study provides policy implications for older people in poverty based on these findings. First, the results for multidimensional poverty in this study are similar to those of income-based studies. Women, people with relatively low education levels, and those who live in remote areas face a higher risk of disadvantage (Chen and Wang, 2015; Hoynes et al., 2006; Hsueh, 2002; Wang and Ho, 2006). However, similar results reflect different solutions to poverty. According to Sen (1999), income poverty is defined as insufficient access to economic resources. Deprivation refers not only to a lack of income but also to the deprivation of basic capabilities. Therefore, the approach of multidimensional poverty accurately reflects the poverty experienced by older adults. Developing strategies to alleviate poverty from a multidimensional perspective is crucial and can help in terms of policy prioritization and the allocation of limited resources (Chen et al., 2016).
Moreover, social participation is the first priority for reducing the number of people living in poverty. We used voluntary services and social activity to measure social participation. In this study, less than 20 percent of middle-aged and older adults participated in voluntary services or social activities. Several studies have indicated that low participation in voluntary organizations or community, religious or leisure activities has negative effects on physical and mental health, quality of life, and well-being (Borgonovi, 2008; Ferlander, 2007; Gilbert and Abdullah, 2004; Hoverd and Sibley, 2013; Lloyd and Auld, 2002; Thoits and Hewitt, 2001). Similarly, social participation is positively associated with psychological well-being, self-reported health and social community in Taiwan (Hsieh, 2014; Lee, 2013; Lin et al., 2013). Hence, policy-making must focus on encouraging social participation among older adults.
This study also reported a substantial variation in contribution over time for ability deprivation. As mentioned, we also observed a rapid decline in IADLs and ADLs. According to the Ministry of Health and Welfare (2016), the projected prevalence of functional disability in people aged 65 years and older was approximately 16 percent for 2018. From 2018 to 2041, the number of people aged 65 years and older with disabilities will increase by approximately 151 percent, from 0.55 million to 1.38 million. The increased prevalence of disability poses a societal challenge. Effective prevention strategies are required to promote healthy ageing in Taiwan.
Regarding multidimensional inequality, policy interventions still depend on policy prioritization. In focusing on the inequality of poverty intensity, policy-makers must reduce the inequality between the sexes; as such, they may grant priority to education inequality in consideration of the distribution of overall multidimensional poverty.
The findings of this study are restricted to the available data and therefore could not reflect poverty among middle-aged and older adults. Future research should therefore include follow-up work designed to measure multidimensional poverty after such data have been released. A dynamic analysis is also required to monitor the poverty situation and deprivation to enhance policy effectiveness. However, because of the adoption of a multidimensional approach in this study, the findings may contribute to a more comprehensive understanding of poverty among middle-aged and older adults. This study also fills a knowledge gap in the poverty research in Taiwan.
Footnotes
Declaration of conflicting interests
The author(s) declared no potential conflicts of interest with respect to the research, authorship, and/or publication of this article.
Funding
The author(s) disclosed receipt of the following financial support for the research, authorship and/or publication of this article: This work was supported by the Ministry of Science and Technology in Taiwan (Grant No. MOST 107-2410-H-020-001).
