
Abstract
This paper is a study of the visual characteristics of the medieval manuscript diagrams found in Theodosios’ Spherics. It provides a new taxonomy of eight types of diagrams found in the manuscript sources, and examines the way in which geometric information is encoded in the manuscript diagrams using a number of visual encodings. It then argues that these diagrams can be used to address ongoing research debates about whether the striking visual characteristics of medieval diagrams in mathematical texts are the result of deliberate choices by the premodern authors, the result of accidents of transmission, or both. Along the way, the paper identifies a further type of transmission error that is prevalent in the medieval transmission of mathematical diagrams.
Introduction
In examining the manuscript diagrams we might be primarily interested in trying to discern Theodosios’ authorial intention in producing them, or the reception of these diagrams by a medieval readership. 1 In fact, because of the many errors that have accrued in the transmission of the diagrams, and because of the differences in the various visual cultures through which they were transmitted, it is likely that we will never have a perfectly clear picture of Theodosios’ intention. Furthermore, Theodosios himself probably produced his diagrams under various constraints of the texts and practices available at that time, so that the notion of authorial intention would have been rather different for him than it is for us. Because both the text and its diagrams were based, in now unknown ways, on previous sources, and were altered in various ways throughout their transmission, we must take them both as historically constituted objects. Any individual feature of each might be an accident of the transmission, so we need to look for overall patterns. By reviewing all the diagrams of the Spherics, I believe I am able to add to work that has already been done by scholars such as O. Neugebauer, M. Malpangotto, and G. Le Meur on elucidating the graphical codes that are at work in Theodosios’ figures, as well as expand on the types of transmission errors to which ancient and medieval geometric diagrams were prone, as studied by D. Raynaud, F. Acerbi, and C. Carman, among others. 2
Our source for the diagrams of Theodosios’ Spherics are medieval manuscripts, of which the earliest is Vat.gr. 204, a ninth-century parchment manuscript held at the Bibliotheca Apostolica Vaticana and available for online viewing in color images. J.L. Heiberg discusses many issues with these diagrams in his critical edition of the text, and C. Czinczenheim provided a critical apparatus for the diagrams. 3 The reproduced diagrams in this paper only capture certain aspects of what we see in the manuscript—they are black and white vector images, so they do not reproduce color, line type or thickness, label shape, and so on. Although the geometrical elements of the images are to scale internally, the overall diagrams are not to scale with one another. The label sizes are also not to scale. I do not believe that any of these non-reproduced visual features of the diagrams have much bearing on their mathematical meaning.
This paper is the first of two papers on this subject matter. In this paper, I discuss the manuscript evidence for the diagrams in Theodosios Spherics, and in the following paper, I develop my ideas about the ways in which the text and the diagrams interact in the mathematical arguments set out in the treatise.
The current paper develops a taxonomy of the diagrams and discusses the various special characteristics of the diagrams of ancient and medieval texts on spherics. It treats various aspects of the errors and complications of specific diagrams. Although these may appear to be exceptional situations, they are included intensionally so that the reader can develop a sense of the sorts of individual and local complications that invariably arise when studying transmitted diagrams.
Greek mathematical diagrams, characteristics, and transmission
It is well known that the great majority of our evidence for the Greek mathematical sciences comes from the medieval manuscript tradition, with our earliest complete sources having been copied in the ninth century. Anyone who has examined the diagrams in these medieval manuscripts will have been struck by a number of their features that differentiate them from modern diagrams. In particular, the medieval diagrams have the following characteristics: (1) there is considerable symmetry and regularity in the objects depicted, (2) the relative sizes of the objects depicted are not displayed accurately, (3) three-dimensional, or solid, objects are depicted in a number of different visual styles, and (4), on the whole, the diagrams are schematic representations, as opposed to accurate illustrations, of the objects depicted. 4 Starting from the early modern period it was tacitly assumed that these characteristics were accidents of the transmission, and the diagrams were often altered to suit modern tastes.
But a closer consideration of the historical evidence has shown that the failures of transmission cannot entirely explain the situation. In the first place, although there are currently no known ancient papyri containing Theodosios’ Spherics, there are a number of papyri from the Roman Imperial period that transmit diagrams from Euclid’s Elements, the mathematical treatise upon which Theodosios modeled his own. For example, for the text itself, there is one papyrus from a bookroll that includes the diagram for Elem. I.39, and one from a codex that includes part of the diagram for Elem. XIII.17, 5 both of which exhibit a tendency toward symmetry. Furthermore, there are three documentary papyri that include just the enunciations and unlettered diagrams of a number of propositions from Elements I and II, 6 all of which, although crudely drawn, show the same general characteristics as the medieval diagrams. 7
Furthermore, it should be noted that the ninth-century manuscripts that transmit the Elements and the Spherics are not more than a few copies removed from those of the scholars who edited these Hellenistic treatises in the late ancient period. 8 Hence, although some errors of transmission may have been introduced in these few copies, by and large there were not enough acts of copying, nor was there enough innovation in the transmission media, for the visual culture as a whole to have shifted between the time when these treatises were edited and our earliest extant copies.
A conspicuous feature of the ancient and medieval diagrams, which is referred to by scholars as overspecification, is a tendency toward greater overall symmetry and regularity of the elements than is required by the mathematical conditions. 9
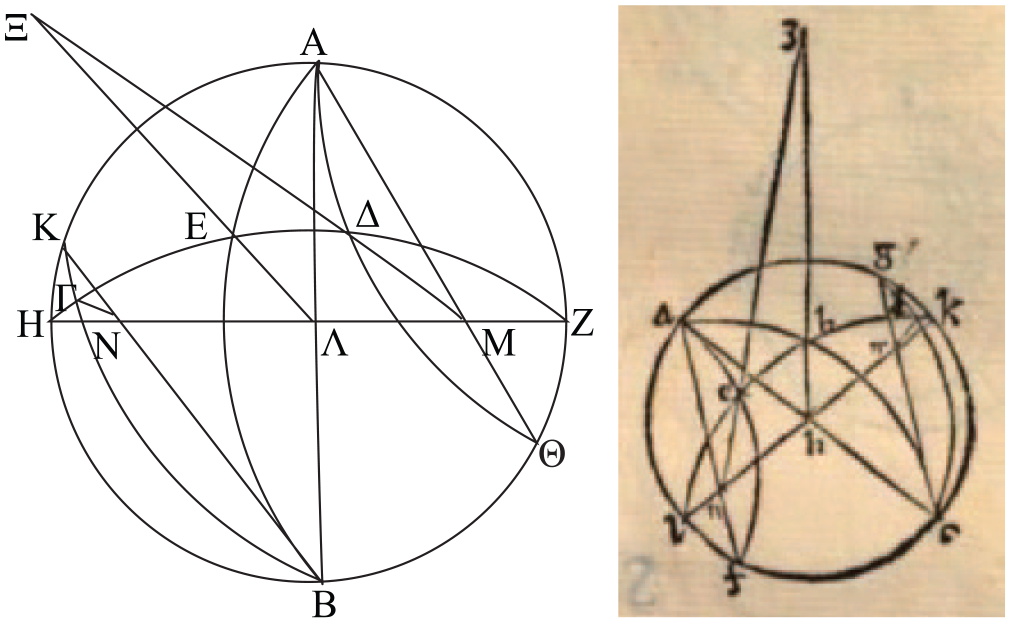
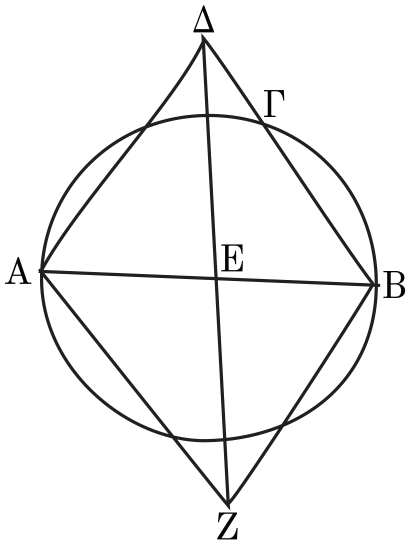
A good example for illustrating this tendency is the diagram for Sph. I.6—“Of the circles in the sphere, those through the center of the sphere are great, and of the others, those equally distant from the center are equal, while those more [distant] are lesser.” 10 In the diagram of the 13th-century Vat.gr. 203 (Figure 1), we see the central large circle ΓΔ representing a circle through the center of the sphere, H, and two symmetrically placed smaller circles, ΑΒ and ΕΖ, which represent circles that are both equally and unequally distant from H. 11 Obviously, a single diagram cannot accurately represent both of these geometrical configurations.
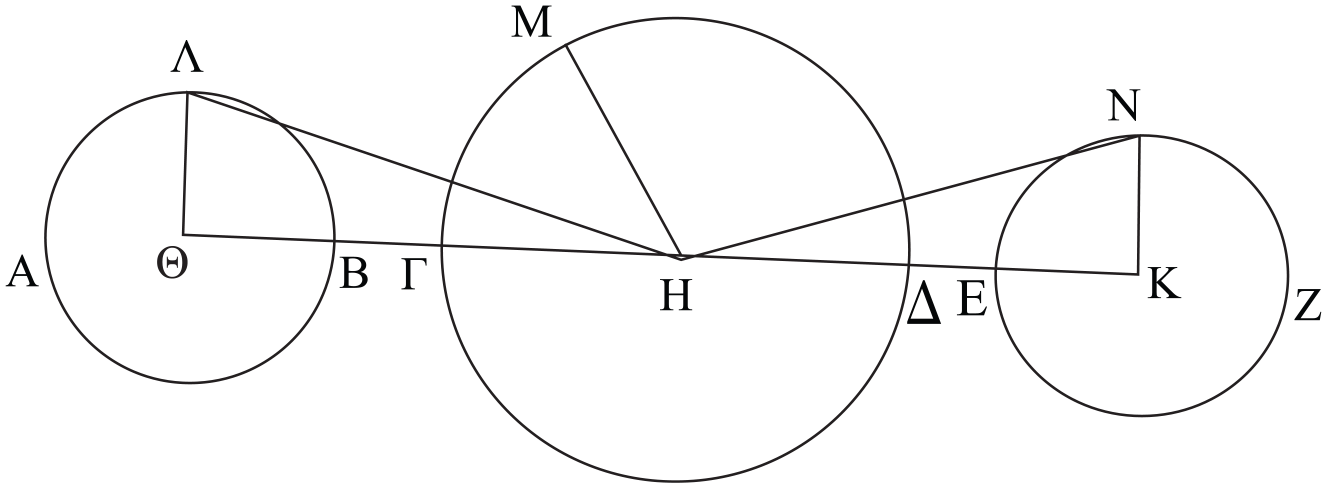
Manuscript diagram for Sph. I.6 in Vat.gr. 203, f. 2r, which is essentially the same as that in Vat.gr. 204, f. 3v. I have not copied the earlier manuscript because the vellum of the leaf on which this diagram is found has a large wrinkle right through the diagram, distorting it in photographs and microfilms. (The same diagram has also been drawn in a different hand, and different ink, in the lower margin of the previous page, f. 3r.) Note that the labels Β, Γ, Δ, and Ε appear to mark false crossings, and were probably originally free-floating on the circles that they name.
For our purposes here, what matters is that lines ΗΘ and ΗΚ represent any lines drawn from the center of the sphere to the centers of any two circles—they need not be collinear, as they appear to be here. Moreover, lines ΘΛ and ΚΝ represent any radii drawn from the centers of the circles to their circumferences, and, although they will be perpendicular to ΗΘ and ΗΚ in 3-space, they need not be parallel to the sides of the manuscript page. 12 Hence, in this diagram, we see the two small circles depicted symmetrically as though having a single axis, although they need not be, and their radii are depicted as parallel, although they need not be.
Another typical feature of the medieval diagrams, which has been called indifference to visual accuracy, is that they are not pictorial illustrations of the objects under discussion, and make little, or no, attempt at a visually, or metrically, accurate portrayal. 13 Many of the diagrams of Theodosios’ Spherics are good examples of this characteristic. A clear indication of this indifference to visual accuracy is that they never depict the sphere itself, such as with a circular outline as seen in modern diagrams (compare, e.g. Figures 1 and 3). Although the later diagrams, starting from the middle of Spherics II, convey a visual impression of the sphere, 14 the outer circle in these diagram is not the sphere itself, but rather some great circle in the sphere that is itself an object of concern in the proposition. 15 In the earlier diagrams, however, such as that for Sph. I.6 (Figure 1), the objects in the sphere are simply drawn onto the plane of the figure, and there is no visual indication of the sphere. A striking example of this is the diagram for Sph. I.5—“If a sphere contacts a non-cutting plane and a straight line is erected at an upright to the plane from the [point of] contact, then the center of the sphere will be on the erected [straight line].” 16
In the diagram for this proposition in Vat.gr. 204 (Figure 2), we see line ΑΒ, assumed as erected perpendicular from point A, the point of contact of the sphere and plane, and line ΑΓ, joining point A with some counterfactually assumed center of the sphere, Γ, which does not lie on line ΑΒ. Neither the sphere nor the plane, which are both mentioned in the enunciation but neither introduced in the exposition nor named, are depicted in the diagram at all.
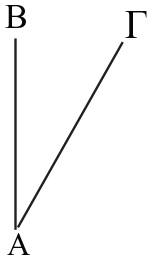
Manuscript diagram for Sph. I.5 in Vat.gr. 204, f. 2v.
Indifference to metrical accuracy can also be seen in the diagram for Sph. I.6 (Figure 1). This proposition has three parts: (1) in the first, a circle is assumed through the center of the sphere and shown to be great, (2) in the second, lines ΗΘ and ΗΚ are assumed to be equal and small circles ΑΒ and ΕΖ are shown to be equal, while (3) in the final part line, ΗΘ is assumed to be greater than line ΗΚ and circle ΑΒ is shown to be smaller than circle ΕΖ. But there is only one diagram for all of these cases, a situation that is not uncommon in ancient and medieval geometrical texts. 17 Hence, it is not possible that the diagram could be metrically accurate for both Parts 2 and 3. Indeed, the manuscript diagrams show the situation of Part 2, which is the more symmetrical and regular, corresponding to the tendency toward overspecification. This is, if ancient and medieval readers demanded that diagrams be metrically accurate, Part 2 could be construed as depicted correctly, but Part 3 could not. Clearly, the ancient and medieval readers did not place such demands on the diagrams.
The difference between the visual sensibilities preserved in the manuscripts and those of modern readers may be exhibited by comparing Figure 1 with the elegant diagrams produced for this proposition by Paul Ver Eecke in 1927, which belong to the same visual culture as the diagram of this proposition published by Francisco Maurolico in 1558 (Figure 3). 18 When we look at Ver Eecke’s images we form a direct impression that lines ΗΘ and ΗΚ may be any lines from the center, and by comparing the two diagrams we see that two configurations are conveyed, one in which ΗΘ is equal to ΗΚ, and one in which the former is greater. Indeed, if one requires that equal lines be depicted as equal and unequal lines as unequal, it becomes necessary to show this multipart theorem in two diagrams. That is, Ver Eecke’s modern figures show both a sensitivity to not depicting unnecessary conditions of regularity in the diagram, and a commitment to visual and metrical accuracy.
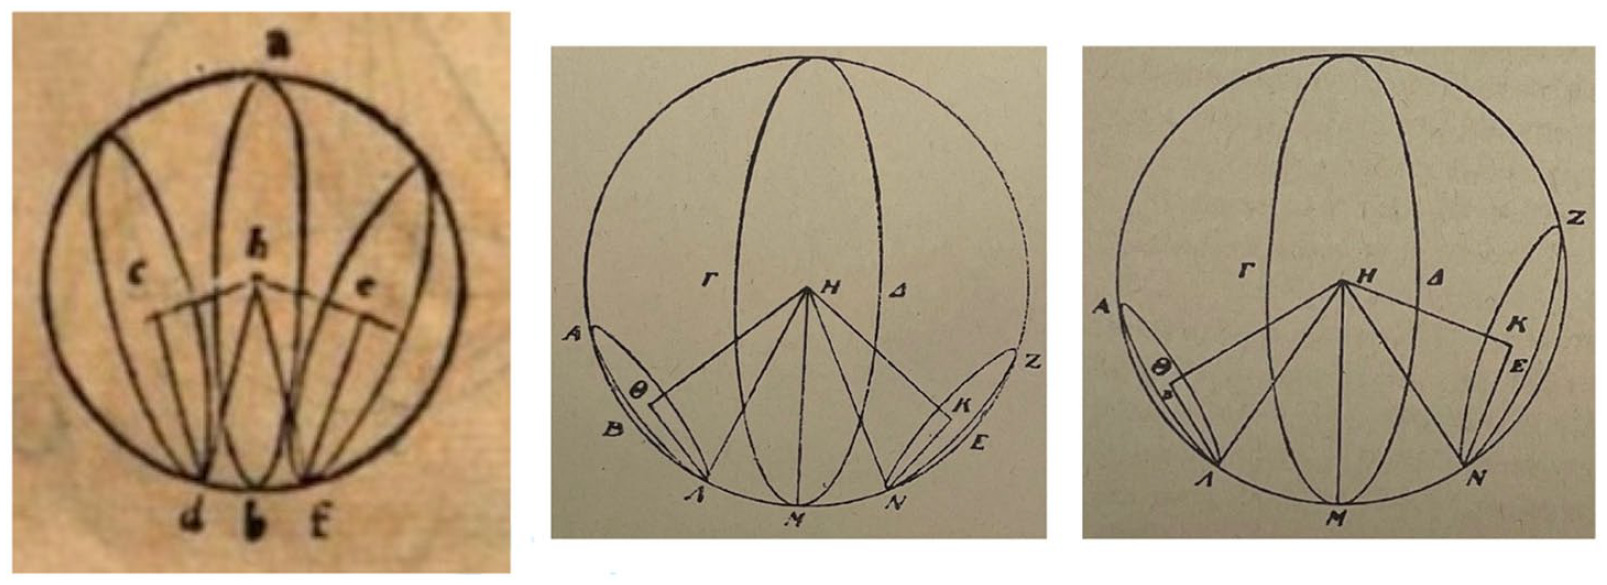
Diagrams for Sph. I.6. (Left) F. Maurolico, Theodosii sphaericorum (f. 2r); (Middle and Right) P. Ver Eecke, Les Sphériques de Théodose (pp. 9, 10).
Although the visual characteristics discussed above are nearly ubiquitous in all pre-modern sources of the mathematical sciences, we must also acknowledge that certain aspects of this visual culture may have resulted from copying errors introduced in the process of transmission. Indeed, it is certainly the case that some mathematical diagrams are incorrect—sometimes to the point of being nearly unintelligible. 19 Indeed, recent work by C. Carman has shown that when errors are made in copying a diagram, these have a clear tendency toward symmetry and regularity, perhaps resulting in an unintended, or even incorrect, symmetry, which might sometimes be indistinguishable from a cultural practice of overspecification. 20 Furthermore, after a diagram had been copied only a small number of times it was likely to become highly symmetrical, after which change, it tends to remain stable. 21 For these reasons, when we encounter what we consider to be an error in a diagram of the medieval manuscripts, we must consider closely whether this might have arisen as a result of a copying error, or whether it should be attributed to a different visual culture, in which it was not perceived as an error.
In the medieval manuscript figures it is often possible to distinguish between a mathematical error and a symmetrical, or highly regular, diagram that does not contain any real errors. A clear example of such an error may be drawn from the third diagram to Ptolemy’s Alm. V.17, dealing with the computation of the lunar parallax. 22 A typical version of this diagram in the Greek manuscripts may be taken from Vat.gr. 180, f. 129r, in which line ΒΔ is drawn parallel to the lines of the text (Figure 4 (Left)). According to the text, however, angle ΑΖΒ is 60°, and point H must bisect ΒΔ, neither of which conditions can hold in the manuscript diagrams. Indeed, since ΒΔ is drawn so as to appear perpendicular to ΑΓ, point Ζ appears to bisect ΒΔ, which it should not do. It is difficult to imagine that Ptolemy would have drawn the diagram that appears in the Greek manuscripts. Indeed, it is also hard to imagine that Thābit ibn Qurra or Naṣīr al-Dīn al-Ṭūsī, in making their revisions to this treatise, would have transmitted such a diagram, and, in fact, the manuscripts of the Arabic and Latin traditions of the texts do not show these errors. 23
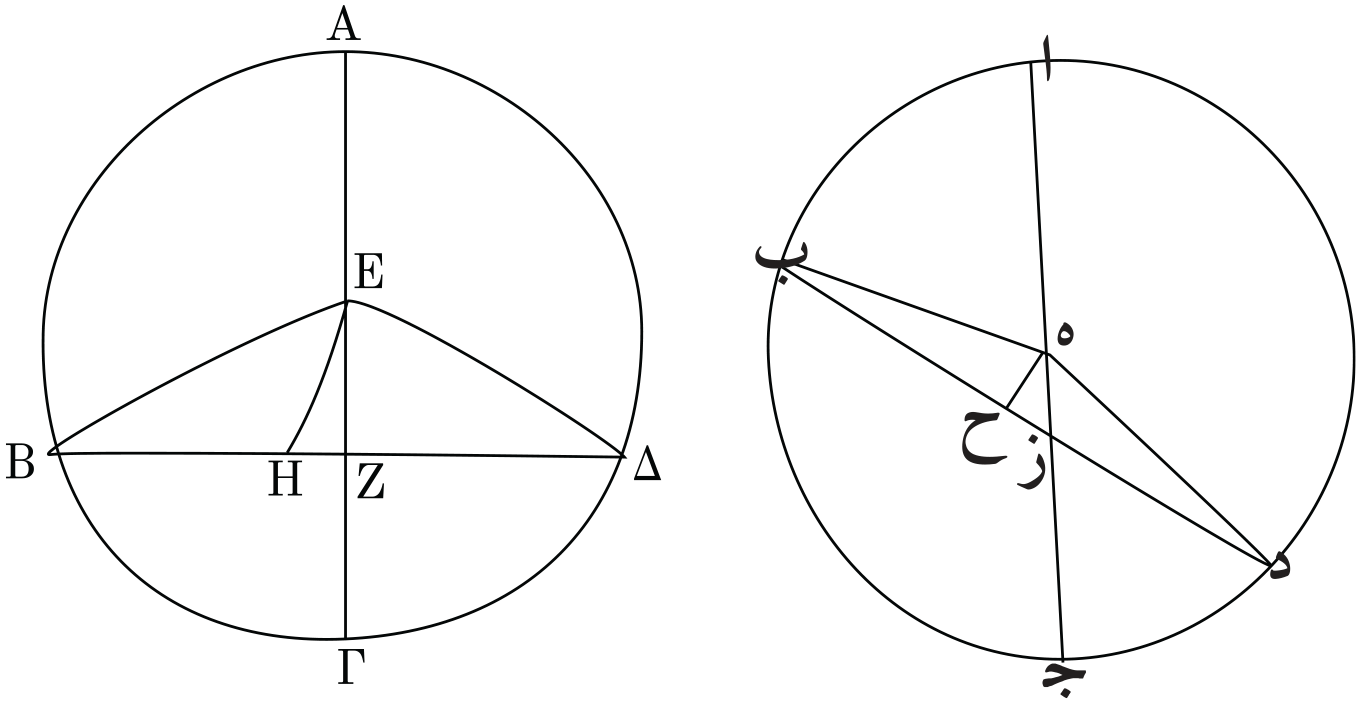
Manuscript diagrams for the third diagram in Alm. V.17: (Left) Vat.gr. 180, f. 129r; (Right) Sipahsālār (Madrasa-yi ʿĀlī-i Shahīd Muṭahharī) 4727, 468.
A useful example for thinking through the sometimes subtle differences between an overly symmetrical, mathematically incorrect figure, such as that in Figure 4 (Left), and a diagram that exhibits indifference to visual, or at least metrical, accuracy but is not mathematically incorrect, may be drawn from considering the diagrams in an important manuscript of al-Ṭūsī’s work, Sipahsālār (Madrasa-yi ʿĀlī-i Shahīd Muṭahharī) 4727. The third diagram for Alm. V.17 in Sipahsālār 4727 shows line ΒΔ skew to diameter ΑΓ, so that ΕΗ appears to be dropped perpendicular on ΒΔ, which is a necessary condition of the theorem, as seen in Figure 4 (Right). In this way, arc ΑΒ gives a visual sense of being any angle, which is the overall requirement. Nevertheless, it is not metrically accurate, since according to the text it should be 60° for the paradigm calculation, whereas in the diagram it is closer to 70°—although probably not many viewers can tell the difference purely visually. Nevertheless, this diagram, which is representative of those that appear in the Arabic and Latin traditions, has no serious mathematical errors, and it is possible that any mathematically competent scholar could have produced such a figure.
The significance of consulting the third diagram for Alm. V.17 in Sipahsālār 4727 is that this manuscript is an important collection of al-Ṭūsī’s writings, containing both his highly original Memoir on Cosmography (al-Tadhkira fī ʿilm al-hayʾa) and his editions of classical texts in the mathematical sciences, including Theodosios’ Spherics. Moreover, it is very close to the source, since in the colophon to Ṭūsī’s Memoir we are told that it was collated against a copy that was corrected by the author himself, 24 and the manuscript is written in the same hand. Moreover, this manuscript contains numerous instances of overspecification and indifference to visual accuracy, where these features do not result in serious mathematical errors.
This helps us understand a general tendency of the ancient and medieval diagrams. Although there are certainly exceptions, by and large a necessary condition of regularity—such as perpendicularity, parallelism, equality, and so on—that is mentioned in the text should be displayed in the diagram, but a mathematical condition of regularity should not be stipulated by the diagram alone; it must be mentioned in the text. This probably has to do with the fact that a regular configuration is a special case of any configuration. That is, it was not regarded as an error to depict a parallelogram as a rectangle or a triangle as an isosceles triangle, since a rectangle is a parallelogram and an isosceles triangle is a triangle. 25
There are other common copying errors that are not much discussed in the scholarship on diagrams, but of which we will see a number of examples as we examine the diagrams of the Spherics in this paper. The first of these is that objects that are drawn near each other and do not meet—either through intersection or tangency—may often be drawn as though meeting one another. This includes intersections of two objects being drawn as though they represent the intersection of three or more objects. Hence, the diagrams will often appear to show the objects in question as overly determined. Furthermore, labels have a tendency to be shifted toward a place where two objects appear to meet, even when such apparent meetings are actually false crossings and do not indicate a mathematical point. We will encounter a number of these transmission errors below.
This discussion makes it clear that, while errors were certainly made in the transmission of manuscript diagrams, and while these tended to produce symmetry and regularity, even to the point of displaying mathematical errors or impossible configurations, the characteristics of overspecification and indifference to visual accuracy were still prevalent features of the ancient and medieval visual culture of mathematical diagrams, and can often be differentiated from errors of transmission. We will see a number of examples of such errors below.
Of course, having accepted the fact of various errors of transmission and their effects, we must acknowledge that there are many cases in which it is impossible to know whether the visual characteristics of a particular diagram are the result of the tendencies of copying errors to produce symmetry, or are due to decisions made on the part of the original author. There are many cases in which it is fairly clear that errors of transmission have produced excessive symmetry—such as the horizontal line in Figure 4 (Left)—but since nearly all pre-modern diagrams show overspecification and indifference to visual accuracy, it can also be unclear what was originally intended.
Considering the ninth-century diagram for Sph. I.6 (Figure 1), we may ask ourselves whether its symmetrical properties are known to go back to the original diagram produced by Theodosios, or whether they are the result of the process of transmission. In particular, since, throughout the course of transmission, diagrams find a kind of equilibrium in states of symmetry, lines ΗΘ and ΗΚ may have originally been drawn as skew to one another, or lines ΘΝ and ΚΝ may have originally been skew both to one another and to the margins, and the symmetry that we see now may have been produced by transmission errors. It is also possible, however, that Theodosios never intended the possible orientations of the lines to be directly read off the diagram and originally composed it with the symmetry we now see. Of course, in the case of line ΗΜ it is not probable that it had originally been drawn upright, since a copyist is not likely to accidentally change a line from perpendicular to inclined.
On the other hand, since there is only one diagram for Sph. I.6, one of Parts 2 or 3 must be metrically incorrect. This is a common characteristic of diagrams for multipart propositions. Indeed, when a proposition includes multiple diagrams, this is usually because different geometric objects, with different letter-names, must be introduced for each part or case. We find a number of such diagrams in Spherics II and III (Sph. II.11, II.12, II.16, III.1, III.2, III.3, III.9, III.10). This makes it certain that ancient authors did not intend claims about the inequality, or irregularity, of geometric objects to be read directly from their diagrams.
When we consider that nearly all of the ancient and medieval evidence that we now have shows diagrams that contain both overspecification and indifference to visual accuracy, and that even in the few manuscripts that contain diagrams that are accurately drawn this is not generally done consistently, 26 it becomes clear that these features were constant characteristics of the visual culture of ancient and medieval diagrams. In such a visual culture, even if a mathematician produced a presentation copy of their work with visually accurate diagrams, these unusual features would quickly be lost through the transmission of the text, so that the vast majority of readers who encountered the treatise in the pre-modern period would have found that it contained overspecified and visually inaccurate figures. In fact, because the great majority of diagrams that pre-modern mathematical scholars saw would have been schematic, and because they knew that their own works would be transmitted in such a visual culture, they probably designed their diagrams to be resilient to the sorts of transmission errors that might lead to real mathematical errors. Indeed, this was probably especially the case in the texts of spherical geometry, in which a complicated diagram in linear perspective might be rendered illegible after only a few acts of incompetent copying. We turn now to a discussion of the special characteristics of the diagrams of ancient spherics, which may underline this point.
Diagrams of Greek spherics
The figures accompanying Greek texts on spherics provide an important source for studying the diagrams produced by Greek mathematicians in general, because they are often so clearly not visual illustrations of the objects under discussion, and because their visual characteristics appear to have resulted from deliberate choices. 27 As mentioned, one of the more obvious characteristics of the spherics diagrams is that they do not depict the sphere itself. This may have largely been a result of the naming practices of Greek geometric texts, since the only objects that appear in the diagram are those that are introduced and named explicitly, whereas the sphere itself does not need to be named. Nevertheless, the absence of the sphere in the diagrams is visually rather conspicuous. Another feature of the spherics diagrams is that some of them appear to be solid diagrams, or to show the sphere itself, whereas others appear flat, showing all of the depicted objects lying out flat in the plane of the figure (as we saw in the diagram for Sph. I.6, Figure 1, above). 28 Moreover, both types may appear in the same treatise, as we will see below, indicating that the ancient mathematicians made choices about which style they would use under which circumstances. Another characteristic is that in diagrams that depict circles on the surface of the whole, or most, of the sphere, one great circle will act as a sort of base circle, in terms of which one hemisphere is shown inside the base circle and the other hemisphere outside of it, often with astronomical implications. 29 A final noteworthy characteristic of the ancient diagrams of spherics is that they represent a circle that is seen from the side, or foreshortened, with a pair of circular arcs that meet in cusps, which can be called a lens-shaped figure. This figure may appear in whole or in half.
It is important to stress that while the lens-shaped figure is characteristic of ancient and medieval treatises on spherics, and of ancient art that portrays various aspects of spherics as a cultural practice, it is not characteristic of ancient Greek and Roman art in general. Although there are certainly some exceptions, the majority of the many chariot wheels, circular shields, drinking vessels, and serving plates that are depicted as seen from the side in ancient two-dimensional art such as pottery, painting, and mosaics are represented as foreshortened circles with smooth curves. 30
The fact that circles appear to us as closed curves when viewed from the side was understood by mathematicians as well as by representational artists. In the writings of Euclid, Ptolemy, and Pappos, they explicitly discuss this fact (Optics
An indication of this fact is found by comparing ancient artworks that depict the spherical instruments of mathematicians and scholars working in spherics with contemporary artworks that depict other sorts of foreshortened circular objects. In fact, ancient mosaics that depict the solid and armillary spheres that were used in spherics clearly portray the cusps of these lens-shaped figures—see, for example, the well-known mosaic depicting an armillary sphere from Soluntum, or that depicting a solid or armillary sphere surrounded by philosophers found at Pompeii (Figure 5). In these mosaics we see the lens-shaped figure—in whole in that from Soluntum and in half in the Pompeii mosaic—with cusps meeting the base great circle at the edges. On the other hand, we may compare these directly with contemporary mosaics from the same, or nearby, regions and note that many of them depict, for example, circular shields, as well as drinking and serving vessels, seen from the side with smooth curves. 32 This comparison makes it clear that the choice between depicting foreshortened circles with smooth curves or lens-shaped figures was deliberately made by the various artists who laid these mosaics down. This is a clear indication that the choice to use lens-shaped figures in general representations of the cultural practices surrounding spherics was made because these figures were so well known—presumably through fairly elementary mathematics education—that they could serve as a visual motif of the study of spherics itself.
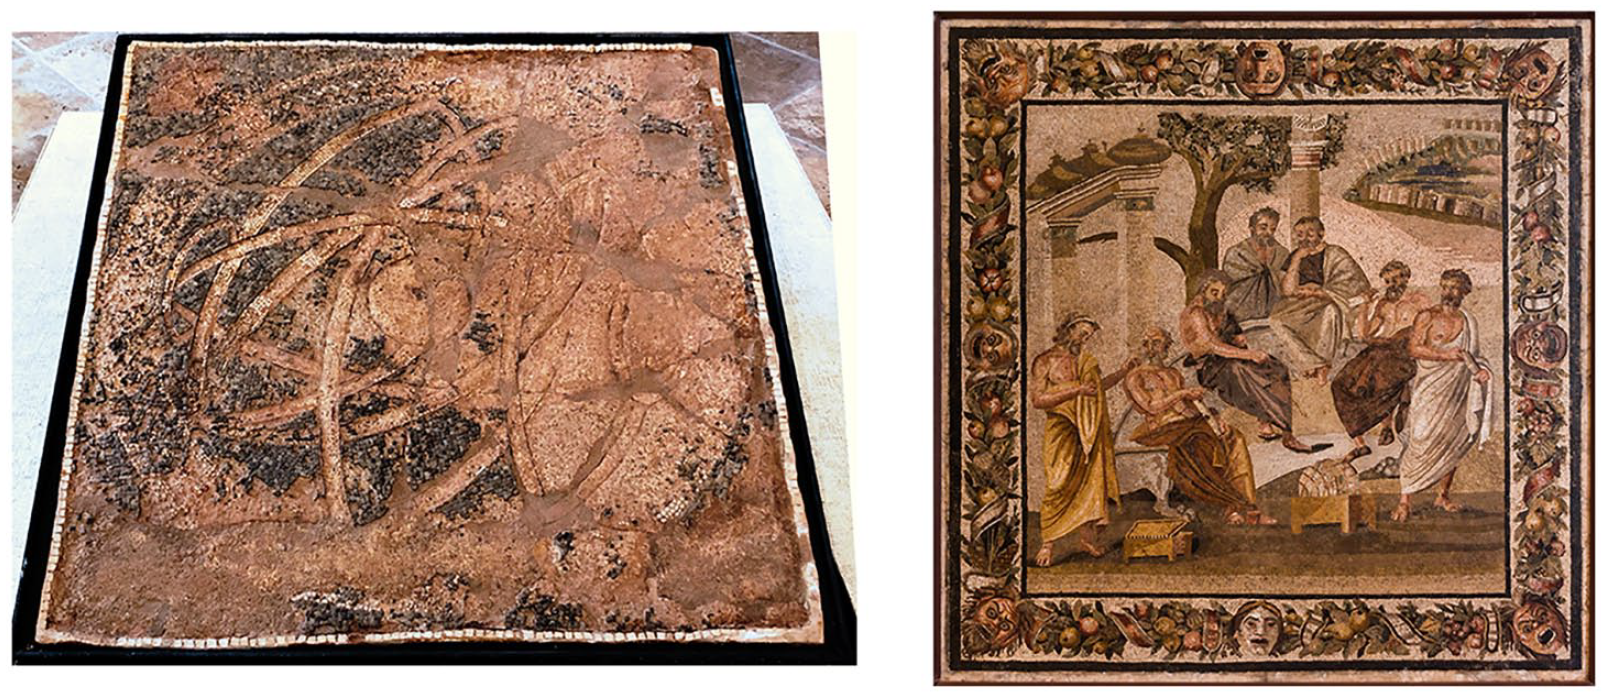
Mosaics depicting the lens-shaped figure typical of treatises in spherics. (Left) 2nd c. BCE–1st c. BCE Sicilian mosiac from Soluntum (now Solunto), now in the Area Archeologica e Antiquarium di Solunto, Sicily. (Right) 1st c. BCE–1st c. CE Roman mosaic from the Villa of Titus Siminius Stephanus, Pompeii. Now in the Museo Archeologico Nazionale, Naples, inv. 124545.
Diagrams of Theodosios’ Spherics
The diagrams of the medieval manuscripts of the Spherics exhibit all of the characteristics found in the diagrams of other spherics texts, as discussed above, but also show a wider variety of types of diagrams, probably as a result of various design decisions on Theodosios’ part. It is possible that some of these decisions were guided by an intention to communicate information about the underlying, although tacit, astronomical theory, 33 but they may also sometimes result from the ways in which geometric objects are introduced and named in the exposition and construction of the proposition in question. Here I set out the main visual characteristics that we find in the diagrams of the Spherics.
Taxonomy of the spherical diagrams
Setting aside the diagrams that depict objects that are either not, or not necessarily, on the sphere, 34 we can use three independent dichotomies to categorize the visual characteristics of the diagrams that depict objects on the sphere. The first of these is between diagrams that contain (1a) both circles and arcs that are intrinsic to the surface of the sphere and also straight lines that are extrinsic to the spherical surface, and those that contain (1b) only intrinsic objects. While this is essentially an objective criteria, since we can simply check the diagram to see whether or not it contains lines, it is not actually always based on a significant mathematical difference, because there are some propositions, such as Sph. II.13, that use straight lines in the argument, but neither construct nor name them, so that they do not appear in the diagram.
The second dichotomy is between diagrams that depict (2a) a fairly local region of the spherical surface and those that show objects on (2b) a more global surface. Specifically, this distinction is between those that contain small circles and, perhaps, arcs of great circles, and those that must contain at least one full great circle. Again, this is a fairly objective criteria, because we can check the text to see if any of the full circles in the diagram must represent a great circle. Once again, however, this is a visual as opposed to mathematical distinction, because some diagrams might represent a great circle with an arc of a circle, such as Sph. II.9, while others might represent such a circle with a full circle although this is not needed for the argument, such as Sph. II.13. Indeed, the full medieval transmission of the treatise, including sources in Arabic, Hebrew, and Latin, shows some variation along these lines, which was presumably introduced deliberately by the scholars who studied and transmitted the text.
The third dichotomy, which is the same as, or at least closely related to, the dichotomy recognized by O. Neugebauer and M. Malpangotto, is that between diagrams that have the appearance of (3a) a flat, planar surface, and those that appear to depict (3b) a solid configuration. 35 This characteristic is the most subjective, since it only relies on the viewer’s visual impression of how flat or three-dimensional a diagram appears. For this reason, some diagrams could be categorized as either (3a) or (3b), in particular those for Sph. II.10, II.19, and III.13. It should be clear that all three of these dichotomies are based on visual, as opposed to mathematical, criteria.
With these as categories, one can set out a three-dimensional array of the diagrams of the Spherics as seen in Table 1.
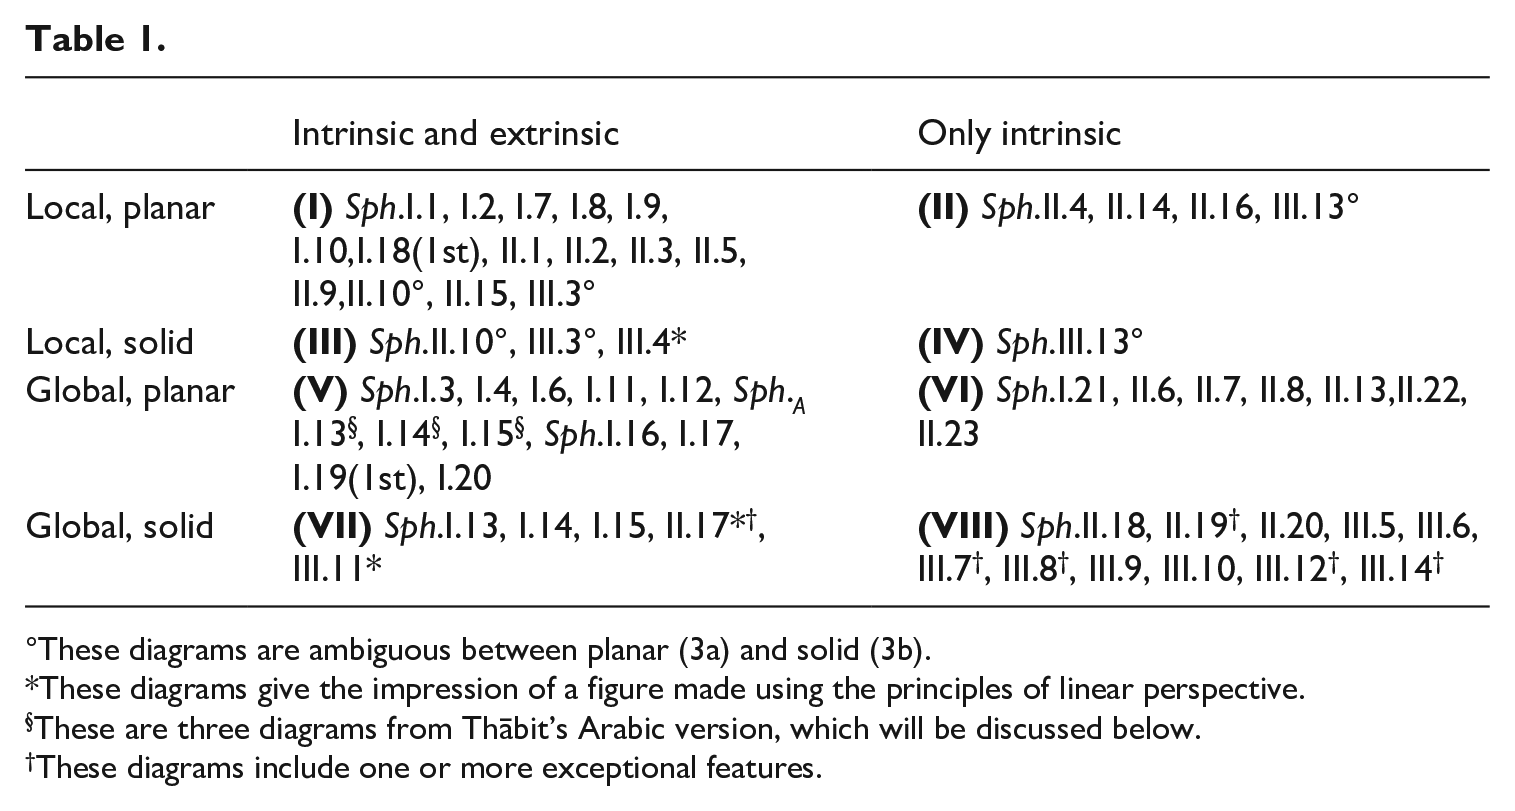
These diagrams are ambiguous between planar (3a) and solid (3b).
These diagrams give the impression of a figure made using the principles of linear perspective.
These are three diagrams from Thābit’s Arabic version, which will be discussed below.
These diagrams include one or more exceptional features.
One thing to notice about this table is that some diagrams appear in two places. This is largely because of the subjectivity involved in judging the dichotomy between planar and solid, (3a) and (3b), as mentioned above. For one group, Sph. I.13–I.15, I have also included the Arabic diagrams in the table, which are different in such a way as to change the diagrams from solid to planar. In fact, in the whole medieval tradition, there are many local variations of individual diagrams that might change their placement in this array, but the situation of the diagrams for Sph. I.13–I.15 is interesting and historically significant, and we will return to it later.
Of the three dichotomies, the easiest distinction to make is that between diagrams that contain both intrinsic and extrinsic objects, and those that contain only intrinsic objects, (1a) or (1b), because one simply makes a visual check for the presence or absence of straight lines. About 58% of the diagrams in the text contain both types of objects. In these diagrams, there are often false crossings between the straight lines themselves and between the straight lines and the circles or circular arcs that lie in the surface of the sphere (such as we in Figure 6, below). In all diagrams of the various spherics texts, however, intrinsic objects make no false crossings, so that the topology of their intersections and tangencies on the surface of the sphere is correctly depicted.
Manuscript diagram for Sph. II.1 from Vat.gr. 204, f. 10r.
In order to make a decision regarding the next dichotomy between local and global, (2a) or (2b), it is necessary to read the text to determine whether or not any circle depicted in the diagram must be a great circle. In a number of cases, such as Sph. II.1–II.5, at least one of the circles could be a great circle, but if none of the circles must be great, I consider the diagram to be local. Under these assumptions, about 58% of the diagrams are global.
The most interesting dichotomy, however, is that between diagrams that appear to be planar, and those that appear to be solid, (3a) or (3b). This is not only because the visual style is so different between these two classes of figures, but also because different sets of conventions, or encodings, are used to visually convey information about the objects depicted. About 64% of the diagrams are planar. In planar diagrams, (3a), it is often not possible to know whether the plane of the figure is meant to be a flattened out depiction of the spherical surface itself, or simply a drawing in the plane of the various objects that occur on the surface of the sphere. Whatever the case, except for depicting circles on the sphere with circles or arcs in the diagram, there are no mathematical rules, or procedures, for producing spherical or solid objects in the plane, such as we find in the plane diagrams of Ptolemy’s Planisphere or Analemma, which although written in the second century CE are thought to contain methods that go back to the Hellenistic period.
In order to get a sense of how this taxonomy works, it may be useful to go through an example from each cell in the array.
(Group I: 1a, 2a, 3a) Both intrinsic and extrinsic, local, planar: The largest group of diagrams depicts local objects that are both intrinsic and extrinsic to the spherical surface, in an image that has an overall flat or planar appearance. These are some of the more striking images in the text, because of their differences from modern visual sensibilities. As an example, we may consider the diagram for Sph. II.1—“Parallel circles in a sphere are about the same poles.” 36
In the manuscripts, two parallel circles, ΑΒΓ and ΔΕΖ, are represented as concentric and their axis, ΗΘ, passing through their poles and their centers, is drawn through them as a secant line making false crossings with each circle, all drawn as though flat in the plane of the diagram (Figure 6). Notice that although circle ΔΕΖ could represent a great circle, it does not necessarily do so. Hence, the diagram is classified as local.
Note that the locations of the labels have probably been affected by minor copying errors. In particular Δ, Α, Γ, and Ζ are situated near the false crossings of the circles and their axis, but these are not points and should not be labeled as such. Most likely these four labels were originally arranged free-floating around the circles, not near the line.
This figure illustrates two of the key visual encodings of planar diagrams—namely, parallel circles in the sphere are depicted as concentric in the plane and the axis of a circle in the sphere is depicted as a secant line, extending beyond the circle itself. As always, there is no visual indication of the sphere itself.
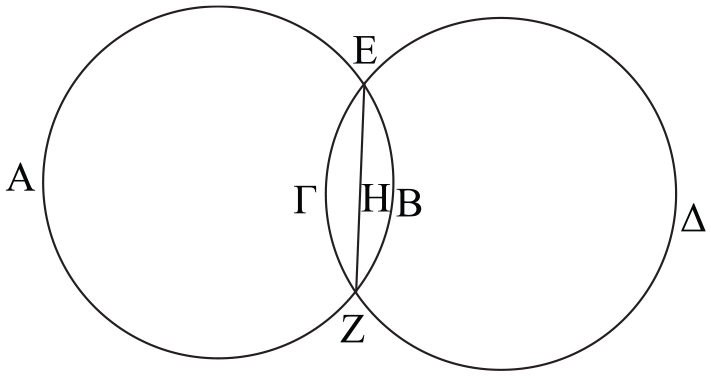
(Group II: 1b, 2a, 3a) Only intrinsic, local, planar: This group of diagrams depicts local objects that have an overall flat appearance, but which are entirely intrinsic to the spherical surface. The difference from the previous group is that these diagrams do not contain lines. As an example, we will look at the diagram for Sph. II.4—“If two circles in a sphere touch one another, then the great circle drawn through their poles will go through their [point of] contact.” 37
In the manuscripts, we see two circles, ΑΒΓ and ΓΕΔ, touching one another at point Γ, and a counterfactual great circle arc, ΗΒΖ, is drawn through their poles meeting one of them at a different point, say (Figure 7). Circle ΒΘΚ is drawn parallel to circle ΓΕΔ. Once again, one of the original circles could be a great circle, but need not be—making this diagram a representation of local objects. Furthermore, the great circle arc ΗΒΖ could have been drawn as a complete circle. If it had been so drawn the diagram would be classified as a representation of global objects.
Manuscript diagram for Sph. II.4 from Vat.gr. 204, f. 10v.
The position of the label Θ may be a result of a copying error, because Θ is not an intersection of circles ΑΒΓ and ΒΚΘ in the text itself.
Here we see further encodings used in the planar diagrams—namely tangent circles on the sphere are represented with tangent circles in the plane. As seen in the diagrams for Sph. II.6–II.8, the tangent circles may be arranged either internally or externally. Furthermore, objects that occur on one part of the surface of the sphere cut by a circle are represented as inside the circle in the plane, and objects on the other side of the spherical surface are represented outside of the circle in the plane.
(Group III: 1a, 2a, 3b) Both intrinsic and extrinsic, local, solid: A small group of diagrams depicts local objects which are both intrinsic and extrinsic to the surface of the sphere such that they appear to be solid. These diagrams are visually no different from the standard solid diagrams that are used in the Elements, as discussed above. Moreover, they may often appear to be drawn using some of the techniques of linear perspective. Although the proposition is difficult to understand from the statement of the enunciation alone, as an example we may consider the diagram for Sph. III.4—“If two great circles in a sphere cut one another, and from one of them equal circumferences [that is, arcs] are cut off successively both ways from the point at which they cut one another, and through the points brought about parallel planes are extended, of which one intersects the common section of the planes outside the surface of the sphere as towards the aforementioned point, and one of the equal circumferences is greater than each of the [two circumferences] cut off by the produced planes abutting the same point, then the [circumference] between the point and the non-intersecting plane is greater than that [circumference] of the same circle between the point and the intersecting plane.” 38
Considering the manuscript diagram (Figure 8 (Left)), the claim is that if two great circles ΑΕΒ and ΓΕΔ intersect one another in the line ΕΛ, and from point Ε equal arcs, ΑΕ = ΕΒ, each greater than either of the arcs ΓΕ or ΕΔ, are cut off, and through points Α and Β parallel planes are produced such that the plane though Α meets line ΕΛ extended at Ξ, then arc ΓΕ is greater than arc ΕΔ.
Diagrams for Sph. III.4. (Left) Manuscript diagram for Sph. III.4 from Vat.gr. 204, f. 29r. (Right) Diagram from F. Maurolico, Theodosii sphaericorum, f. 13r (Prop. III.2 in Maurolico’s edition).
In the diagram in Vat.gr. 204 the two great circles ΑΕΒ and ΓΕΔ appear to intersect each other perpendicularly (Figure 8 (Left)), but this need not be the case. Hence, this may be a regularity produced by copying errors. On the other hand, it may also be overspecification, since the proposition can still be true in such a configuration, and intersecting at a right angle is certainly a type of intersecting.
While it is possible that we are meant to understand the manuscript diagram as depicting all of the objects simply folded down into the plane of the figure—in something similar to the style of the diagrams of Ptolemy’s Analemma or Planisphere—it is also possible that the original diagram was meant to convey the three-dimensionality of the objects, such as we now do with linear perspective. Indeed, one may form a visual impression of depth from the manuscript diagrams. In fact, the diagram produced by Maurolico for this proposition is not of a visually different style from that in Vat.gr. 204, with the exception that the lines that correspond to ΑΛΒ and ΖΛΗ are slightly skew to one another (Figure 8 (Right)).
Because this diagram depicts local objects, such that each of the arcs of the foreshortened circles may be less than a semicircle, the original diagram might well have been drawn more or less according to the principles of linear perspective, and any deviations that we find in the manuscript diagrams now might have arisen in the process of transmission. That said, considering the evidence for lens-shaped figures discussed above, it is almost certain that the original diagram also contained lens-shaped figures, not smooth curves.
(Group IV: 1b, 2a, 3b) Only intrinsic, local, solid: Although the array of dichotomies allows that there could be diagrams of this type, there is only one that fits, and even that is debatable. The proposition in question is Sph. III.13—“If parallel circles in a sphere cut off equal circumferences [that is, arcs] of some great circle abutting the greatest of the parallels, and through the points brought about great circles are drawn either through the poles of the parallels or touching the same one of the parallels, then they will cut off between them equal circumferences from the greatest of the parallels.” 39
In the manuscript diagrams this arrangement is shown through a sort nexus of two triplets of parallel arcs crossed by a diagonal arc, all together giving the appearance of a spherical quadrilateral (Figure 9). This style of diagram—producing spherical arcs with arcs of large circles—was later used to good effect by Menelaos in his Spherics of the second century CE. 40
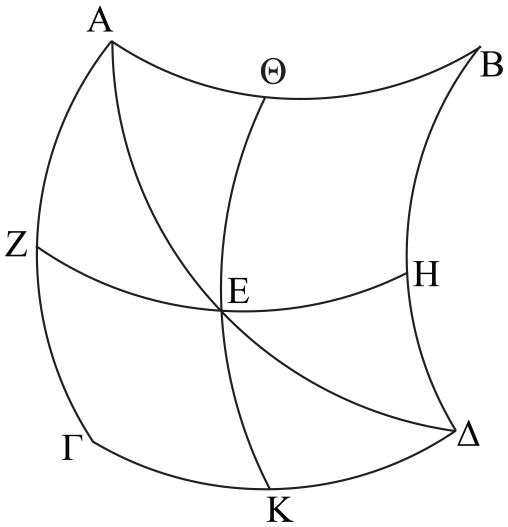
Manuscript diagram for Sph. III.13 from Vat.gr. 204, f. 37r.
Although this appearance might also arise from simply drawing the objects that occur on the surface of the sphere flat in the plane of the diagram, I think that most viewers will have a sense of three-dimensional depth when viewing this image. Moreover, if this diagram had originally been produced according to the principles of linear perspective, what we find in the manuscripts now could well have arisen through the process of transmission.
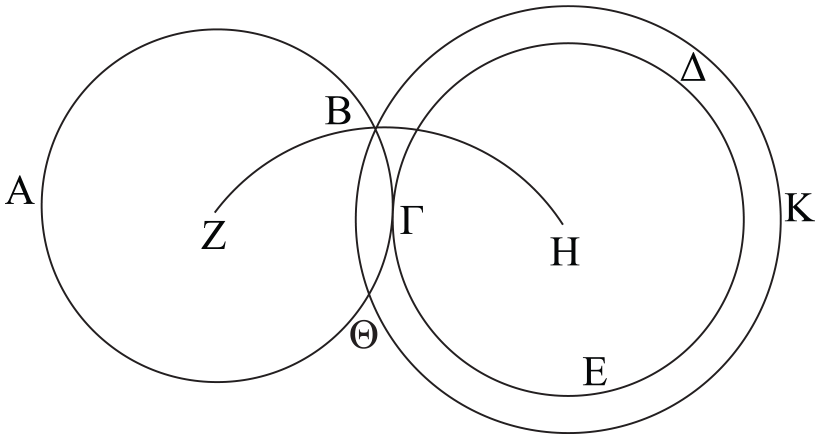
(Group V: 1a, 2b, 3a) Both intrinsic and extrinsic, global, planar: A fairly large group of diagrams depicts global objects that are both intrinsic and extrinsic to the spherical surface in a flat image. These diagrams are the same as those in Group I except that now at least one of the circles in each diagram must represent a great circle. We have seen this type of diagram already in that for Sph. I.6 (Figure 1); another example is the diagram for Sph. I.11—“Great circles in a sphere bisect one another.” 41
The manuscript diagram for this figure shows two intersecting great circles, ΑΒ and ΓΔ, with a line ΕΖ joining their points of intersection. Hence, line ΕΖ represents a diameter of the sphere and its midpoint, Η, represents the center of the sphere (Figure 10). As with all planar diagrams there is no attempt to give a visual portrayal of the objects involved—the representation is schematic.
Manuscript diagram for Sph. I.11 from Vat.gr. 204, f. 5v. The vellum of this folio has a wrinkle that runs through the diagram. I have not tried to precisely reproduce the distorted image in the photographs and microfilms.
Instead, various information is visually encoded in the diagram. For example, great circles will be drawn with equal circles. A chord joining their points of intersection represents a diameter of the sphere, and the unequal arcs cut off by such a chord represent semicircles in the sphere. We find such encodings used fairly consistently in planar diagrams.
(Group VI: 1b, 2b, 3a) Only intrinsic, global, planar: A fair number of diagrams depict global objects that are only intrinsic to the sphere, using a planar representation. An example of these is the diagram for Sph. II.13—“If there are parallel circles in a sphere and great circles are drawn touching one of them and cutting the remaining [parallel circles], then the circumferences [that is, arcs] of the parallel circles between the non-intersecting semicircles of the great circles are similar, and the circumferences of the great circles between the parallels are equal.” 42
Looking at the manuscript diagram (Figure 11), the proposition asserts that if there is a bundle of parallel circles ΑΒΓΔ, ΕΖΗΘ, and ΚΛ, and if two great circles, ΑΚΓ and ΒΛΔ, are tangent to the same parallel ΚΛ, then the arcs of the great circles taken in the same direction cut off similar arcs of the parallels, ΚΛ ~ ΕΖ ~ ΑΒ, and the parallel circles cut of equal arcs of the great circles, ΑΕ = ΒΖ = ΓΗ = ΔΘ.
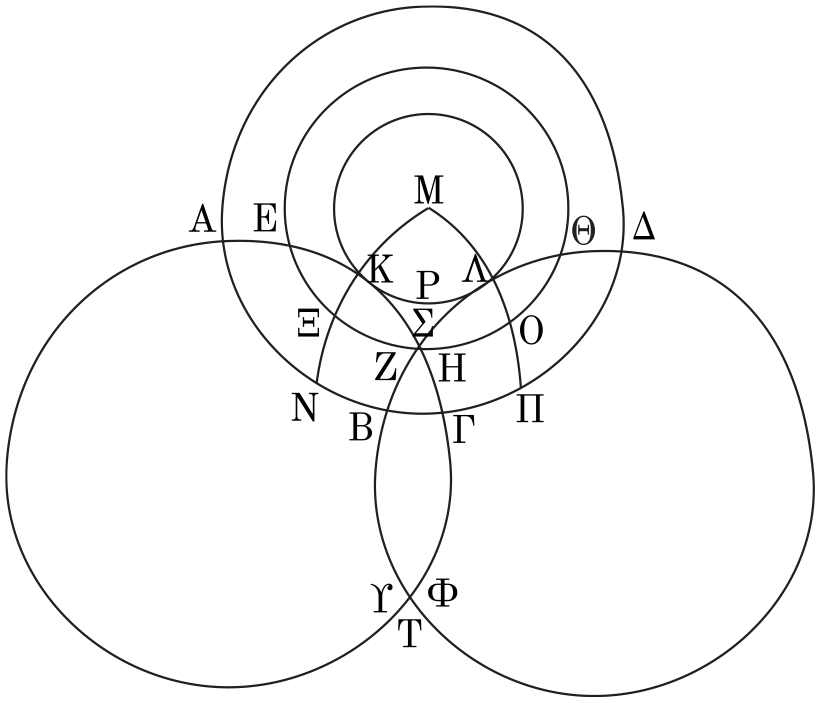
Manuscript diagram for Sph. II. 13 from Vat.gr. 204, f. 15v.
There are a number of textual problems with this proposition. In the first place, a long, rambling gloss that attempts to explain, or otherwise discuss, the technical concept of non-intersecting semicircles 43 has been inserted into the exposition, and it seems that a number of letter-names that are used in this passage are then repeated in the demonstration, where the objects that they name play no role in the mathematical argumentation. Furthermore, there is the possibility—although perhaps remote—that the second part of the proposition, dealing with the equal arcs cut off by great circles, was also a later addition to both the exposition and demonstration.
There are a number of fairly minor copying errors in this diagram (Figure 11), some of which may have resulted from the textual changes just mentioned. The point Σ appears to mark an intersection of all three circles ΕΖΗΘ, ΑΕΚΗΓ, and ΒΖΛΘΔ, but circle ΕΖΗΘ need not meet circles ΑΕΚΗΓ and ΒΖΛΘΔ at their intersection. Moreover, there is no mention of point Σ outside of the gloss that was inserted into the exposition. The triple intersection marked by Σ is probably a result of the tendency of copyists to depict nearby objects as meeting. Furthermore, all three labels Τ, Υ, and Φ appear to mark the same point. These three labels, however, are probably also late additions, since the letter-names to which they belong originate in the added gloss. Then, in the course of copying the diagram, these labels were moved around to all mark the same point.
If the design of this diagram were changed slightly it would be classified as local not global, (2a) not (2b). This is because the question of whether to include the full great circles ΑΚΓ and ΒΛΔ or just their arcs, as was done in the diagrams for Sph. II.4 (Figure 7) or II.9, is purely a design decision. From a mathematical perspective, nothing in the argument requires that the full circle be drawn, and if they were depicted as arcs, the mathematical argument in the text would still hold.
Finally, the classification of this diagram as including only intrinsic objects is also somewhat arbitrary, (1b) not (1a). In fact, the demonstration of this proposition relies on solid objects that are neither constructed nor named, and are therefore not drawn into the diagram. This occurs in two places, but the more significant is an application of a lemmatic theorem of solid geometry, Sph. II.11—“If equal and upright segments of circles have been set up on diameters in equal circles, and from them equal circumferences [that is, arcs] are cut off abutting the extremities of the segments, being less than half of the whole [segments], and from the determined points equal straight lines are extended forth to the circumferences of the initial circles, then they will cut off equal circumferences of the initial circles abutting the extremities of the diameters.” 44 Because this lemma is asserted as pertaining to straight lines, when it is used, it will require straight lines. Since these lines have been neither constructed nor named in Sph. II.13, however, Theodosios invokes the equality of the two necessary lines with the following oblique expression: “the straight line joining from Μ to Α is equal to the straight line joining from Μ to Δ.” 45 In this way, in a number of places in his Spherics, Theodosios employs straight lines to make claims about objects that are intrinsic to the surface of the sphere without ever constructing or naming the lines in question. This gives the impression of doing a purely intrinsic, surface geometry, while actually using objects and propositions of solid geometry. This tactic—or perhaps stylistic approach—was also employed in a number of places by Menelaos in his own Spherics.
These discussions make it clear that the position of a particular diagram in the classification set out above is often arbitrary, being affected by both visual design decisions on the part of the author or another mathematical scholar in the transmission, as well as copying errors—and, indeed, in many cases probably both. That said, as the diagram currently stands, it contains the encoding of a bundle of parallel circles as concentric circles in the plane, a pair of great circles as equal intersecting circles in the plane, and new encodings of pencils of great circles passing through the same point, or as tangent to the same parallel. All of the encodings in this diagram are strictly planar.
(Group VII: 1a, 2b, 3b) Both intrinsic and extrinsic, global, solid: In contrast with the previous group, this is a small batch of diagrams that represent global objects that are both intrinsic and extrinsic to the sphere, in a solid presentation. These diagrams are quite close to having been produced through the techniques of linear perspective. The best example of these is the diagram for one of the more involved propositions in the text, Sph. III.11—“If the pole of the parallels is on a circumference of a great circle, and two great circles of which one is of the parallels and the other oblique to the parallels, cut this at an upright, and some other great circle through the poles of the parallels cuts the oblique circle between the greatest of the parallels and that [parallel] which the oblique [great circle] touches, then the diameter of the sphere has to the diameter of the circle that the oblique circle touches a greater ratio than the circumference of the greatest of the parallels between the initial great circle and the next [great circle] through the pole to the circumference of the oblique circle between the same circles.” 46
Considering the manuscript diagram (Figure 12 (Left)), the claim of this proposition is that if a great circle ΔΕΖ is tangent to a parallel circle ΔΛΜ and intersects the greatest of the parallels ΒΕΓ, and if another great circle ΑΗΚ is passed through the poles of the parallels such that it cuts off arcs ΔΗ and ΒΘ from ΔΕΖ and ΒΕΓ, respectively, then the ratio of the diameter of the sphere to the diameter of small circle ΔΛΜ is greater than the ratio of arc ΒΓ to arc ΔΗ. This is best understood by interpreting it astronomically as pertaining to the upright sphere and asserting a bound on the relationship between an arc of the ecliptic and its rising time, or right ascension, which bound is itself determined by the obliquity of the ecliptic. 47
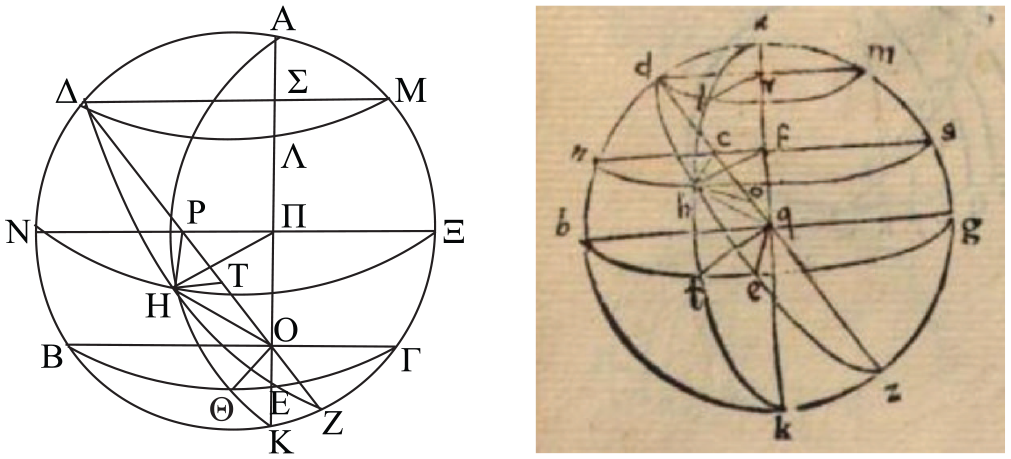
Diagrams for Sph.III.11. (Left) Manuscript diagram from Vat.gr. 204, f. 34r. (Right) Diagram from F. Maurolico, Theodosii sphaericorum f. 25v (Prop. III.12 in Maurolico’s edition).
There are a number of copying errors in the diagram in Vat.gr. 204 (Figure 12 (Left)), which can be found in many of the other medieval diagrams as well. Most conspicuously, circle ΒΕΓ should be the greatest of the parallels, so that point Ο should be the center of the sphere. The current configuration, which arranges the circles symmetrically, probably resulted from the tendency of copyists to produce more symmetry in their copies than they found in their models. Moreover, line ΑΚ should be a diameter of the sphere, which it does not appear to be. This line was probably moved over in copying because it was difficult to fit everything into the left-hand side of the diagram. Furthermore, label Λ appears to mark a false crossing; it was probably originally free-floating on circle ΔΛΜ. Finally, label Ε appears to mark a false crossing of the intersection of great circles ΔΕΖ and ΑΗΚ with the diameter ΑΚ, which need not occur. This is not, however, a serious problem, because there is no line ΕΟ in Theodosios’ proof. 48
If these errors are corrected, it is clear that the original image would have been rather close to what we would produce using linear perspective. Although Theodosios almost certainly used circular arcs as opposed to arcs of ellipses, the difference is fairly subtle. We can compare the medieval figure with that of Maurolico, which corrects the errors mentioned above, and also uses arcs of ellipses as opposed to circles (Figure 12 (Right)). Nevertheless, we should point out that Maurolico’s figure is still somewhat schematic, and not fully conforming to the mathematical principles of linear perspective. This can be made clear if we compare it with a diagram made using strictly mathematical techniques (Figure 13 (Left)). The latter diagram makes it clear that since we are looking down on the plane of great circle BEG, the diameter of the sphere AK must appear tilted toward us, so that the left to bottom half of great circle ABKG is actually on the back of the sphere, which is made clear by the arcs of BEG, AQK, and DEZ bending back to meet great circle ABKG. Of course, we may change the perspective, but so long as we have enough space to show the necessary details of the internal lines, half of the base great circle will always be on the back of the sphere. Considering the remarks that have been made about the use of lens-shaped figures to depict circles, and the various graphical techniques that we have seen in the diagrams so far, it is likely that Theodosios originally produced a figure essentially like that in Figure 13 (Right), which is close to Maurolico’s diagram.
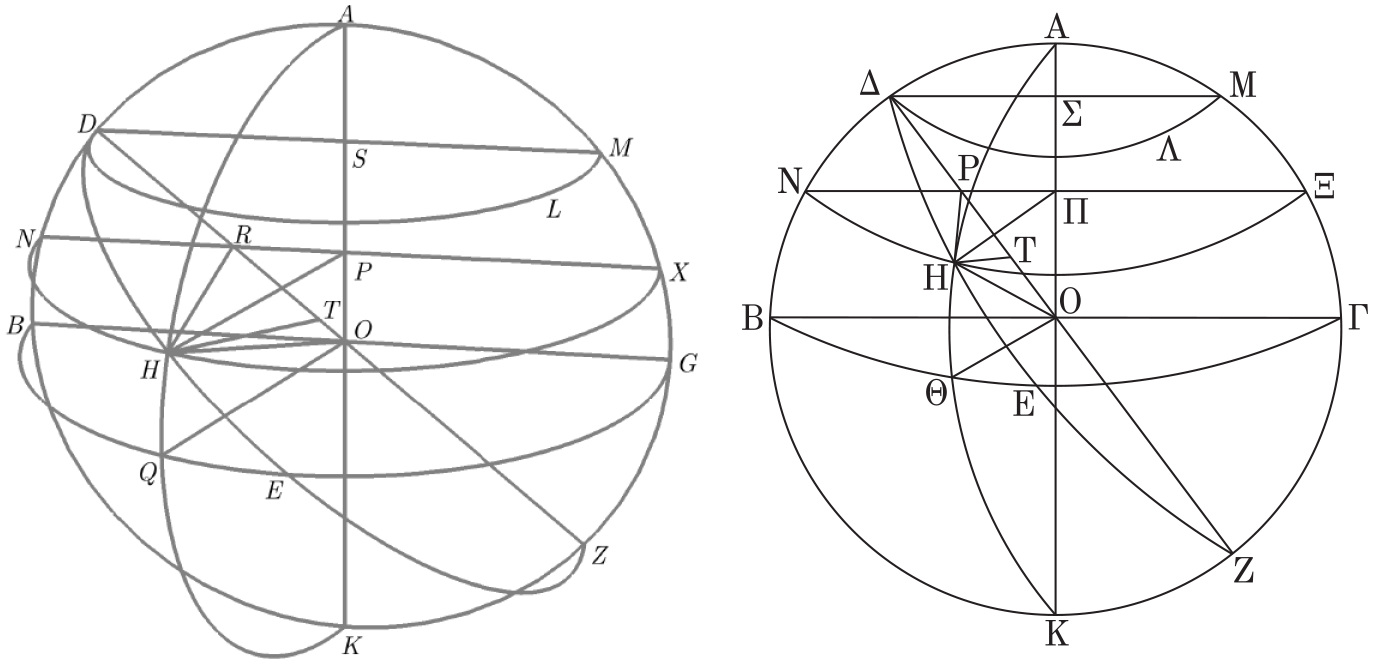
Diagrams for Sph. III.11. (Left) A perspective diagram created by using Mathematica®; courtesy of R.S.D. Thomas. (Right) A proposal for the original diagram.
In any case, I think most viewers will perceive a strong sense of depth from all of these various images. On the whole, the diagram for Sph. III.11 should be taken as clear evidence that Theodosios was perfectly capable of drawing diagrams using an approach close to the techniques of linear perspective, so that when he did not do so, it can be understood as a deliberate choice. 49
This diagram exhibits a number of the encodings used in the solid diagrams of global objects. Of course, the question of whether these are really visual encodings, or just accidental results of making a visual portrayal of the objects involved, should be raised. Nevertheless, we see a number of regularities in these diagrams, not all of which arise simply as a result of producing a visually accurate depiction. In the first place, in such solid diagrams there is always a base circle, which is not the sphere itself, but one of its great circles. Then other great circles that are perpendicular to this base circle are drawn as half lenses in the middle of the base circle. 50 Furthermore, a bundle of parallel circles is depicted by a set of half lenses whose bases are parallel and whose curvature is in the same direction. Finally, when a parallel circle and a great circle meet at the same point of the base circle this cusp is understood to be the meeting of all three circles, so that it represents a tangent point between the parallel circle and the great circle that meets it on the base circle. These encodings are also found in the other diagrams that depict global objects in a solid representation.
(Group VIII: 1b, 2b, 3b) Only intrinsic, global, solid: The diagrams of the final group, which is large, depict purely intrinsic global objects in a solid representation. These diagrams also give an impression of three-dimensional representation, but most viewers will probably find these diagrams to be more schematic than those of groups III, IV, and VII. An example of these diagrams may be taken from Sph. III.7—“If a great circle in a sphere touches some circle of those in the sphere, and some other great circle, being oblique to the parallels, touches greater [circles] than those the initial [circle] touches, and, furthermore, the [points of] contact are on the initial great circle, and equal circumferences are cut off from the oblique circle successively on the same side of the greatest of the parallels, and through the points brought about parallel circles are drawn, then they will cut off between them unequal circumferences of the initial great circle, and that nearer the greatest of the parallels will be ever greater than that farther off.” 51
Considering the manuscript diagrams (Figure 14), this theorem asserts that where a base great circle ΑΒΓ touches some parallel circle ΑΔ at Α, and another great circle ΕΖΗ is perpendicular to the base great circle and oblique to the parallels, and contiguous equal arcs, ΛΚ = ΚΘ, are cut off of ΕΖΗ between small circle ΑΔ and the greatest of the parallels ΒΖΓ, and if parallel circles are drawn thorough points Λ, Κ, and Θ, cutting off points Π, Ξ, and Μ on the base circle, then arc ΠΞ is greater than arc ΞΜ. This proposition is usually interpreted as establishing that, on the oblique sphere, the ortive amplitudes of equal, contiguous arcs of the ecliptic increase in the direction of the equator. 52
Manuscript diagram for Sph. III.7 from Vat.gr. 204, f. 31r. I have not tried to reproduce the distortions caused by the shape of the vellum. In Vat.gr. 204, label T is missing and Ψ is drawn in a different ink; in Vat.gr. 203, f. 13v, they are clear.
As usual, there are some copying errors (Figure 14). Again, ΒΖΓ represents the greatest of the parallels, and therefore should be drawn near the middle of the base circle. Furthermore, circle ΑΔ is parallel to circle ΜΝ and hence cannot touch it, as it appears to do in many of the manuscript diagrams. Finally, point Τ should only mark the intersection of great circle arc ΥΚΦ with parallel circle ΜΝ, not all three circles, as it appears to do here.
If these errors were corrected, we would have an image that produces a general impression of the sphere, but would still not be regarded by most viewers as an accurate visual portrayal of the objects involved. In particular, since parallel circle ΑΔ is drawn as a full circle, whereas the other parallels are drawn as half lenses, they do not all appear, visually, to belong to the same bundle. Furthermore, although great-circle arc ΔΣ appears to be tangent to small circle ΑΔ in the diagram for Vat.gr. 204 (Figure 14), in many other manuscripts of the various medieval traditions it appears to simply meet the circle, so as to intersect it if it were extended. 53 (In fact, in the diagram for the following proposition, Sph. III.8, it is not possible that all of the great circles that must be tangent to ΑΔ be depicted with arcs that are tangent to the plane circle.)
This diagram combines an overall spherical representation with some encodings for plane diagrams. Namely the tangency of the base circle ΑΒΓ with small circle ΑΔ is encoded using plane techniques. (In fact, a number of diagrams in this group present an overall spherical representation and also represent some elements using plane encodings—noted with a † in the table above). It also introduces the encoding of an arc joining the greatest of the parallels to one of the parallel circles so as to appear to meet it in some way. Such arcs represent great circles that intersect the greatest of the parallels but are tangent to the small parallel that they meet.
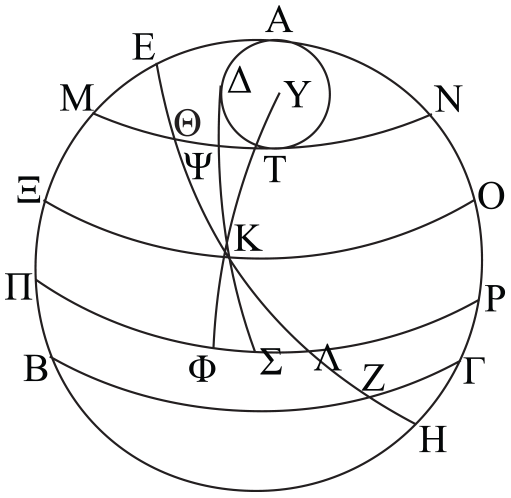
A number of the diagrams in this group, exhibit purely solid encodings, and hence present a stronger visual impression of the sphere. As an example of one of these we may look at the diagram for Sph. III.5—“If the pole of the parallels is on a circumference of a great circle, and two great circles, of which one is of the parallels and the other is oblique to the parallels, cut this at an upright, and equal circumferences are cut off from the oblique circle successively on the same side of the greatest of the parallels, and parallel circles are drawn through the points brought about, then they will cut off between them unequal circumferences of the initial great circle, and that nearer to the greatest of the parallels will be ever greater than that farther off.” 54
The manuscript diagrams for this figure again show a number of symmetry errors, insofar as the parallel circles, which are all in one hemisphere, are shown spread out over the sphere, and points Α and Δ are fairly symmetrically placed about the actual pole of the parallel circles (Figure 15 (Left)). If these transmission errors are corrected, we see a diagram from which most viewers will probably receive a clear visual impression of a solid sphere (Figure 15 (Right)).
Diagrams for Sph. ΙΙI.5. (Left) Manuscript diagram from Vat.gr. 204, f. 30r. (Right) Minor corrections for symmetry errors.
Undecidable and uncertain situations
Having gone through the examples of the eight groups above, we have seen that many of the manuscript diagrams include various transmission errors that can easily be recognized as such. These errors have a tendency to move nearby elements to meet one another, to shift labels to nearby apparent intersections, or false crossings, and most importantly to produce more symmetry than is necessary, or even correct. When such a highly symmetrical image is mathematically incorrect or impossible, it is easy to recognize the symmetry as a copying error, but there are also cases of symmetrical figures that are not incorrect and may be instances of deliberate, or at least not unintended, overspecification. We already saw such features in the diagram for Sph. I.6. Another example may be drawn from the diagram for Sph. I.9—“If a circle is in a sphere and from either of its poles a perpendicular to it, a straight line, is produced, then it will fall on the center of the circle, and being extended out it will fall on the other pole of the circle.” 55
In the proof of this proposition, lines ΑΕ and ΕΒ are produced as two independent lines from the center of the circle, Ε, to any two points on the circumference of circle ΑΒΓ (Figure 16). Hence, there need be no straight line ΑΕΒ, despite the fact that it is so depicted in almost all manuscript copies. 56 Nevertheless, because the proof still holds if ΑΕΒ is depicted as a straight line, or in fact is a straight line, it is possible that the original source used such a straight line. If, however, Theodosios had originally depicted ΑΕΒ as a broken line, we would now have no way of knowing this, because the process of transmission itself tended to introduce such symmetries. We can regard such situations as undecidable.
Manuscript diagram for Sph. I .9 from Vat.gr. 204, f. 4v. Label Γ appears to mark the false crossing between circle ΑΒΓ and line ΔΒ. It was probably originally free-floating on an arc of the circle.
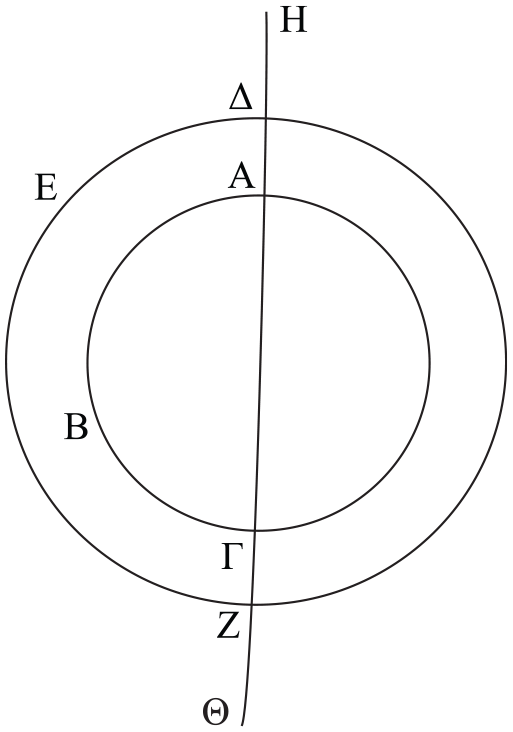
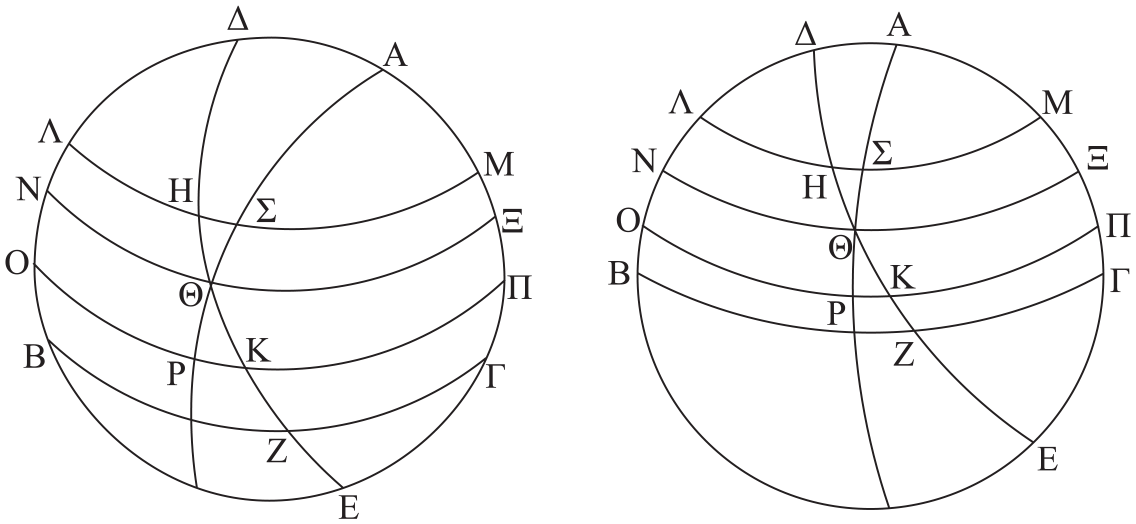
There is another group of diagrams that also warrant some discussion, because they are exceptional in a couple of ways, and the medieval translations are accompanied by diagrams that are somewhat different from those in the Greek manuscripts. These are the diagrams for Sph. I.13–I.15. There are serious problems with the diagrams in the Greek manuscripts for Sph. I.13 and I.14, and minor problems with that for Sph. I.15—the diagrams in the various Arabic, Latin, and Hebrew versions of the text, however, generally avoid these problems. As a representative of all three we may look at that for Sph. I.13—“If a great circle in a sphere cuts some circle of those in the sphere at an upright, then it will bisect it and be through the poles.” 57
Using the diagram from Vat.gr. 204 the claim is the following (Figure 17 (Left)): If a great circle ΑΒΓ is perpendicular to a small circle ΔΕΖ, then the great circle bisects the small circle and passes through its poles, Α and Γ. In this group of theorems, circles are treated as solid disks internal to the sphere, not simply as curved lines on its surface.
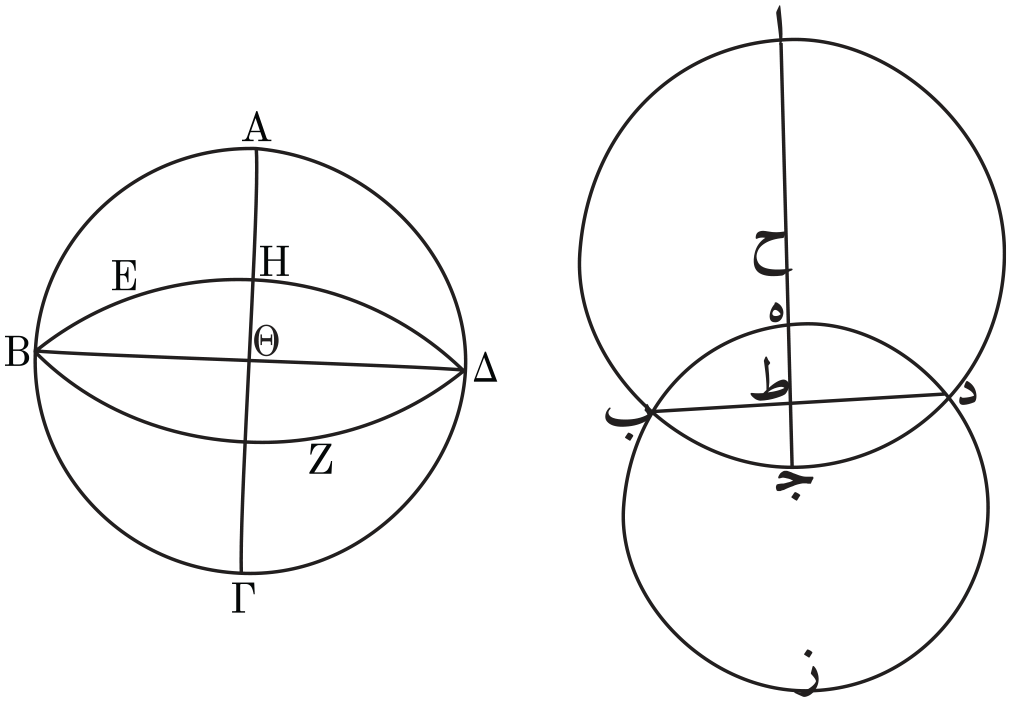
Diagrams for Sph. I.13. (Left) Diagram from Vat.gr. 204, f. 6r. (Right) Diagram from Leiden or. 1031, f. 28b.
We can see that there are a number of problems with the manuscript diagram (Figure 17 (Left)). 58 In the first place, small circle ΔΕΖ is represented by a large lens-shaped figure in the middle of the base circle, so that it appears to be a great circle, which it must not be. Hence, the center of circle ΔΕΖ, namely Θ, appears to be the center of the sphere, so that point Η, which is actually the center of great circle ΑΒΓ and the sphere itself, appears to mark the false crossing between the lens-shaped figure and line ΑΓ. Moreover, there are a couple of unusual, but related, features of these diagrams that differentiate them from the other diagrams in the text, but which do not rise to the level of mathematical errors. In particular, these are the only diagrams that depict a circle with a full lens-shaped figure. All other diagrams in the text use half lenses for solid representations. The result of this is that these are the only diagrams that depict two parts of a circle that is cut by a base circle on the same side of the base circle. This is contrary to a fairly persistent, and useful, encoding—namely, that the inside and outside of a circle in the figure represent the two parts of the sphere divided by the circle.
All of these problems are resolved in the diagrams of the Arabic, Latin, and Hebrew traditions of the text. 59 As a representative for all of these traditions we may look at the diagram in Leiden or. 1031, 60 probably from the 13th century, containing a copy of Thābit ibn Qurra’s version of the treatise, which edition is probably the stepping off point for all of the other medieval versions in the secondary transmission. 61
This particular diagram has a couple of purely visual copying errors, or choices, that do not distract from its obvious advantages. In particular, hāʾ (Ε) has been placed near the false crossing of the small circle with the diameter, whereas it should probably be free-floating on the arc of the circle; and the line bāʾ-dāl (ΒΔ) appears to be a chord of the small circle, whereas it should be a diameter (Figure 17 (Right)).
The superiority of these diagrams, however, is more significant. In such a diagram, it is clear at a glance that the smaller circle represents a small circle, and that its center is not the center of the sphere, which is labeled with ḥāʾ (Η). Moreover, it avoids the use of a full lens-shaped figure, so that the two arcs of the small circle are depicted on different sides of the great circle, following the standard encoding used elsewhere in the text. The overall result is a diagram depicting global objects that are both external and internal to the surface of the sphere, using a plane representation—moving these diagrams from Group VII to Group V. Such a change would mean that all of the diagrams of Spherics I would be plane diagrams, which would better fit the overall pattern of this book. 62 Indeed, these diagrams appear to have been quite resilient to the vicissitudes of transmission, because they are mathematically, although not necessarily visually, correct in all of the medieval manuscripts that I have seen.
In fact, when we consider their advantages and their compatibility with the style of the other diagrams, it might be tempting to conjecture that these were the original diagrams, which were then mistakenly copied in the ninth century by unknown scholars working in Greek, while the Arabic translators copied the diagrams correctly. Indeed, this was my original view, because I found these images to be better suited to the overall style of Spherics I and its diagrams. It was only after I had developed a better sense of the types of interventions that Thābit was likely to make in the texts he revised that I began to suspect that he might have introduced such changes himself. Furthermore, I do not think that the historical evidence, as it stands, warrants the belief that the original Greek diagrams were of the sort that we find in the secondary transmission and then were corrupted to what we find in the current Greek manuscripts. That is, if there were any tendency of the copyists to render the full circle incorrectly as a lens-shaped figure, we would expect there to be some example of this error in the many copies and translations from Arabic to Latin and Hebrew, and then into the early modern printed editions. 63 But we do not find such a transition. In fact, the full circle appears to be highly resilient to deformation, so that it was much more likely to have been introduced by a mathematical scholar such as Thābit, who is known to have introduced improvements to both the texts and diagrams of the works he corrected, than to have resulted from transmission errors. Indeed, there are a number of indications that Thābit was willing to intervene in the mathematical texts that he edited—introducing changes and corrections to arguments and figures where he thought best, 64 making it most likely that the differences between these diagrams in the Greek manuscripts and in all other medieval traditions derives from Thābit’s edition. Hence, it seems probable that Thābit regarded these diagrams as improvements introduced in order to replace faulty figures in Greek sources, which were clearly susceptible to errors. If, in fact, Thābit did correct these diagrams, he may have seen himself as returning them to a form that is more consistent with the principles found in the other diagrams.
Finally, even if the Arabic diagrams were produced by a pure copying error, the fact that they continued to be used by scholars like al-Ṭūsī and his younger contemporary Campanus, both of whom demonstrate a solid understanding of the mathematical contents of the text, indicates that these diagrams were regarded as perfectly satisfactory by mathematical scholars of the medieval period.
Theodosios’ visual encoding of geometric information
Having discussed a number of examples of the various design decisions involved in producing the ancient and medieval diagrams of the Spherics, we are now in position to consider the various ways that Theodosios, and the scholars who studied and transmitted his text, encoded visual information in these figures. As pointed out by O. Neugebauer and M. Malpangotto, the most conspicuous division among the diagrams is that between those appearing to be planar and those appearing to be solid, (3a) or (3b). 65 It is also the case that the major differences in the ways in which visual information is encoded in the diagrams divides along this dichotomy as well.
Although the planar diagrams, (3a), may initially seem unusual to some modern viewers, they can be used to visually convey information about the geometric relationships of the object. 66 In these diagrams, a circle in the spherical surface is represented with a circle or an arc in the figure, and any intersection between such objects in the diagram represents an actual intersection—there are no false crossings between these objects (Sph. I.11–I.15, I.17, I.19–I.21, II.3–II.6, II.9, II.13–II.16, II.22, II.23, III.1–III.4, III.13). Two great circles bisecting one another are represented with a pair of equal circles that cut each other into two pairs of pairwise equal arcs that are themselves unequal, so that proportionality of arc length is not preserved (Sph. I.11, I.12, I.17, I.20, I.21, II.13). Parallel circles are encoded with concentric circles (Sph. II.1, II.2, II.4, II.8, II.10, II.13, II.15, II.16, II.22, II.23). Tangent circles are encoded by circles that touch one another, internally or externally (Sph. II.3–II.8, II.13–II.16, II.22, II.23). A circle can be understood to divide the plane into two regions, or sides, inside and outside, just as a circle in the sphere divides it into two parts (Sph. I.11–I.15, I.17, I.19–I.21, II.1–II.3, II.10, II.13–II.16, II.22, II.23). In terms of spherical astronomy, in planar diagrams the horizon is depicted as the primary circle of the diagram, the base circle, inside of which is depicted the visible portion of the celestial space (Sph. II.22, II.23). 67
Some of the planar diagrams with both intrinsic and extrinsic objects, (3a) and (1a), appear to convey a sense of depth, which comes close to being a perspective drawing (Sph. I.1, I.7–I.10, I.16). 68 Because the primary circle is depicted with a circle and not an ellipse or a lens-shaped figure, however, we can also understand these as simply depicting all of the objects laid out flat in the plane of the diagram, and categorize them as planar, as opposed to solid. In these diagrams, circles on the sphere are depicted with circles and circular arcs in the plane, while solid objects are depicted with straight lines, which allows for the depiction of three-dimensional figures such as triangles drawn in the plane of the diagram, although angles are not preserved (Sph. I.1, I.6–I.10, I.17, I.18(1st), I.19(1st), II.3, II.5, II.9, II.15, III.3, III.4). The relationship between a circle in the sphere and its axis is depicted with a circle in the plane of the figure and the radius or diameter of the circle extended as a secant line, producing a false crossing with the circle (Sph. I.1, I.2, I.6–I.10, I.16, I.19, II.1, II.2). 69 The common diameter of a pair of intersecting great circles is represented with the chord joining the intersection of the two equal circles in the plane (Sph. I.11, I.12, I.17).
The other major category of diagrams, which appear to be solid, (3b), are introduced initially for the three theorems Sph. I.13–I.15, as discussed above, but then do not reappear until again until Sph. II.17. Following this, they are then used for the rest of the treatise with the exceptions of Sph. II.22, II.23—and possibly III.13, because these diagrams might be interpreted as either solid or planar.
The most conspicuous feature of solid diagrams is that they convey a visual impression of the sphere, although, as mentioned, the outer circle of the diagram is not the sphere itself, but a great circle in it, which we call the base circle. 70 When interpreted from the perspective of spherical astronomy, the base circle can usually be understood to represent the horizon, inside of which the visible portion of the celestial sphere is depicted (Sph. II.17–II.20, III.5–III.11, III.14). In another configuration, the base circle is best interpreted as the solstitial colure (Sph. III.12).
In solid diagrams a bundle of parallel circles is encoded with a set of half-lenses facing the same direction—that is, arcs of concentric, or nearly concentric, circles (Sph. II.17–II.20, III.5–III.8, III.11, III.12, III.14). In a few cases, as well as the primary bundle of parallels that is depicted with concentric arcs or half-lenses, another parallel, drawn around the pole, is depicted with a full circle about a different center, either entirely inside the base circle, or cutting it (Sph. III.7, III.8, III.12, III.14). With the exceptions of Sph. I.13–I.15, which do not support this encoding as discussed above, the part of the sphere on the other side of the primary great circle is always depicted outside of the base circle, following the convention developed in the diagrams using a surface representation (Sph. II.17, II.19, III.12). In solid diagrams a pencil of great circles that passes through the pole of another great circle can be conveyed with a set of large circular arcs each one of which passes through a single point and stands upright on a large half-lens that is orientated horizontally and represents the great circle through whose pole the pencil passes (Sph. III.6, III.9, III.10). A pencil of great circles that are tangent to the same parallel circle and, hence, are inclined at the same angle on the greatest of the parallels can be conveyed by a set of circular arcs of large circles that meet the parallel circle that is represented with a full circle and stand on a large half-lens orientated horizontally (Sph. III.7, III.8, III.12, III.14).
An important subcategory of solid diagrams are those that are also global and show both intrinsic and extrinsic objects, (VII, 1a, 2b, 3b). These diagrams show both surface and solid objects and have the appearance of an articulated or armillary sphere (Sph. I.13, I.14, I,15, II.17, III.11). These diagrams depict the diameters of small or parallel circles, as well as some other internal objects. Although there are few diagrams of this type in the Spherics, there are some more in Theodosios’ Habitations. Since, however, there are no texts of ancient spherics that have this sort of diagram by any other ancient author, it is possible that Theodosios deliberately chose them. As discussed above, these diagrams produce a strong sense of visual depth, and come close to being the same as perspective diagrams, which makes it clear that the choice to switch between planar and solid diagrams was a deliberate design strategy.
Conclusion
The fact that the diagrams for Sph. III.5 and III.11 (as seen in Figures 13 (Right) and 15 (Right)) are so close to what we might produce using techniques of linear perspective is a clear indication that where Theodosios presents figures using a different visual code he does so intentionally. Indeed, we can take the fact that the planar diagrams of the Spherics were circulated and apparently often understood throughout the medieval period as another indication that the visual culture of the premodern mathematical sciences was different from that which developed slowly throughout the early modern period. 71 It seems that despite the fact that copyists introduced errors of symmetry in transmitting diagrams, they were operating in a visual culture in which graphical symmetry was not meant to impose specifications on the universality of the objects depicted. 72 The manuscript and papyrological evidence from ancient and medieval sources in a range of different languages and cultures make it certain that aspects of overspecification and indifference to visual accuracy was a recurring feature of the pre-modern diagrams.
When we consider the issue of whether or not the diagrams of the manuscripts exhibit overspecification, we may be interested in the question of authorial intention. That is, we might be interested to know whether Theodosios, or any other Greek mathematician, intended that the diagrams be overspecified, or if the overspecification that we now find is only the result of transmission errors. 73 In fact, I think that we will never recover the diagrams designed by Theodosios at a sufficiently detailed level to make determinations about his intention. This is because even if he had produced diagrams that use the same sorts of conventions to which we have become accustomed in order to try to convey ideas about generality, these would be quickly lost in the visual culture through which these diagrams were read and transmitted. In fact, our evidence suggests that few people would have ever seen such diagrams, because they appear in almost none of our sources. Nevertheless, many readers in the medieval period understood the diagrams that were transmitted in the sources; as can be seen from the fact that they modified and corrected them in various ways. Hence, it is useful to try to understand the diagrams that were transmitted in the ancient and medieval sources, and to see if we can discover what sorts of information these diagrams were understood to convey.
If we abandon the idea of uncovering the original authorial intention when producing an edition of manuscript diagrams, then it makes sense to produce an image that is based fairly closely on the evidence from the manuscripts. For example, when preparing a diagram for Sph. I.6 (Figure 1), we cannot now know whether or not Theodosios would have included the unnecessary symmetry discussed above or used skew lines. Hence, it is reasonable to use the diagram from the manuscripts, since it is mathematically sufficient and was clearly understood during the medieval period. Indeed, this is what was done by the modern editors of the text. For some texts, it may make sense to make a more or less diplomatic edition on the basis of a single manuscript, as Czinczenheim did with Vat.gr. 204. 74 As was noted in this paper, however, the diagrams in Vat.gr. 204 have numerous errors, and this is true of the diagrams in most medieval manuscripts. Moreover, an increasing number of important manuscripts are now available for viewing online in color images. Hence, it may be more useful to create a corrected edition of the diagrams, and encourage the interested reader to consult the original sources.
In order to do this, however, we need to develop a list of the sorts of errors that tend to accrue in the transmission. For example, there are the sorts of mathematical errors that have been studied by Raynaud, 75 the errors of symmetry discussed by Acerbi and Carman, 76 and the shifting errors of nearby objects being drawn as meeting and letters being set near intersections and false crossings that they do not label, as discussed in this paper. Although these sorts of errors are often not governed by well-understood rules such as the philological errors that are encountered in editing texts, recognition and correction of these graphical errors can help us produce the sorts of diagrams that a knowledgable medieval reader or editor might have produced.
When making a translation for the general reader, however, it may be justifiable to change the diagrams significantly, so as to make them more intelligible to the intended readers. For example, in translating the Spherics there might be times when it makes sense to present the diagram that accompanies the translation in linear perspective. 77 This can especially be useful if the original diagrams are made available to the reader, or can readily be found in other sources. For example, we might present corrected medieval diagrams in the translation itself, and complement these with perspective diagrams in commentaries and other surrounding material. 78 This is because the goals of a translation for general readers may be broader than those of historical scholarship.
Footnotes
Acknowledgements
This paper originated in a collaborative project with R.S.D. Thomas, in which we translated and studied Theodosios’ Spherics. A number of passages in this paper are also used in the book that resulted from that work. I want to thank Robert for our many communications on the text, its translation, and interpretations, and for his detailed comments on a previous version of this paper. I presented these ideas at a workshop organized jointly between three research projects in the history of science: “Diagramming Scientific Knowledge” at Daejeon, Seoul, “Visualization and Material Cultures of the Heavens,” at the Max Planck Institute for the History of Science, Berlin, and “DISHAS / diagrams,” in Paris. I would like to thank the organizers for inviting me and everyone involved for their valuable feedback on my presentation.