



Abstract
How does polling information, the polling source, and how it is presented influence strategic voting? Few studies capture at what point individuals become strategic voters or how polling information affects this behavior. Furthermore, strategic voting research in mixed member systems remains largely confined to aggregate district level analyses. This analysis employs an experimental survey implemented in South Korea, Taiwan, and Japan. The results suggest that reminding respondents of the margin of error encourages strategic behavior, while polls originating from partisan sources discourage defection.
Introduction
As one of the seminal works in political science, Duverger’s Law (Duverger, 1954) expects two-party competition in single-member districts (SMDs). This is in part as a result of strategic voting, as voters defect from their first preference and vote for their second choice if they perceive their first is unlikely to win, avoiding the so-called wasted vote. While a large amount of literature tackles strategic voting in democracies young and old, most rely on aggregate data or survey data on split-ticket voting to infer individual level behavior. In contrast, little evidence, especially outside of western democracies, explicitly links when individual voters shift from sincere voters to strategic voters.
The three East Asian democracies—Japan, South Korea, and Taiwan—all employ a mixed member electoral system, allocating seats in SMDs and by proportional representation (PR) within the same legislative chamber. Unlike the mixed member proportional systems of Germany and New Zealand, all three are mixed member majoritarian where district competition takes priority over the party list, thus often behaving more like pure majoritarian systems. Furthermore, despite concerns that the presence of PR seats discourages strategic incentives in districts (e.g., Herron and Nishikawa, 2001), the East Asian cases remain more consistent with two-party district competition, with over 85% of the district vote captured by the winner and runner up (see Table 1). However, individual evidence of strategic behavior in these remains elusive.
Average percent of district vote won by top two candidates per year.
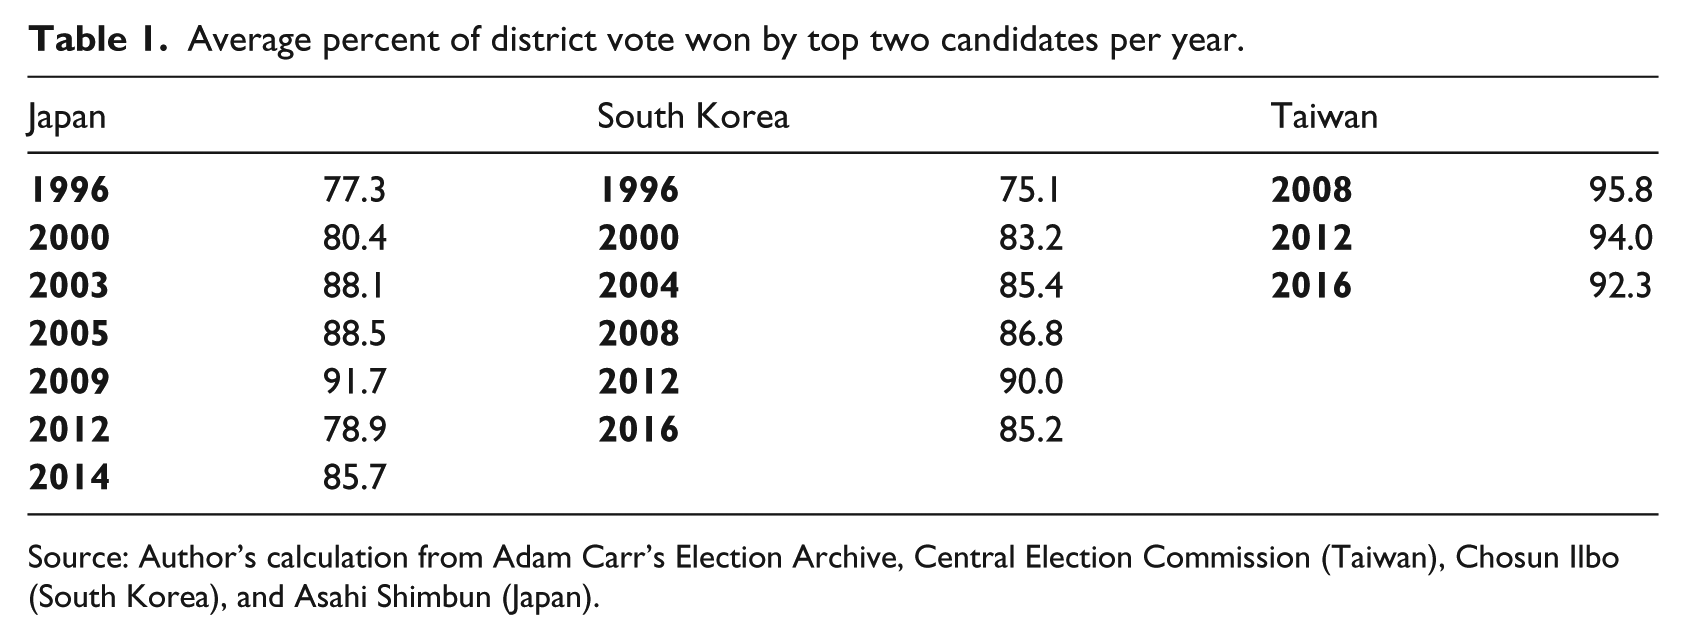
Source: Author’s calculation from Adam Carr’s Election Archive, Central Election Commission (Taiwan), Chosun Ilbo (South Korea), and Asahi Shimbun (Japan).
Focusing just on the East Asian cases with their broad similarities allows for an indirect means to control for contextual factors that may potentially influence strategic voting across countries. All three use a mixed system format that allocates more seats in SMDs than by PR, and despite limited salience historically compared with western democracies, ideological distinctions on a left–right schema and public identifications of such distinctions are increasingly the norm.
In addition, all three have used the single, nontransferable vote either for legislative elections or for other elected offices, and thus voter experience with multiple winners in district competition may deter strategic defection. While the length of experience with democracy and with SMDs within a mixed system varies, the literature on Duverger’s Law says little about time other than an expectation that over time voters gain clearer expectations on how votes translate into seats.
Building from earlier work on strategic voting in East Asia (e.g., Ji, 2008; Niou and Paolino, 2003; Su and Sha, 2007), this article employs an innovative experimental design embedded within nationally oriented web surveys. Through experimental design, I can arrange a situation in which all respondents have the capacity and incentive to vote strategically. This design tests the role of polls in the strategic voting calculus as well as two separate items: the margin of error and the source of the polls (one’s preferred candidate, a non-partisan source, and one’s least preferred candidate). An embedded experimental survey overcomes a common criticism of experimental designs in social science: that they rely on a small sample usually limited to college students (e.g., Mutz, 1992). Furthermore, few experimental designs attempt cross-national comparisons.
This paper first presents a literature review on strategic voting, connecting this to mixed systems and East Asia more specifically. The conditions for strategic voting, factors that influence strategic voting, and hypotheses follow. Descriptive analysis shows a clear progression on strategic voting, although a sizable percent of respondents remains sincere voters even under conditions where strategic voting would be expected. Regression analysis finds that both mentioning the margin of error and the partisan source of polls influence strategic voting. Lastly, this article presents means to expand our understanding of Duvergerian pressures.
Strategic voting
Strategic voting occurs when voters support an alternative to their first preference, as they expect that their first choice will not win, and as an attempt to maximize the likelihood of preventing their least preferred option from winning (e.g., Blais et al., 2006; Cox, 1997; Fisher, 2004; Merolla and Stephenson, 2007). Much of this literature focuses on strategic voting in systems comprised of SMDs due to the institutional constraints incentivizing strategic behavior among those who prefer smaller parties (e.g., Duverger, 1954; Shively, 1970). Meanwhile the literature on mixed systems—those combining SMDs and PR within the same legislative house—increasingly suggests that the presence of the PR seats discourages the expected strategic incentives within district competition (e.g., Choi, 2006; Ferrara et al., 2005; Herron and Nishikawa, 2001).
How to measure strategic voting is contested, with diverse approaches in the literature; from game theoretic models (e.g., Myerson and Weber, 1993; Palfrey, 1989), to laboratory experiments (e.g., Duffy and Tavits, 2008; Eckel and Holt, 1989; Forsythe et al., 1993). The literature on mixed systems usually relies on indirect evidence. One approach, used in mixed and pure systems alike, assesses strategic voting through aggregate district results (e.g., Cain, 1978; Johnson and Pattie, 1991), which faces the ecological inference problem (Achen and Shively, 1995). Spenkuch (2013) goes a step further, comparing party list and district votes in Germany at the precinct level, finding approximately a 35% defect from their first choice. A more common indirect method in mixed systems uses ticket-splitting (e.g., Banducci et al., 1999; Burden, 2009; Gschwend, 2007; Moser and Scheiner, 2009; Plescia, 2017); however, this measure potentially suffers from self-reporting bias and ignores the myriad of motivations influencing ticket-splitting separate from strategic factors (e.g., Hirano, 2006; Karp et al., 2002; Pappi and Thurner, 2002) or that rates of split-ticket voting vary widely even within a country. For example, wide variation in ticket-splitting, whether due to strategic or other factors, is evident in the literature on South Korea’s mixed system (e.g., Han, 2013; Kim, 2006; Lee, 2004; Park, 2005; Park and Ryu, 2009; Rich, 2012).
Despite the problems in inferring strategic intent in mixed systems, remarkably few studies to date directly tackle strategic voting at the individual level by asking questions explicitly related to strategic voting. Thus, it remains unclear when strategic incentives convert what would be a sincere voter into a strategic voter. In many respects the reason for this limited attention on individual voters in East Asia is mirrored elsewhere using SMDs. As with Democrats and Republicans in the United States of America, for Taiwan’s Democratic Progressive Party and Kuomintang supporters, South Korea’s Saenuri and Minjoo Party supporters (prior to the former’s split into the Liberty Korea Party and Bareun Party following President Park Geun-Hye’s impeachment), and Japan’s Liberal Democratic Party and Democratic Party of Japan, such partisans are unlikely to face a situation in which to consider casting a strategic vote. For example, pre-election survey data from Japan’s Japanese Election Survey (JESIII) indicated 78.4% of respondents intended to vote a straight-party-ticket. Combined with smaller parties often opting not to run candidates, we should not be surprised when strategic voting rates appear low within the general public. Most research suggests between 5 and 15% of voters in SMDs cast a strategic vote (See Alvarez et al., 2006; Meffert and Gschwend, 2011).
More broadly, several conditions are necessary for strategic voting to occur (e.g., Acevedo and Krueger, 2004; Darmofal, 2010), conditions which are often absent for many voters in particular electoral contexts (e.g., Bawn, 1999). Voters must see an acceptable alternative to their first choice, have information about candidate viability, and believe that switching their vote choice can influence the outcome of the election (e.g., Blais and Turgeon, 2004; Cox, 1997; Kselman and Niou, 2010). Considering that the public is often ill informed (e.g., Campbell et al., 1960; Converse, 1964), these requirements may not be met.
The assumption remains that polling data also influences casting a strategic vote (e.g., Blais et al., 2001; Karp et al., 2002), although the specific mechanism is unclear. That polling information may also encourage non-strategic behavior complicates identifying strategic intentions. For example, polls may also encourage band-wagoning or momentum effects, where voters notice increased support for a candidate and simply support the frontrunner (e.g., Bartels, 1988; Marsh, 1985; McAllister and Studlar, 1991). Band-wagoning is particularly difficult to measure in aggregate data as it can be canceled out by underdog effects, where voters intentionally support a candidate unlikely to win (Traugott, 1992). Similarly, if voters are unaware that their preferred candidate is non-viable, perhaps due to the lack of reliable polling data available, then voters are unlikely to defect from their preferred candidate. Furthermore, younger democracies with non-scientific polling and voters with limited information about candidates may lead to false expectations. For example, Su and Sha (2007) found that roughly 36% of polls regarding Taiwan’s 2000 presidential election suggested a victory by Lien Chan, who ultimately finished third, suggesting the inaccuracy of polling samples.
Experimental works find that despite absent polling data, elections do not conform to Duvergerian outcomes (e.g., Forsythe et al., 1993), yet the availability of polling information largely leads to results in line with Duverger (e.g., Endersby and Shaw, 2009; Meffert and Gschwend, 2011). However, the growing literature employing experimental designs (e.g., Bassi, 2008; Hizen et al., 2010; Petersen et al., 2011) focuses more on whether aggregate outcomes approximate Duverger’s Law rather than individual strategic behavior.
Even under otherwise ideal conditions, the presentation of electoral competition potentially influences strategic voting. After all, media coverage and claims by pundits are not constrained by professional polls (e.g., Donsbach and Weisbach, 2005) and voter expectations remain a combination of factual information and preference projections (e.g., Blais and Bodet, 2006; Gimpel and Harvey, 1997; Meffert and Gschwend, 2011). Likewise, the role of framing to appeal to emotions or otherwise shift the focus of electoral decision making has been widely acknowledged (e.g., Druckman, 2001; Slothuus, 2008; Tuchman, 1978), yet not addressed directly within the strategic voting literature. The role of partisan cues has also received extensive coverage in developed and younger democracies (e.g., Chaiken, 1980; Kam, 2005; Lau and Redlawsk, 2001; Samuels and Zucco, 2014), yet little of this has been extended to strategic voting. For example, Gasperoni and Mantovani (2015) found that in a simulated election campaign, only a tenth of Italian voters exposed to negative polls regarding their preferred candidate switched votes, with similar results found on strategic voting in South Korea (Kim and Kim, 2000).
Both polling framing and partisan cues would seem salient, particularly in influencing voters otherwise on the fence in regards to strategic defection from their preferred candidates. For example, information that reminded voters of the hurdles to their candidate winning should logically encourage strategic voting, even if voters frequently overestimate their preferred candidate or party’s likelihood of success (e.g., Mutz, 1998). Voters in democracies with stable party systems can also infer that in most cases small parties that have consistently performed poorly at the ballot box are likely to do so again in the future. In the absence of such background knowledge, voters would be expected to seek additional information to identify candidate viability.
Although various sources could be consulted to identify viability, the assumption here is that information within polls remain the most frequent heuristic for voters. Attention to the margin of error or the historical records of candidates trailing in pre-election polls potentially plays this role of discouraging wasted votes. Polling literacy varies considerably in most populations and many likely ignore margins of error when typically viewing polling information, especially if their candidate is in the lead. Research also shows the extent in which news reports fail to properly mention aspects such as the margin of error (e.g., Anderson, 2000; Larson, 2003).
However, supporters of trailing candidates should be more willing to seek out evidence of their candidate’s electoral viability, and polls along with the margin of error provide such additional information. Similarly, reminding voters of the track record of trailing candidates emphasizes the difficulty in turning campaigns around as the election looms near. For example, successful attack ads or the publication of a scandal commonly deals significant blows to a candidate, which are easier to overcome earlier rather than later in a campaign cycle. In both the presentation of margins of error and the historical record, the framing nudges voters towards earlier defection if one assumes the worst, perhaps reminding people of past experiences of supporting non-viable candidates that ultimately lost, or conversely promotes wishful thinking (e.g., Babad, 1995; Babad and Yacobus, 1993), although the latter rarely emerge in experimental designs (e.g., Bar-Hillel and Budescu, 1995; Price, 2000).
Within a strategic voting environment, partisan cues also serve as a convenient heuristic, especially in low-information contexts (e.g., Tversky and Kahneman, 1974). Knowing the party label and position for example potentially allows voters to infer the stances of individual candidates without investing the time and effort into identifying their platform. Engaged citizens with ideological leanings also frequently self-select news sources consistent with their political worldview. Building from works such as Chaiken (1980) and Goren et al. (2009); which focus on source cues, the assumption is that campaign information originating from one’s preferred party is more likely to be taken at face value, whereas voters receiving similar information from a rival party will discount its accuracy or importance. This should be relevant to the source of polling information during a campaign cycle, with voters more likely to focus on polls from their preferred party and discounting polls conducted by other parties. However, an alternative view would suggest voters place less attention on partisan sources overall, assuming that such polls, even from a preferred party, is somehow distorted or that the parties only release publicly favorable polling results.
Based on the existing literature, the following hypotheses are to be tested.
H1: Strategic defection should increase when voters are presented with information questioning their candidates’ continued viability.
H2: Strategic defection should decrease when voters rely on unfavorable polling information from their least preferred candidate.
H3: Strategic defection should decrease when receiving unfavorable polling information from partisan sources.
Research design
Rather than focus on the sliver of the population that meets the traditional requirements for consideration of strategic defection, this research design creates a context in which all voters should consider voting strategically. Building from the experimental research on strategic voting, this analysis uses an embedded experiment within a web survey, adapting a similar design developed for the American context (see Rich, 2015). The Taiwan survey was conducted through PollcracyLab (http://plab.nccu.edu.tw/) in the summer of 2015. South Korea and Japan surveys were conducted through Embrain (http://www.embrain.com/eng/intro/intro1.asp) in the fall of 2015. In total, 455 Japanese, 666 Korean, and 453 Taiwanese participants completed the survey (see Appendix). Pre-tests were conducted as a paper survey on a student population at National Chung Hsing University, producing 319 completed surveys in which respondents provided answers to all six polls. Data for the analysis are available online at http://timothysrich.com/documents/data/JAAS_Data.zip.
After a series of demographic and attitudinal questions, respondents were told that based on their answers, candidates in a hypothetical, legislative district election (Taiwan: Legislative Yuan; South Korea: National Assembly; Japan: House of Representatives) have been ranked based on their ideological proximity to the respondent: Candidate A being the closest, Candidate B in the middle, and Candidate C the furthest away. A more fine-grained measure of ideological distance was not presented, and the questions in fact had no influence on the ranking but were presented in this way as to encourage respondents to identify with the hypothetical candidates. Respondents were reminded that district competition will produce only one winner. Imposing a three-candidate race provided the minimum necessary for each respondent, if a rational voter, to at least consider a strategic vote. Despite district elections increasingly converging towards Duverger, additional non-viable entrants remain the norm in most districts in all three countries and thus a three-candidate district race would not in itself be unusual. For example, Taiwan’s 2016 Legislative Yuan election averaged 4.9 candidates per district (excluding aboriginal districts) and Japan’s 2014 House of Representatives election averages 3.2 candidates per district.
Furthermore, by stripping the party identification and names of the candidates, this design attempts to force respondents to rely solely on the information presented in the survey, rather than assume viability based on a party’s past electoral performance or unintentional cues based on the candidate’s name or gender that might influence perceptions of viability. Admittedly this research design potentially trades external validity for stronger control over the respondent’s conditions. In other words, this design attempts to provide the ideal conditions for strategic voting, nudging respondents towards at the very least considering alternatives. That strategic voting varies considerably even under these exacting conditions suggests the limitations of institutional influences on voting behavior. Respondents were then shown six sequential hypothetical polls in which Candidate A’s support decreases, further incentivizing a strategic vote for Candidate B. Table 2 provides the polling numbers presented to respondents in each poll.
Polls presented in survey (%).
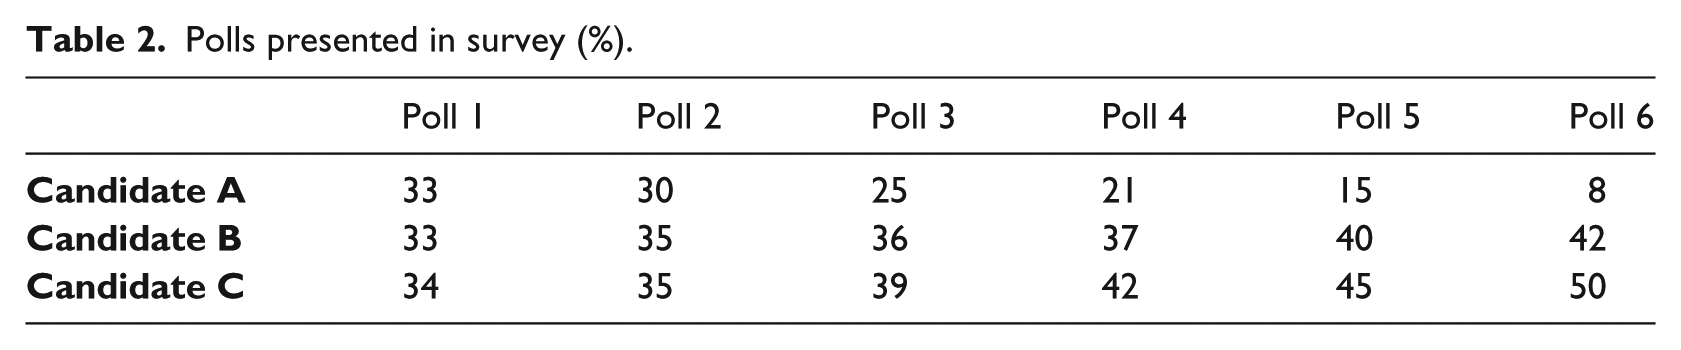
Prior to the first poll presented, respondents were randomly assigned to two separate treatments, and thus the contextual information provided was constant across the six polls other than the polling result itself. First, respondents were randomly assigned information regarding where the polling data originated, being told either that it came from a non-partisan source (the baseline), from Candidate A’s campaign (poll source A), or from Candidate C’s (poll source C).
The translated version of each treatment is shown below (italics added here for emphasis were not in the experimental survey itself).
Baseline version (poll source non-partisan): You will now be presented with polling data for this hypothetical election, six polls in total. All of these polls were conducted by a non-partisan polling center with no connection to the candidates. These polls are in chronological order, with the last poll being closest to the election date. Based on the poll results for each candidate, identify which candidate you would vote for in the election: Candidate A, Candidate B, or Candidate C. Candidate A version (poll source A): You will now be presented with polling data for this hypothetical election, six polls in total. All of these polls were conducted by a polling center connected to Candidate A’s campaign. These polls are in chronological order, with the last poll being closest to the election date. Based on the poll results for each candidate, identify which candidate you would vote for in the election: Candidate A, Candidate B, or Candidate C. Candidate C version (poll source C): You will now be presented with polling data for this hypothetical election, six polls in total. All of these polls were conducted by a polling center connected to Candidate C’s campaign. These polls are in chronological order, with the last poll being closest to the election date. Based on the poll results for each candidate, identify which candidate you would vote for in the election: Candidate A, Candidate B, or Candidate C.
Next, respondents received one of three prompts about the margin of error.
Version 1 (baseline): You will be presented with the first poll on the next page. Version 2 (margins): You will be presented with the first poll on the next page. The election polls presented have a margin of error of ± 3%. Version 3 (margins/history): You will be presented with the first poll on the next page. The election polls presented have a margin of error of ± 3%. Historically candidates behind by 10% or more in later polls did not win the election.
Admittedly, respondents may not entirely buy into the artificial nature of the experimental survey, and the expectation of respondents to synthesize information from six sequential polls does not capture the real-world time lag between exposure to individual polls.
Likewise, the steep decline in support across the polls may be rare in the real world. However, if respondents failed entirely to accept the scenario or worse, answered randomly, we would expect no version to reach statistical significance.
Analysis
Table 3 summarizes the rates of strategic and sincere voting in each poll, with a strategic vote defined as choosing Candidate B over Candidate A. In general, strategic voting increases with each poll, consistent with expectations. A slight decline is seen in poll 6 for Japan and South Korea, which may be due to respondents identifying that strategic voting still may not prevent a Candidate C victory. The results also show that a non-negligible percentage of respondents remain sincere despite strong institutional incentives and polling data that would encourage defection. In other words, despite a survey design inspired by Duverger’s Law, which should push all respondents towards strategic voting, a surprising percentage of respondents remain sincere to the very end. In Japan, part of this could be attributed to dual listing, where votes for losing candidates in district competition in part influence placement on the party lists for PR seats, but clearly such incentives would not apply to Taiwan and South Korea. Furthermore, a non-negligible percent opted to vote for Candidate C, counter to expectations on strategic voting and Duverger’s Law, but partially consistent with band-wagoning.
Rates of strategic voting in survey.
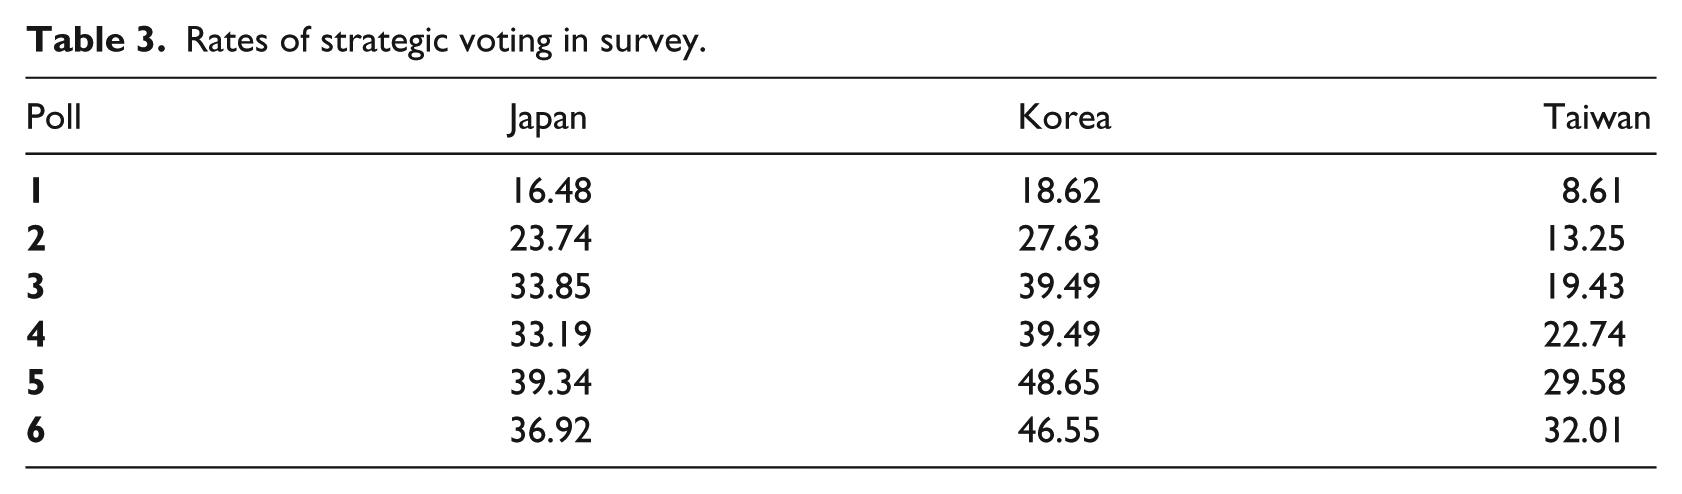
Figure 1 further highlights the extent of strategic voting within the survey experiments. In South Korea and Japan over a third (36.64% and 41.10% respectively) never casted a strategic vote, while 56.07% of Taiwanese failed to defect even once. At the other extreme, less than a tenth of respondents voted strategically across all six polls, ranging from 3.09% in Taiwan to 8.86% in South Korea. In other words, despite growing pressures to vote strategically, a surprisingly large set of respondents failed to do so.
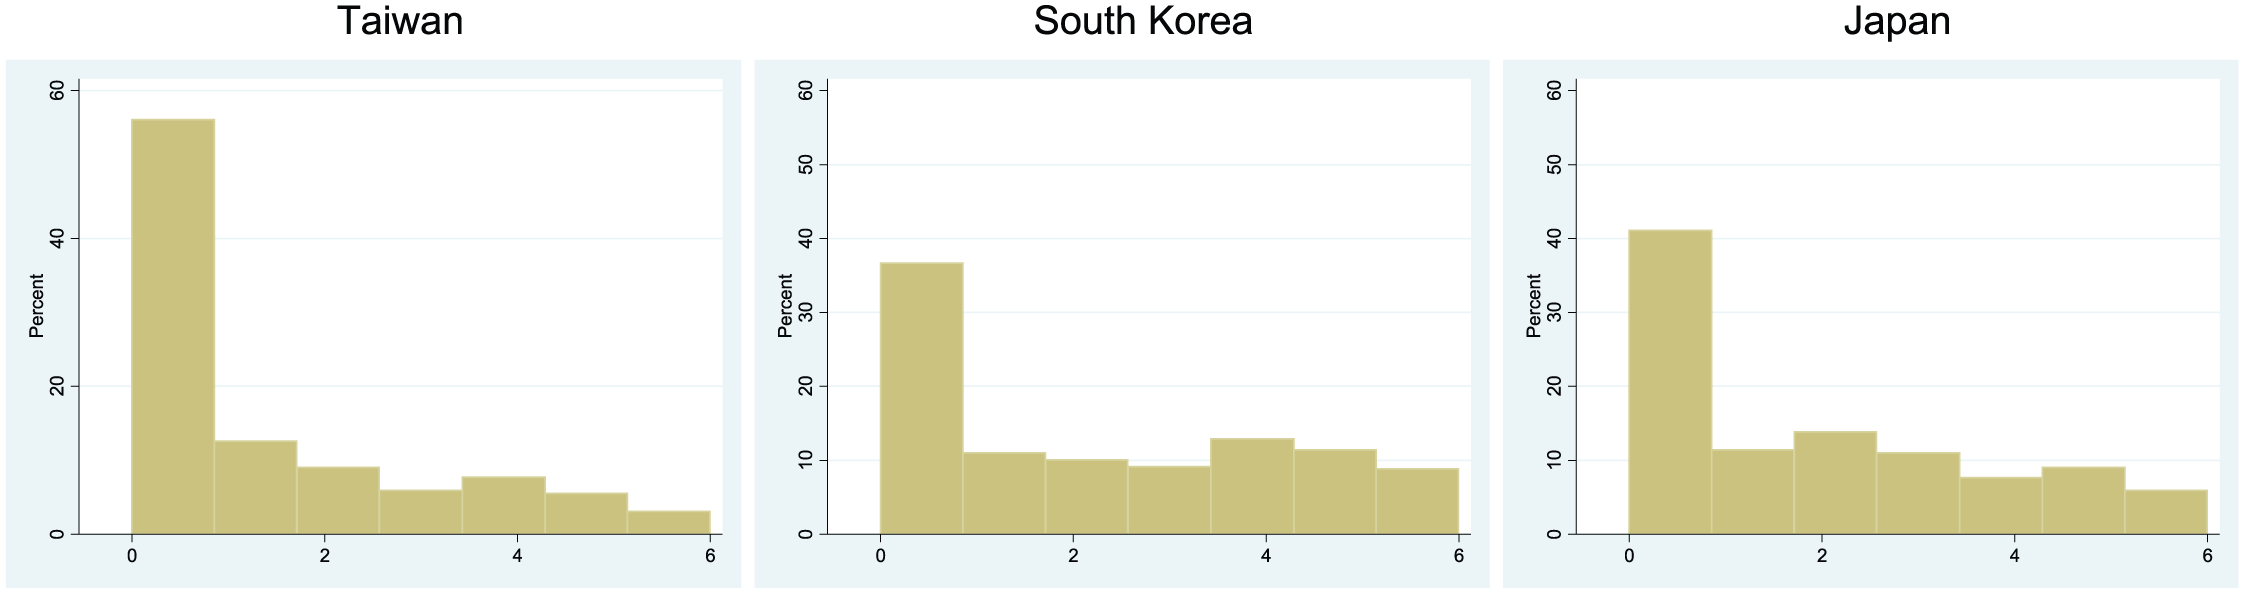
Histogram of number of strategic votes.
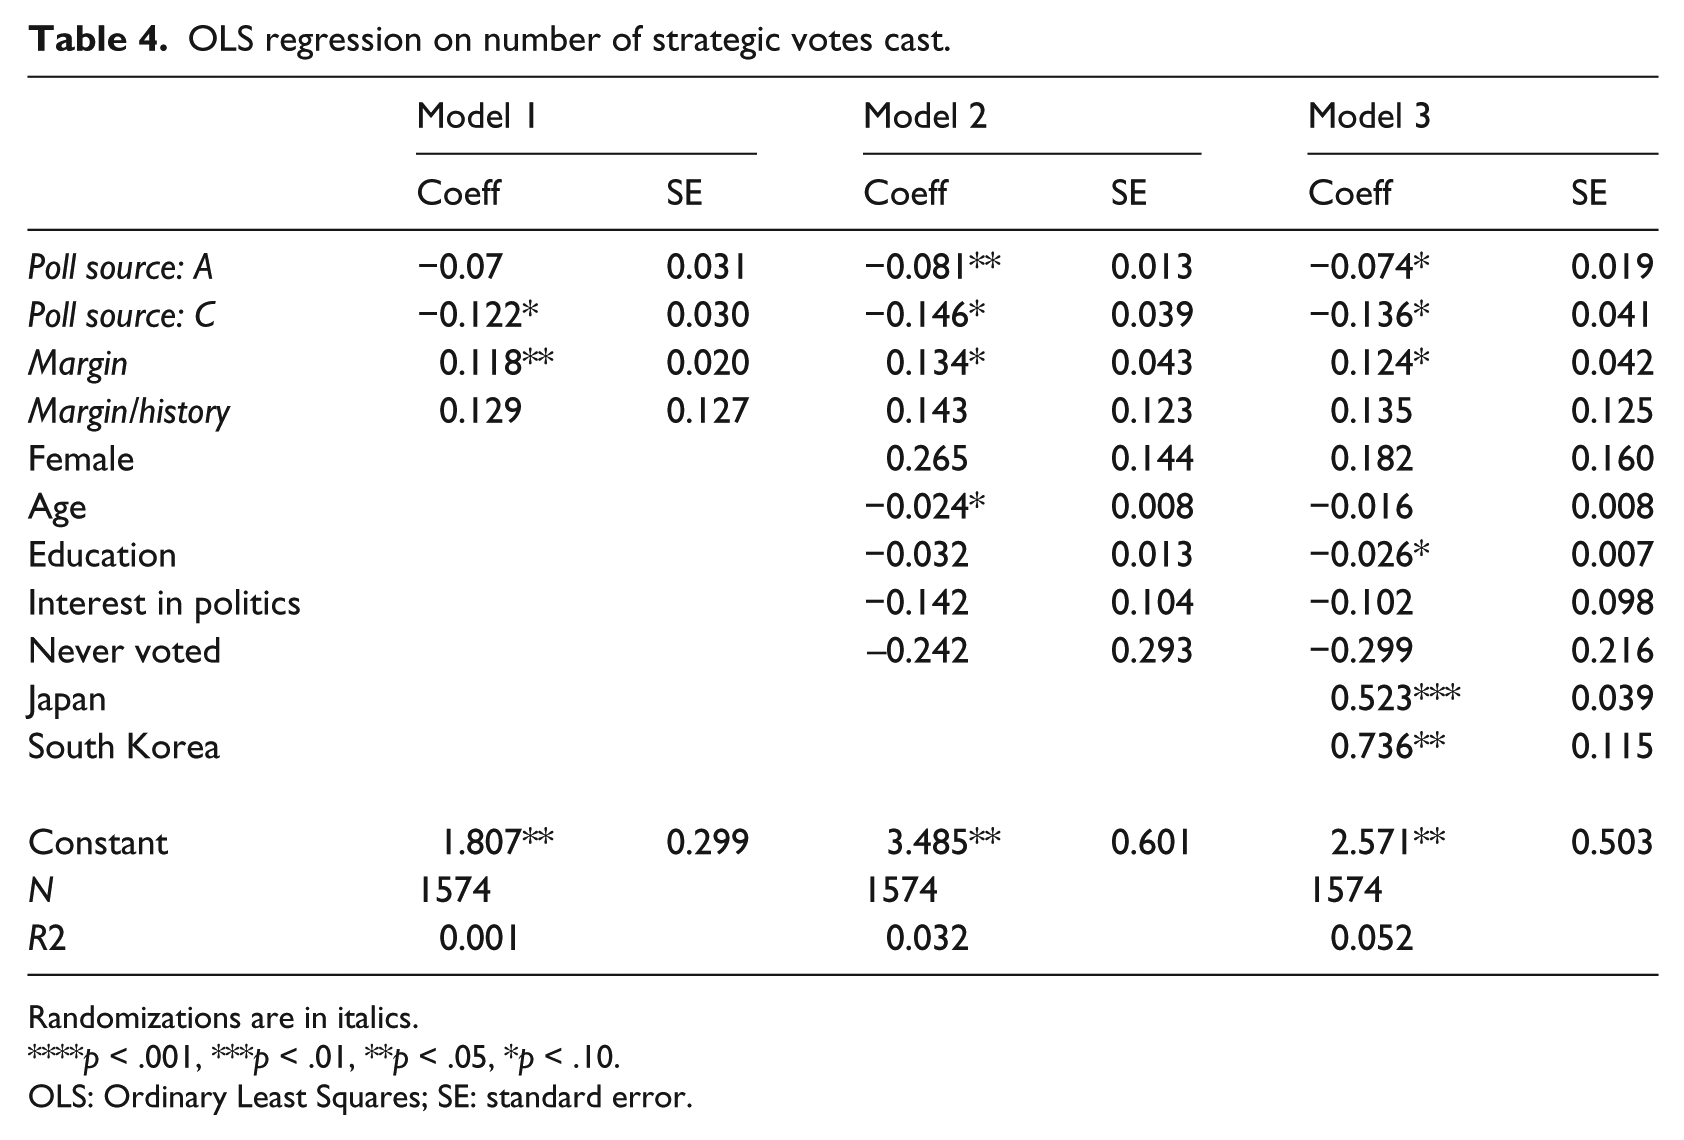
Next, Ordinary Least Squares (OLS) regressions, with clustered errors by country, evaluate the influence of framing within the surveys (see Table 4). The dependent variable measures the number of strategic votes cast over the six polls, ranging from zero to six. The first regression allows for a test of the first hypothesis through dummy variables for both of the prompts mentioning the margin of error (versions 2 and 3), leaving version 1 as the baseline. Additionally, the inclusion of dummy variables for both partisan polls (poll source A and poll source C), leaving the non-partisan version as the baseline, offers insight into the second and third hypotheses. The second model includes demographic controls for age and gender (female) as well as a dummy variable for those who stated they had never voted before, with the assumption that this segment would be less aware of candidate viability. The third model includes dummies for South Korea and Japan, leaving Taiwan as the baseline.
OLS regression on number of strategic votes cast.
Randomizations are in italics.
p < .001, ***p < .01, **p < .05, *p < .10.
OLS: Ordinary Least Squares; SE: standard error.
The base model finds that poll source C negatively corresponds with strategic voting while the mere mention of the margin of error encourages it, significant at .10 or stronger. Models adding controls for gender, age, and voting (model 2) and controls for Japan and South Korea (model 3) produce similar results, with poll source A also statistically significant. Furthermore, none of the demographic controls reach significance in models 2 or 3. Retesting using ordinal logit models (omitted for space) produced similar findings.
Additional specifications were tested for robustness (omitted for space). These included a seven-point liberal-conservative ideology variable as well as a five-point measure of satisfaction with politics in their country. Neither changed the key findings of the original models, although satisfaction negatively corresponded with strategic voting (p = .04). Concerned that the strategic incentives differ between polls 2–5 compared with the first (where Candidate A is in a virtual tie) and the last (where a strategic vote would be unlikely to change the outcome), models were tested that only focused on strategic votes in polls 2–5. Again, the findings were largely consistent with the original models, especially in terms of the correlations between both version C and the margins version and the number of strategic votes. The original model specifications were also tested using a negative binomial model, again with general consistency with the original models.
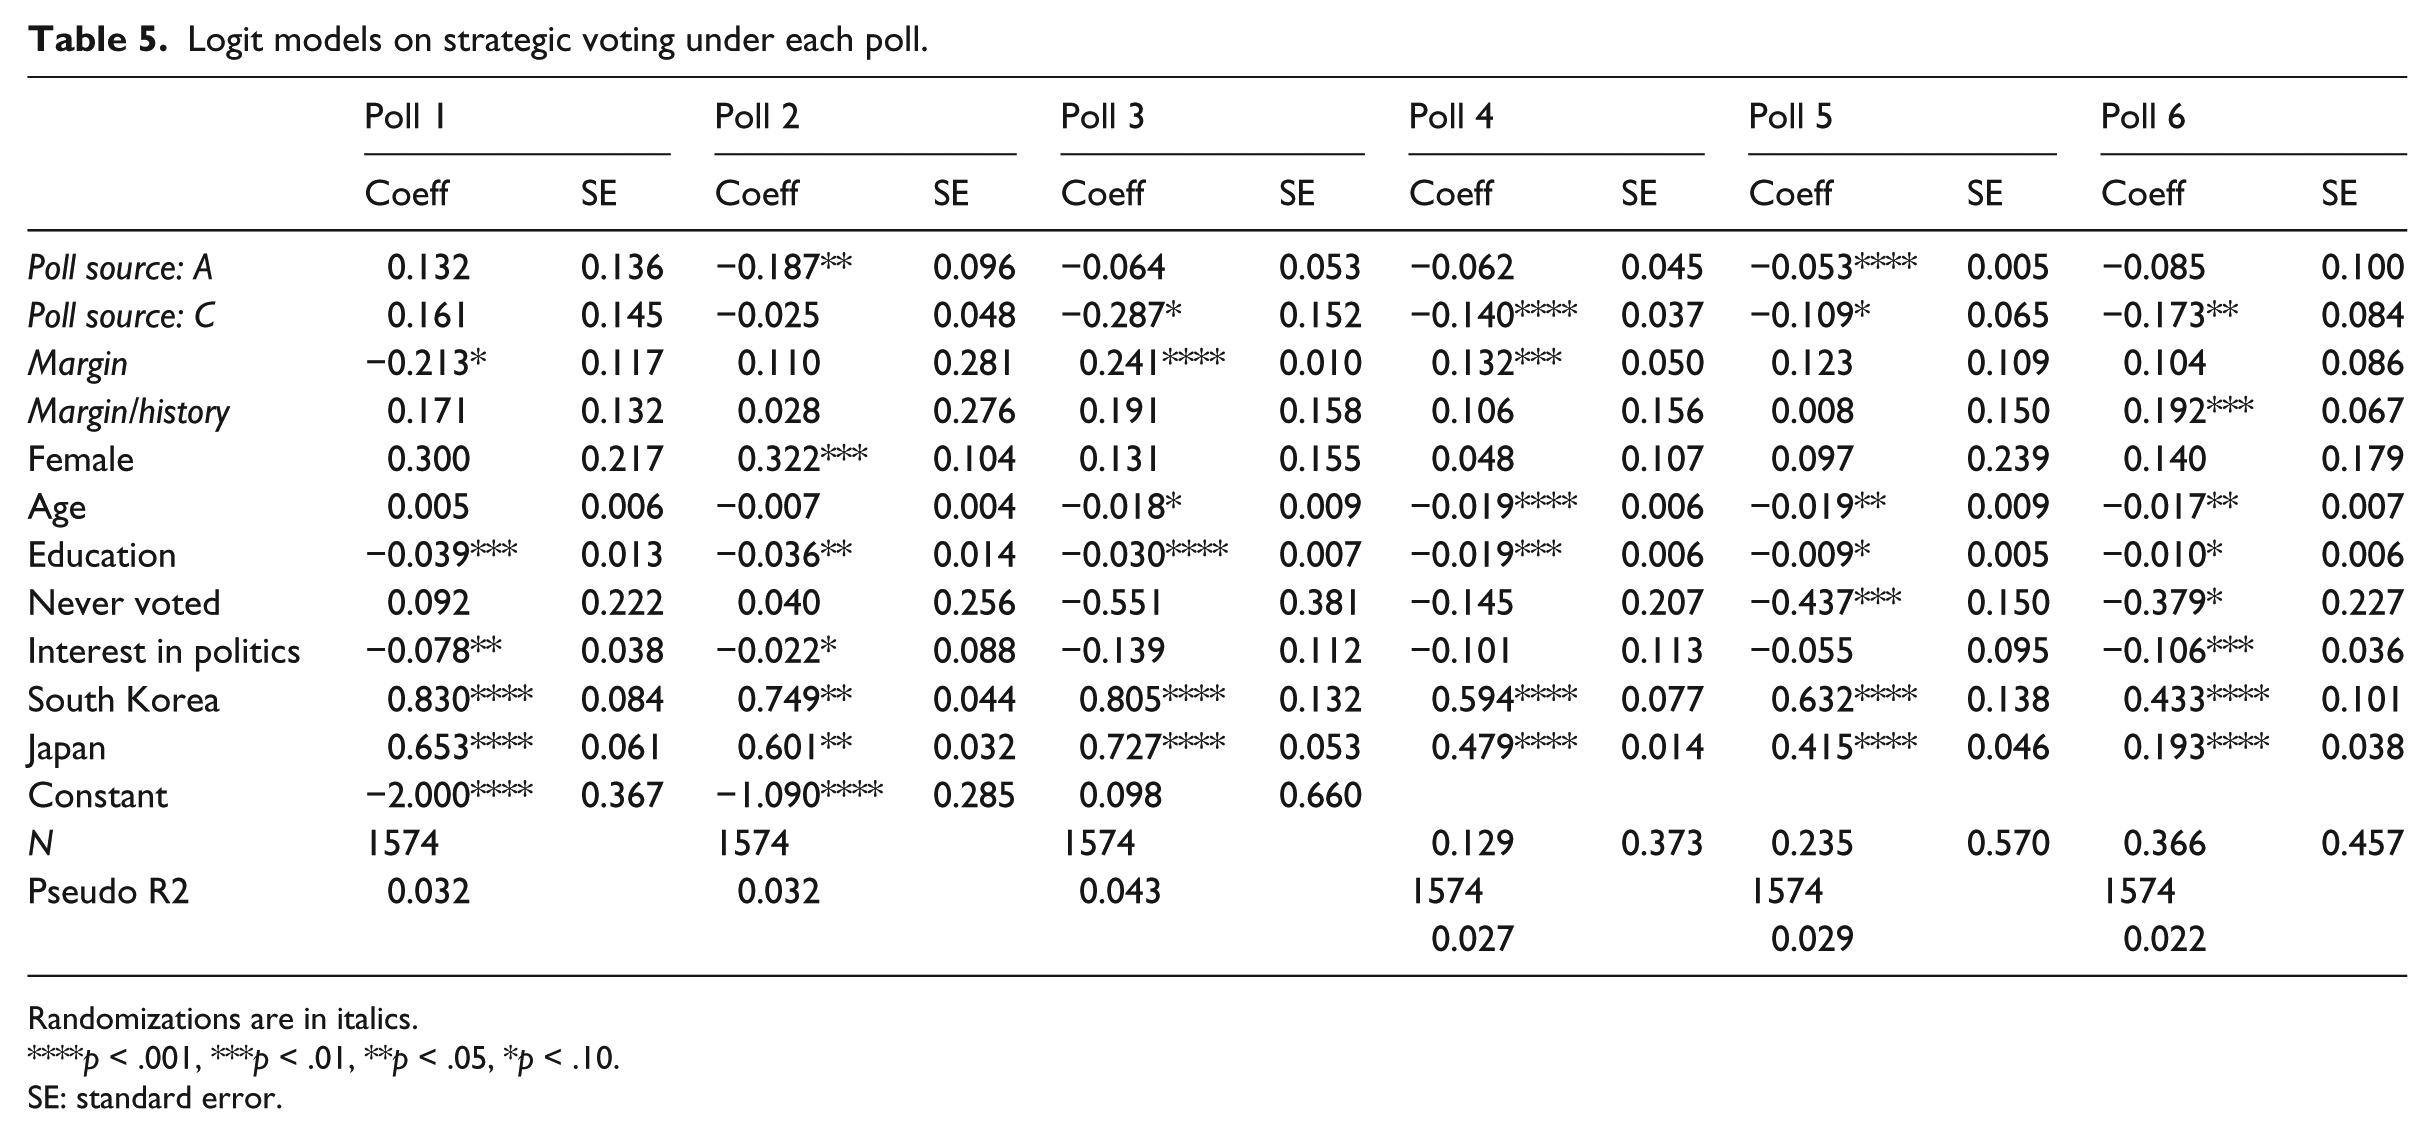
An additional set of models further unpack strategic voting. Table 5 presents individual logit models for each poll, using the same independent variables as the earlier extended models. Poll source A only reaches statistical significance in two models here, poll 2 and poll 5, negatively corresponding with casting strategic vote. In contrast, version C failed to reach significance in the first two models, negatively corresponding with strategic voting (at p = .10 or stronger) in all subsequent polls. Meanwhile, the influence of the margin of victory shifts over time, corresponding with less strategic voting in the first poll, but positively corresponding with strategic voting in polls 3 and 4 before failing to reach significance in the latter two polls. In addition, age and education also appear to depress strategic voting more clearly in these separate models, especially in models 3–6, than in the original analysis. An additional test (omitted for brevity) reduced strategic voting across the six polls to a binary outcome (0 = no strategic votes; 1 = one or more strategic votes). Again, version C negatively corresponds with strategic voting (at p = .05 or stronger).
Logit models on strategic voting under each poll.
Randomizations are in italics.
p < .001, ***p < .01, **p < .05, *p < .10.
SE: standard error.
Overall, the findings suggest that not only does unfavorable polling data encourage strategic voting, but that polling literacy and partisan cues about polling data influence this behavior.
The presentation of the margin of victory encouraged strategic behavior, consistent with H1. Admittedly, the randomization on the margin of error may be priming responses as attention is seldom placed on this factor within media coverage. Nevertheless, the findings suggest that wishful thinking does not emerge due to the presentation of margins. Rather, respondents appear to consider the gap to be larger than what is presented. Furthermore, polls presented as originating from Candidate C’s campaign were less likely to motivate strategic voting, with the largest negative coefficient of the experimental versions, which was consistent with H2 and expectations that voters discount campaign information from parties other than their preferred choice. However, counterintuitively a similar pattern emerges with polls presented as originating from Candidate A. Taken together, the findings on partisan sources are consistent with H3. More broadly, the substantive effects here may be small, but suggest that even minor differences in presentation influence perceptions.
Conclusion
Duverger’s Law presumes a level of strategic voting, but gives little insight into when a sincere voter transforms into a strategic voter or to what extent some voters dismiss or fail to perceive institutional incentives. Evidence here finds that as one’s preferred candidate begins to fall behind in the polls, respondents are more willing to vote strategically. However, a significant portion of respondents never deviate from their first choice, suggesting the limits of Duvergerian strategic pressures even under what appears as ideal conditions for defection.
Admittedly this experimental web survey cannot capture all of the complexities of electoral behavior. For example, the survey does not capture the ideological distance across candidates nor can it fully control for what respondents potentially read into the hypothetical legislative election cycle separate from what is explicitly presented, such as the history of parties coordinating district nominations. Nor does the survey attempt to capture personality traits (e.g., Erisen and Blais, 2014). Nevertheless, the findings suggest limitations to strategic voting even under presumably ideal conditions. Identifying why a sizable segment does not opt to cast a strategic vote likely requires a combination of quantitative and qualitative information. Future works may benefit by linking experimental data to interviews and aggregate district data.
Footnotes
Appendix: Examples of randomizations
Acknowledgements
I thank Tung Chieh Tsai and Tony Tai-Ting Liu for their assistance in implementing the pre-test paper survey.
Funding
The author(s) disclosed receipt of the following financial support for the research, authorship, and/or publication of this article: This work was supported by Academy of Korean Studies: [Grant Number AKS-2015-R01]; Western Kentucky University: [Grant Number RCAP 16-8053]; and Chiang Ching-Kuo Foundation [Grant Number RG022-A-14].