
Abstract
Against the backdrop of socio-economic crisis and declining role of the state in infrastructure development, this article evaluates the inter-district disparities in social infrastructure (SI) and physical infrastructure (PI), and consequently attempts to examine the impact of SI and PI on economic growth in Punjab at two points in time, that is, 2004–2005 and 2016–2017. For this purpose, a district level social infrastructure index (SII) and a district level physical infrastructure index (PII) encapsulating 12 and 10 indicators, respectively, have been computed employing principal component analysis. The findings of the study revealed that PI acts as a pivotal catalyst to accelerate economic growth, whereas SI does not demonstrate any significant association with economic growth in Punjab. Furthermore, it is observed that pervasive inter-district disparities exist in SI and PI development and the majority of the districts depict a gloomy picture of infrastructure development in Punjab.
Keywords
Introduction
Infrastructural bottlenecks are asserted as impediments to the inclusive growth strategy of the government and have become a buzz word and ubiquitous theme in the public policy discourses of India (Bajar and Rajeev, 2015). The remarkable role played by infrastructure to expedite the process of economic growth is widely acknowledged in the literature (Aschauer, 1989; Baldwin and Dixon, 2008; Claderon and Serven, 2004; Ismail and Mahyideen, 2015; Ouattara and Zhang, 2019; Simon and Natarajan, 2017; World Bank, 1994). Infrastructure development is necessary to promote economic growth as it reduces transaction and input costs, provides new avenues of employment, creates new markets, equips the economy with highly skilled and healthier human resources, improves productivity and stimulates economic activities (Mohanty and Bhanumurthy, 2019). Moreover, infrastructure has been contemplated as a decisive factor in absorbing the work force, raising the consumption level of individuals and governments and invigorating productive activities (Nugraha et al., 2019). Infrastructure facilities, such as roads, health services and educational facilities also have positive externalities which are imperative for the enhancement in the productivity of inputs engaged in the process of production (Canning and Pedroni, 2004). In the Indian context, the majority of the studies have been devoted to the state level examination of the relationship between infrastructure development and economic growth (see, for example, Bajar, 2014; Ghosh, 2017; Ghosh and De, 1998; Majumder, 2005; Nauriyal and Sahoo, 2010; Patra and Acharya, 2011). However, the district level investigation of the linkages between infrastructure development and economic growth has not elicited much scholarly attention in India. A state as a unit of analysis appears too large to reveal any useful inferences about the association between infrastructure and economic growth as the districts of the same state can have different infrastructure endowments accompanied by glaring inter-district inequalities in terms of per capita income. Moreover, a district as an administrative unit for programme implementation occupies an eminent place in executing the national policies aimed at encouraging economic growth in India.
In the context of a predominantly rural and agrarian economy of Punjab, the critical importance of social infrastructure (SI) and physical infrastructure (SI) in fostering economic growth at district level has hardly been emphasised by the policy-makers. Punjab pioneered the Green Revolution of the 1960s which played the central role in achieving self-sufficiency in food production and terminating India’s dependence on foreign food aid (Government of Punjab, 2004). However, since the early 1990s the agriculture sector of the state has experienced a sluggish yield of major agricultural crops (Sidhu, 2002) along with lofty marginal costs of additional increments in the yield (Ghuman, 2008). Unequal access to inputs such as credit combined with the lack of broader industrial development increased the inequalities in the state (Singh, 2015). In 1991–1992, Punjab occupied the top position in terms of per capita income among the major states of India, while it has slipped down to 15th rank in 2017–2018. Punjab which was once regarded as one of the rich Indian states enjoying apical levels of income accompanied by low poverty rates (Dubey, 2009), is now confronting a grave socio-economic crisis (Ghuman, 2008). At this juncture of unprecedented socio-economic crisis, the provision of SI and PI facilities can act as a vital determinant of economic growth in the state. Punjab has been regarded as one of the best states on the infrastructure development front in India (Bajar, 2014; Ghosh, 2017; Majumder, 2005; Patra and Acharya, 2011). However, after probing deeper into the district level provision of infrastructure facilities, there emerges a different ground reality of huge inter-district disparities in SI and PI in the state. Moreover, there is a dearth of district level empirical studies exploring the effects of SI and PI on economic growth in Punjab. Therefore, the main objective of this paper is to investigate the impact of SI and PI on economic growth across various districts of Punjab at two points in time, that is, 2004–2005 and 2016–2017. Furthermore, the article seeks to evaluate the extent of inter-district disparities in SI and PI development in Punjab.
Review of literature
The examination of the infrastructure–economic growth nexus has attracted a considerable amount of academic attention in the literature devoted to the evaluation of the effects of infrastructure. The reviewed literature varies from country level and state level time series studies to state wise as well as country level panel data models. In addition to this, a few district level studies pertaining to the Indian states have also been reviewed.
In his theory of unbalanced growth, Hirschman (1958) initiated the scrutiny of the infrastructure–economic growth nexus where he examined the role of economic and social overhead capital in increasing the productivity. However, on empirical grounds, the role of infrastructure in economic growth has gained scholarly attention after the seminal work of Aschauer (1989). In this study, Aschauer (1989) detected a high level of output elasticity of public capital and argued that paucity of spending on infrastructure provisioning results in productivity slowdown in the United States. Claderon and Serven (2004) empirically evaluated the impact of infrastructure development on growth using a panel data set for 121 countries over the time span of 1960 to 2000. The study found that infrastructure stocks have a positive and significant impact on economic growth in the long run. Chin and Chou (2004) analysed the relationship between SI and economic development among the developing countries of the world. It has been observed that countries endowed with efficient SI facilities experienced more economic development. Sahoo and Dash (2012) examined the impact of infrastructure on the economic growth of four South Asian countries, namely India, Bangladesh, Sri Lanka and Pakistan considering the time series data for 1980–2005. The study concluded that PI and SI contributes positively towards economic growth in South Asia. Ouattara and Zhang (2019) analysed the relationship between infrastructure and economic growth in 29 provinces of the People’s Republic of China (PRC) over the time period of 1985–2012. The study identified infrastructure as a strong determinant of economic growth in the PRC. Sahoo and Dash (2009) examined the role of PI development in economic growth in India over the time span of 1970 to 2006. The findings of the study revealed that infrastructure contributes significantly towards economic growth. Mohanty and Bhanumurthy (2019) assessed the relationship between PI and economic growth of India for the time frame of 1980 to 2016. The study concluded that PI has a significant and strong impact on economic growth.
Apart from the country level analysis, the state level examination of the nexus between infrastructure and economic growth has also been a prime theme among researchers in India. Ghosh and De (2004) examined the role played by PI and SI in determination of economic development across various states of India at four different points in time, that is, 1971–1972, 1981–1982, 1991–1992 and 1997–1998. The study showed that PI and SI are significant determinants of economic development of different states. Kateja and Maurya (2011) investigated the interrelationship between infrastructure and economic development across 18 major states of India at four points in time, that is, 1980–1981, 1990–1991, 2000–2001 and 2004–2005. It has been detected that infrastructure facilities play a crucial part in the development of states. Bajar (2014) investigated the impact of PI on the economic output of a panel of 17 major states of India between 1980 and 2010. The study concluded that the effect of infrastructure on output is not uniform across sectors and over time. Ghosh and De (1998) evaluated the role of PI in determination of regional income across various Indian states for the years 1971–1972 and 1994–1995. It has been observed that PI is a significant determinant of the per capita net state domestic product of Indian states. Patra and Acharya (2011) investigated the impact of PI facilities on regional economic growth across 16 major states of India. The study concluded that PI development significantly contributes towards growth of per capita net state domestic product. Srivastava and Mujoo (2017) revealed that economic infrastructure contributes positively and significantly towards economic development of India, while the coefficient of SI turned out to be negative and insignificant in this regard. Simon and Natarajan (2017) unearthed the relationship between infrastructure inequality and economic growth across 17 major states of India between 1990–1991 and 2010–2011. The study revealed that declining infrastructural disparities are significantly associated with accelerated economic growth in India.
A few researchers also explored the relationship of infrastructure to agricultural development (Manjunath and Kannan, 2015), industrial development (Gayithri, 1997), secondary sector development (Ghosh, 2011) and rural development (Ghosh, 2017). Manjunath and Kannan (2015) examined the impact of economic, institutional and social infrastructures on agricultural development in various districts of Karnataka between 1980 and 2010. The study revealed that availability and utilisation of infrastructure boosts agricultural productivity in rural regions. Gayithri (1997) investigated the relationship between infrastructure and industrial development across various districts of Karnataka. Ghosh (2011) analysed the relationship between PI and development of the secondary sector of six Indian states, namely Maharashtra, Gujarat, Tamil Nadu, Kerala, Orissa and Bihar over the time period of 1991 to 2005. The results suggest that PI has a positive impact on the development of the secondary sector but the implications of infrastructure differ across the states. Ghosh (2017) studied the impact of rural infrastructure on various income and non-income dimensions of rural development across 16 major states of India. It has been observed that improved levels of PI and SI trigger agricultural productivity and output. A large body of literature is focused on investigating the state level relationship between infrastructure and economic growth in India. The district level analysis in this arena could not elicit similar scholarly attention due to the non-availability of comparable data at the district level. Ghosh (2015) assessed the contribution of infrastructure in accelerating economic growth in various districts of Gujarat between 2001 and 2011. The study concluded that there is a positive and significant relationship between infrastructure and economic growth. Majumder (2005) examined the district level relationship between infrastructure and economic growth in India at four points in time, that is, 1971, 1981, 1991 and 2001. The analysis revealed that availability of PI and SI is a vital determinant of the level of economic development.
In the context of India, a significant proportion of academic attention has been given to the state level analysis of the relationship between infrastructure development and economic growth. Moreover, the review of existing literature suggests that the district level investigation of the association between infrastructure development and economic growth has received scant scholarly consideration due to unavailability of comparable and reliable data. The assessment of the role played by infrastructure in economic growth at district level may provide useful policy insights to the policy-makers. Therefore, this article is an attempt in this direction to fill the aforementioned gap in the existing literature.
Data and methodology
Data
The present study is based on the district level data obtained from various issues of the Statistical Abstract of Punjab and Economic and Statistical Organisation, Government of Punjab (Various Years). In 2004, there were only 17 districts in Punjab and the total numbers of districts increased to 22 in 2016 as five new districts namely, Sahibzada Ajit Singh Nagar, Barnala, Tarn Taran, Pathankot and Fazilka were created between 2006 and 2011.
To quantify the impact of infrastructure on economic growth, infrastructure has been divided into two categories, that is, SI and PI. Two separate district level infrastructure indices, namely social infrastructure index (SII) and physical infrastructure index (PII) have been developed for the years 2004 and 2016. Per capita net district domestic product at constant prices (2011–2012) (PCNDDP) has been considered as a proxy for economic growth and data have been taken for the years 2004–2005 and 2016–2017. The data related to per capita net district domestic product are only available for the time period between 2004–2005 and 2016–2017. Therefore, the selection of variables and time frame of the study have been governed by the availability of district level data. To construct the SII and PII, a comprehensive set of variables representing SI and PI facilities has been selected by developing insights from review of the literature. The description of district level SI and PI variables used in the analysis is presented in Tables 1 and 2, respectively.
Description of social infrastructure (SI) variables.
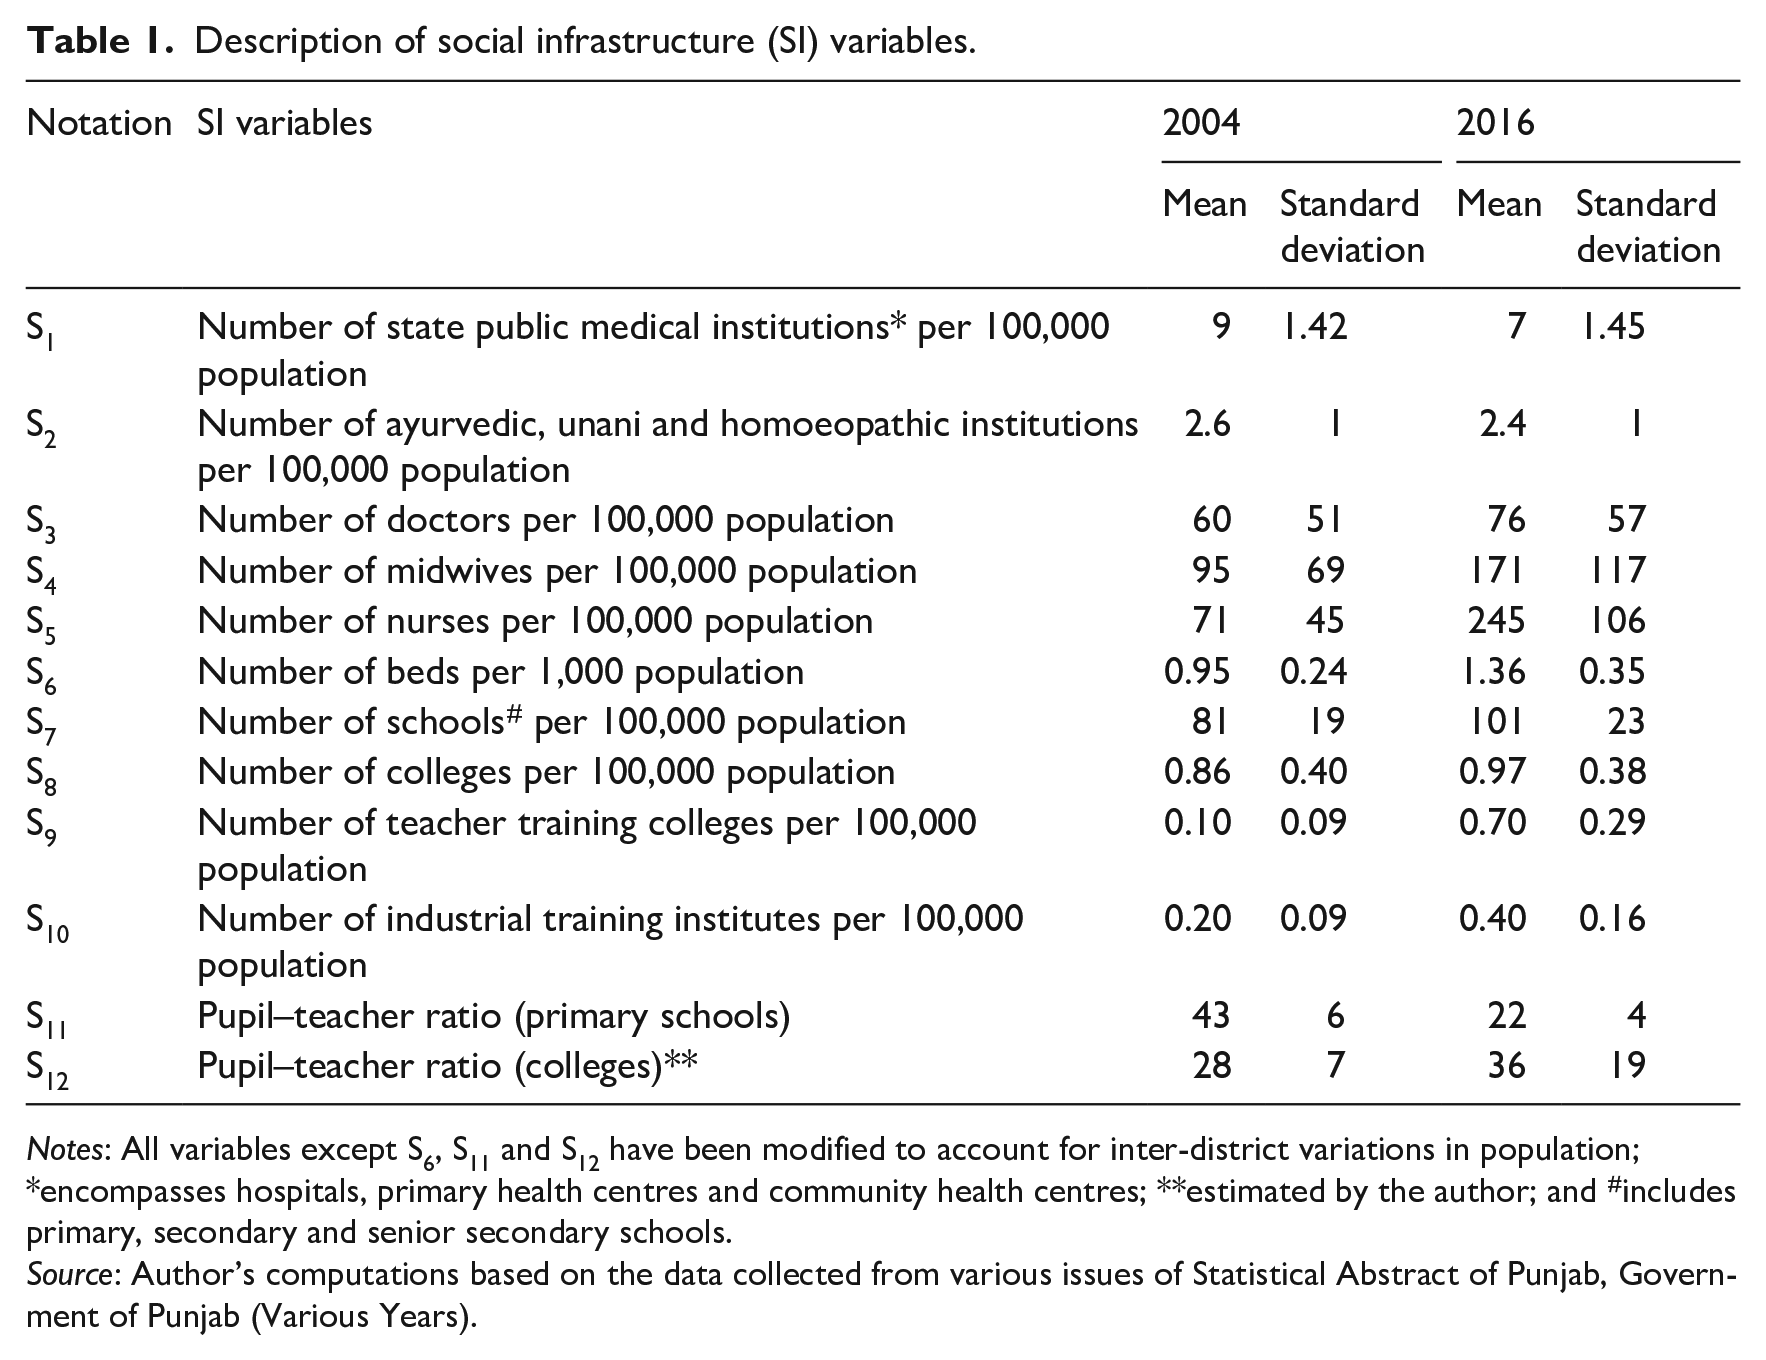
Notes: All variables except S6, S11 and S12 have been modified to account for inter-district variations in population; *encompasses hospitals, primary health centres and community health centres; **estimated by the author; and #includes primary, secondary and senior secondary schools.
Source: Author’s computations based on the data collected from various issues of Statistical Abstract of Punjab, Government of Punjab (Various Years).
Description of physical infrastructure (PI) variables.
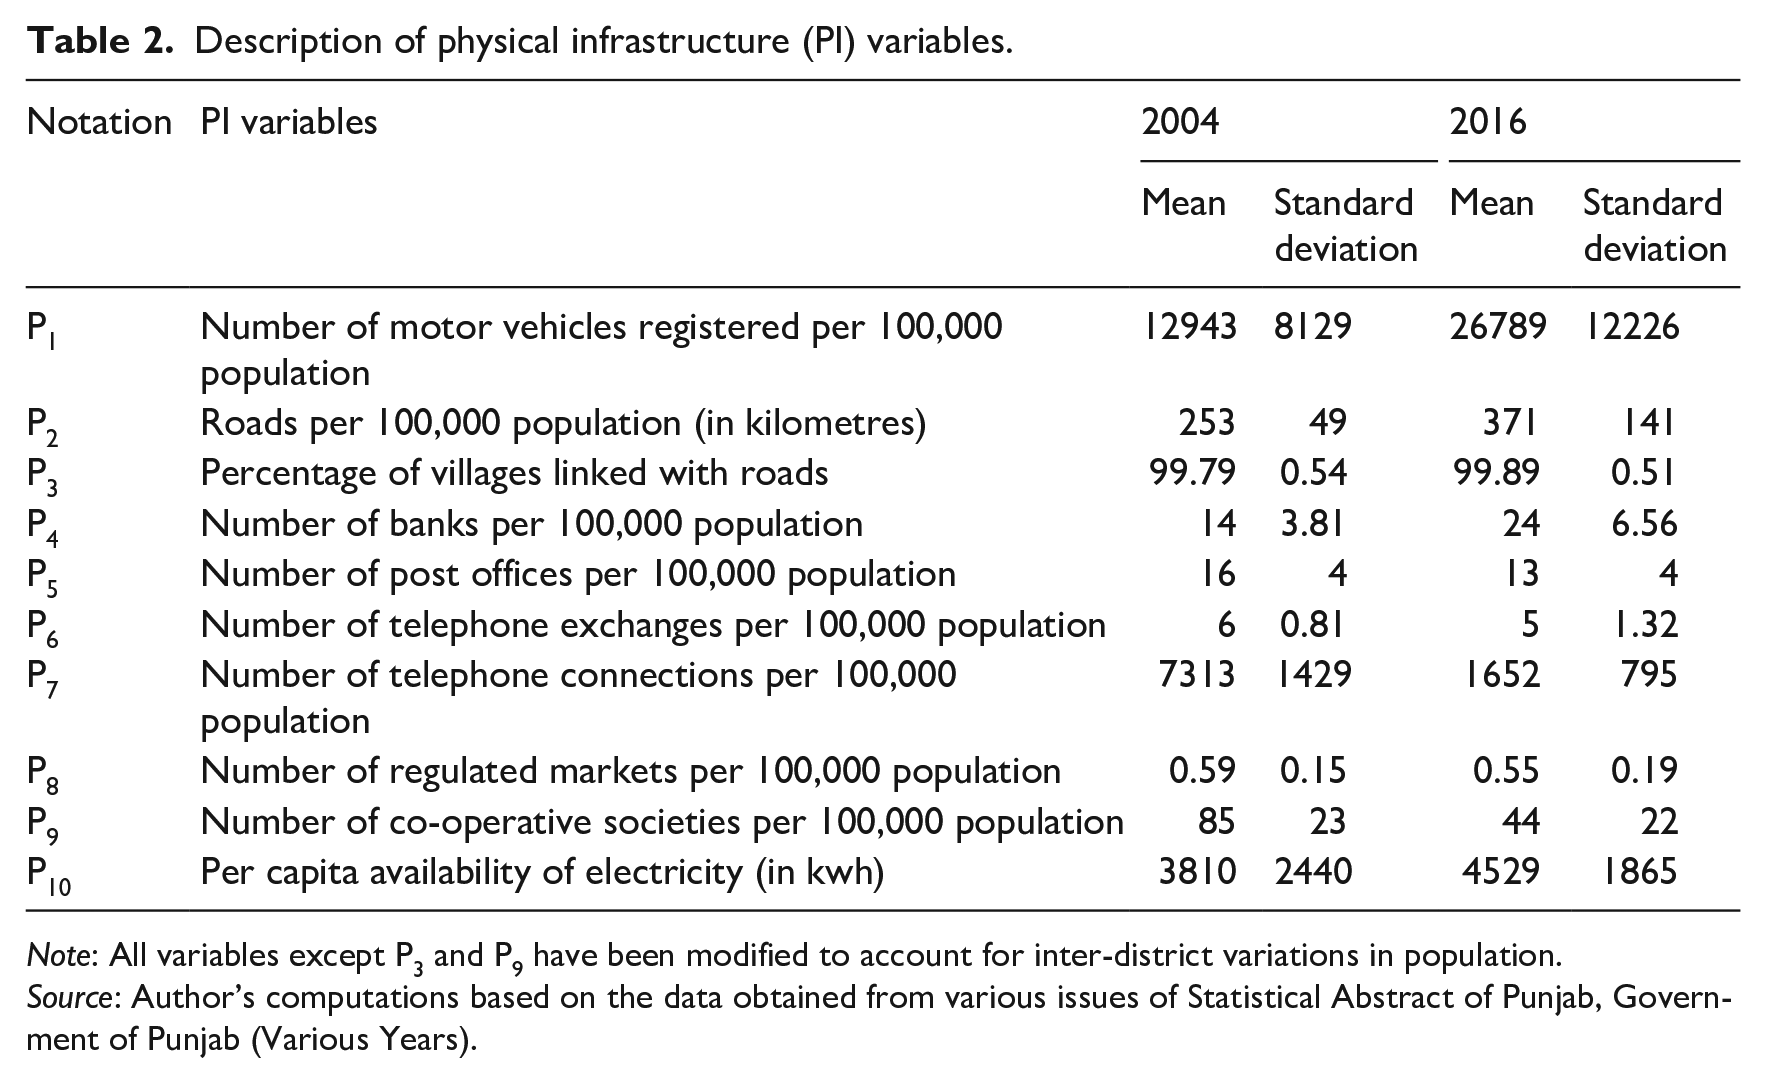
Note: All variables except P3 and P9 have been modified to account for inter-district variations in population.
Source: Author’s computations based on the data obtained from various issues of Statistical Abstract of Punjab, Government of Punjab (Various Years).
Construction of infrastructure indices
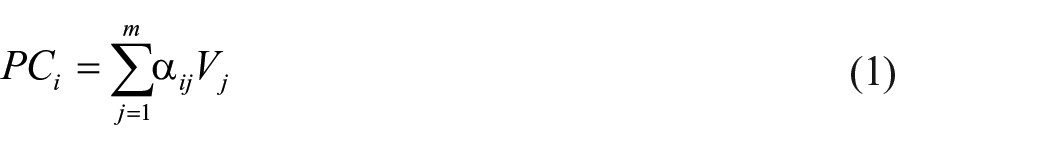
The impact of SI and PI on economic growth cannot be fully estimated by any single representative indicator. In order to overcome this issue, two composite indices of infrastructure, that is, SII and PII based on a comprehensive set of infrastructure indicators (see, Table 1 and Table 2) have been computed. The relative weights assigned to infrastructure variables have been determined by using principal component analysis (PCA). Several studies employed PCA to formulate the composite indices (see, for example, Gayithri, 1997; Ghosh and De, 1998; Mohanty and Bhanumurthy, 2019; Nauriyal and Sahoo, 2010; Ouattara and Zhang, 2019; Sahoo and Dash, 2009; Simon and Natarajan, 2017). PCA transforms an original set of observations of correlated variables into a few linearly uncorrelated factors by applying an orthogonal transformation (Malhotra and Dash, 2018; Simon and Natarajan, 2017). The core philosophy behind PCA is to account for the highest variance possible in the set of original variables in terms of as few components as possible (Ram, 1982). Principal components (PCi, i = 1 to n) being linear combinations of original variables (Vj, j = 1 to m) can be described as given by Equation (1):

or
where,


where,

where,
Relative weights of social infrastructure (SI) and physical infrastructure (PI) variables.
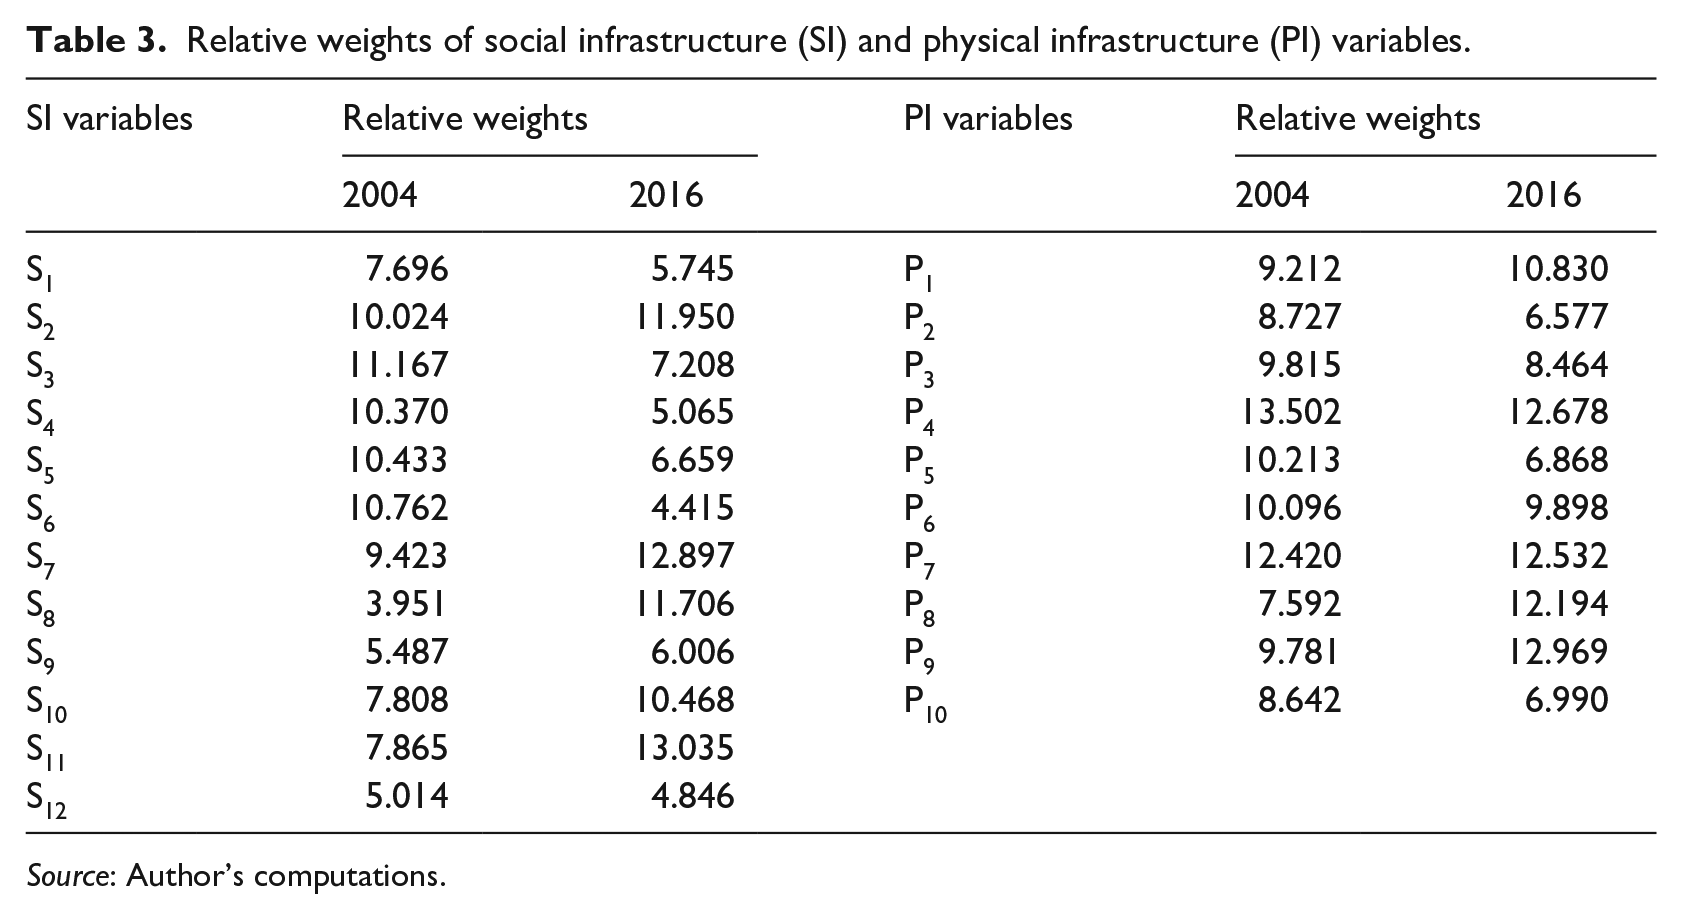
Source: Author’s computations.
After the elicitation of the relative weights, Equations (5) and (6) have been used to formulate the SII and PII, respectively:


where,
Furthermore, the coefficient of variation (CV) is applied to examine inter-district disparities in SI and PI in Punjab. The CV has been used extensively in the studies focused on the evaluation of regional disparities in India (see, for example, Ghosh, 2017; Ghosh and De, 2004; Nauriyal and Sahoo, 2010; Simon and Natarajan, 2017). The formula employed to estimate the CV is expressed in Equation (7):

where,
Classification of districts
A classification of districts has been devised to ascertain the relative position of various districts in terms of SI and PI development. On the basis of SII and PII values for the year 2016, 22 districts of the state have been classified into three categories of infrastructure development: leaders; mediocre; and laggards. The classification of districts has been prepared following the categorisation approach employed by Bajar (2014) and Ghosh (2015). The districts with index values greater than or equal to [mean + 0.5 (standard seviation)] have been classified as leaders, whereas the districts with index values less than or equal to [mean − 0.5 (standard deviation)] are termed as laggards. The districts are identified as mediocre if their index values appear in between the aforementioned limits, that is, less than [mean + 0.5 (standard deviation)] but greater than [mean − 0.5 (standard deviation)].
Model specification
The present study attempts to examine the impact of SI and PI on economic growth across various districts of Punjab for the years 2004–2005 and 2016–2017. In order to analyse the relationship between SI and PI and economic growth, the multiple regression analysis technique has been deployed. The relationship between SI and PI and economic growth can be expressed as given by Equation (8):

where,
Empirical results and discussion
SI and PI: inter-district disparities
There is consensus among policy-makers and academician that Punjab has one of the best infrastructure facilities in India. Several studies confirmed that at aggregate level Punjab has an impeccable record of infrastructure development among the major states of India (see, for example, Bajar, 2014; Ghosh, 2017; Ghosh and De, 1998; Majumder, 2005; Nauriyal and Sahoo, 2010; Patra and Acharya, 2011). However, a different picture of alarming inter-district disparities in SI and PI appears after the meticulous scrutiny of infrastructure facilities in the state. In this subsection, the extent of inter-district disparities in infrastructure development in Punjab has been evaluated by formulating district level SI and PI indices. The results of the SII and PII of Punjab for the years 2004 and 2016 are presented in Tables 4 and 5, respectively. It is evident from Table 4 that in 2004, Faridkot was at the top position with the SII value 0.6219, followed by Kapurthala (0.6045), Hoshiarpur (0.5496) and Shaheed Bhagat Singh Nagar (0.5491). While Mansa district with the SII value 0.1265, recorded the lowest level of SI development among various districts. Mansa has been followed by Sangrur (0.2111), Shri Muktsar Sahib (0.2370) and Bathinda (0.2867). Table 5 shows that in 2004, Jalandhar has the distinction of being at the top position with the PII value 0.6381, followed by Shaheed Bhagat Singh Nagar (0.6215), Hoshiarpur (0.6147) and Kapurthala (0.6145). While Gurdaspur district with the PII value 0.2714, witnessed the lowest level of PI development followed by Amritsar (0.3056), Mansa (0.3334) and Firozpur (0.3520).
District level social infrastructure index (SII) of Punjab, 2004–2016.
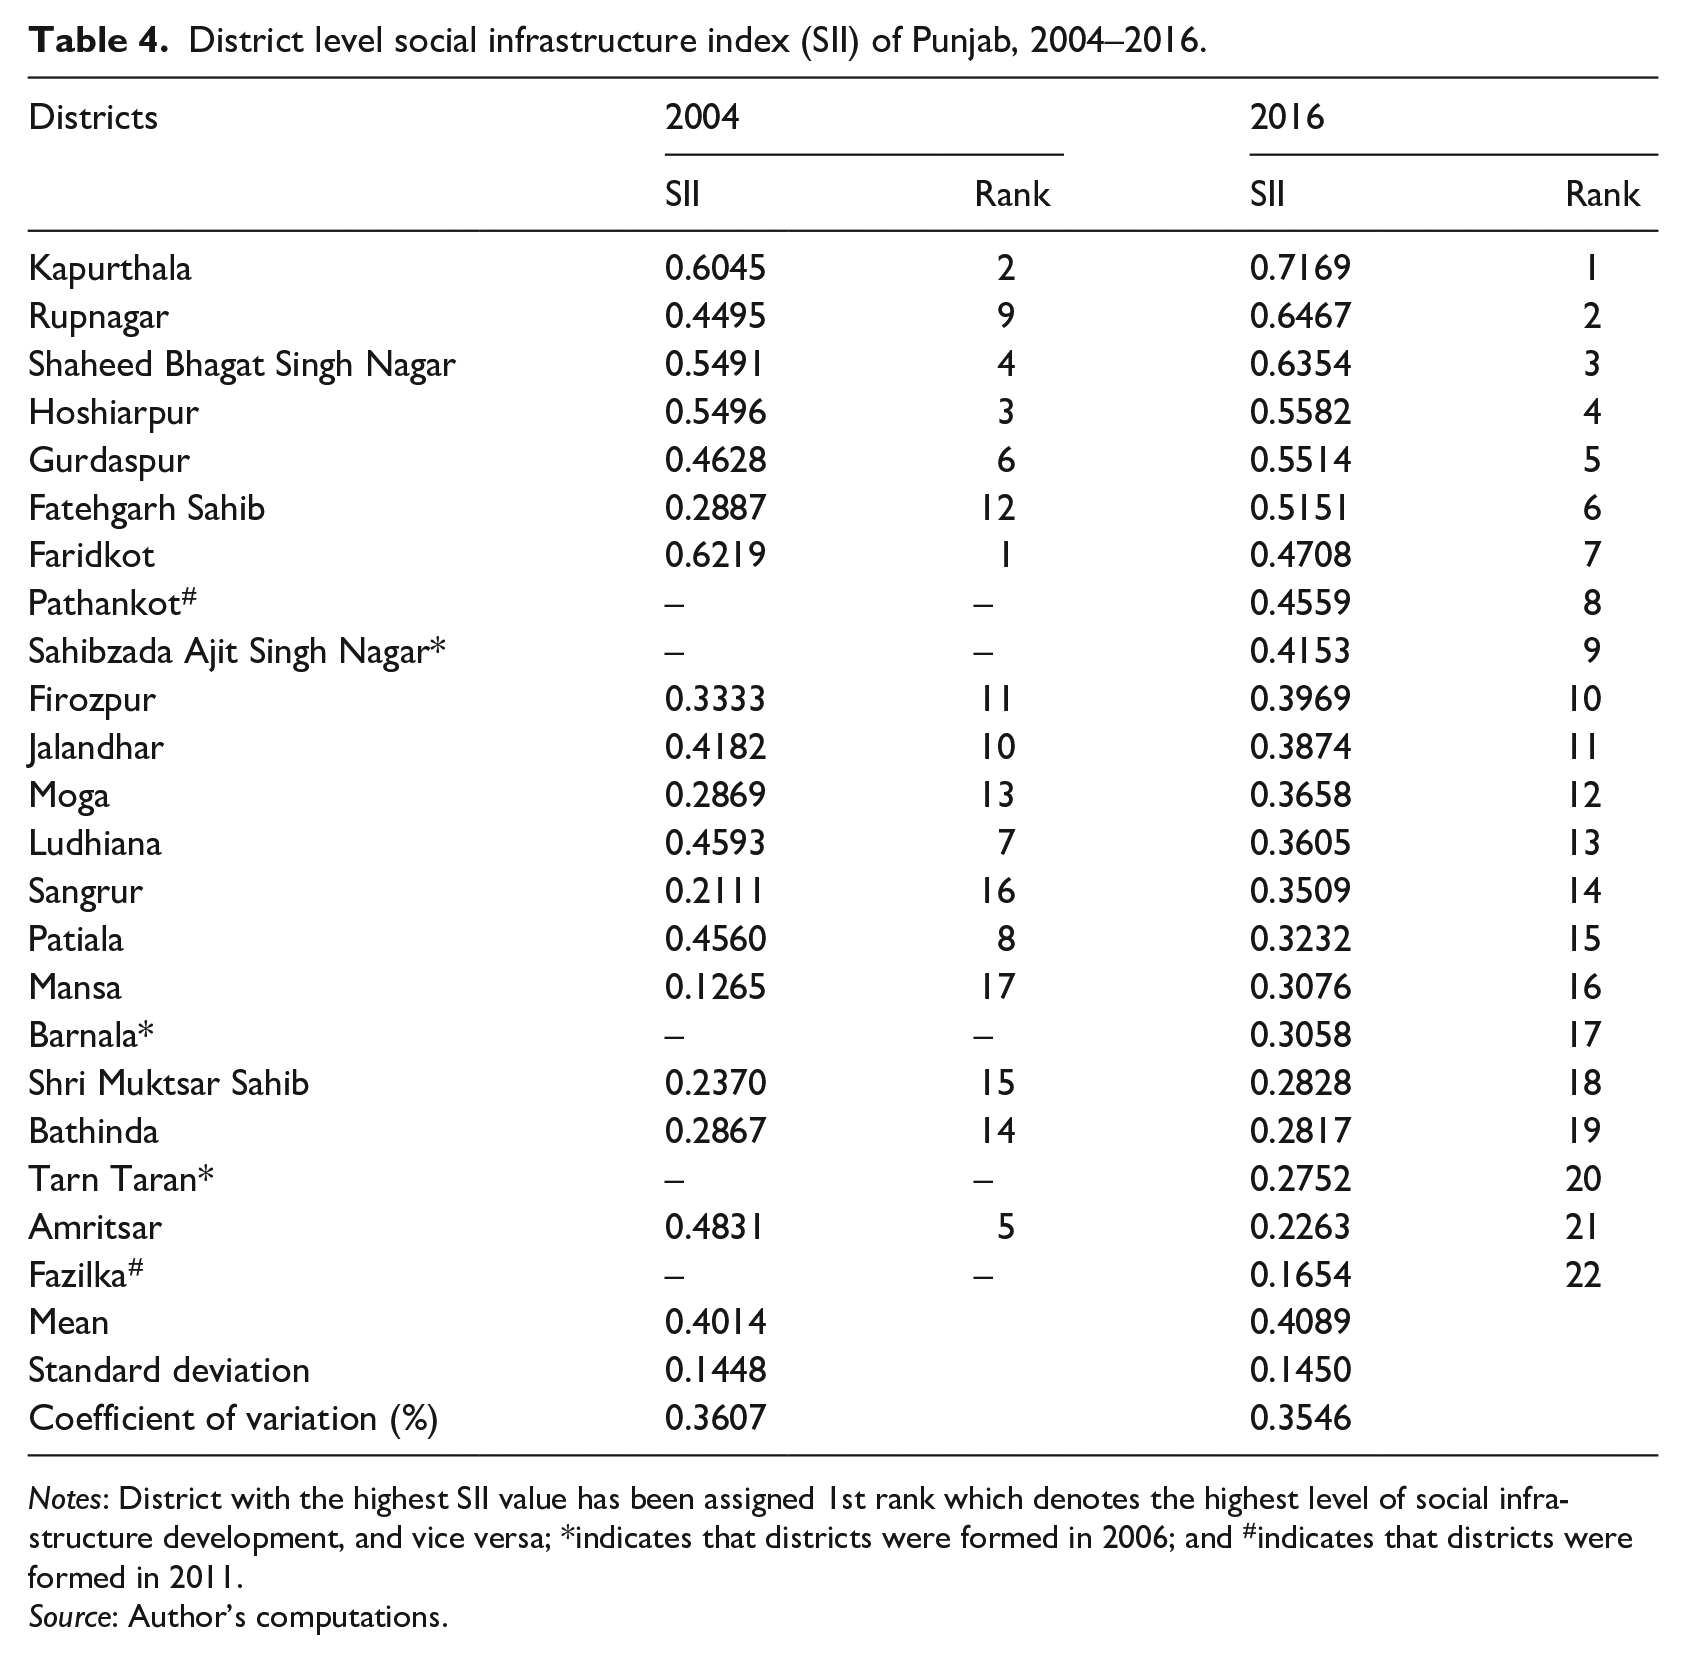
Notes: District with the highest SII value has been assigned 1st rank which denotes the highest level of social infrastructure development, and vice versa; *indicates that districts were formed in 2006; and #indicates that districts were formed in 2011.
Source: Author’s computations.
District level physical infrastructure index (PII) of Punjab, 2004–2016.
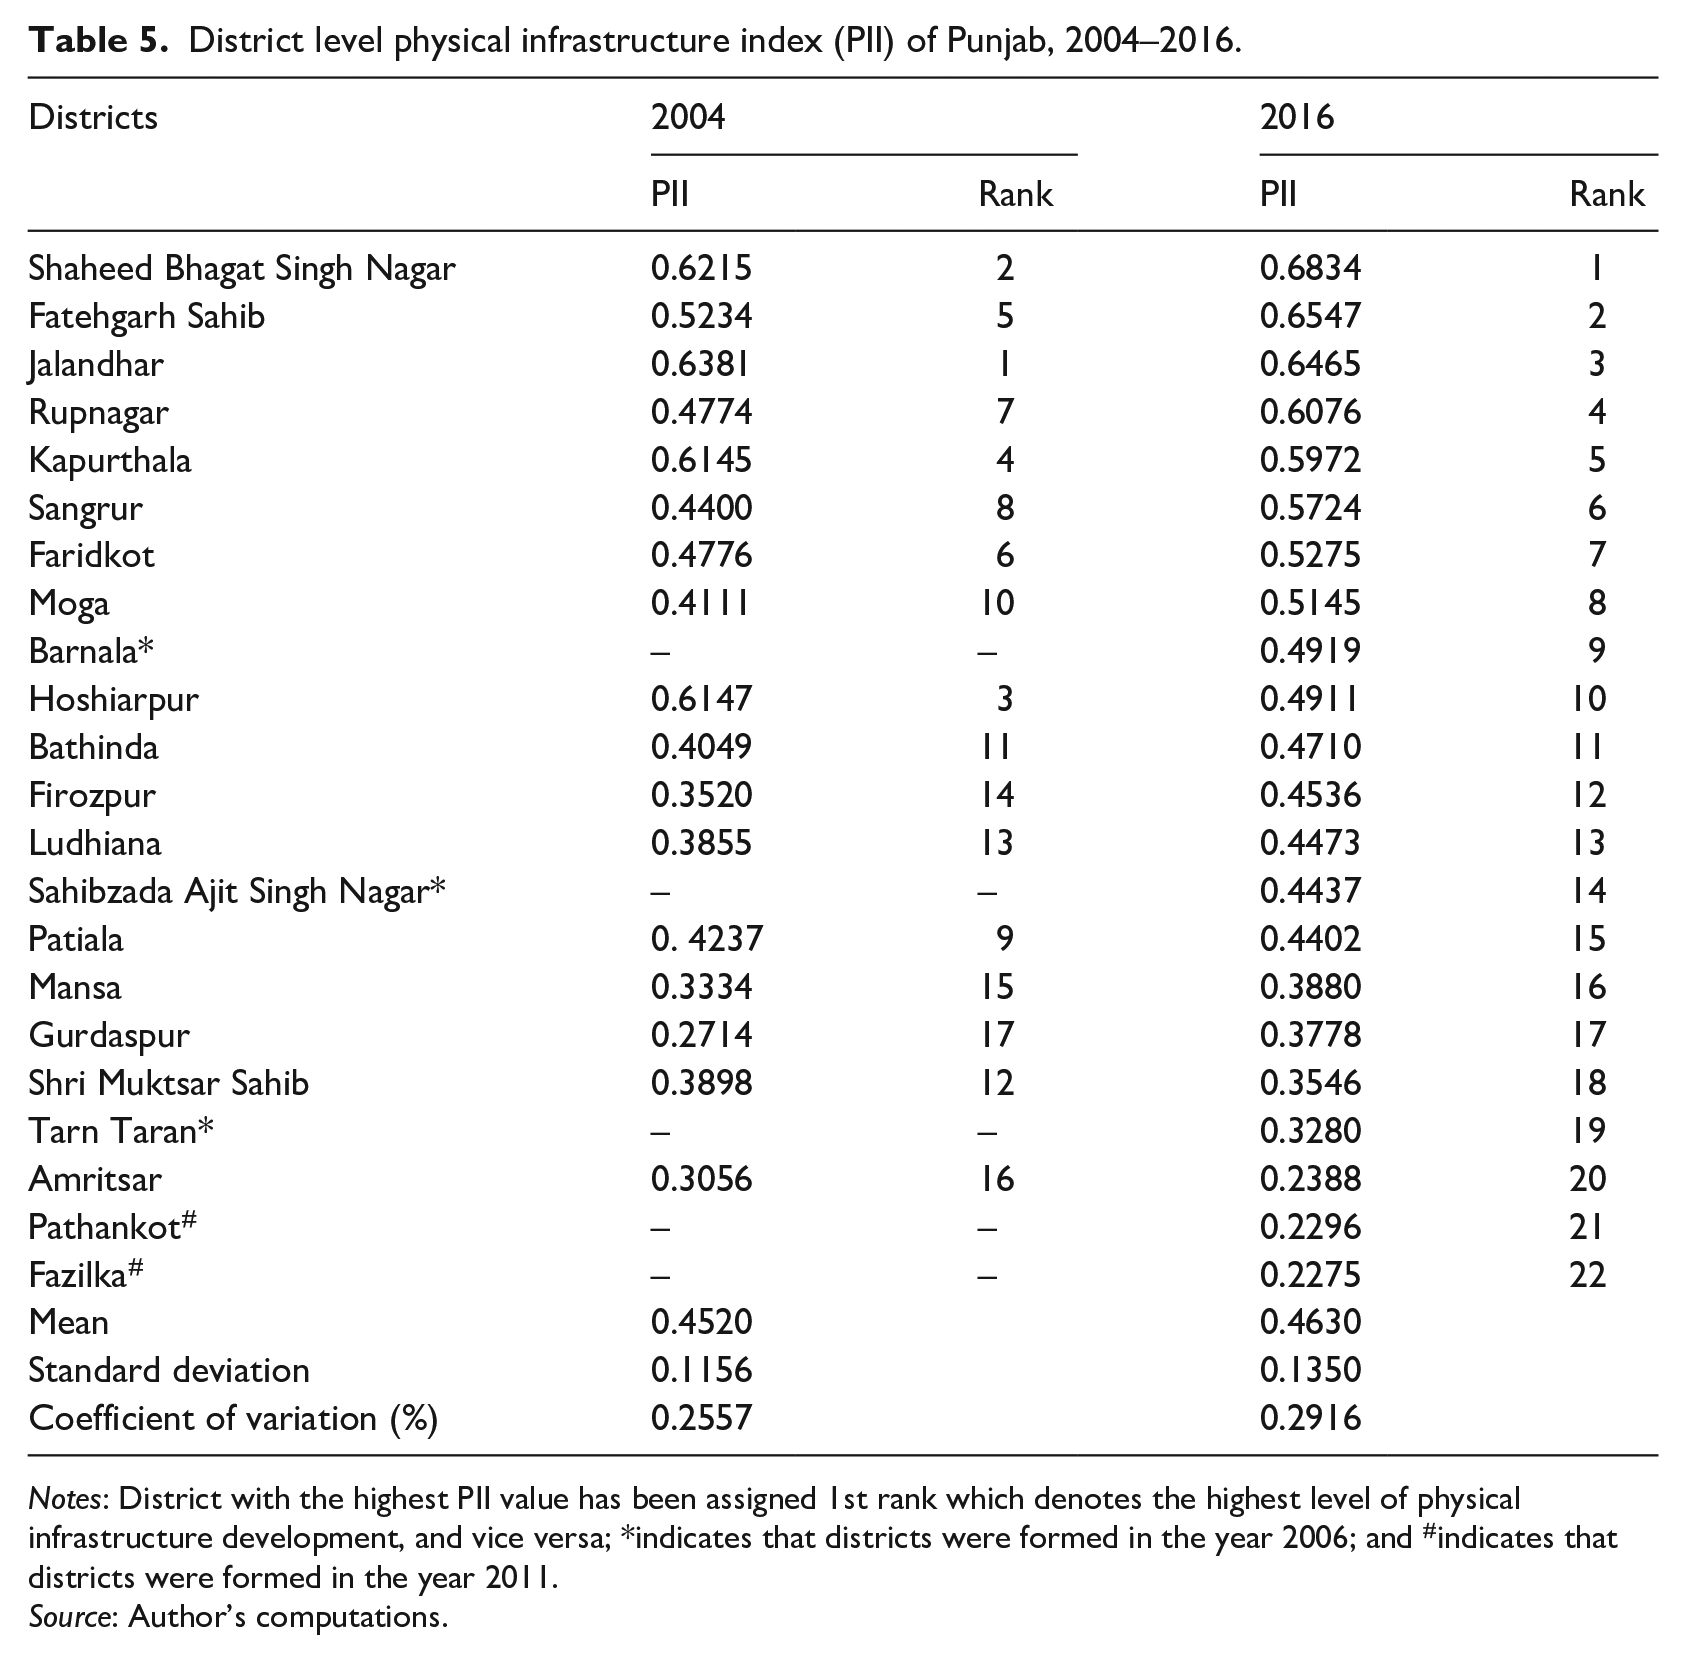
Notes: District with the highest PII value has been assigned 1st rank which denotes the highest level of physical infrastructure development, and vice versa; *indicates that districts were formed in the year 2006; and #indicates that districts were formed in the year 2011.
Source: Author’s computations.
In 2016, Kapurthala has occupied the top position with the SII value 0.7169, followed by Rupnagar (0.6467), Shaheed Bhagat Singh Nagar (0.6354) and Hoshiarpur (0.5582). Fazilka portrayed the worst performance in SI development with the SII value 0.1654. Fazilka has been followed by Amritsar (0.2263), Tarn Taran (0.2752) and Bathinda (0.2817) (Table 4). In 2016, Shaheed Bhagat Singh Nagar occupied the top position with the PII value 0.6834, followed by Fatehgarh Sahib (0.6547), Jalandhar (0.6465) and Rupnagar (0.6076). Fazilka exhibited the poorest performance in terms of PI development with the PII value 0.2275 followed by Pathankot (0.2296), Amritsar (0.2388) and Tarn Taran (0.3280) (Table 5). The inter-district disparities in SI exhibited a negligible decline as CV decreased from 0.3607 in 2004 to 0.3546 in 2016 (Table 4), while the magnitude of inter-district disparities in PI in Punjab increased over time as CV escalated to 0.2916 in 2016 from 0.2557 in 2004 (Table 5).
On the basis of the SII for the year 2016, the districts have been classified into three categories of SI development. The results reported in Table 6 revealed that Kapurthala, Rupnagar, Shaheed Bhagat Singh Nagar, Hoshiarpur, Gurdaspur and Fatehgarh Sahib emerged as leaders in terms of SI development, while Patiala, Mansa, Barnala, Shri Muktsar Sahib, Bathinda, Tarn Taran, Amritsar and Fazilka have been identified as laggards. Faridkot, Pathankot, Sahibzada Ajit Singh Nagar, Firozpur, Jalandhar, Moga, Ludhiana and Sangrur have been mediocre performers on the SI development front. The districts of the Doaba region of Punjab portrayed tremendous performance in terms of SI development, while the majority of the districts belonging to the Malwa and Majha regions are poor performers on this front. Economically more progressive districts such as Amritsar, Ludhiana, Jalandhar and Sahibzada Ajit Singh Nagar are relatively less developed in terms of SI (Table 6). Furthermore, the districts have been divided into three categories of PI development based on the PII for the year 2016. It is evident from Table 7 that Shaheed Bhagat Singh Nagar, Fatehgarh Sahib, Jalandhar, Rupnagar, Kapurthala and Sangrur appeared as leaders in terms of PI development. Faridkot, Moga, Barnala, Hoshiarpur, Bathinda, Firozpur, Ludhiana, Sahibzada Ajit Singh Nagar and Patiala have been termed as mediocre performers on the PI development front. Seven districts namely Mansa, Gurdaspur, Shri Muktsar Sahib, Tarn Taran, Amritsar, Pathankot and Fazilka exhibited the worst performance and earned the status of laggards in terms of PI development. The districts belonging to the Doaba region are relatively better performers in terms of PI development, whereas the districts of the Malwa region are performing ambivalently on this front. The districts of the Majha region of the state depicted the worst performance and lagged behind in terms of PI development (Table 7). The SI and PI indicators considered for the assessment of inter-district variations have been modified to account for the population differences across various districts. The better performance of the Doaba region on the SI and PI development front may be attributed to the comparatively lower population in the region which has resulted in the higher per capita availability of infrastructure facilities in comparison to other regions. Moreover, the under-development of infrastructure facilities in the border districts of the Majha and Malwa regions resulted in their worst rankings on SII and PII. This may be another reason for the relatively better position of the districts of the Doaba region on SII and PII.
Classification of districts as per social infrastructure development, 2016.
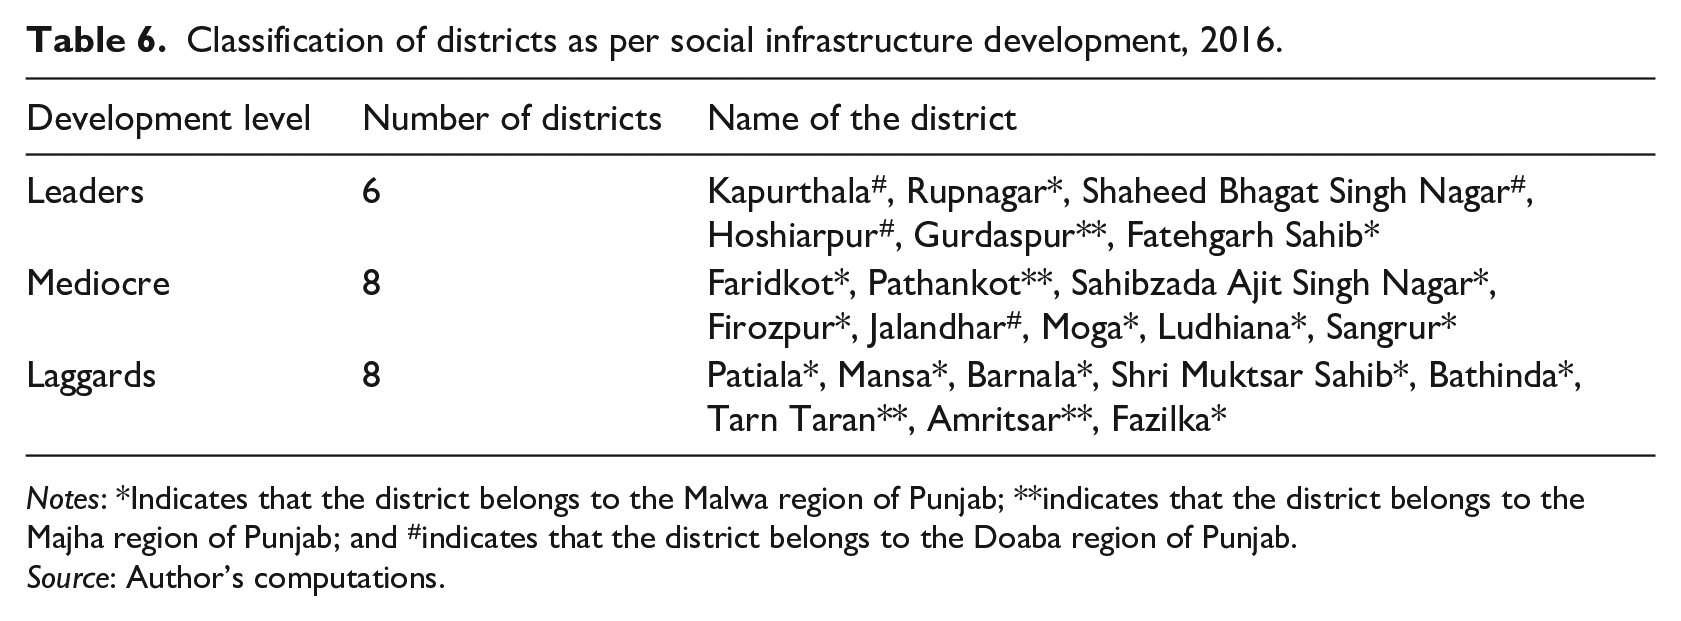
Notes: *Indicates that the district belongs to the Malwa region of Punjab; **indicates that the district belongs to the Majha region of Punjab; and #indicates that the district belongs to the Doaba region of Punjab.
Source: Author’s computations.
Classification of districts as per physical infrastructure development, 2016.
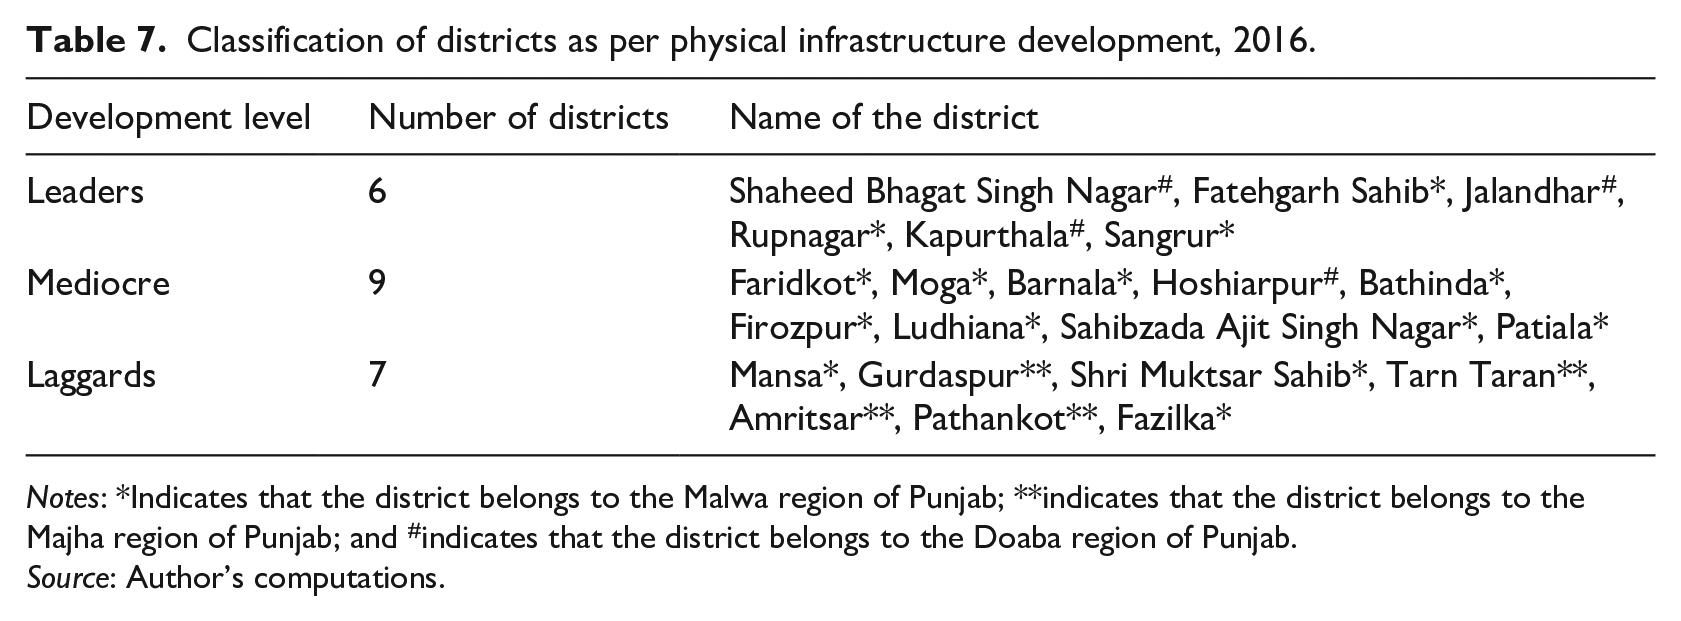
Notes: *Indicates that the district belongs to the Malwa region of Punjab; **indicates that the district belongs to the Majha region of Punjab; and #indicates that the district belongs to the Doaba region of Punjab.
Source: Author’s computations.
Impact of SI and PI on economic growth
The nexus between infrastructure and economic growth is of multiple and complex nature as the former spurs the latter through direct and indirect channels (Ghosh and De, 2005; Simon and Natarajan, 2017). It is argued that PI such as roads, electricity, telecommunications, financial and agricultural is crucial for boosting economic growth in any region. Moreover, SI such as health and education promote economic growth by improving the literacy level, enhancing health conditions and developing manpower skills (Dash and Sahoo, 2010). Infrastructure development plays an important role in accelerating economic growth through reduced transaction and input costs, increased avenues of employment, enhanced skill set and health of human resources, improved productivity and stimulating economic activities (Mohanty and Bhanumurthy, 2019). Hansen (1965) divided infrastructure into two types: economic overhead capital; and social overhead capital. In this study, in order to quantify the impact of infrastructure development on economic growth, infrastructure has also been classified into two categories, that is, SI and PI. SI includes the health and education sector, while PI encompasses transport, electricity, roads, telecommunications, financial and agriculture sector, etc. PCNDDP has been used as a proxy for economic growth. The impact of SI and PI on economic growth in Punjab has been evaluated by applying regression analysis.
Table 8 provides the regression results on per capita net district domestic product for the year 2004–2005 with two explanatory variables, namely SII and PII. Table 8 reveals that the PII has a positive and statistically significant impact on economic growth across different districts of Punjab. The coefficient of the PII is significant at 0.05% level of significance with the value of 0.295. The results confirm that PI contributes significantly towards economic growth in the state. The coefficient of the SII, albeit, is not statistically significant but bears the expected positive sign. It implies that SI is not a significant determinant of economic growth in Punjab. Furthermore, Table 9 presents the regression results on per capita net district domestic product for the year 2016–2017 with two explanatory variables, namely SII and PII. Table 9 shows that the PII has a positive and statistically significant impact on economic growth across different districts of Punjab. The coefficient of the PII is significant at 0.01% level of significance with the value of 0.374. The results suggest that PI plays a significant role in determining the level of economic growth in the state. However, the coefficient of the SII turns out to be statistically insignificant with a negative value of -0.021. It implies that SI does not have any significant impact on economic growth in the state.
Regression results on per capita net district domestic product (PCNDDP), 2004–2005.
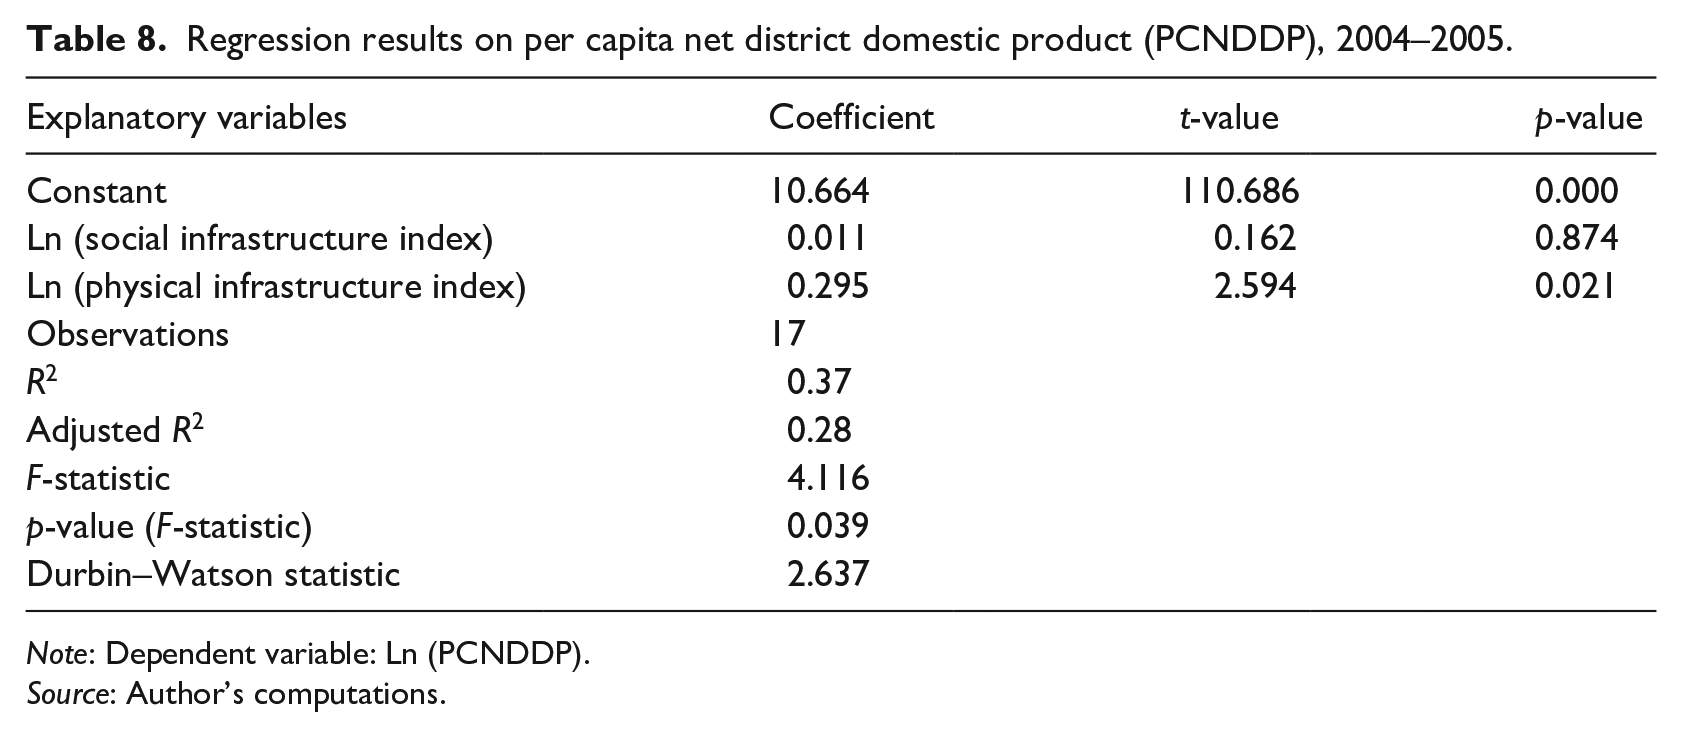
Note: Dependent variable: Ln (PCNDDP).
Source: Author’s computations.
Regression results on per capita net district domestic product (PCNDDP), 2016–2017.
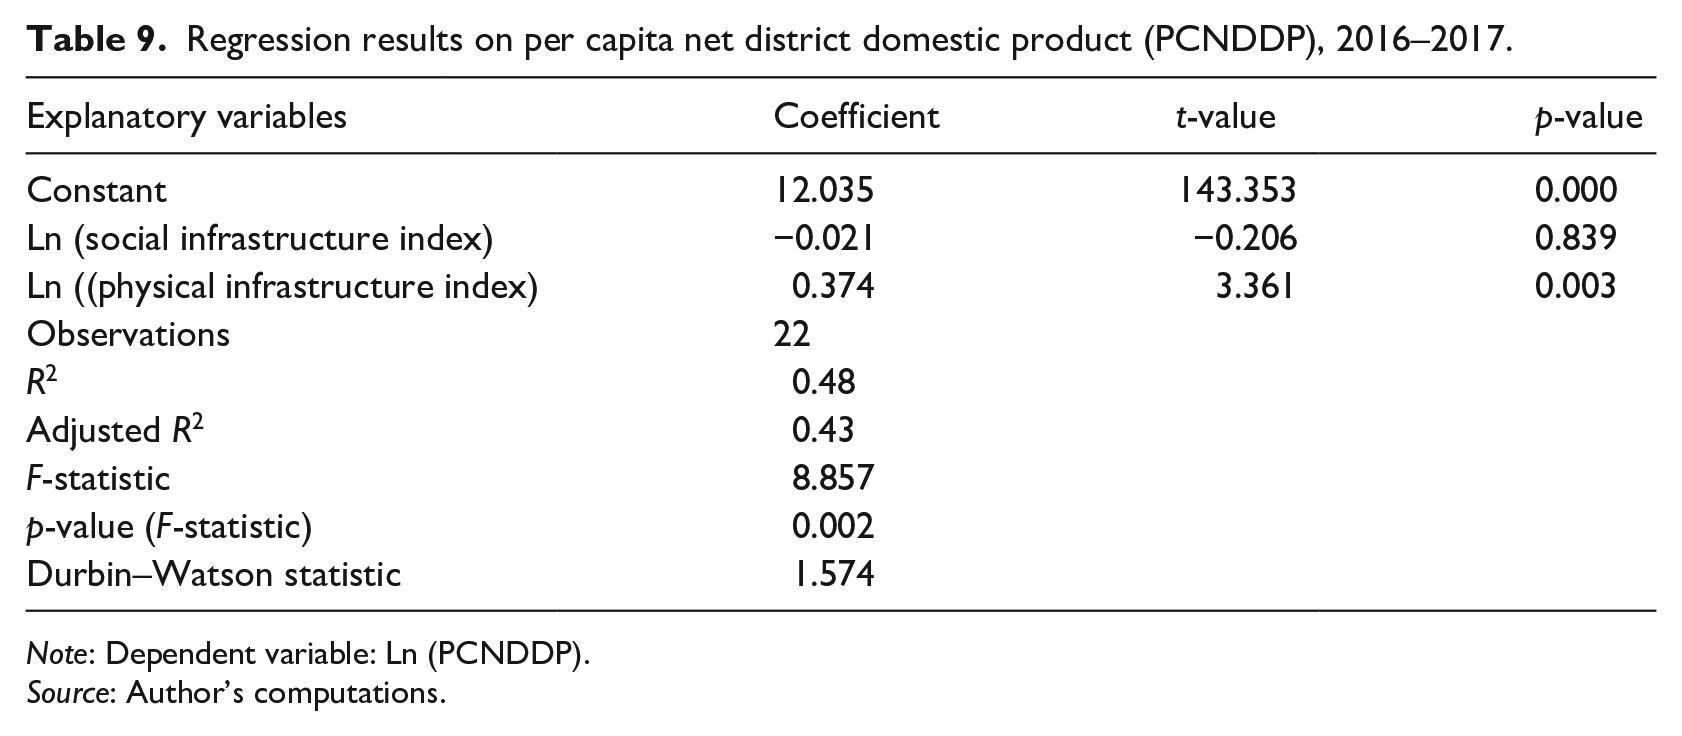
Note: Dependent variable: Ln (PCNDDP).
Source: Author’s computations.
The positive and significant impact of PI on economic growth is in line with the results obtained by Majumder (2005), Patra and Acharya (2011), Bala (2017) and Kaur and Kaur (2018). However, the studies conducted by Bala (2017) and Kaur and Kaur (2018) revealed that the education infrastructure does not contribute significantly towards promoting economic development in Punjab. In the case of impact of the health infrastructure on economic development, their results are negative and statistically significant. Srivastava and Mujoo (2017) found that economic infrastructure contributes positively and significantly towards the economic development of India, whereas in the case of SI, a negative and insignificant impact on economic development has been observed. So, the findings of the present analysis are consistent with the results of Srivastava and Mujoo (2017). In present study, it is found that SI does not demonstrate a positive and significant association with the economic growth of Punjab. One plausible explanation for this phenomenon may be the insufficient availability of SI facilities in the state. These facilities may still not be developed up to the level where they can significantly contribute towards stimulating economic growth. Furthermore, it has been observed that the value of the coefficient of the PII has increased between 2004–2005 and 2016–2017. An improvement in the significance level of the coefficient of PII has also been detected. On the other hand, the coefficient of the SII became negative in 2016–2017 while it had positive sign in 2004–2005. The explanatory power of the model was also enhanced between 2004–205 and 2016–2017 as the value of R2 increased to 0.482 in 2016–2017 from 0.370 in 2004–2005. This indicates that the association between infrastructure and economic growth has improved over the study period. The results of the study suggest that the provision of PI is of paramount importance to provide the much-needed impetus to economic growth in the state.
Conclusion
While economic development of a country is reflected and assessed by its SI and PI endowments, at the same time adequate infrastructure development works as a decisive factor in boosting economic growth. Poor and inadequate infrastructure facilities can prevent a region or country from realising its growth potential even if it is exhibiting progress on other fronts. In this article, an attempt has been made to analyse the impact of SI and PI on economic growth in Punjab. Furthermore, the study endeavours to evaluate the extent of inter-district disparities in SI and PI in Punjab. For this purpose, two district level infrastructure indices, that is, SII and PII for the years 2004 and 2016 have been computed by combining a comprehensive set of infrastructure indicators. The findings of the study indicated that inter-district disparities in SI witnessed a marginal decline, while inter-district variations in PI increased over the study period. The districts belonging to the Doaba region of the state are found to be relatively more advanced in terms of SI and PI development. The districts of the Malwa and Majha regions are found to be comparatively less developed on the SI and PI front. The better performance of the Doaba region on the SI and PI front may be attributed to the comparatively lower population in the region which has resulted in the higher per capita availability of infrastructure facilities in comparison to the Majha and Malwa regions. Moreover, the under-development of infrastructure facilities in the border districts of the Majha and Malwa regions resulted in their worst rankings on SII and PII. This may be another reason for the relatively better position of the districts of the Doaba region on SII and PII. The inadequacy of health, education and PI facilities across districts have serious implications for economic growth of the state. The results of regression analysis revealed that PI acts as a catalyst in promoting economic growth, while SI does not demonstrate any significant association with economic growth in Punjab. The insignificant impact of SI may be attributed to the insufficient availability of SI facilities in the state. From the policy perspective, the study suggests that SI facilities encompassing the health and education sector need to be strengthened on a priority basis to accelerate the pace of economic growth. Moreover, the significant relationship observed between PI and economic growth highlights the need for provision of adequate PI in laggard districts to spur economic growth. It is concluded that avid attention of the policy-makers in the form of appropriate policy interventions is required to ameliorate the level of SI and PI facilities in poor performing districts of Punjab.
Footnotes
Declaration of conflicting interests
The author declared no potential conflicts of interest with respect to the research, authorship, and/or publication of this article.
Funding
The author received no financial support for the research, authorship, and/or publication of this article.