
Abstract
This article investigates the impact of flood risk on vulnerability and welfare at the household level in Vietnam. The analytical sample is taken from a household survey conducted in a north central Vietnam community through a three-stage stratified random sampling method. The propensity score matching approach is employed to compare various welfare indicators between flooded and non-flooded households. This study finds that flooding results in significant income losses and imposes higher costs of living, especially housing costs. The two types of households are vulnerable, implying that other natural disasters or socio-economic disadvantages may have adverse effects on households’ livelihoods. The insignificant effect of floods on vulnerability indicates that the flooded households can cope with floods to some extent. However, contrary to family support, formal coping strategies are insufficient or ineffective at reducing household vulnerability to floods.
Introduction
It is well recognized among scholars that one of the main threats to sustainable economic development over the next decade is the high frequency and severity of natural disasters (Solomon et al., 2007). These disasters, such as droughts, floods and earthquakes, can bring substantial damage to ecosystems as well as tremendous socio-economic losses to human communities (Van den Berg, 2010). In developing countries, the impacts of natural disasters are expected to be more severe due to their low adaptive capacities. For example, the Food and Agriculture Organization (FAO) (2015) reports an estimated loss of about US$140 billion caused by disasters in 48 developing nations in Africa, Asia and Latin America during the period 2003–2013.
Vietnam is one of the 15 most vulnerable countries in the world to natural hazards in terms of the number of people affected and the scale of exposure (Dilley et al., 2005). The country has suffered extensive consequences from flooding, including damage to infrastructure, economic losses and numerous fatalities. Each year, dozens (and often hundreds) of people die because of floods in Vietnam, parts of which are densely populated, low-lying and regularly struck by heavy weather and floods during the rainy season. About 430 people were killed each year by natural disasters between 2007 and 2011, with property losses estimated at 1% of gross domestic product (Reuters Canada, 2014). Additionally, according to Vietnam’s Emergency Events Database (EMDAT), floods alone affected 35 million people between 1960 and 2006.
The impact of floods is not only limited to fatalities but also results in economic damage. Data from EMDAT shows that between 2000 and 2010, among natural hazards, storms caused the most mortality in Vietnam with 54.8% of deaths caused by natural hazards, followed by floods which accounted for 39.3%. Storms also resulted in 57.9% of total economic losses caused by natural hazards, while floods accounted for 37.3% (Figure 1). Since storms and floods are disasters strongly tied to climate, Vietnam is expected to become more vulnerable to their effects in the future due to climate change.
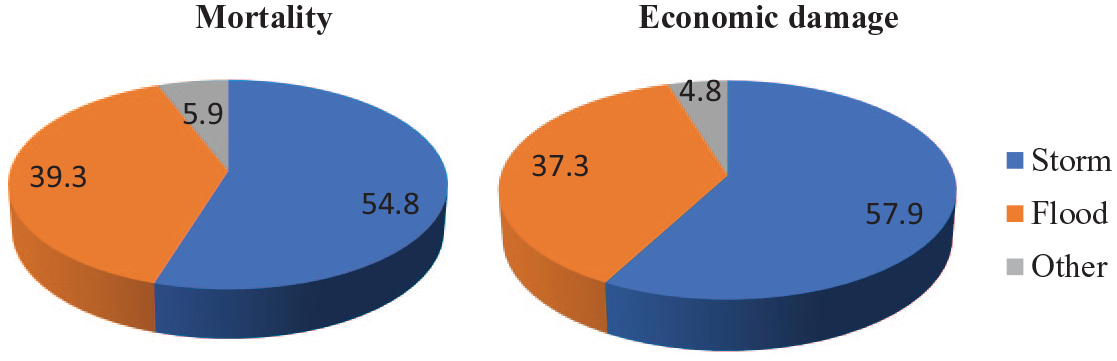
Percentages of Vietnam’s mortality and economic costs by natural disaster types, 2000–2010.
It is clear from the literature that much attention has been paid to the impact of long-term climate change on economic growth (Dell et al., 2014; Hoang and Huynh, 2020). Around 10% of the Vietnamese population and GDP are projected to be impacted by a one metre rise in sea level (Reynaud et al., 2013). A World Bank study on the effect of sea-level rise on developing countries consistently ranks Vietnam as the first or second most vulnerable country to sea-level rise across various dimensions (including land area impacted, the population affected and economic loss) (Dasgupta et al., 2007). Climate change may also be a factor influencing future losses from flooding, the effects of which are expected to become even more severe in the future (Intergovernmental Panel on Climate Change (IPCC), 2007). The impacts of climate change will be further compounded by environmental degradation, for example the destruction of mangrove forests.
Vulnerability assessments are essential for understanding, coping and mitigating environmental risks. The IPCC stated it is highly likely that the severity of the impacts of extreme and non-extreme weather and climate events depends strongly on the level of vulnerability and exposure to these events (IPCC, 2012). Several studies also emphasize the importance of vulnerability as a key indicator of the severity of environmental problems (Adger et al., 2001). Most studies focusing on the vulnerability and adaptive capacity of people and communities do so in the context of past climate change and natural disasters (e.g. Adger, 1999; Few and Tran, 2010). Those studies approach the concept of vulnerability in many ways and, in general, they refer to the attributes of persons or groups that enable them to cope with the impact of disturbances like natural hazards (Janssen and Ostrom, 2006). The relationship between vulnerability to environmental risk and poverty has also been analysed in multiple studies (De Silva et al., 2018; Eriksen and O’brien, 2007; Hajra et al., 2017). However, vulnerability is a broad concept and, therefore, must be assessed within a specific context, place and system (Brooks, 2003).
This is a case study investigating the impacts of flood risk on vulnerability, income and mortality at the household level in Vietnam, where climate change has increased flood risks significantly. The data analysed is a household survey conducted in the north central province of Nghe An in Vietnam. This study presents a case of the literature on climate change and poverty in which the major focuses are the impacts of environmental risk and climate change to vulnerable people in developing countries. Unlike many other studies focusing on ex-post poverty, we employ an ex-ante approach that should be helpful for policymakers when designing policies to support the people, especially the poor, living in flood-prone areas. The empirical approach used in this study can be applied to future studies using only cross-sectional data, which is common in the development context.
The remainder of this article is organized as follows. We next provide an overview of the literature on vulnerability concepts and measurement, followed by a brief description of the study area, survey design and the vulnerability assessment methodology used in this article. We then report and discuss the results, after which we draw our conclusions in the final section.
Literature review
Concepts of vulnerability
In the disaster management literature, vulnerability is defined as the ability to cope with the negative consequences of a natural disaster (IPCC, 2007; Kreimer and Arnold, 2000; United Nations/International Strategy for Disaster Reduction (UN/ISDR), 2004). With this approach, a system is vulnerable if it is exposed and sensitive to the effects of an adverse risk and, at the same time, only has limited capacity to adapt to it. On the contrary, a system is less vulnerable if it is less exposed, less sensitive, or has stronger adaptive capacity when faced with a negative shock (IPCC, 2007; Smit and Wandel, 2006; Smit et al., 1999). Thus, household vulnerability to flooding risks can be described in terms of exposure to flooding; the sensitivity of housing, agricultural production and health to flood risk; and the adaptive capacity of these households.
Vulnerability has also been investigated in poverty dynamic research (e.g. Jalan and Ravillion, 1998; Sricharoen, 2011). This research strand usually considers poverty a stochastic process that can vary over different time periods. A household living above the poverty line in the present can subsequently become non-poor in the future due to the impact of a shock, and vice versa. Poverty can be classified as either chronic or transitory.
Therefore, in our article, household vulnerability to flood risk is simply defined as ‘the probability of a household’s income falling below the poverty line due to flood exposure’. Figure 2 illustrates the analytical framework of a household’s vulnerability to flooding.
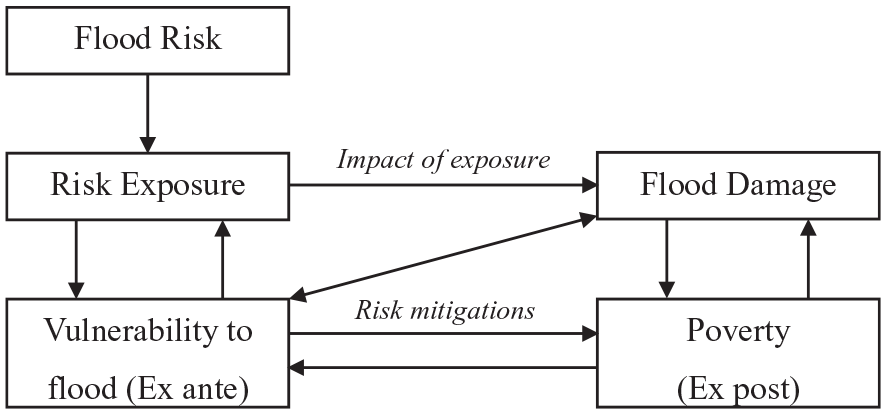
An analytical framework of household vulnerability.
The framework starts with a notion of flood risk. Flood risk signifies the possibility of downside flood effects in the future. However, the existence of risky events does not imply that households are exposed to them. Once a flood occurs, the households exposed to it could be positively or negatively affected by the impact. Risk exposure is characterized by the frequency and magnitude of flooding. From a household perspective, the degree of flood exposure can be measured through the flood duration and inundation depth. The impact of flooding on a household depends on both its degree of exposure and vulnerability level. More vulnerable households tend to suffer disproportionately from the downside effects of flooding since they do not have sufficient capacity to prepare for and cope with the shock. The result is that some households move or stay below the poverty line after the shock occurs.
Measuring vulnerability
Most poverty dynamic studies use indicators and indices to quantify vulnerability (e.g. Chaudhuri et al., 2002; Skoufias and Quisumbing, 2005). Some research indicates that at the local level, and when the system can be narrowly defined, vulnerability indicators are considered to be suitable means to identify particular people, regions or sectors (Barnett et al., 2008; Hinkel, 2011).
Chaudhuri et al. (2002) propose that vulnerability can be assessed using it as an expected poverty indicator. As defined above, vulnerability is the ex-ante risk that a household will, if currently non-poor, fall below the poverty line, or if currently poor, will remain in poverty. The authors use consumption as a welfare indicator and predict future consumption for each household based on the regression on household characteristics related to poverty, shocks and risks. The three-step feasible generalized least squares (FGLS) procedure proposed by Amemiya (1977) is employed to rule out the heteroskedasticity and measurement errors in the observed data on consumption expenditures. The advantage of this method is that it can be estimated with a single cross-sectional dataset, which is more likely to be available than panel data in developing countries.
Existing climate change and disaster management literature has used vulnerability as an expected poverty indicator to conduct vulnerability assessments. For instance, Deressa et al. (2009) assess household vulnerability to climate change in the Nile basin of Ethiopia by estimating the probability that a given shock or set of shocks will move a household’s income below the poverty threshold, or force its income level to stay below the threshold if it is already below this level. They include climatic shocks (droughts, floods and hailstorms) in the log-income model in order to predict the vulnerability probability, under the assumption that experiencing adverse climatic shocks will increase the probability of a farmer’s income being below the poverty line. Rayhan (2008) employs a similar approach using vulnerability as expected poverty to estimate the vulnerability of households to floods in Bangladesh. The flood-related variables are not included as explanatory variables for log-income, but rather idiosyncratic shocks captured in the disturbance term of flooded households. These shocks contribute to different per capita income levels of households that are otherwise observationally equivalent.
Although various approaches and methodologies are used to systemize vulnerability in many countries, the poverty dynamic literature provides strong empirical methods to estimate the vulnerability of households. These methods can also be used in studies involving environmental threats and natural hazards. The vulnerability as expected poverty estimate from poverty dynamic literature is the most suitable methodology for the current study because it encompasses the ability to (1) evaluate the relationship between vulnerability and poverty; (2) include the impact of environmental shocks (e.g. floods) on the well-being of households; and (3) use the cross-sectional data from the household survey.
Welfare effect
Recently, a growing number of studies have estimated the welfare effects associated with natural disasters in Vietnam. Thomas et al. (2010) find that riverine floods cause welfare losses of up to 23% while hurricanes reduce welfare by up to 52% in cities with populations over 500,000 by using Vietnam Household Living Standard Survey (VHLSS). Using the same data, Arouri et al. (2015) construct spatial maps of the economic impact of natural disasters on households. They find that storms, floods and droughts have negative effects on household income and expenditure. They then examine whether access to micro-credit, internal remittances and social allowances can help households strengthen the resilience to natural disasters. Bui et al. (2014) find a 6.9% and 7.1% decline in household per capita income and expenditure respectively due to natural disasters. However, a limited number of papers have estimated the impact of natural disasters on household vulnerability. In this study, we investigate the impact of flood risk on welfare (both income and vulnerability) at the household level using a household survey conducted in a north central province in Vietnam. While large-scale surveys such as the VHLSS and the Vietnam Access to Resources Household Survey (VARHS) help study the impacts of natural disaster in general, we focus only on floods by using a comprehensive survey specially designed with questions related to vulnerability, coping strategies and their associated costs for a specific important disaster, information which was missing in the pre-existing, regular surveys mentioned earlier. 1
Data and methodology
Background information on the study area
Nghe An province is located in north central Vietnam. With a total area of 16,493.7 km² and a population of 2.95 million people (2012), Nghe An is the largest and the fourth most populous province in the country. The province shares its border with Thanh Hoa province in the North, Ha Tinh province in the South, Lao PDR in the West and the South China Sea in the East with a 82 km long-coastline. Some 86.7% of Nghe An’s population live in rural areas. The small share of urban residents are based in the city of Vinh. Nghe An’s population density is about 178 people per square kilometre.
The topography of Nghe An is complex, with mountains and hills covering 83% of the natural land area. The province is divided by hills, mountains, rivers and streams, with a downward slope from the North to the West and the South to the East. The river system is dense, with a total length of 9,828 km of running rivers or sand streams, and an average river density of 0.7 km per square kilometre. Figure 3 shows the map of Nghe An province and its location in Vietnam.
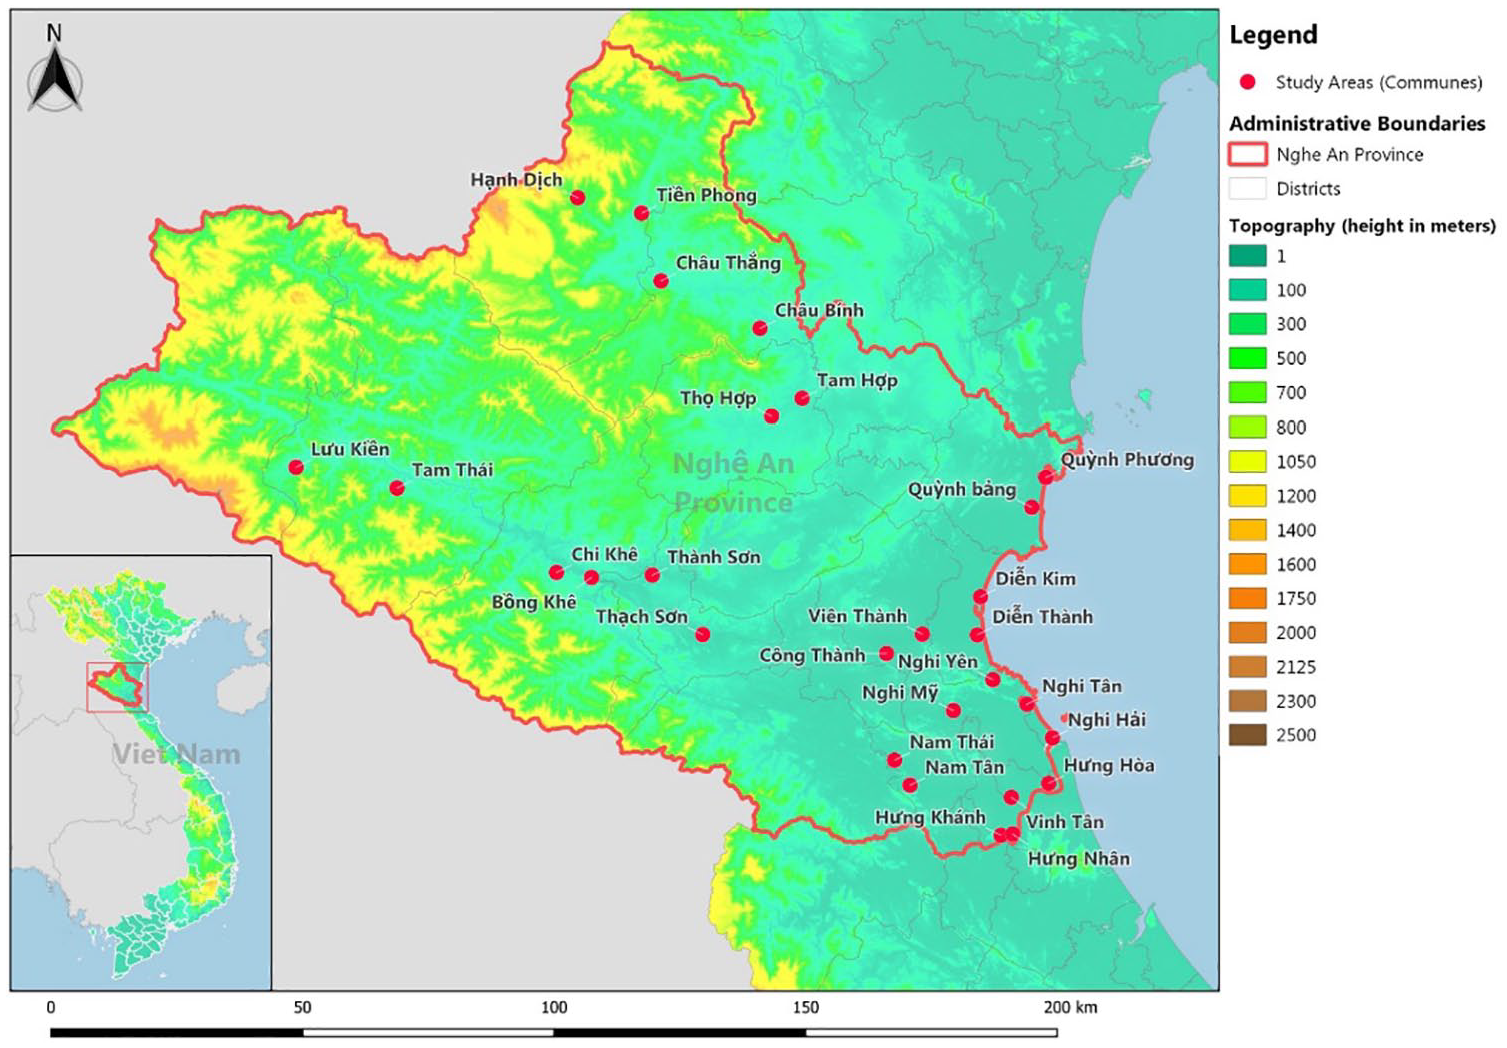
Map of Nghe An province and sample communes.
Nghe An has a tropical-monsoon climate, with extraordinarily rainy wet seasons and severe dry seasons. The annual dry season typically occurs from February to July, where temperatures of over 37 degrees Celsius are regularly recorded in June and July. During the wet season from August to January, there are typically high levels of rainfall and even typhoons.
Due to Nghe An’s complex topography and harsh climate, the province has been suffering from the effects of several natural disasters, including typhoons, floods, drought and high sea tides. Among them, typhoons and floods are disasters which have been causing the most substantial damage to the population and economy. The coastal areas suffer more from typhoons, while the plain and mountainous areas are usually more affected by floods. From 1990 to 2010, the area suffered 34 typhoons and 29 severe floods, causing significant losses in terms of infrastructure, the economy and fatalities. The most severe floods recorded occurred in the years 1954, 1963, 1973, 1998, 2007 and 2010, a frequency of about one in every ten years. The main reasons underlying the extreme sustained flooding in Nghe An are heavy rains, sea level rises and a decrease in protected forest areas. In multiple years, a typhoon has occurred at the same time as heavy rainfall, leading to the inundation of rivers. Also, the collapse of the dam system in 2010 resulted in the flooding of the downstream area, causing losses in human lives, properties and crops. Flooding over 21 years, from 1990 to 2010, induced economic losses of more than 3,300 billion VND (approximately US$157.4 million).
Data collection
The survey on flooding was conducted by a joint research project on Public Flood Management Policy between the Toulouse School of Economics and the Institute of Research in Economics, Environment and Data Science (IREEDS). Our sampling strategy relies on the geographical characteristics of the Nghe An province, which has mountains and hills in the East, and rivers and streams with a descending slope from the North-West to the South-East. Flood risks are significantly different depending on the location. In the mountains, households face flash-flood risks in addition to an associated risk of landslides. In coastal areas, people are directly affected by typhoons and tropical storms. People located along rivers or who live in delta river areas are affected by floods resulting from river overflows. After several meetings, a questionnaire and pilot study were designed and the final survey took place between April and June 2012, a period of time with no recorded floods or natural disasters in the Nghe An Province. First, 14 out of a total of 17 districts in Nghe An were selected based on geographical characteristics to include districts in coastal areas, plain areas and mountainous areas. Then, two representative communes were targeted within each district based on consultations with local representatives of the Ministry of Agriculture and Rural Development. Finally, within each commune, 16 households were randomly chosen from a list of households registered to their local villages. Figure 4 illustrates the sampling strategy used in the study. This sampling strategy guaranteed that the data collected would take into account all the different types of floods that may affect the local population, and that the household sample was representative of Nghe An’s population. In total, there were 448 households in 28 villages from 14 districts in Nghe An that took part in face-to-face interviews for the survey. Before contacting any of the households, we met with the head of their local village People’s Committee, in order to secure formal approval for the survey. Fewer than 10% of households refused to participate in the survey, representing only a small proportion of households contacted. For households that were absent and thus could not complete the questionnaire, the enumerator spoke with the household’s neighbours and completed some parts of the questionnaire, such as the name of the head or representative of the household. Then, absent participants were revisited by enumerators. In order to reduce any potential cultural bias, the enumerators were from the Van Xuan University of Technology in Nghe An province.

Sampling strategy.
The survey consists of seven sections. The first section poses questions about the households’ socio-demographic characteristics, such as income and family structure. This section also includes specific questions for farmers. The next section focused on the opinions and experiences of the respondents to flooding in the past, as well as their future expectations. The other sections include two choice experiments used to assess how Vietnamese households value a reduction in flood risks, and a flood insurance contract (Reynaud and Nguyen, 2016; Reynaud et al., 2013, 2018).
Measuring vulnerability
In this study, the approach of vulnerability as expected poverty is used to assess the vulnerability of households to flooding. This approach is based on Chaudhuri et al. (2002), who define vulnerability as the probability that a household, regardless of whether or not it is poor today, will be poor tomorrow.
Based on Chaudhuri et al.’s (2002) method, the vulnerability of a household h at time t is defined as the probability that the income of household h will be below the poverty line at time

where
Household income in any period in the future depends on several factors including current income, the risk (flood shock) affecting future income and its ability to mitigate risks. Each of these will, in turn, depend on observable and unobservable household characteristics. Thus, from a general conceptual level, household income can be defined as:

where
Substituting equation (2) into equation (1), the equation of vulnerability level can be written as:

The above equation shows that the household’s vulnerability level derives from the stochastic properties of the inter-temporal income stream it faces, and these in turn depend on several household characteristics.
The probability that a household will be poor depends not just on its expected income (i.e. mean income) but also on the volatility (variance from an inter-temporal perspective) of its income stream. To estimate a household’s vulnerability, both its expected income and the variance of its income need to be estimated, at a minimum. Ideally, this would be done using panel data of a sufficient length. With such data, the inter-temporal variance of income at the household-level could be directly estimated without the need for auxiliary assumptions. However, for cross-sectional data, certain assumptions need to be made to be able to conduct those estimations, in particular the assumption limiting the unobservable heterogeneity of future household incomes for those that are similar in terms of observable characteristics.
The assumptions for cross-sectional data start with a stochastic process which generates the log per capita income of a household h:

where
Equation (4) implicitly assumes that
The variance of

Parameters β and θ can be estimated using the FGLS procedure suggested by Amemiya (1977). This procedure first solves the problem of heteroscedasticity in the error term of equation (4). Conventional GLS could be suitable for estimating β, but obtaining the GLS estimator
Estimating β and θ using the FGLS, we can obtain the expected log per capita income and its variance:


By assuming that income is log-normally distributed, and using the above estimates, the probability that a household h will be poor can be estimated as follows:

where
Propensity score matching approach
We also use the propensity score matching (PSM) approach to estimate the impact of environmental risk, particularly flooding, on the outcome variables of interest (i.e. household income, vulnerability level). PSM allows us to use observable characteristics to construct a comparison group based on a model of the probability of participating in the treatment (Khandker et al., 2010).
Following Takahashi and Barrett (2014), the average treatment effect on the treated is defined as:

where E(.) is the expectation operator;

where
If the propensity score specification satisfies the balancing property, the average treatment effect on the treated (ATT) can be estimated using kernel-based matching. The ATT is computed by averaging the unit-level treatment effects of the treated, where the control unit outcome is matched to a treated observation using a kernel-weighted average of control unit outcomes.
Vulnerability assessment results
Socio-economic characteristics of the sample households
Out of 448 households questioned, 128 households experienced flooding with significant impacts in the past five years while 320 households did not. The summary statistics for the flooded, non-flooded and overall area are presented in Table 1. The average family size in the sample is approximately four people. The average age of household heads is 50.2 for flooded households and 46.7 for non-flooded households. Female-headed households account for approximately 36 to 37% in both household types and the overall sample. Most of the household heads are farmers with 72.7% in flooded households and 79.7% in non-flooded households. For flooded households, the per capita monthly income is 711,000 VND while the non-flooded household enjoys a slightly higher income of 733,000 VND per month. Most households in the sample have access to media such as television or radio. Interestingly, a higher number of flooded households have access to media and permanent housing than non-flooded households. Some 42.9% of the sample live in plain areas while the same proportion of households (28.6%) live in mountainous and coastal areas. It is noted that a significantly higher share of flooded households lives in plain areas (48.4%) than non-flooded households (20.6%). In contrast, the shares of non-flooded households living in mountainous (47.5%) and coastal areas (31.9%) are higher than the share of flooded households (31.3% and 20.3% respectively).
Socio-economic statistics of flooded and non-flooded households.
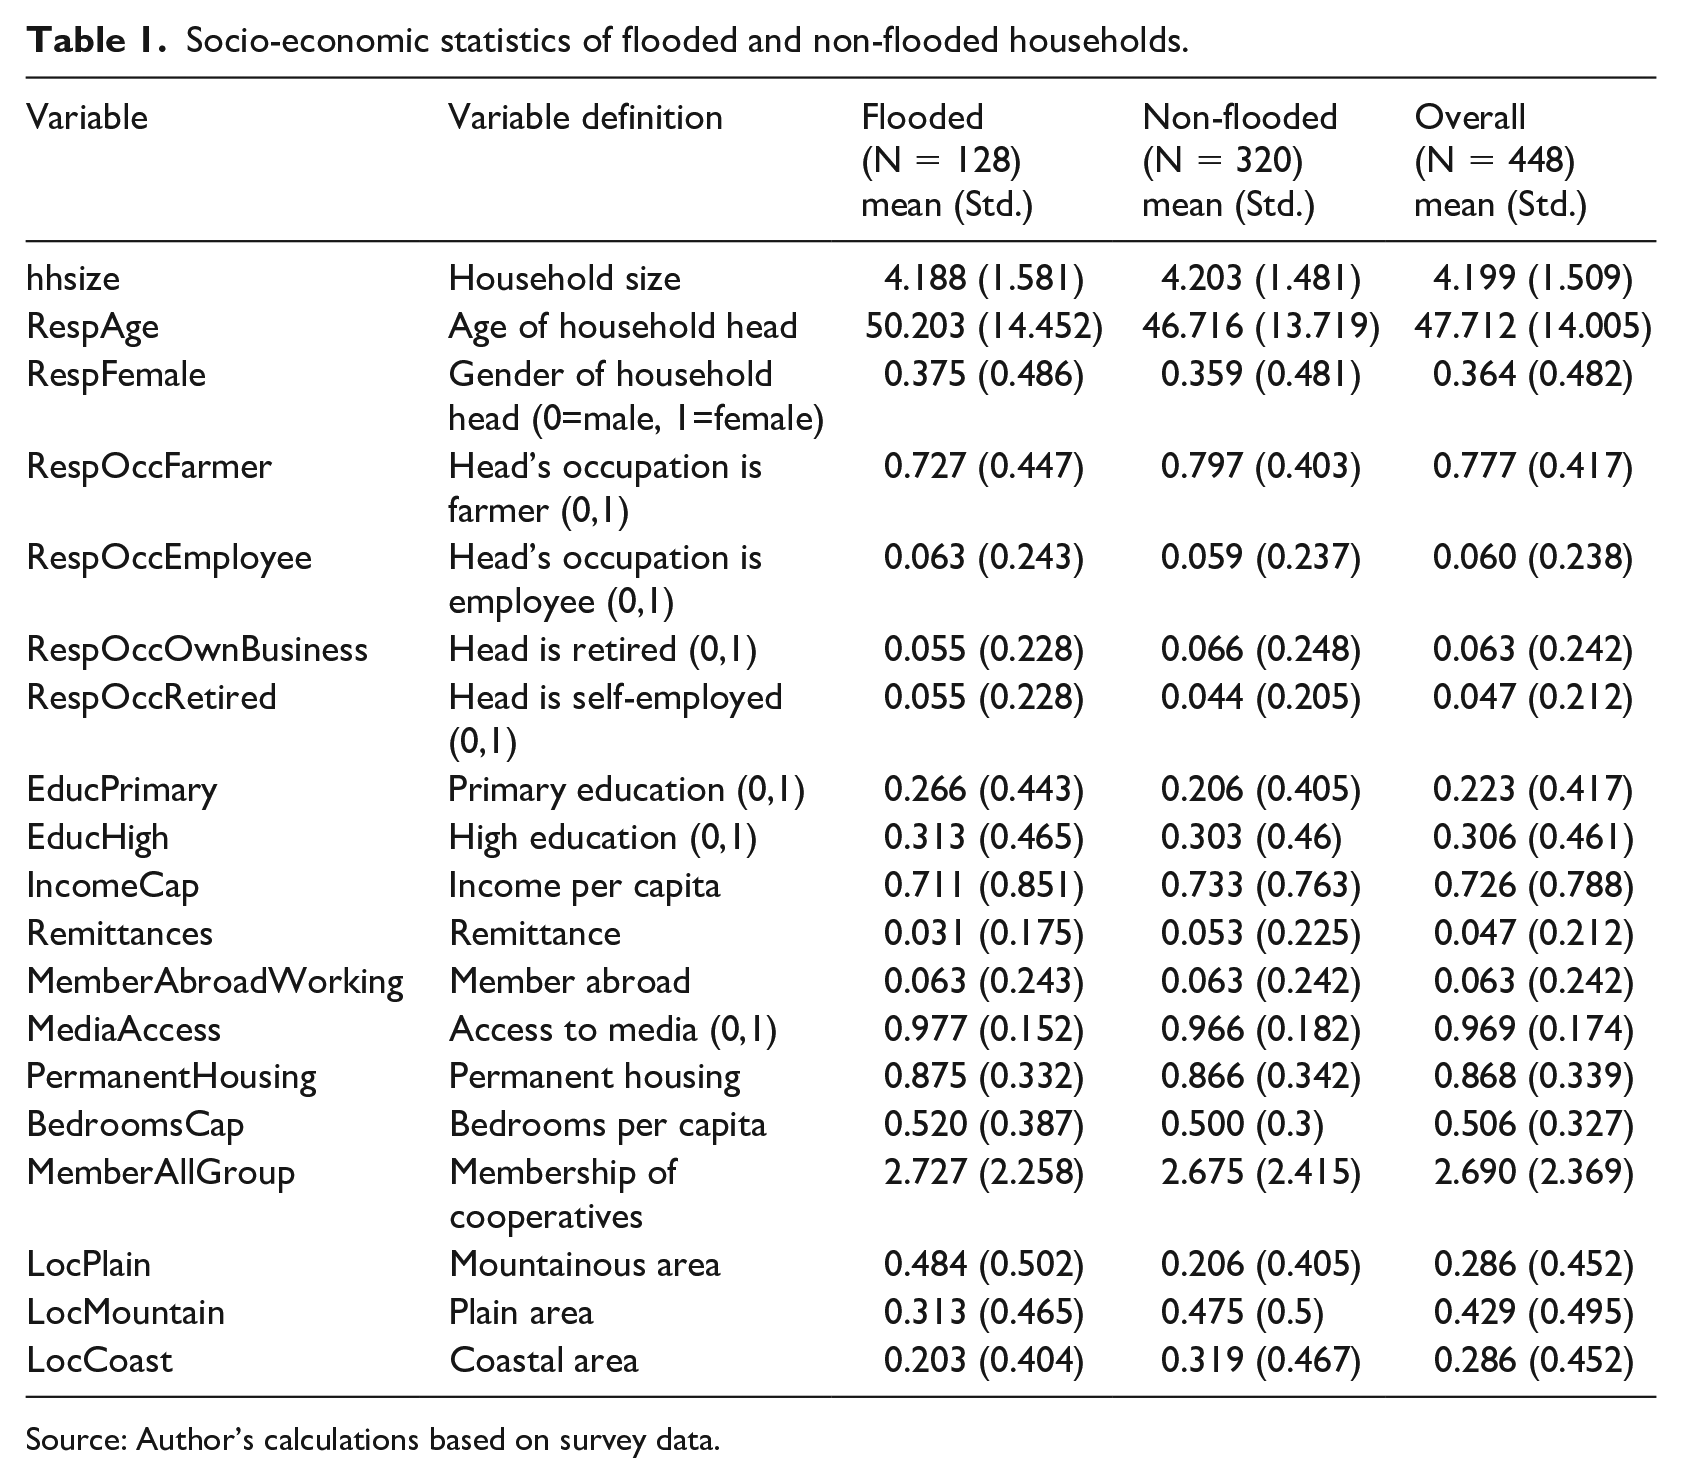
Source: Author’s calculations based on survey data.
Flood severity and impact of floods on the households
The severity of flooding is investigated in the survey through a series of questions on floods experienced in the period of 2006–2011. The results show that the average maximum level of inundation for flooded households was about 139 cm. The maximum water elevation in the sample reached 1500 cm for one household. On average, the houses were flooded almost six days per year. In some cases, households were flooded for more than one or two months. People questioned thought that they needed almost 13 days, on average, to recover from flooding (Table 2).
Flood severity for flooded households.
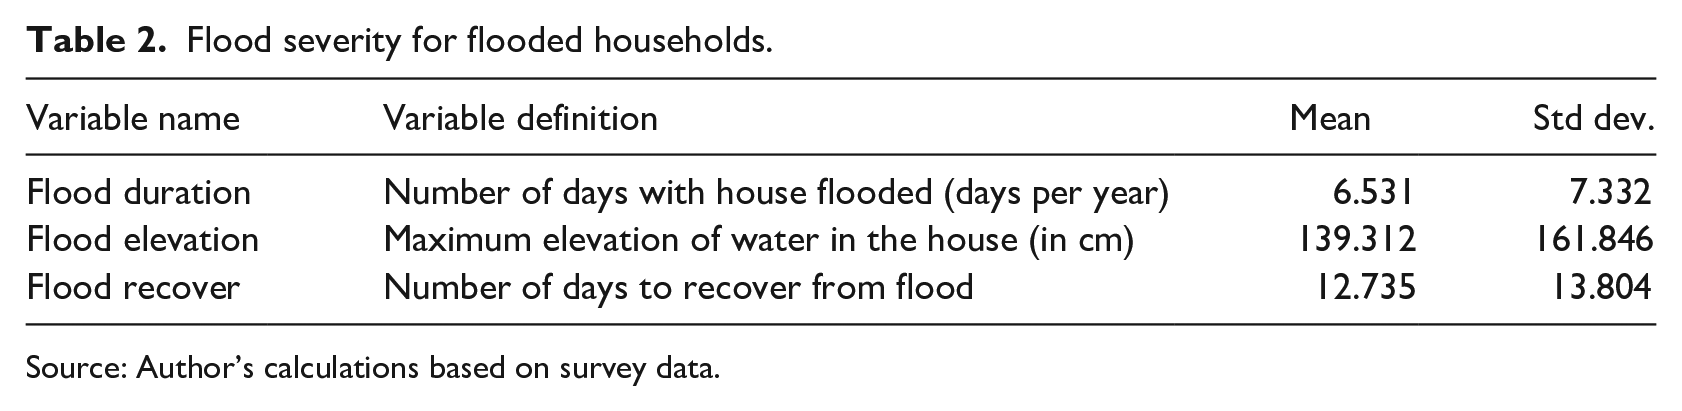
Source: Author’s calculations based on survey data.
Table 3 describes the impact of floods on the livelihoods of flooded households. Almost half of the flooded households (49.2%) used to be evacuated at least once in the past. On an annual basis, people from flooded households have to incur 8.5 million VND in damages to their homes, 7.2 million VND in damages to their agricultural production and 0.3 million VND in medical expenses due to floods, on average. Due to the inundation of households, the economic damage on housing seems to be largest, followed by agricultural damage, while health damage is relatively less severe. This is presumably because only 6.3% of households reported that one member in their family was injured between 2006 and 2011. However, flood cost variables should be taken with caution because the respondents tend to overestimate their real flood expenses to receive more government support. Households may also underestimate the expenses because they are not able to draw a direct connection between flooding and its corresponding expenditures (Reynaud et al., 2013).
Impact of flooding on flooded households.
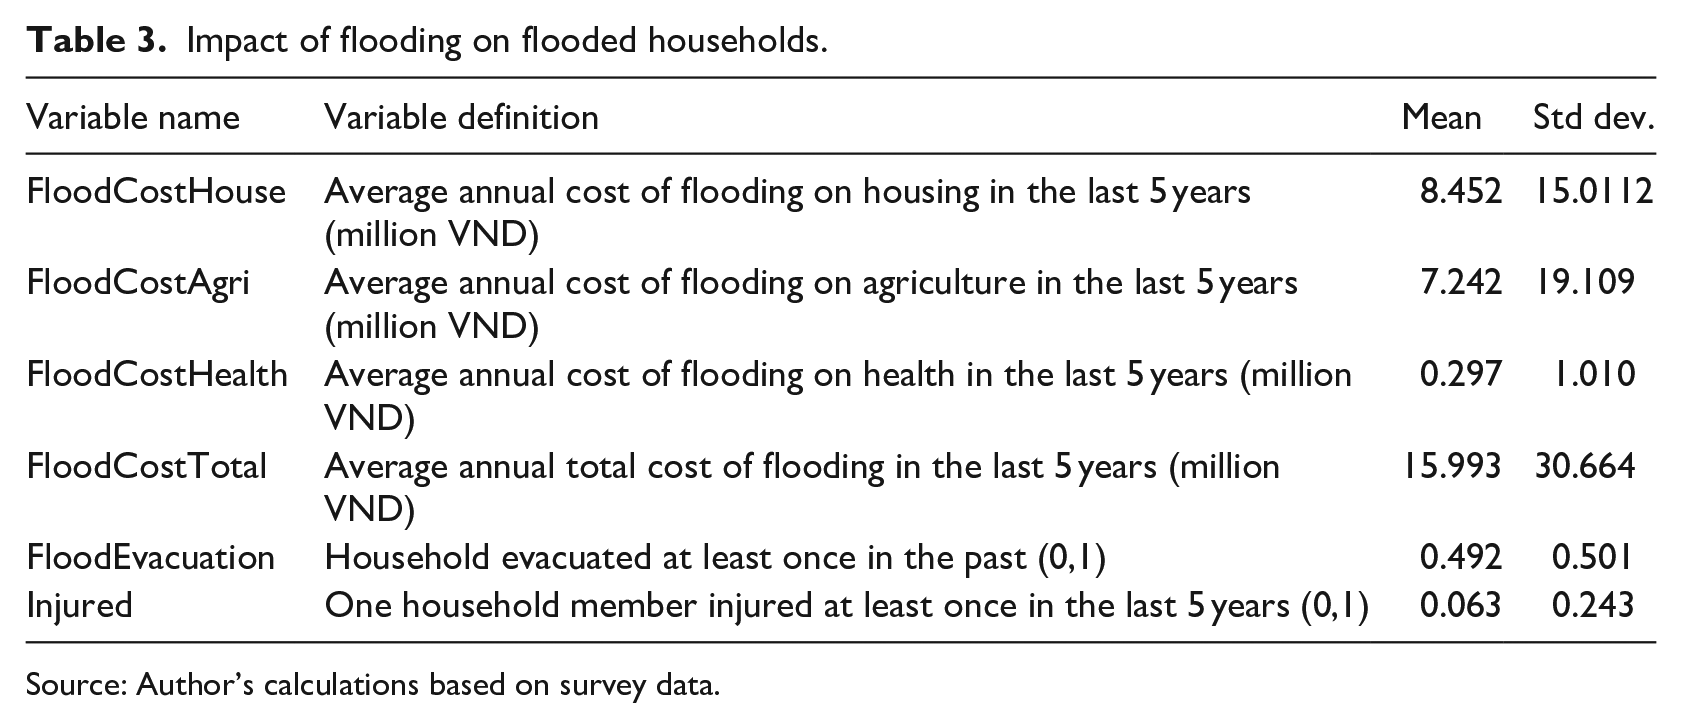
Source: Author’s calculations based on survey data.
Multivariate regressions of log per capita income
The vulnerability assessment starts with running multivariate regressions using log per capita income as the dependent variable (Table 4). The explanatory variables are a household’s socio-economic characteristics, including household size, household size squared, age of household head, age squared, education and occupation of the household head. Additional information regarding households’ housing and income is also included. The choice of explanatory variables was made based on similar literature (Adger, 1999; Rayhan, 2008). The results show that the household size has significantly negative impacts on the household’s income. Non-flooded families with higher education are more likely to have higher income per capita, and flooded households with heads with only primary education tend to have lower income per capita. Interestingly, female-headed households have a positive impact on the well-being of all households in general. The occupation of the household head has a significant impact on the income level of both flooded and non-flooded households. Those who have farmer household heads tend to have a lower income than households with the head working in other employment categories. Households’ per capita incomes are positively related to the number of bedrooms per capita, remittances and having at least one household member abroad.
Multivariate regressions of log per capita income.

Note: Estimator: Three-step FGLS; Dependent variable: Log per capita income; Standard errors in parentheses; *=significant at 10%, **=at 5%, ***=at 1% level.
The Ramsey RESET test (Gujarati, 2003) uses the powers of the fitted values of log per capita income to test the null hypothesis that the model has no omitted variables and, hence, is correctly specified. The estimated F-statistic of 1.16, with an associated probability value of 0.3245, indicates that the null hypothesis cannot be rejected at the 5% level of significance, and suggesting that the model does not suffer from omitted variable bias. The Breusch-Pagan test is employed to detect heteroskedasticity. The null hypothesis tested is that the model has constant variance. The p-value of 0.3811 suggests that the null hypothesis cannot be rejected at a 5% level of significance. This implies that the three-step FGLS method has provided an efficient estimation.
Vulnerability assessment results
The probability of falling below a given level of well-being, i.e. a poverty line, is estimated for each household in the sample. The poverty line applied in this current study is provided by the World Bank and the General Statistics Office of Vietnam for all Vietnamese households (Badiani et al., 2013), which is 653,000 VND per capita per month (equivalent to US$2.26 per capita per day). The poor households in this sample are identified by comparing the household income per capita to the poverty line. Vulnerable households are categorized as those with an estimated vulnerability level that is above the threshold of 0.5.
Figure 5 describes the per capita income and vulnerability levels of flooded and non-flooded households. The average income of poor and flooded families is slightly lower than that of their poor and non-flooded counterparts. However, there is not a substantial difference in indicators between the flooded and the non-flooded in the non-poor group. Surprisingly, the non-flooded group tended to suffer from a slightly higher level of vulnerability than the flooded. This result suggests that other socio-economic factors or other natural disasters might affect household vulnerability in this region, in addition to floods.
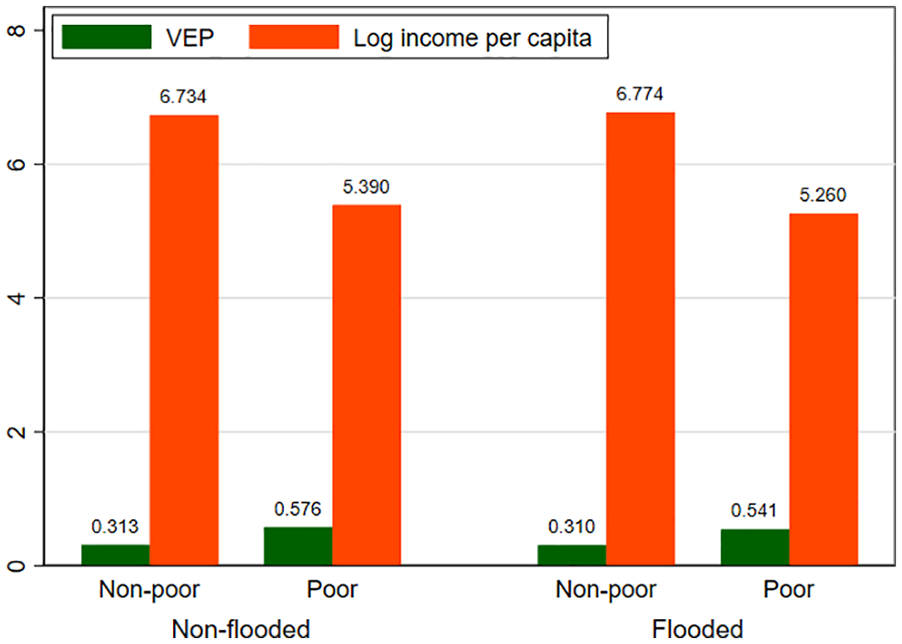
Vulnerability and poverty of flooded and non-flooded households.
Figure 6 illustrates poverty and vulnerability rates among the flooded and non-flooded groups. Most notably, the observed poverty rates in both groups are lower than the estimated vulnerability rates. This implies that the fraction of households that face a non-negligible risk of poverty (and hence, by definition, are assumed to be vulnerable) is higher than the fraction that is observed to be poor. Secondly, the poverty and vulnerability rates of flooded households are larger than those of non-flooded households. Some 35% of the non-flooded group are observed to be poor, while 43% of the flooded group are living under the poverty threshold. Similarly, the non-flooded have a lower vulnerability rate than the flooded. Thus, it seems that vulnerability is linked to poverty, but we cannot make a conclusive statement about the direction of the relationship, nor the effect of floods on household welfare, using just this number.

Poverty rates and vulnerability rates.
Figure 7 depicts the relationship between vulnerability and per capita income in the analytical sample. The x-axis represents the natural log per capita income obtained from the survey data, while the y-axis shows the estimated vulnerability level of each household. The horizontal line represents the vulnerability threshold of 0.5 and the vertical line represents the natural logarithm of the poverty threshold. These lines divide the graph into four sections. The households in the upper left quartile were poor at the time of the survey and are more likely to remain in poverty. This is considered the most vulnerable group. The households in the bottom left quartile were living below the poverty standard at the time of the survey, but due to certain characteristics they are not considered to be vulnerable. Those in the upper right quartile have income levels above the poverty line but are deemed to be more likely to become poor in the future. The bottom right quartile includes households that were above the poverty line at the time of the survey and are deemed to be less likely to be poor in the future. Figure 7 shows two important facts. Firstly, not only the flooded but also the non-flooded can be considered vulnerable, suggesting that other natural disasters or socio-economic disadvantages may have adverse effects on households’ livelihoods, which is similar to the findings of Thomas et al. (2010) and Arouri et al. (2015). Secondly, non-poor households can also be considered vulnerable and, therefore, the vulnerability approach is more appropriate for policymakers when designing development policies in response to future environmental hazards.
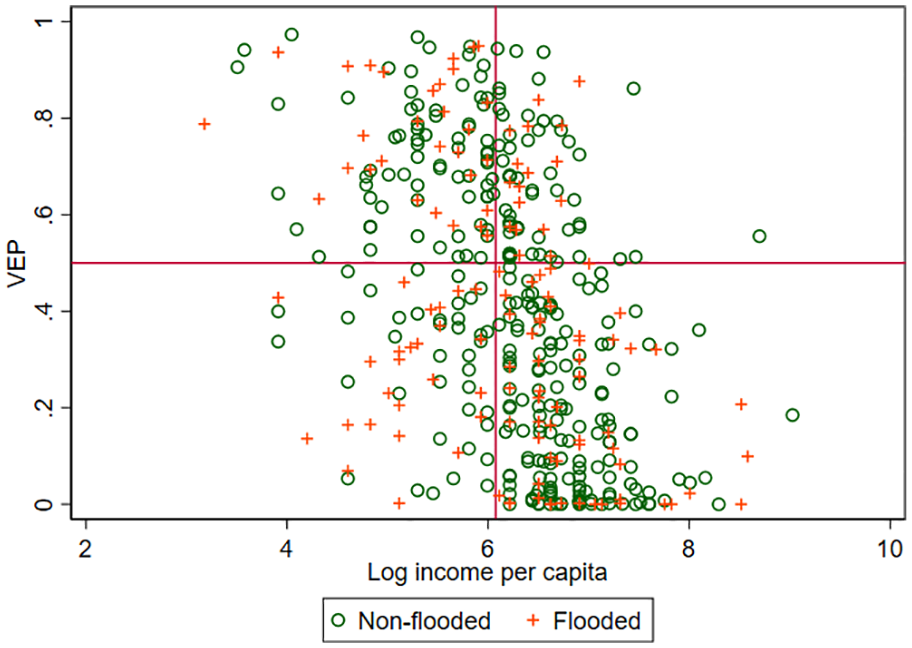
Vulnerability plotted against log per capita income.
In order to see if being flooded has a significant effect on predicted incomes, we employ the PSM approach and present the results in Table 5. The estimated ATT confirms that the flooded households’ income is about 17% lower than the non-flooded households’ income. Although the ATT is positive, the probability of becoming poor, or the VEP, cannot be explained by floods as the estimated ATT is insignificant. Floods tend to cause a higher cost of housing and agricultural production, but only the estimated figure for housing is significant. Health costs are only slightly different between the two groups as the ATT is insignificantly negative. The results suggest that floods cause income loss for flooded households, but this type of natural disaster is not the leading cause of poverty in Nghe An. This finding implies that the flooded households in Nghe An can cope with floods to some extent. The results confirm the findings from Thomas et al. (2010), which reveals that households more frequently exposed to floods are less damaged by the events. Many households even build their livelihood systems around riverine floods. As Thomas et al. (2010) put it, they have learned to live with it.
Comparing the effects of floods on households using the PSM approach.

Note: Estimator: Propensity Score Matching. Treated: Flooded (128 observations), Control: Non-flooded (319 observations). *=significant at 10%, **=at 1%.
We then investigate the effectiveness of financial support from various sources on vulnerability and income. While Arouri et al. (2015) showed that micro-credit, internal remittances and social allowances could be sources of support for households adversely affected by natural disasters, the results in Table 6 show that only family support can help households reduce the probability of being poor while support from friends does not have a significant effect. Unfortunately, other types of financial support are either ineffective or inadequate, suggesting that governments should pay more attention to formal coping strategies to mitigate the adverse effects of floods on the households in the area.
Financial support sources and vulnerability.

Note: Estimator: OLS. Robust standard errors in parentheses. *=significant at 10%, **=at 1%.
Conclusion
Households living in flood-prone areas seem to be bearing the negative impacts of flooding. Based on a cross-sectional household survey in the Vietnamese province of Nghe An, household vulnerability to flooding risk has been assessed using the vulnerability as expected poverty approach. This study finds that flooding results in significant income losses and imposes higher costs of living, especially housing costs. Although the flooded households are observed to be more impoverished and more vulnerable than non-flooded households, floods are not the leading cause of poverty in Nghe An, as the estimated probabilities of becoming poor between the flooded and the non-flooded households are not significantly different. Both flooded and non-flooded households experience vulnerability, implying that other natural disasters or socio-economic disadvantages may also have adverse effects on households’ livelihoods. The insignificant effect of floods on vulnerability indicates that the flooded households can cope with floods to some extent. However, contrary to family support, formal coping strategies are insufficient or ineffective at reducing household vulnerability. The study implies that local government should pay more attention to all types of natural disasters as well as formal coping strategies to moderate the adverse effects of income loss and vulnerability.
A number of limitations to this study need to be acknowledged. Firstly, the use of vulnerability as expected poverty approach and the three-step FGLS requires strong assumptions, partly due to the application of cross-sectional data. The variability of income across households is assumed to mirror inter-temporal variability. That means there should be no correlation between observed shocks and unobservable household characteristics captured in the disturbance term. The disturbance terms are assumed to be identically and independently distributed over time for each household and across households. Without these assumptions, the estimation procedure may need to correct for the autocorrelation.
Additionally, the structure of the economy, captured by the coefficient in the model of log per capita income regressed on household characteristics, is assumed to be relatively stable over time. Future studies with longitudinal data can overcome these disadvantages. Secondly, an issue that was not addressed in this study was assessing the effects of mitigating disaster shocks. Using a choice experiment, Reynaud and Nguyen (2016) computed the willingness to pay, to assess how Vietnamese households calculate a value for a reduction in flood risks. Giesecke et al. (2013) and Le (2020) assessed the effects of removing the paddy land designation policy in Vietnam that could see increases in real GDP, agricultural productivity and consumption. It would be interesting to compare the impacts of flooding with other shocks in Vietnam such as land use restrictions. Further research on these questions is needed to better understand the possible link between climate and economic policies in Vietnam.
Research Data
sj-do-1-jas-10.1177_0021909621993499 – Research Data for Vulnerability to Natural Disaster and Welfare Effect: A Case Study of Flood Risk in Vietnam’s North Central Region
Research Data, sj-do-1-jas-10.1177_0021909621993499 for Vulnerability to Natural Disaster and Welfare Effect: A Case Study of Flood Risk in Vietnam’s North Central Region by Manh-Hung Nguyen, Dung P Le and Thang T Vo in Journal of Asian and African Studies
Research Data
sj-dta-2-jas-10.1177_0021909621993499 – Research Data for Vulnerability to Natural Disaster and Welfare Effect: A Case Study of Flood Risk in Vietnam’s North Central Region
Research Data, sj-dta-2-jas-10.1177_0021909621993499 for Vulnerability to Natural Disaster and Welfare Effect: A Case Study of Flood Risk in Vietnam’s North Central Region by Manh-Hung Nguyen, Dung P Le and Thang T Vo in Journal of Asian and African Studies
Footnotes
Acknowledgements
We would like to thank Arnaud Reynaud for his invaluable scientific guidance on this research. We thank Nguyen Nhung and Nguyen Duy Thanh for their support in survey data.
Funding
The author(s) disclosed receipt of the following financial support for the research, authorship, and/or publication of this article: This research is funded by the Vietnam National Foundation for Science and Technology Development (NAFOSTED) under grant number 502.01-2016.18.
Notes
Author Biographies
![]() ).
).
References
Supplementary Material
Please find the following supplemental material available below.
For Open Access articles published under a Creative Commons License, all supplemental material carries the same license as the article it is associated with.
For non-Open Access articles published, all supplemental material carries a non-exclusive license, and permission requests for re-use of supplemental material or any part of supplemental material shall be sent directly to the copyright owner as specified in the copyright notice associated with the article.