
Abstract
This paper reviews the economic policies adopted by the Indian government under different policy regimes, provides a political economy perspective of economic growth in the country during 1950–2020 and examines the inclusiveness of the rapid economic growth in recent decades. The growth performance of the economy improved as the economy moved from inward-looking policy regime to the regimes of pro-business and pro-market policies. India’s political economy was supportive of the changes in policy regime. After growing at a sluggish rate during the first three decades after 1950–1951, the gross domestic product (GDP) growth accelerated significantly after the pro-business reforms in the 1980s, and there was further acceleration after the pro-market reforms since 1991–1992. It has, however, slowed down in recent years. Nevertheless, it has not been inclusive, as the benefits of growth have not reached all sections of the population and all regions of the country equally. On the contrary, disparities in income across regions and inequalities in income, wealth and consumption among individuals have exacerbated, and the problems of unemployment and poverty have been persisting in the economy.
Introduction
The Indian economy has made significant economic progress over the last 30 years. After growing at a sluggish rate of 3.62% during the first three decades after 1950–1951, its gross domestic product (GDP) had grown at an average rate of 5.56% during 1980/1981–1990/1991. The growth acceleration in the subsequent decades since 1991 is quite remarkable, and India has become one of the fastest growing economies in the world. The country has achieved this growth, functioning within the framework of a democracy, unlike many other high-growth East Asian economies. However, the rapid growth in recent decades has not been inclusive and the quest for inclusive growth remains elusive, as the benefits of economic growth have not reached all sections of the population and all regions of the country equally. It has been associated with widening disparities across regions, increasing inequalities of income, wealth and consumption among individuals, and persisting unemployment and poverty.
Several attempts were made to explain the Indian development experience. A number of researchers have offered political economy perspective of development in India. It is argued that the distribution of political and economic power has influenced the directions of economic policies and economic development in the country. Bardhan (1984) offered an important political economy perspective of development. He argued that while vast masses of the people are poor and socially disadvantaged and a relatively small minority holds much of the power, the ‘dominant elite’, comprising large and medium business houses, large and medium-sized farmers, the top layer of unionised labour and the government bureaucracy, is powerful and influences government’s economic policy. The distribution of power is crucial in determining the nature of class formation and mode of production, and the emergence of a particular mode of production has significant implications for growth and distribution.
India’s growth dynamics, reflecting the country’s transition from regimes of stagnation to regimes of rapid growth, has often been explained in terms of the changing role of the state under different policy regimes. It is argued that while the sluggish growth during the first three decades after 1950 was largely due to a highly interventionist state following inward-looking import-substitution policy with excessive controls on almost every sphere of the economy, the acceleration of growth during the 1980s was due to the loosening of state controls and adoption of some pro-business economic reforms. The policy regime, which was pro-socialist, left-leaning, pro-poor and somewhat anti-business during the first 30 years after Independence, turned pro-business in the 1980s in terms of government’s preferential treatments and incentives to established and large business houses. This shift in policy regime significantly improved the property rights environment in the economy which led to higher private investment and economic growth in the 1980s (Kohli, 2006a, 2006b; Rodrik and Subramanian, 2004). Further acceleration of growth since the early 1990s has been largely due to the pro-market economic reforms involving structural adjustment and liberalisation programmes since 1991. The pro-market reforms have led to lowering of costs, increased productivity and higher growth rate (Kar and Sen, 2016).
It is argued that institutional changes under the two policy regimes have contributed significantly to growth acceleration in the 1980s and 1990s. While the pro-business reforms focused on institutional arrangements under which the government dealt directly with established and large business houses to encourage growth, the pro-market reforms focused on the government’s policies encouraging the whole range of private sector firms through institutional and infrastructural facilities (Kar and Sen, 2016). Kohli (2006a, 2006b) argued that growth acceleration in the country was more a function of the pro-business inclination of the government embracing domestic capitalists as its main ally and less a result of the pro-market liberalisation since 1991. Sen and Kar (2014) and Sen et al. (2014) explained India’s post-reform growth experience in terms of a set of ‘predictable informal relationships’ (‘ordered deals’) between political and economic elites. Kar and Sen (2016) argued that bi-directional causal relations between institutional arrangements and growth outcomes have given rise to growth transition from one policy regime to another.
This paper reviews the economic policies adopted by the Indian government under different policy regimes, provides a political economy perspective of economic growth in the country over a long period of 70 years from 1950 to 2020 and examines whether the impressive economic growth in recent decades under liberalised policy regimes has been inclusive or not. The rest of the paper is organised as follows. The next section reviews the nature of state interventions and the policies adopted during different phases and evaluates the growth performance of the economy, providing a political economy perspective of development. It then examines the inclusiveness of growth, evaluating the trends in inequality of income across states, inequality of income, wealth and consumption among individuals and incidence of poverty and unemployment. The concluding section summarises the major findings and draws conclusions.
Policy regimes and growth performance
The Indian government has followed the path of planned economic development since 1951 with the introduction of the First Five-Year Plan. Under the successive Five-Year Plans, the government implemented various policies and programmes with the primary objectives of (1) achieving high economic growth with equality, (2) reducing unemployment and poverty and (3) achieving balanced regional development. The post-Independence period has witnessed major policy changes at several time points, and the performance of the economy in various dimensions of development was greatly influenced by the development strategy implemented. The economy has experienced wide fluctuations in the growth rate of GDP, widening regional disparities in development, rising inequalities in income and wealth, persisting unemployment and poverty and so on. This section reviews the economic policies adopted by the government during different policy regimes, and provides a political economy perspective of economic growth in the country. Based on the evidence of notable shifts in the policy regimes and transition of the economy from regimes of growth stagnation to regimes of growth acceleration, the period since 1950 can be divided into four sub-periods: (1) 1950/1951–1979/1980, (2) 1980/1981–1990/1991, (3) 1991/1992–2013/2014; and (4) 2014/2015 onwards.
Period of controls and Licence Raj (1950/1951–1979/1980)
During the period from 1950–1951 to 1966–1967, efforts were made to step up investment, accelerate growth and achieve social justice. India’s first Prime Minister Jawaharlal Nehru had a strong faith in socialist ideals, which significantly influenced India’s post-colonial development model. The primary aim was to achieve a ‘socialistic pattern of society’ based on the Nehruvian socialistic approach with the public sector playing a crucial role, controlling almost everything including resource access and allocation to the private industrial sector. However, despite rapid expansion of public ownership and management of many strategic and basic industries, the economy was, in effect, ‘mixed’, as a large part of the economy remained under private ownership (Krishnaswamy, 2007). The First Five-Year Plan (1951–1956) accorded high priority to agriculture, irrigation and infrastructure. However, inspired by the Soviet model of development with capital-intensive industrialisation, and influenced by the thought that underdevelopment was due to the lack of industrialisation, the Second Five-Year Plan (1956–1961), based on Feldman–Mahalanobis two-sector model, shifted the strategy to industrialisation through development of heavy industry led by public sector investment.
The approach to development during this period had three components: (1) import-substitution and inward-looking policies, giving protection and opportunity to Indian industries to become competitive in the world market, (2) focus on the public sector and (3) centralised planning. The development strategy was based on a policy regime with the objectives of (1) gaining control over the ‘commanding heights’ of the economy through increase in public ownership of means of production, with basic and heavy industries reserved exclusively for the public sector and (2) binding the private sector to conform to Plan priorities through quantitative restrictions on private investment, capital issues, foreign collaborations, import of technology, capital goods and intermediate inputs (Acharya et al., 2006). The government adopted a host of regulatory measures such as industrial licensing for private investments, export and import controls, price controls and system of taxes, subsidies and allocations.
The agrarian policies, undertaken before the food shortage crisis caused by the unprecedented droughts in 1965–1966 and 1966–1967, were mostly related to agrarian reforms, institutional changes and development of major irrigation projects. Intermediary landlordism was abolished, tenants were given security of farming and ownership of land, land ceilings were imposed to eliminate large landholdings, cooperative credit institutions were strengthened and land consolidation programmes were implemented to reduce fragmentation of land holdings.
Driven by socialist ideals, the development strategy followed during the Nehruvian era also focused on social sector policies. The government played a proactive role in the provision of merit goods like health and education. An elaborate public health care system and infrastructure facilities were developed. Similarly, an elaborate network of public-funded colleges, universities and other institutions of higher learning in sciences, technology and management were created.
The GDP and per capita Net National Product (NNP) grew at the rate of 3.41% and 1.44%, respectively, during 1950/1951–1966/1967. Industry and services grew at the rate of 6.06% and 4.76%, respectively. However, due to the unprecedented droughts in 1965–1966 and 1966–1967, the agricultural sector performed poorly, registering a growth rate of 1.77% (Table 1).
Growth performance in India.

Source: Author’s estimate based on data from Reserve Bank of India (2010, 2017, 2020).
GDP: gross domestic product; NNP: net national product.
The strategy of ‘development through planning and controls’, adopted during the 1950s and 1960s, continued in the 1970s. The policy makers recognised the need for using a wide variety of instruments and controls to promote industrial development in a desired direction. The period (1966/1967–1979/1980) witnessed a marked strengthening of the import-substitution strategy and a clear preference for government controls over a widening area of economic activity viz., industrial licensing, import, foreign exchange, foreign exchange rate, capital market, prices and banking (Acharya et al., 2006; Bhattacharya and Kar, 2007). A number of banks and insurance were nationalised, and Foreign Exchange Regulation Act (FERA) and Monopoly and Restrictive Trade Practices (MRTP) Act were enacted. The development strategy was also influenced by some left-leaning pro-poor polices such as garibi hatao (remove poverty) and 20-point economic programme, adopted by the Congress government led by Indira Gandhi.
In the early 1960s, the country faced a severe food shortage crisis for which a large quantity of wheat had to be imported. This provoked the policy makers to search for a breakthrough in agricultural production and reduce the dependence on foreign countries for food grains. This prompted the government to introduce the high yielding varieties (HYVs) of wheat and rice in the mid-1960s in the areas with assured irrigation. This marked the beginning of the second phase of agrarian policy during which agrarian reforms were given secondary importance, and the policies concerning research, extension, input supply, agricultural credit, marketing, price support and dissemination of the HYV-technology were given the prime importance. The green revolution technology was remarkably successful in raising food grains production and attaining self-sufficiency in food grains like wheat and rice. Two important institutions – Food Corporation of India (FCI) and Agricultural Prices Commission (APC), later renamed the Commission for Agricultural Costs and Prices (CACP) – were established to ensure remunerative prices to farmers, maintain reasonable price for consumers, procure food grains and maintain buffer stocks to run the public distribution system (PDS) and to avoid the adverse impact of seasonal fluctuations in output on price stability. Farm lobbies, dominated by large farmers, has played a significant role through their pressure for raising support prices in order to compensate for increasing production costs due to rising prices of agricultural inputs. Evidence shows that the government has been succumbing to such pressure and raising support prices almost every year. The pre-capitalist mode of production has been gradually replaced by the capitalist mode, and there has been a progressive unfolding of capitalism in Indian agriculture. This development has significant implications for poverty and inequality (Patnaik, 1990).
Though aggregate investment continued to rise during most of the period (1967/1968–1979/1980), there was no significant acceleration in the growth rate of GDP (3.59%) or in per capita NNP (1.16%) from the rate achieved during the preceding period. It was thought that productivity growth had lost momentum under the development strategy full of controls. Industrial growth rate decelerated from 6.06% during 1950/1951–1966/1967 to 4.58% during 1967/1968–1979/1980. The services decelerated from 4.76% to 4.08%. However, due to introduction of the HYV-technology, agricultural growth improved from 1.77% to 2.59% (Table 1).
Pro-business reforms (1980/1981–1990/1991)
The slow growth in the industrial sector raised doubts about the efficacy of the system of extensive controls on industry, finance and foreign trade and payments. The second oil price shock of 1979–1980 and the subsequent recourse to the International Monetary Fund (IMF) strengthened the doubts. It was felt that there was a need to move towards a market-led economy, which would ensure higher growth rates. The policy makers were convinced by this idea, and the moves towards market-led economy gained momentum during the 1980s (Acharya et al., 2006).
India’s political economy was supportive of pro-business and pro-growth policies in the 1980s (Kohli, 2012; Mehta and Walton, 2014). The country wanted to change its left-leaning anti-capitalist policies, prioritise economic growth and embrace slowly but steadily the domestic capitalists as the main ally. The Congress government under the leadership of Indira Gandhi and Rajiv Gandhi (1980–1989) began to show its inclination to economic policies more clearly in the direction of big business Kohli (2006a). Initiatives were taken to tame labour activism in the organised sector and to encourage private investments with limited tax concessions. After coming back to power in 1980, Indira Gandhi toned down her anti-capital rhetoric that she used in the 1970s, and announced an economic policy with top priority to economic growth. Several policies were adopted showing government’s intention to create an environment where private industrialists would be supported. This led to a growing alliance between the political and economic elites (Kohli, 2006a, 2006b, 2012; Sen et al., 2014; Sen and Kar, 2014).
The alliance was strengthened when Rajiv Gandhi came to power in 1985 with an overwhelming majority. Apart from initiating some pro-business economic reforms, particular interest was taken in modern sectors, such as IT and engineering, and attempts were made to bring in new economic elites from these emerging sectors into the relationship that existed between the political elite and the business sector. Moreover, with the emergence of non-traditional business groups in southern and western India, there was a growing diversification of business ownership which led to a broadening of the alliance between the political and business elites (Mehta and Walton, 2014). Thus, by the late 1980s, with the emergence of new economic elites in modern sectors and in states outside the industrial heartlands of Gujarat and Maharashtra, the macro-level deals (alliance) environment had become distinctly ‘ordered’ and more open (Sen et al., 2014; Sen and Kar, 2014).
The policies adopted for the industrial sector were clearly growth-enhancing pro-business in nature. A new Industrial Policy Statement was framed in 1980, liberalising the licensing for large-scale industries, regularising the installation of excess capacity and allowing automatic expansion of capacity to some of them. The growing irrelevance of the MRTP Act was recognised, and a number of industries were exempted from this Act. A number of industries were de-licensed from the FERA in 1986. The threshold limit for FERA was also raised. In 1985, a trade policy was announced to provide more flexibility to the exporters and importers. Import controls, especially on capital and intermediate goods were slowly but steadily liberalised. Two important policy changes were made in the fiscal sector: (1) adoption of expansionary fiscal policy involving high level of government expenditures; and (2) change in the method of financing these expenditures from a tax-financed to a debt-financed programme.
While there was a clear change in economic policies towards de-licensing and de-regulation in the industrial sector, there was no major change in agricultural policy during the 1980s. However, agricultural growth and the rise in real farm incomes led to the emergence of interest groups and lobbies, consisting mainly of large- and medium-sized farmers (the ‘dominant elite’ in rural area), who started influencing the farm policy in the country. Subsidies and support to the agricultural sector increased considerably during this period at the cost of declining public sector investment in agriculture, which was partly compensated by increasing private investment in this sector. The rural economy also experienced a process of diversification that contributed to the growth in non-foodgrain output like milk, fishery, poultry, vegetables, fruits and so on.
The economy experienced significant growth acceleration in the 1980s compared to the previous period. The industrial and services sectors performed very well presumably due to an attitudinal shift of the government towards a pro-business approach. Industry grew at a higher rate of 6.37%, the services at 6.32% and agriculture at 4.37%. The improved performance of the three sectors yielded an impressive growth of GDP (5.56%) and per capita NNP (3.16%) in the 1980s, a significant decade for the Indian economy, breaking free of the ‘Hindu rate’ of growth (Table 1).
Pro-market economic reforms (1991/1992–2013/1914)
Some of the policies followed during the 1980s had given rise to a number of problems that created a critical situation in the economy in the early 1990s. (1) The shift from the tax-financed expenditure to the debt-financed expenditure programme had led to steady increase in both the domestic and external debt-GDP ratios. By the end of the 1980s, these ratios had reached such high levels that there was a genuine worry to India falling into a debt trap. (2) Fiscal deficits-GDP ratio mounted to as high as 8.14% and spilled over to the external sector, requiring growing recourse to external borrowing on commercial terms. (3) Low export-GDP ratio, rising trade and current account deficit and deteriorating external debt profile and external shocks viz., the 1990 Gulf War, leading to a hike in oil prices and the import bill, and slowing down in remittances from the Gulf countries put pressure on the balance of payments situation. The situation was such that foreign exchange reserves came down to a level that was less than the cost of 2 weeks’ worth of imports. (4) The economy experienced a double-digit inflation rate in the late-1980s. To break out of the critical macroeconomic and balance of payments situation, India took a substantial amount of loan from the IMF in 1991 and devalued the rupee by 22% against the dollar.
These problems along with the changed situations in the global economy due to disintegration of the Soviet Union and increasing importance of neo-classical economics in the United States of America and dependence of the European Union and other countries on exports to these economies created a situation urging for a radical shift in policy in the early 1990s. Besides, domestic lobbies (e.g. business/corporate lobbies) were becoming strong enough, supported by the IMF and World Bank and capital exporting countries, to influence the government to go for ‘liberalisation, privatisation and globalisation’ policies. Overall, the stage was set for a ‘paradigm shift’ from the Nehruvian model of planning to a neo-classical model of resource allocation based on market principles (Krishnaswamy, 2007).
Taking this opportunity, the government under the leadership of P.V. Narasimha Rao with Manmohan Singh as its finance minister had shown the courage to initiate comprehensive economic reforms since 1991, overturning the Nehruvian ideas. Even though the government did not have a majority in the Parliament, the severe economic crisis in the early 1990s provoked the government to initiate major reforms, making fundamental changes in the content and approach to economic policy. The thrust of the reforms was to open Indian markets to international competition, reduce government controls, encourage private investment and participation, liberalise access to foreign capital and attract foreign investment (Acharya et al., 2006). The reforms involving radical changes in trade and industrial policies were thought to be essential to ensure long-term viability in the balance of payments and to restore the condition for rapid growth in the economy.
The pro-market reforms include the following: (1) fiscal policy reforms, aiming at fiscal consolidation, rationalisation of the tax structure and the reduction of subsidies and the fiscal deficit; (2) financial sector reforms, including liberalisation of interest rates, relaxation of controls on capital issues, freer entry for domestic and foreign private banks and opening up of the insurance sector; (3) liberalisation of industrial policies and abolition of industrial licensing; (4) reforms in foreign trade and investment, liberalising foreign trade in goods, services and technology, eliminating import licensing, reducing tariff and non-tariff barriers (NTBs) and liberalising foreign direct and portfolio investment; (5) infrastructure sector reforms, encouraging private investment in infrastructure and telecommunications; (6) prudent management of exchange rate allowing the market to play a major role in its determination and making the rupee convertible for current account transactions; (7) opening the energy and telecommunication sectors to both domestic and foreign private investment; and (8) reforms in agriculture, aiming at liberalising both internal and external trade in agricultural commodities, advancing the openness and integration of the agricultural sector to the world economy (Acharya et al., 2006; Ahuja et al., 2006; Panagariya, 2005).
The process of reforms in agriculture was initiated since 1994–1995 when India became a part of the multilateral trading system under the World Trade Organization (WTO). Tariff rates (TRs) and NTBs were reduced for several commodities, and provisions were made to revise them, keeping in view the movements of world commodity prices, increase in imports and concerns for food security and self-sufficiency. Measures for promotion of export of agricultural commodities were initiated through removal of restrictions on licensing, minimum export price and so on. The policy reforms liberalising the restrictions on internal trade in agricultural commodities include (1) removal of restraints on inter-state movement of food grains, (2) restructuring of the PDS, (3) relaxation of restrictions under the Essential Commodities Act, (4) introduction of forward trading in most agricultural commodities and (5) removal of some restrictions on marketing of crops (Athukorala, 2005; Bathla, 2006). However, public investment in areas of critical importance for agricultural growth, such as, irrigation and drainage, soil conservation and water management systems and rural infrastructure has declined since 1980.
Unlike a pro-business strategy, which mainly supports established enterprises, a pro-market strategy supports new enterprises and consumers and rests on the idea that free play of markets leads to efficient allocation of resources, promote competitiveness and boost production and growth (Rodrik and Subramanian, 2004). The reforms contributed significantly to strengthen the ordered nature of the deals between political and economic elites. The deals were largely open, as barriers of entry to many industries were removed. The growth acceleration during the 1990s was largely due to the ‘ordered deals’ environment that had taken shape in the 1980s and was improved through dismantling of the industrial-cum-trade licensing system in 1991 (Sen et al., 2014; Sen and Kar, 2014).
The economy recorded a mixed performance in the post-reform period. Compared with the previous period, agricultural and industrial growth rates decelerated to 2.84% and 5.81%, respectively, during 1991/1992–2000/2001. The services sector growth rate accelerated from 6.32% to 7.18%. The performance of the economy was more or less stable, as the growth rate of GDP (5.6%) and per capita NNP (3.63%) remained almost same as in the previous period.
The reform process continued during the period from 1998 to 2004 when the Bharatiya Janata Party (BJP), at the head of National Democratic Alliance-I (NDA-I) with Atal Behari Vajpayee as the Prime minister, ruled the country. He and his two finance ministers, Yeshwant Sinha and Jaswant Singh, were more liberal in outlook than the BJP affiliates like Rashtriya Swayamsevak Sangh (RSS) and Swadeshi Jagran Manch (SJM). Overcoming the objections and resistance from the RSS and SJM to foreign investment, they succeeded in opening up the economy, allowing many Indian companies to prove their ability to stand up to foreign competition. The liberalisation process was carried forward at some pace during the period under United Progressive Alliance (UPA-I) and UPA-II with Manmohan Singh as the Prime minister.
The GDP grew at the rate of 7.44% and per capita NNP at the rate of 5.55% during 2001/2002–2013/2014. Agriculture, industry and services grew at the rate of 3.23%, 6.91% and 8.52%, respectively. On the whole, growth acceleration in the GDP since the 1980s was led by services, followed by industry. The services-led growth has often been described as an ‘excess’ or ‘disproportional’ growth of services or ‘services revolution’. It is argued that the economic growth, driven primarily by services, may not be sustainable without attaining a significant degree of industrialisation.
Minimum government maximum governance since 2014
After coming to power for the second time in 2014, the BJP government (under NDA-II) with Narendra Modi as the Prime Minister embarked on economic reforms with the primary objective of growth and development. Modi was elected on the BJP’s (2014) election manifesto of ‘economic revival’, which involved job creation for all, fighting corruption, tax reform, infrastructure development, agricultural growth, dealing with inequality and poverty, ensuring food security, making ‘doing business’ easy in India, transforming the country into a manufacturing hub and so on (Narlikar, 2021). Naturally, the reforms undertaken under Modi were influenced by the ideology of the BJP and its highly protectionist affiliates like RSS and SJM. The BJP discards both socialism and Western capitalism, supports private enterprise but also operates India’s biggest trade union (viz., Bharatiya Mazdoor Sangh), and believes in a welfare state and its interventions to create national champions, increase employment and protect small business enterprises (Aiyar, 2018). Modi came to power, promising good jobs for all, particularly in manufacturing, greater business investment opportunities, higher rates of privatisation and less corruption. He promised that ‘acche din aane waale hain’ (good days are coming), and the Indian economy would prosper under a pro-business and pro-market political and economic regime with ‘minimum government and maximum governance’. He expanded the role of government in people’s welfare, while liberalising the economy progressively and making an unabashed case for the private sector. His government has passed farm and labour laws and promised to privatise major companies including two public sector undertaking (PSU) banks and a general insurer and stock market listing of the Life Insurance Corporation of India.
His major policy reforms include the following: (1) demonetisation of 500 and 1000 rupee notes abruptly on 8 November 2016 in a move to eliminate black money and corruption, (2) introduction of a Goods and Services Tax (GST) in July 2017, unifying and rationalising a number of central and state indirect taxes on various goods and services, (3) reduction in the corporate profit tax to 17% for new manufacturing firms and 25% for other firms, (4) enactment of the Insolvency and Bankruptcy Law 2016, which is considered to be the most effective instrument for reducing the magnitude of non-performing assets (NPA), (5) jan dhan yojana – a plan to provide bank accounts for every household, facilitating direct transfer of financial benefits from government-sponsored welfare schemes to the beneficiaries accounts, avoiding the corruption and delays in payments, (6) ending of government subsidies on gasoline and diesel fuel, (7) decontrol of prices of most petroleum products, (8) introduction of commercial mining in coal, (9) liberalisation of foreign direct investment (FDI) in defence, civil aviation, railways, coal, mining and e-commerce that the UPA government had found difficult to open, (10) labour reforms through which nearly 29 Central labour laws are being amalgamated, rationalised and simplified into four labour codes (viz., (i) the Code on Wages 2019, (ii) the Industrial Relations Code 2020, (iii) the Occupational Safety, Health and Working Conditions Code 2020 and (iv) the Code on Social Security, 2020) with a view to make labour markets far more flexible and employment friendly, (11) Swachh Bharat Mission (cleanliness and toilet-construction campaign) was launched in 2014 to eliminate open defecation and improve solid waste management, (12) Ujjwala Yojana (a scheme for cleaner and healthier kitchen) under which women in villages get free one LPG cylinder connection per household, (13) a robust digital infrastructure based on Unified Payments Interface (UPI) platform and digitalisation of numerous government services to improve the ease of living.
An important pillar of Modi’s economic strategy is his industrial policy, campaigned in terms of the slogan, ‘Make in India’, which is considered to be a benchmark strategy to align domestic investment and FDI policies in such a way as to attract more foreign businesses and set up production and manufacturing units in the country in order to make it a manufacturing powerhouse and an export hub, and to turn it into a $5 trillion economy. He also emphasised the need to promote and nurture small business enterprises. A new government agency, viz., Mudra Bank was created to refinance loans to micro, small and medium enterprises (MSMEs). Moreover, a new Ministry of MSMEs was created to support their cause more strongly than the Ministry of Industry, which focuses mainly on big business enterprises (Aiyar, 2018). The government has made ‘doing business’ easy by undertaking wide-ranging reforms in starting a business, dealing with construction permits, getting electricity, registering property, getting credit, paying taxes, trading across borders, enforcing contracts, resolving insolvency, protecting minority investors and so on. Rationalisation of the various laws and regulations and simplification of the procedures related to these areas of ‘doing businesses’ were considered necessary for converting the slogan of Atmanirbhar Bharat (self-reliant India) into reality. The reforms have remarkably improved India’s ranking in the World Bank’s ‘Ease of Doing Business’ – from 142 in 2015 to 63 in 2020. This seems to have contributed towards improving attractiveness for investors, boosting the private sector and enhancing India’s overall competitiveness in the world. The reform measures, espoused since 2014, were overtly pro-business and testify the Modi government’s excessive reliance on the market and a brazen alliance with the private corporate sector.
The ‘Make in India’ campaign was originally launched for making the country an export hub. However, going against the spirit of the campaign and moving in line with its protectionist affiliates, the BJP government raised import duties on 40-odd items in the Union Budget 2018–2019 on the ground of protecting domestic industries and creating more jobs. Earlier in December 2017, import duties on several electronic items were raised by up to 20% in pursuance of the Phased Manufacturing Programme (PMP) to check massive imports from China. The import duties on 76 textile items were raised in July 2018 and the same on 328 textile items were raised in the next month (Aiyar, 2018).
Originally, India was one of the 16 countries (including 10 members of the Association of Southeast Asian Nations (ASEAN) and six countries with which they have free trade agreements, viz., Australia, China, Korea, Japan, New Zealand and India), which participated in the negotiations for free trading across the countries under Regional Comprehensive Economic Partnership (RCEP). However, India decided to opt out of the negotiation on 4 November 2019, and the remaining 15 countries signed the RCEP agreement on 15 November 2020. Described as the largest free trade agreement in history, RCEP aims to create an integrated market with the participating countries, making it easier for products and services of these countries to be available across this region. RCEP is expected to eliminate a range of tariffs on imports within 20 years.
It is argued that India’s participation in RCEP would have allowed some Indian industries like pharmaceuticals, cotton yarn and the services to make substantial gains, getting access to a huge market. However, India pulled out of the negotiations, arguing that the present form of RCEP does not fully reflect its ‘basic spirit’ and the ‘agreed guiding principles’, and does not address satisfactorily the ‘fundamental issues’ and concerns that it had been consistently raising throughout the negotiations. India was prompted to take this stand in order to safeguard the interests of agriculture and dairy industries and the services sector. There were apprehensions that Indian industries would not be able to compete with China, and India’s farmers would not be able to compete on a global scale. RCEP would be led by China, and the agreement would stimulate intra-East Asian integration around China and Japan.
The reforms to liberalise the farm sector relate primarily to agricultural marketing, contract farming and restrictions on transportation, storage, prices and distribution under Essential Commodities Act 1955. Like his predecessors, Modi opposed opening up of agriculture in the WTO. Import duties on a wide range of agricultural commodities including wheat, chickpeas and other lentils, edible oils and sugar were raised to a great extent during 2017–2018 after agricultural prices fell remarkably in the world market in 2017. In order to help increase farmers’ income and accelerate agricultural growth, a National Agricultural Market (NAM) as an all-India electronic trading portal (eNAM) was launched in April 2016 for creating a common national market for agricultural commodities, unifying the existing 585 Agricultural Produce Marketing Committee (APMC) mandis (markets). Moreover, three farm laws (viz., (i) The Essential Commodities (Amendment) Act 2020, (ii) The Farmers (Empowerment and Protection) Agreement on Price Assurance and Farm Services Act 2020 and (iii) The Farmers Produce Trade and Commerce (Promotion and Facilitation) Act 2020) were enacted in September 2020 with the objective of transforming Indian agriculture through acceleration of growth by attracting private sector investment in building infrastructure and supply chains for farm produces in national and global markets. However, the laws could not be implemented due to strong opposition from thousands of farmers backed by several farmer groups and a stay order from the Supreme Court of India. The farm laws were finally repealed in November 2021.
India’s economic growth in the first 6 years under Modi could not be recovered to the level achieved during 2001/2002–2013/2014. The GDP growth slowed down from 7.44% during 2001/2002–2013/2014 to 6.84% during 2014/2015–2019/2020, and per capita NNP slowed down from 5.55% to 5.53% (Table 1). After growing at the rate of 7.41% in 2014–2015 and reaching a 6-year high rate of 8.26% in 2016–2017, the GDP growth decelerated sharply to 4.18% in 2019–2020, the lowest rate in the last three decades, with unemployment rate at a 45-year high. Similarly, the growth rate of per capita NNP, after reaching its peak at 6.88% in 2016–2017 decelerated considerably to 3.12% in 2019–2020. The economy has stopped growing completely and then started contracting after the national lockdown was announced in the last week of March 2020 due to the COVID-19 pandemic.
The agricultural sector grew at a marginally higher rate of 3.27% and the service sector grew at a much slower rate of 7.49% during 2014/2015–2019/2020 than in the previous period. After growing at the rate of 9.0% in 2015–2016, the services sector slowed down sharply to 5.0% in 2019–2020. In spite of the much-heralded ‘Make in India’ plan to make India a manufacturing powerhouse, the industrial sector grew at a moderate rate of 6.73%, down from 6.91% achieved in the previous period. After growing at the rate of 8.07% in 2014–2015, the industrial sector slowed down sharply, as the growth rate fell to 4.48% in 2018–2019 and a trifling rate of 0.8% in 2019–2020. The growth rates of industry and services in 2019–2020 were the lowest in the last three decades.
The growth slowdown may be attributed to several factors:
(1) The demonetisation policy adversely affected private demand and devastated cash-based businesses, particularly the small businesses, causing a contraction of the economy and huge economic loss without reducing the problems of black money or corruption.
(2) While the long-term impact of the GST on the economy is most likely to be positive, its short-term effect was negative. It was introduced hurriedly and initially implemented in such a manner as to produce adverse effects on businesses. In particular, small businesses, who were earlier hit by demonetisation and whose future is threatened by the growing e-commerce in the country, had to face difficulty in adapting to the new tax system with arduous reporting requirements.
(3) Evidence suggests that the strategic ‘Make in India’ campaign did very little to rejuvenate the manufacturing sector for boosting industrial growth and creating manufacturing jobs. Reasonably high import tariffs, signalling a protectionist trade policy, were against the spirit of the ‘campaign’. Poor infrastructure, low levels of skills among workers, outdated labour laws and trade friction between the US and China have encumbered efforts to develop this sector. Its poor performance has led to massive NPA.
(4) Struggling under the burden of NPA that more than doubled in the first 5 years of the Modi government – from around 4% in 2014 to more than 9% in 2019, the banks preferred lending to non-banking financial companies (NBFCs) rather than businesses and households. In the process, the NBFCs had become important sources of credit. The financial market received a severe blow in September 2018 when Infrastructure Leasing & Financial Services Ltd. (a non-bank lender) defaulted on several of its repayment and redemption obligations and rating agency ICRA downgraded the ratings of its borrowing programmes, triggering panic among investors. As the contagion of default-scare spread over the financial market, several NBFCs faced turmoil, causing a huge shortage of credit.
(5) The growth of private final consumption expenditure in real terms, contributing around 57% to real GDP growth, slowed down over the years – from 7.0% in 2017–2018 to 5.3% in 2019–2020. More alarmingly, the growth of gross fixed capital formation in real terms, which accounted for around 30% of real GDP growth, experienced a negative growth (–2.8%) in 2019–2020, down from 7.2% in 2017–2018. Exports, which grew at the rate of 4.6% in 2017–2018, contracted at the rate of –3.6% in 2019–2020. Credit off-take by micro and small industries remained almost stagnant.
In the growth process, India has followed a path of structural transformation that differs from the path traversed by all countries in the high-income group. The development experience of the countries revealed an inverse relationship between income and the share of agriculture in output and employment (Syrquin and Chenery, 1989). The manufacturing sector was the driver of growth and major provider of employment up to a certain stage of development, after which the services sector became the major source of growth and employment. However, growth acceleration in India was driven primarily by the services sector, and structural transformation of the economy has witnessed a huge decline in the share of agriculture in GDP, accompanied by a modest increase in the share of industry and a much sharper increase in the share of services. Moreover, the structural change in employment shares has not been as large as in GDP, and there has been a mismatch between the contributions of various sectors to GDP and their contributions to employment (Table 2).
Sectoral distribution of GDP and employment (workforce) in India (%).
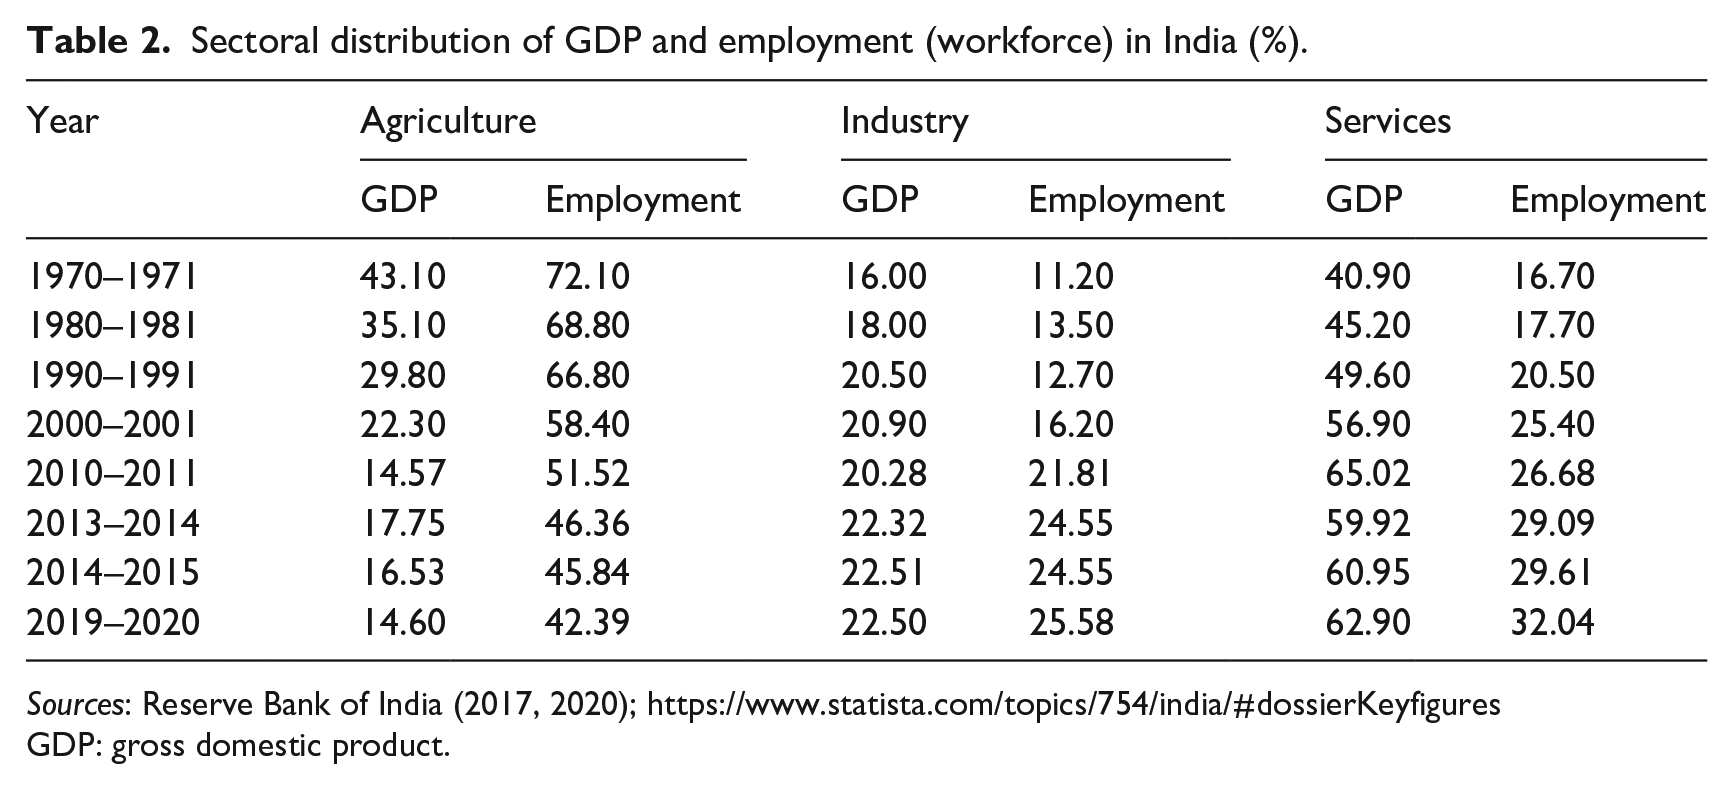
Sources: Reserve Bank of India (2017, 2020); https://www.statista.com/topics/754/india/#dossierKeyfigures
GDP: gross domestic product.
Inclusiveness of growth
Keeping in view the Plan objectives of achieving high economic growth with equality, redressing regional imbalances, and reducing unemployment and poverty, the Twelfth Five-Year Plan (2012–2017) chose ‘faster, sustainable and more inclusive growth’ as its central theme. For growth to be ‘inclusive’, all the people must have the opportunity to participate productively in the growth process and the benefits of growth should trickle down to all sections of the population. Again, for growth to be ‘inclusive’ regionally, it is necessary that the benefits of growth be shared equally by all regions of the country. At the backdrop of impressive progress of the economy since 1980, and in view of the frequent rhetoric of the political leaders in the government for inclusive development, it is imperative to see how the benefits of growth have been shared by different sections of the population and different regions of the country. We have checked the inclusiveness of growth, reviewing briefly the trends in regional distribution of income across states, inequalities of income, wealth and consumption among individuals and incidence of poverty and unemployment in the country.
Regional disparities in income
Improved growth performance of the economy during the post-reform period has been associated with widening regional disparities in income. The performance of 15 major states, evaluated in terms of the level and growth rate of per capita net state domestic product (NSDP) at 1993–1994 prices (henceforth, per capita income) varied widely across the states (Table 3). The states have diverged in per capita income over time, as the cross-sectional standard deviations (SD) of the logarithms of per capita NSDP display a statistically significant increasing trend during 1970/1971–2019/2020; the estimated trend line bears a positive coefficient of the trend variable (t) with a high value of R2 (Figure 1). The regional disparity appears to have become sharper after the reforms since 1991, as some states grew faster and others languished, growing slower than the economy. The surge in the growth rate during the post-reform period (1991/1992–2019/2020) was due to significant growth acceleration in the states like Andhra Pradesh, Gujarat, Haryana, Karnataka, Kerala, Maharashtra, Tamil Nadu and West Bengal. Although all the states grew at a faster rate during the post-reform period, growth rates in these eight states were higher than the national average. It may be noted that some of the poor states (viz., Assam, Bihar, Odisha, Rajasthan and Uttar Pradesh) were able to improve their growth in per capita incomes during 2001/2002–2019/2020 relative to 1991/1992–2000/2001 (Table 3).
Growth performance in India and major states.
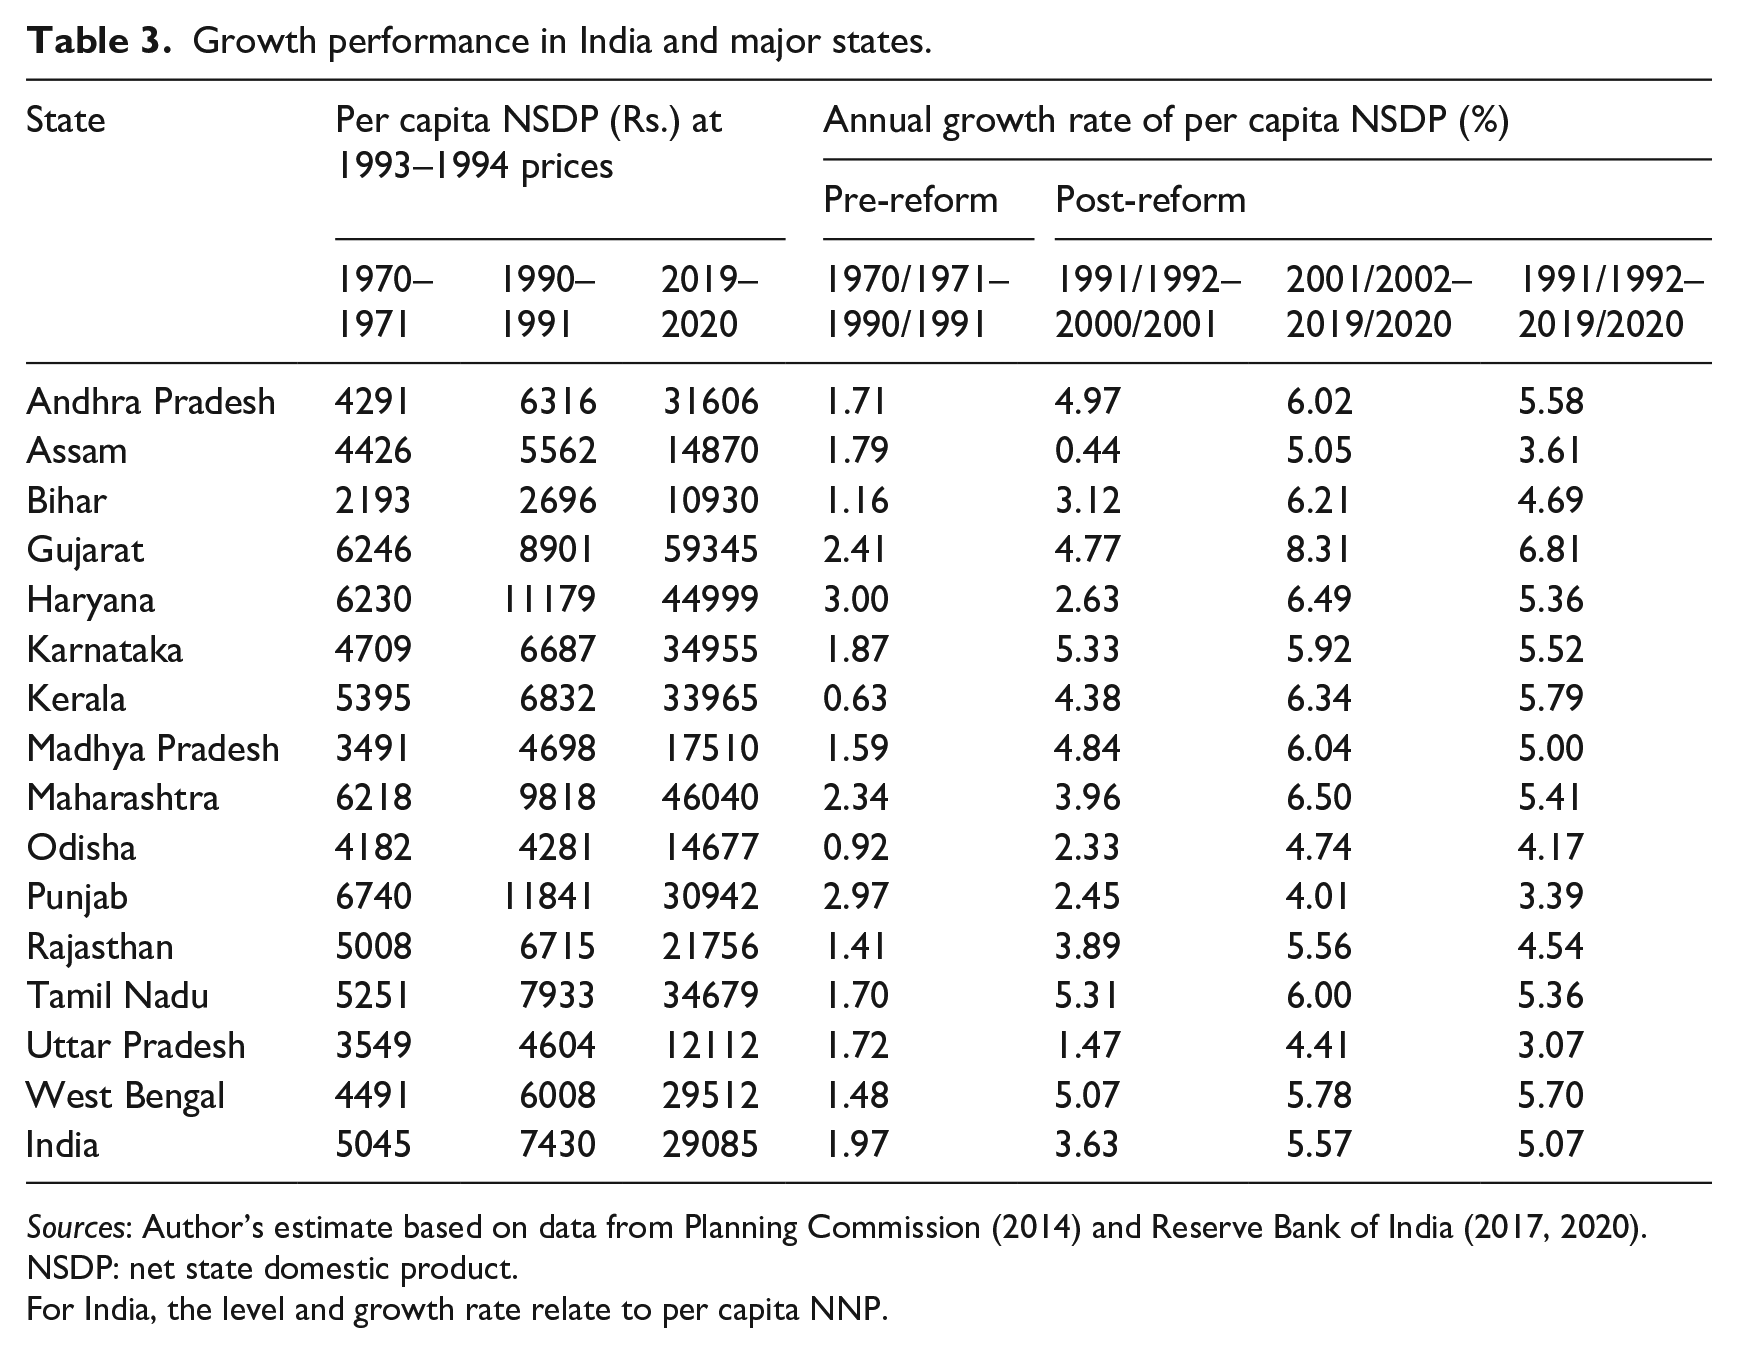
Sources: Author’s estimate based on data from Planning Commission (2014) and Reserve Bank of India (2017, 2020).
NSDP: net state domestic product.
For India, the level and growth rate relate to per capita NNP.

Trend in regional inequality of per capita income (1970/1971–2019/2020).
The dynamics in economic performance of the states has been explained in terms of regional variations in the extent of state-level policy reforms making doing business easy, inflow of FDI and regional disparities in physical, social and financial infrastructures (see, e.g. Ghosh, 2012). After the economic reforms, private investment has become more important, and the main consequence of state-level policy reforms has been increasing competition among states, particularly in making doing business easy for attracting domestic and foreign investments (Bajpai and Sachs, 1999; Kochhar et al., 2006; Purfield, 2006). Relatively more reform-oriented states have attracted higher levels of FDI. The states that were able to attract larger FDI through liberalisation of investment policies have performed better in terms of economic growth. While the liberalisation policies in the states have paved the way for domestic and FDIs, infrastructure facilities have played a complementary role in attracting these investments. State-level reforms in various areas of ‘doing business easy’ have had a positive impact on growth performance, as the states (Andhra Pradesh, Gujarat, Haryana, Maharashtra, Karnataka, Tamil Nadu and West Bengal) with better growth performance during the post-reform period are either reform-oriented or intermediate reformers. Among the slow reformers, Assam, Bihar, Madhya Pradesh and Uttar Pradesh have lagged behind the faster growing states. As lagging reformers, Punjab grew at a rate slower than the national average and Kerala has not been among the top states in terms of per capita income. This is often attributed to the state government’s attitude towards private investment and liberalisation policies (Bajpai and Sachs, 1999; Sachs et al., 2002).
Inequalities in income, wealth and consumption among individuals
India’s economic growth has not been inclusive to all sections of the population, as the inequalities of income, wealth and consumption among individuals have increased over time particularly after the reforms. Table 4 reports the share of pre-tax national income of four income groups for some discrete years, and Figure 2 demonstrates the long-run evolution of income inequality for the period 1951–2019. Income inequality is found to have declined during 1951–1982, with the rising shares of income of the middle 40% and the bottom 50% earners in contrast to the declining shares of the top 1% and 10% earners. However, the trend was reversed after 1982, with the rising shares of income of the top 1% and 10% earners, who were able to raise their income shares substantially, capturing the growth in national income proportionately more than the middle 40% and the bottom 50% earners, whose income shares have been declining since 1982. The inequality has become sharper since the early 1990s. Thus, income inequality has shown a consistently rising trend from 1982 with the acceleration of GDP growth following the implementation pro-business reforms in the 1980s, and the trend has become sharper since the early 1990s following the implementation of large-scale economic reforms that helped the top income groups increase their shares of income at a faster rate. The rising trend in inequality since the early 1980s can be seen in contrast to the experience during the first 30 years of Indian planning since 1951 when income inequality was reduced. In 2014, income inequality reached its highest level, and remained unchanged thereafter, as the shares of national income of the top 1% and 10% earners hit the highest level at 21.73% and 57.13%, respectively, and the shares of the middle 40% and the bottom 50% fell to the lowest level at 29.74% and 13.13%.
Inequality of income and wealth in India.

Source: World Inequality Database (wid.world/country/india).
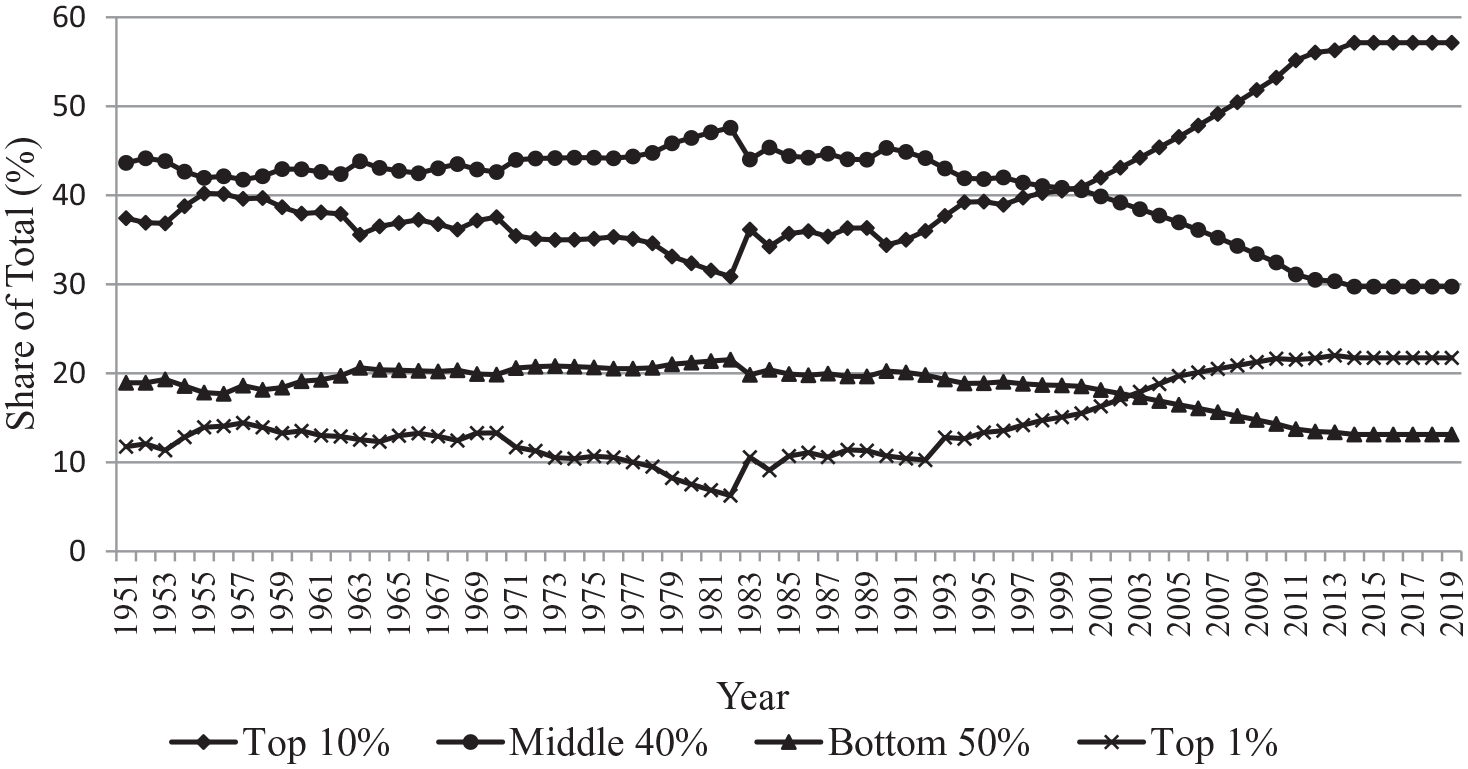
Trend in inequality of pre-tax national income (1951–2019).
Wealth inequality has been more glaring. While the share of wealth of the top 10% earners was larger than their income share, the same of the bottom 50% was lower than their income share in all the years between 1961 and 2012, the latest year for which wealth distribution data are available. The share of wealth of the top 1% was larger than their income share in all the years except 1961 and 1971. Again, while the shares of wealth of the top 1% and 10% declined marginally during 1961–1971, they increased considerably from 1981. On the other hand, the share of wealth of the bottom 50% declined consistently over the years from 1961 to 2012, and that of the middle 40% declined consistently from 1981 (Table 4). The estimates based on All-India Debt and Investment Survey data also revealed a high and increasing wealth inequality during 1991–2012. The Gini-coefficient of concentration of wealth increased from 0.61 in 1991 to 0.67 in 2012 in rural areas, and from 0.73 to 0.77 in urban areas. At the all-India level, it increased from 0.65 to 0.74 (Anand and Thampi, 2016). The increasing trend in the degree of inequality of wealth seems to be closely linked to the growth strategy being followed since the early 1980s which helped the already wealthy to capture the benefits of economic growth proportionately more than the less wealthy. The inequality started increasing from 1981 that has become sharper since 1991, after which the country has recorded considerable growth acceleration in GDP.
The rising inequalities in income and wealth have been reflected in the distribution of consumption in India, particularly in urban areas. The estimates of Gini-coefficient of distribution of monthly per capita consumption expenditure (MPCE) in rural and urban areas reveal that while the degree of inequality in MPCE fluctuated between 0.26 and 0.336 over the years between 1973–1974 and 2011–2012 in rural areas, the same in urban areas increased from 0.302 in 1973–1974 to 0.367 in 2011–2012 (Table 5). The inequality was higher in urban areas than in rural areas in all the years.
Gini-coefficient of MPCE in India (based on mixed reference period).
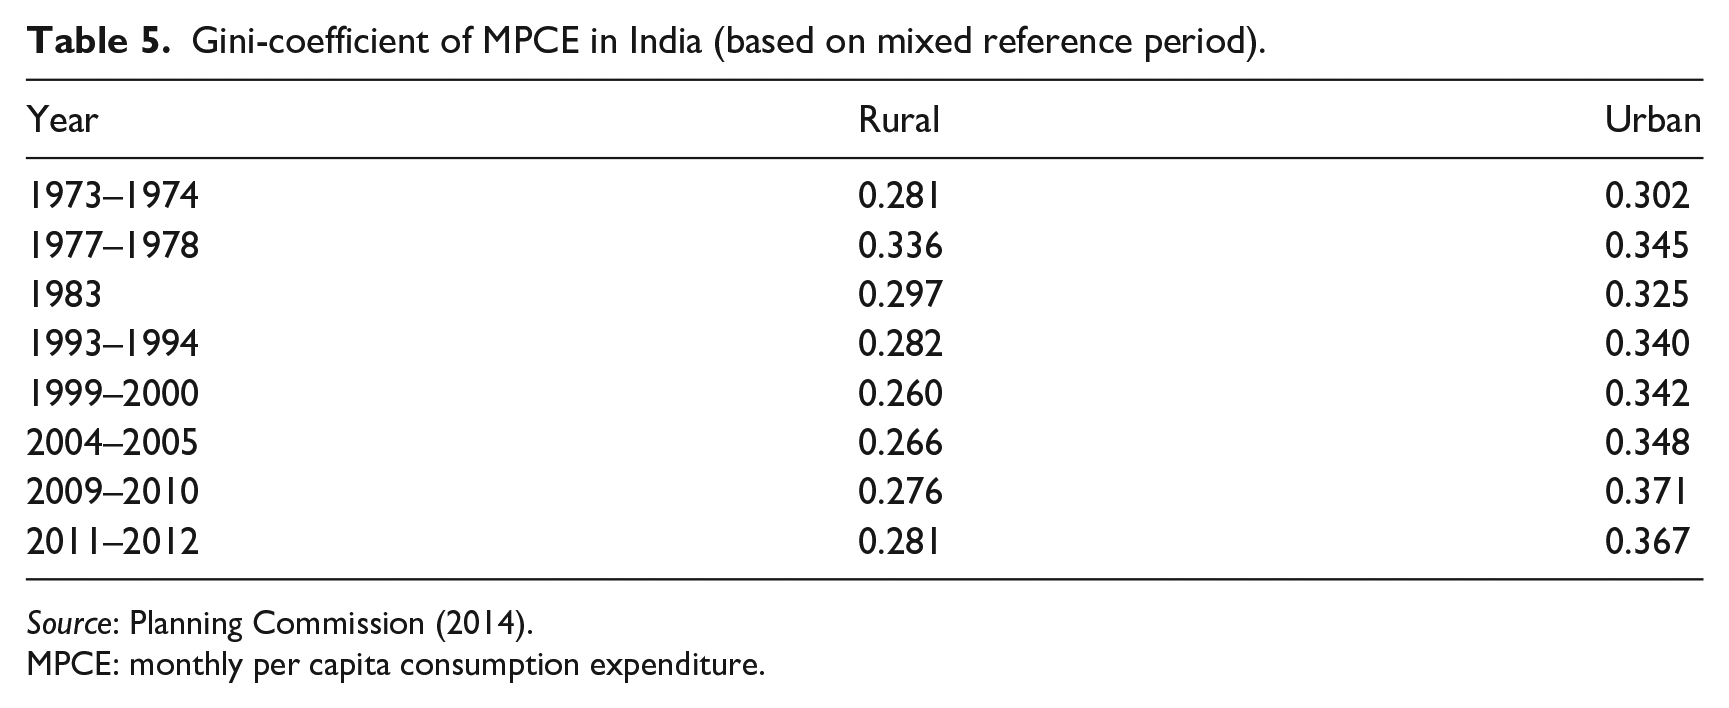
Source: Planning Commission (2014).
MPCE: monthly per capita consumption expenditure.
Jobless growth and unemployment
Employment is necessary for creating opportunity for the labour force to participate productively in the growth process and share the benefits of growth. However, evidence shows that the improved growth performance of the economy has not been associated with any significant increase in employment. Table 6 reports the unemployment rates among male and female labour force according to the usual status (ps+ss) and current weekly status (CWS) in India. The unemployment rates in urban areas were higher than those in rural areas in both usual status and CWS in all the years except 2017–2018 in which the unemployment rate for males according to CWS was equal in both rural and urban areas. In urban areas, the unemployment rate for females was higher than that for males in both usual status and CWS in all the years except 1983 in which the unemployment rate for females was lower than males in usual status. In rural areas, the unemployment rate for females was lower than that for males in majority of the years according to usual status, while it was higher in majority of the years according to CWS. The unemployment rates among males and females were historically very high in 2017–2018 and 2018–2019.
Unemployment rate (%) according to usual status (ps+ss) and CWS in India.
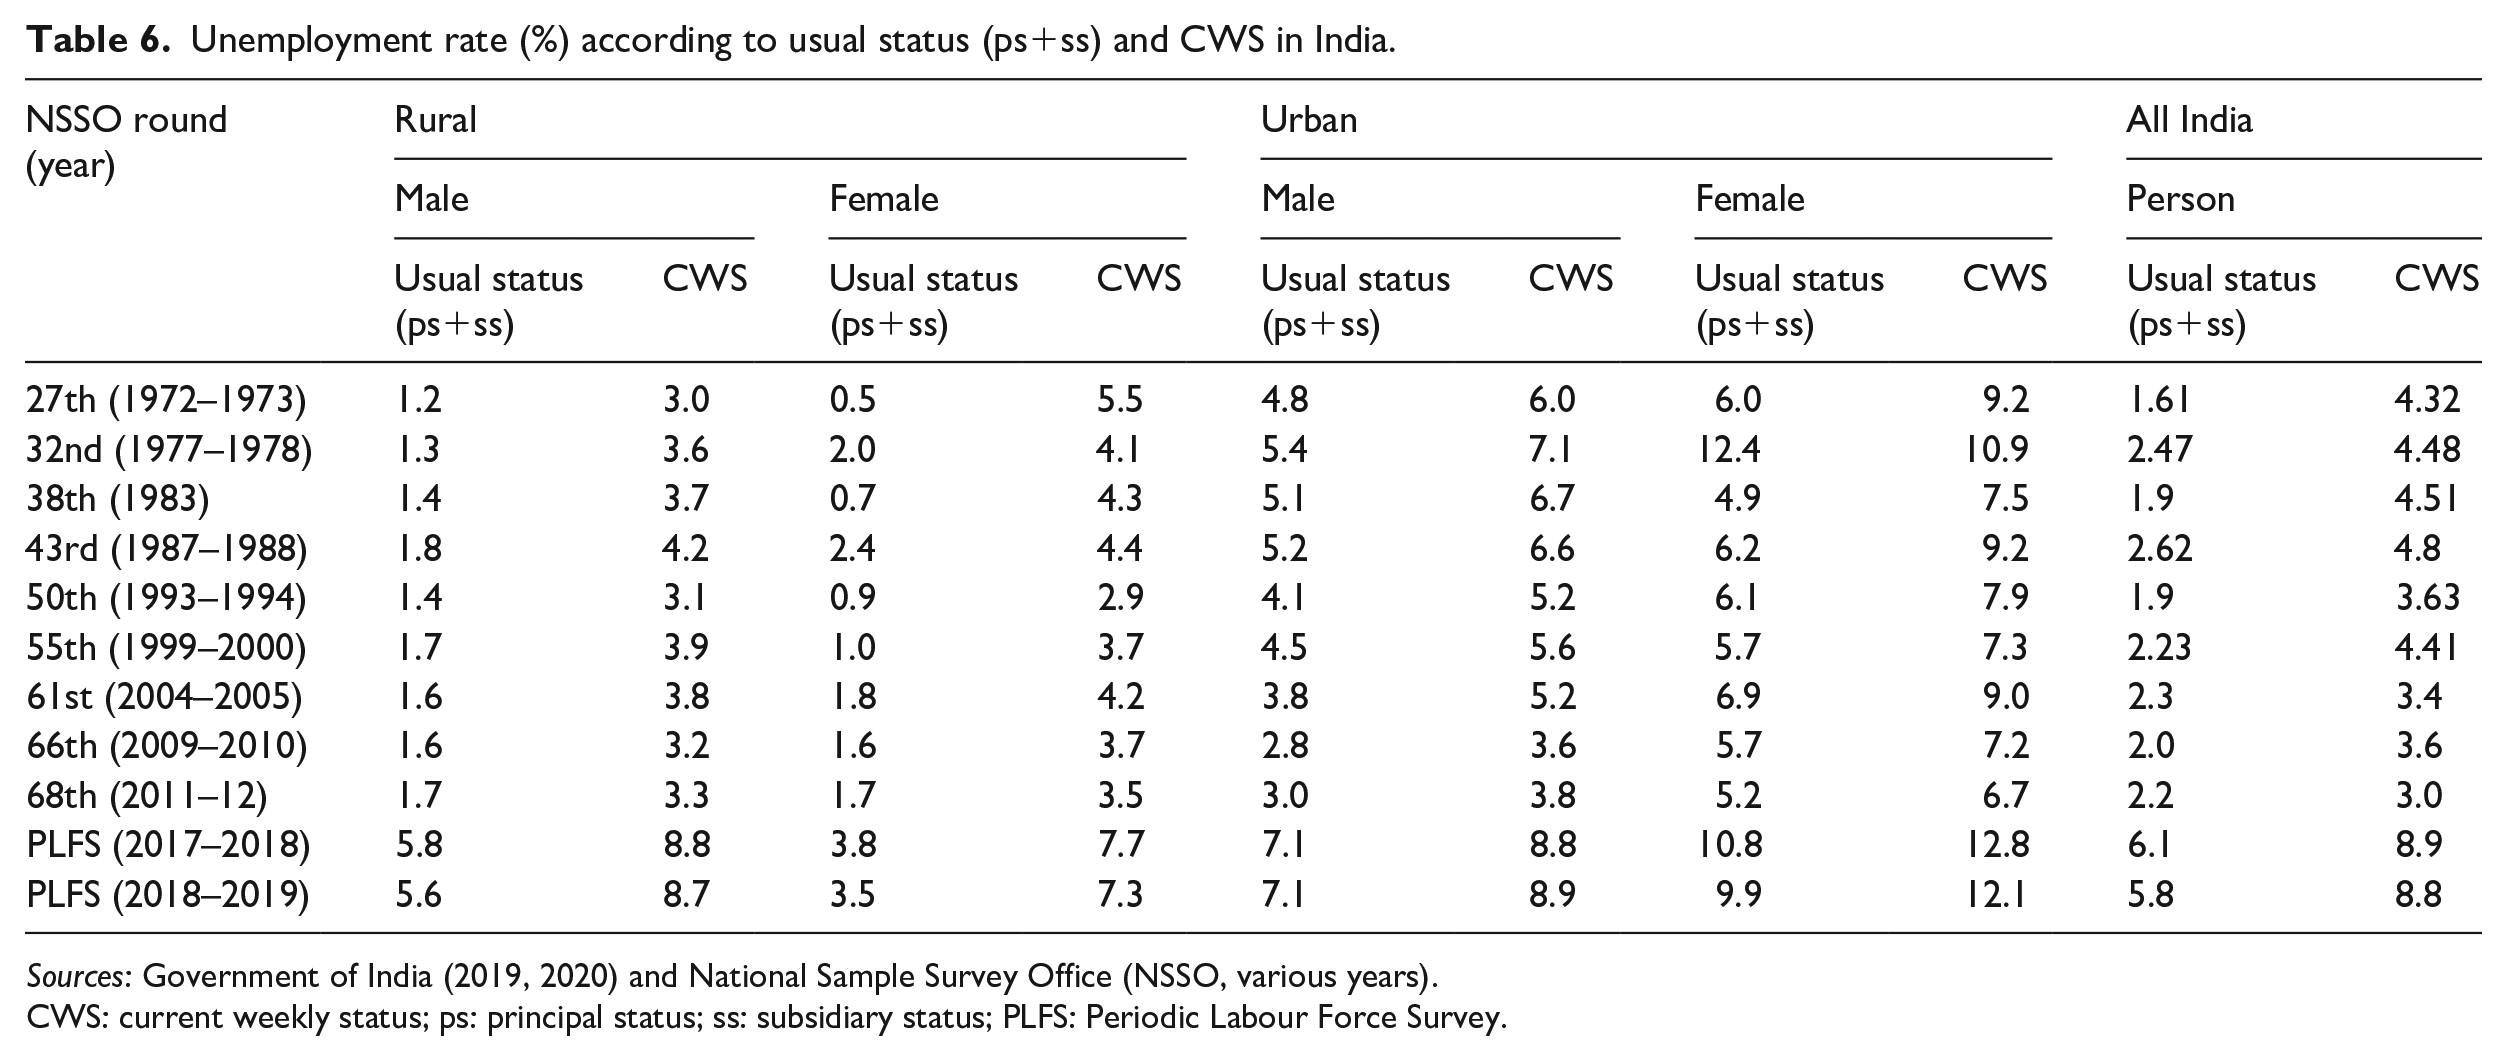
CWS: current weekly status; ps: principal status; ss: subsidiary status; PLFS: Periodic Labour Force Survey.
At the all-India level, the unemployment rate varied from 1.61% to 2.62% in the usual status and from 3.0% to 4.8% in the CWS during the period between 1972–1973 and 2011–2012. However, the unemployment rate jumped to 6.1% in the usual status and 8.9% in the CWS in 2017–2018. Thus, while the unemployment rates were more or less stable at a relatively low level until 2011–2012, they rose sharply to a 45-year high level in 2017–2018 and remained almost unchanged in 2018–2019. Even though the original intention of the ambitious ‘Make in India’ programme was to rejuvenate the manufacturing sector as an important source of job creation, the project appears to have contributed very little to rejuvenate the sector for boosting industrial growth and creating jobs. Moreover, the Modi government has failed to promote the kind of labour-intensive industrialisation that has taken place in many East Asian countries which could have played a crucial role in generating employment opportunities for the Indian labour force.
The employment elasticity, measuring the percentage change in employment for one percentage change in GDP growth rate, represents the ability of an economy to generate employment opportunities in the growth process and serves as an indicator of inclusive growth. Table 7 reports the annual growth rates of employment and GDP and the estimated employment elasticity for various periods. While the growth rate of employment was lying between 1.7% and 2.6% during pre-reform period till 1993–1994, it declined significantly in all the sub-periods except 1999/2000–2004/2005 during the post-reform period since 1993–1994, even when the GDP growth rate increased consistently. Thus, growth acceleration in the GDP was associated with growth slowdown in employment during the post-reform period, causing declining employment elasticity, particularly after 1993–1994. The employment elasticity was estimated at 0.18 during 1993/1994–2011/2012 which is substantially lower than those in the pre-reform periods between 1972–1973 and 1993–1994. This suggests that the GDP growth had been a ‘jobless growth’ in the post-reform period up to 2011–2012. Subsequently, the employment situation became so worse that the growth rate of employment became negative (–0.22%) during 2011/2012–2017/2018, and the economy moved from a ‘jobless’ to ‘job-loss’ growth regime with a negative employment elasticity (–0.03), representing a situation where there was an absolute decline in employment in the presence of a positive growth rate of GDP, happening for the first time in the post-Independence period. The growth strategy being followed has failed to generate sufficient employment to reduce unemployment in the economy.
Employment elasticity.
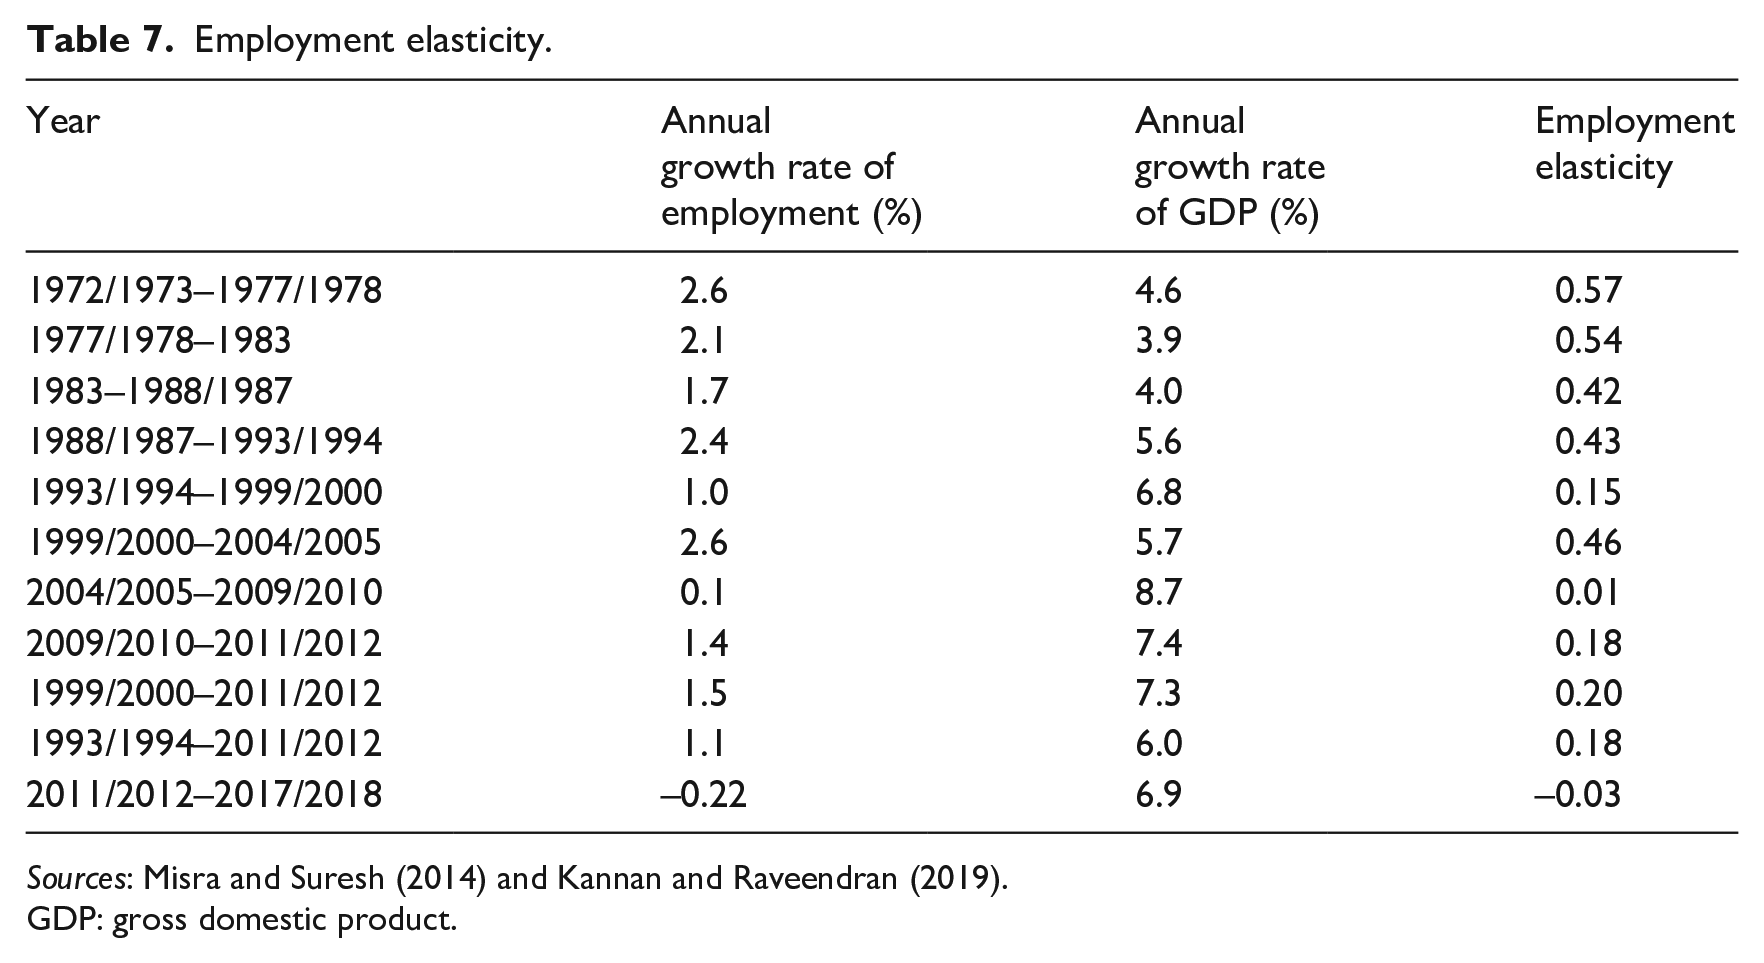
Sources: Misra and Suresh (2014) and Kannan and Raveendran (2019).
GDP: gross domestic product.
Incidence of poverty
The benefits of growth have not trickled down to the poor, and the impoverishing of Indians has happened at the same time when the unemployment rate and the inequalities of income, wealth and consumption have increased. The incidence of poverty, although declined from 54.9% in 1972–1973 to 44.5% in 1983, increased again to 45.3% immediately after the economic reforms in 1993–1994 (Table 8). However, the trend had been moderated thereafter, as the head-count ratio declined to 37.2% in 2004–2005, 29.8% in 2009–2010 and 21.9% in 2011–2012, the latest year for which poverty data are available. The number of poor showed an increasing trend until 2009–2010, after which it declined to some extent in 2011–2012.
Poverty in India (based on mixed reference period).
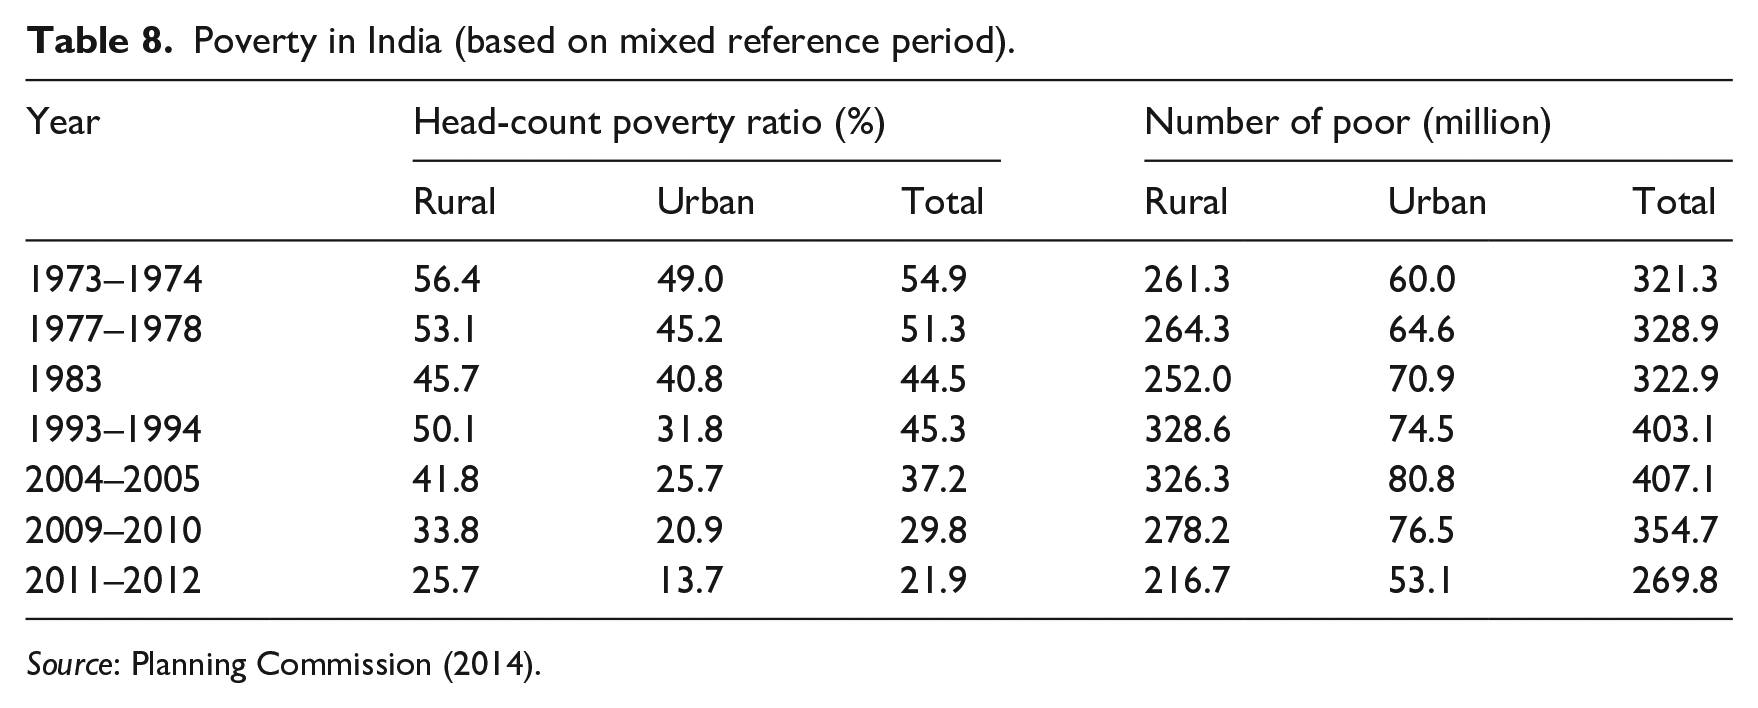
Source: Planning Commission (2014).
Summary and conclusion
This paper has reviewed the economic policies adopted by the Indian government during different policy regimes, offered a political economy perspective of economic growth and examined the inclusiveness of rapid economic growth in recent decades. The growth performance of the economy improved, as the economy moved from inward-looking import-substitution regime to the regimes of pro-business and pro-market policies. India’s political economy was supportive of the changes in policy regime. After growing at a sluggish rate of 3.62% during the first three decades after 1950–1951, the GDP growth accelerated to 5.56% after the pro-business reforms in the 1980s and there was further acceleration after the pro-market reforms since 1991–1992. The GDP growth slowed down in recent years and fell sharply to 4.18% in 2019–2020, the lowest rate in the last three decades, with unemployment rate at a 45-year high. The economy stopped growing and then started contracting after the national lockdown was declared in the last week of March 2020 due to COVID-19. The growth process being followed has led to a significant structural transformation of the economy, involving major shifts in the sectoral composition of output and employment. The disproportional growth of services and the associated structural transformation should be taken into serious consideration by the policy makers while setting growth strategy for the country.
However, growth has not been inclusive and the quest for inclusive growth remains elusive, as the benefits of economic growth have not reached all sections of the population and all regions of the country equally. On the contrary, disparities across regions and inequalities in income, wealth and consumption among individuals have exacerbated, and the problems of unemployment and poverty have been persisting. Improved growth performance of the economy in the post-reform period has been associated with widening regional disparities in per capita income which are attributed primarily to inter-state variations in various infrastructures and FDI inflows, and differential attitude of the states towards private investment and economic reforms for doing business easy. Inequalities of income and wealth among individuals have shown a consistently rising trend from the early 1980s with the acceleration of GDP growth following the implementation pro-business reforms, and the trend has become sharper since the early 1990s following the implementation of large-scale economic reforms that helped the top income/wealth groups increase their shares of GDP growth at a faster rate. The growth strategy being followed has failed to generate sufficient employment to reduce unemployment in the economy. The GDP growth had been a ‘jobless growth’ in the post-reform period up to 2011–2012, and subsequently, the economy has moved from a ‘jobless’ to ‘job-loss’ growth regime. The benefits of growth have not trickled down to the poor proportionately, and the impoverishing of Indians has occurred at the same time when the unemployment rate and the inequalities of income, wealth and consumption have increased considerably. The results indicate the need for rethinking about the growth strategy, if we are concerned about inclusive development in India. For development to be inclusive, the growth strategy has to address the problems of rising inequality and persisting unemployment and poverty in the country.
Footnotes
Acknowledgements
The author is thankful to the reviewers for useful comments and suggestions on an earlier version of the paper.
Funding
The author(s) received no financial support for the research, authorship and/or publication of this article.