
Abstract
This study transcends general opinion reports and uses data from the General Social Survey (GSS) to examine responses on attitudinal questions about how Black and White Americans actually feel about their close relative marrying outside their own race. The results show that more than half (54%) of Black Americans are in favor of their close relative marrying a White person compared with nearly one-in-four (26%) White Americans who said they were in favor of their close relative marrying a Black person. Such results suggest that questions about how individuals feel when close relatives engage into Black-White marriage provide better measures of attitude toward racial exogamy. Logistic regression models are analyzed to determine how socio-demographic factors influence Black and White Americans’ views on interracial marriage of their close relatives.
Introduction
A 2013 report by the Gallup Poll shows a significant shift in Americans’ attitude toward Black-White marriage (Newport, 2013). According to that report, in 1958, only 4% of Americans approved of Black-White marriage; in 2013, 87% of Americans said that they approved of Black-White marriage. When those results are presented by respondents’ race, Blacks appear more favorable to Black-White marriage than Whites; although, the gap is narrowing. In 2013, 96% of Blacks and 84% of Whites approved of Black-White marriages; a huge increase in approval from the 1969 figures, where 56% of Blacks and only 17% of Whites approved of Black-White marriages (Newport, 2013).
Evidently, the rise in favorable opinion of Black-White marriage has been followed by some increase in the number of Black-White marriages in the United States. For example, estimates from the Census Bureau show that the number of Black-White marriages increased from 51,000 in 1960 to 558,000 in 2010 (U.S. Census Bureau, 1998, 2012), which represents a growth rate of 994% in the last five decades. However, in relative terms, Black-White marriages are still fairly rare, accounting for less than 1% of all marriages in the United States.
The current gap between percent of Americans who hold a favorable attitude toward Black-White marriage and the percent of actual Black-White marriages suggests that the general interracial marriage opinion questions used in many surveys are too broad for understanding how people actually feel about marrying outside one’s race. More specifically, early surveys usually asked people whether they approve or disapprove of marriage between Blacks and Whites (Newport, 2013). While such questions provide long trend comparisons, they do not tell us much about the racial intolerance that people harbor when asked how they would feel if one of their relatives were to marry a person outside their own race.
This study goes beyond general opinion questions and uses recent General Social Survey (GSS) data sets that included questions on how Black and White Americans actually feel about their close relative marrying outside their own race. By assessing how one feels about a relative’s marriage to a person of a different race, we provide a better understanding of why current favorable opinions on interracial marriage still do not result into higher rates of marriages between Black and White Americans. We also examine the impact of socio-demographic characteristics on Black and White respondents’ attitude toward their close relatives’ racial exogamy.
Theoretical Perspectives and Research Hypothesis
Most research on interracial marriage has focused on the following three sociological perspectives: status-caste exchange, traditional assimilation, and cultural pluralism. Introduced in the 1940s mostly by Robert Merton (1941) and Kingsley Davis (1941), the status-caste exchange model suggests that members of the dominant racial/ethnic group will marry individuals from the minority group for upward economic mobility (Hou & Myles, 2013). In this model, the marriage between higher status Blacks to lower status Whites is a form of status exchange. The status exchange perspective has been one of the key interracial marriage frameworks in subsequent decades (Fu, 2001; Qian, 1997; Schoen & Wooldredge, 1989), but the number of critiques has also grown, challenging the usefulness of the theory in contemporary societies (Heer, 1974; Liang & Ito, 1999; Rosenfeld, 2005).
The second perspective on interracial marriage is the traditional assimilation explanation led by Milton Gordon (1964). Gordon’s model, sometimes referred to as the “keystone of the arch of assimilation,” suggests that minority groups will be culturally “absorbed” in the dominant racial/ethnic group’s culture through seven steps. These steps start with acculturation (cultural and behavioral assimilation), go through marital assimilation, and ends with a stage of value and power conflict (Gordon, 1964). In this model, marital assimilation is viewed as a positive transformation of society (Alba & Nee, 1997, 2003; Massey, 1981; Rosenfeld, 2002). Besharow and Sullivan (1996), for example, see the growth of intermarriage as an indication of improvement in race relations and a decline in racism and intergroup antagonism (Besharow & Sullivan, 1996, cited in Qian & Lichter, 2001). Others have argued that prior interracial contacts in schools and neighborhoods result in more liberal attitudes toward interracial relations (Emerson, Kimbro, & Yancy, 2002). However, we do not have information on respondents’ interracial experiences at younger age. Therefore, the contact theory is not applicable in this case.
From a demographic view, the relatively small size of the Black population would help speed up their marital assimilation in the United States. Yet, as Peter Blau points out, intermarriage is not only constrained by group size or sex ratio but also by social distance between the majority and the minority groups (Blau, 1977; Rytina, Blau, Blum, & Schwartz, 1988).
The third perspective is the cultural pluralism (Lewis & Ford-Robertson, 2010). In recognition of the growing racial and ethnic diversity due in large part to the recent waves of non-Western European immigrants in the United States, social scientists have called for pluralistic explanation of inter-ethnic/racial marriage. Some have argued that this new racial diversity will lead to segmented assimilation as people scrabble in defining their cultural identities in the new land (Alba & Nee, 2003). But what happens when people are asked about interracial marriage between specific races, especially between Blacks and Whites?
When measuring the population’s attitude toward interracial marriage, sex imbalance and availability of marriageable persons inside and outside one’s racial group can play a significant role. If the traditional assimilation hypothesis is correct, we would expect the Black population to be absorbed into the White majority group through marriage. Another important variable to consider is the sex ratio. Everything else being equal, the disadvantaged sex would have more chance of union formation because their pool of mates is larger (Schoen, 1983). Given the skewed sex imbalance among Blacks (more Black women than Black men), one would expect Black women to marry more outside their race than White women. However, all existing data show that exogamous unions between these two racial groups occur more often between Black men and White women than between White men and Black women (U.S. Census Bureau, 2012).
Nonetheless, from a demographic perspective, we hypothesize that Black women will be the most likely to accept interracial marriage, whereas White men will be the most likely to oppose it; Black men and White women’s attitudes will be somewhere between. As for specific socio-demographic characteristics, we expect younger people and those with higher education to hold more favorable attitude toward interracial marriage than their counterparts who are older and less educated. These factors have been associated with likelihood of racial exogamy in previous studies (Glick, 1988; Tucker & Mitchell-Kernan, 1990; Wilson & Jacobson, 1995), and we expect them to have the same effects on the current population’s attitude toward interracial marriage.
In addition, we posit that being single would lead to more acceptance of racial exogamy, because those who are not married would be more liberal as they are themselves in the marriage market. We also expect religious affiliation, political orientation, and economic conditions (income) to affect individuals’ attitude toward interracial marriage. Because of its conservative nature, religion is expected to reinforce the in-group belief and, therefore, a tendency to oppose racial exogamy. Similarly, we hypothesize that those holding conservative political views would be more likely to oppose interracial marriage than their counterparts who are more liberal. In contrast, we expect a positive relationship between income and attitude toward interracial marriage. The argument is that rich people tend to be more liberal on social issues than less fortunate people.
We also test the association between general happiness and attitude toward interracial marriage, expecting that those who are very happy in their lives will hold a favorable view of their close relative marrying outside their race. Finally, because of historical context of slavery and other forms of racial discrimination in the South, we expect residents of that region to have a more negative attitude toward interracial marriage than people living elsewhere in the country.
Data and Method
As mentioned earlier, the purpose of this study is to assess how Black and White Americans feel about marrying outside of their race. Because we want to get closer to measuring their own attitude instead of the usual general opinion questions, we turned to the GSS data set that included new questions on how respondents feel about their close relative marrying outside their race. The first time such questions were asked for Whites and Blacks was in 2000. So we chose the 2000 GSS data set as the baseline for this study. To assess trends over 10 years, we also selected the 2010 GSS data set. The 2012 GSS was added to see if the economic recession of the last few years has affected the way Americans think about interracial marriage.
GSS data sets are national probability samples of adult Americans and have been used in many studies of attitudes and opinions (Baars, 2009; Haider-Markel & Joslyn, 2005). As the focus of this article is on marriage between Blacks and Whites, we excluded other racial categories. We are certainly aware that the smaller sample size for African Americans may affect the results of this investigation. So, we interpret our findings with caution.
Our dependent variable comes from the answers to the questions below (from the GSS questionnaire). The opening or introductory statement to the questions read:
“Now I’m going to ask you about another type of contact with various groups of people,” followed by the following five questions on a Likert-type scale:
What about having a close relative marry a White person? Would you be very in favor of it happening, somewhat in favor, neither in favor nor opposed to it happening, somewhat opposed, or very opposed to it happening?
What about having a close relative marry a Black person?
A Jewish person?
A Hispanic of Latin American person?
An Asian American person?
Although these questions were asked to all respondents, we examined only answers from Blacks’ and Whites’ responses because our focus is on how members of each of these two racial groups feel about their relatives marrying someone from the other racial group. More specifically, we considered only Black respondents’ answers to the first question as a measure of Black people’s acceptance/opposition to their close relatives marrying a White person. In the same way, we used White people’s responses to the second questions to measure their views on Black-White marriage.
For all these questions, the response categories were: “very/strongly in favor,” “somewhat in favor,” “neither in favor nor oppose,” “somewhat oppose,” “very/strongly oppose,” with an additional category for “don’t know.” Table 1 shows the distributions of respondents’ answers by race for each of the three periods.
Distributions of Answer Categories of the Dependent Variable Before Recoding (%).
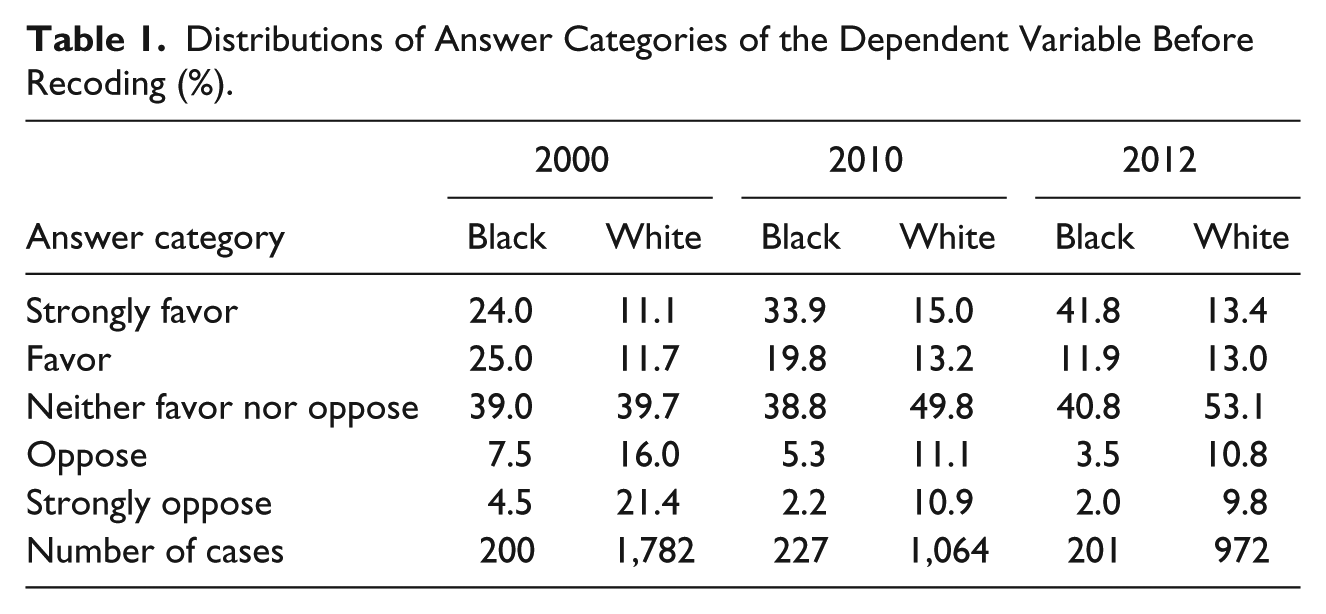
Because we are interested in comparing those who were in favor of interracial marriage with those who opposed such unions, we dichotomized the dependent variable as follows:
“Favor”: This category includes those whose answers were in the following original categories—“very/strongly in favor” and “somewhat in favor.”
“Oppose”: This category contains all those who said that they were “neither in favor nor oppose,” “somewhat oppose,” and “very/strongly oppose.”
We included “neither in favor nor oppose” in the oppose category because we think people who chose that answer instead of one of the two “favor” categories may actually be against their close relative marrying outside their race, but did not want to be seen as racist. To avoid any confusion in the interpretation of the results, we excluded the “don’t know” category from this study. That category represented only a small proportion of the sample.
The explanatory variables selected for this study are sex, age, marital status, level of education, religious affiliation, opinion of relative level of family income, political orientation, region of residence, and general happiness. We conducted our analysis in two parts. First, we explored bivariate associations between the dependent and independent variables. Second, we determined the net effects of each of the independent variables on the dependent variable in multivariate models.
Because our dependent variable was dichotomized, we used logistic regression models to predict the likelihood that a respondent would be in favor (vs. not in favor) of his or her relative marrying a White person (for Black respondents) or a Black person (for White respondents). We ran two separate models: one for Black respondents and another for White respondents.
Results
Socio-Demographic Characteristics of the Respondents
The socio-demographic characteristics of the respondents are presented in Table 2 by race. For both races, the sample contains slightly more female than male respondents, with more sex imbalance observed among Black respondents. For the latter, the percent of female respondents ranges from 64.8 in 2000 to 61.8 in 2012. For White respondents, the percent of females is about the same during the three periods considered here (approximately 55%).
Percent of Socio-Demographic Characteristics of Respondents: GSS 2000, 2010, and 2012.

Note. Total percent may not add up to 100 due to rounding. GSS = General Social Survey.
Data in Table 2 show that the distributions by age, opinion of family income, and general happiness are similar for both racial groups. In 2000, most respondents were 30 to 44 years old, whereas the majority of those who participated in GSS in 2010 and 2012 were in the 45 to 64 age groups. Such an age shift may suggest that older people have been more cooperative to GSS survey in recent years than the younger generations. Concerning relative level of income, both racial groups tend to consider themselves as belonging in the middle of the wealth spectrum. As for happiness, more than half of respondents in each of the racial groups said they were pretty happy. However, White respondents were more likely to say that they were “very happy” as compared with Black respondents.
Marital status data in Table 2 are similar to the Census Bureau statistics which show that Whites are more likely to be married than Blacks (U.S. Census Bureau, 2010). As for education, the majority of respondents had high school level. Nonetheless, the proportions of people with college level education were higher among Whites than among Blacks in each of the three periods examined in this study.
Although respondents in both racial groups were mostly Protestant and lived in the South, Blacks were more heavily concentrated in those categories than Whites. For example, in 2012, 68.3% of Black respondents were Protestant compared with 45.5% of Whites. Moreover, Black respondents were significantly less likely to be Catholic (less than 9%) as compared with Whites (about one fourth). More than half of the Black respondents lived in the South compared with one third of White respondents. The majority of Black respondents were Liberal (71.6% in 2012). In 2012, White respondents were more widely distributed in their political orientation with 29.7% Liberal, 28.9% Conservative, and 41.3% Independent and Moderate. These samples are generally similar to the actual Black and White populations of the United States. Therefore, it is appropriate to make inference to the general population.
Respondents’ Attitudes Toward Their Relatives Marrying White and Black Persons
Table 3 contains the percentage distribution of Black and White respondents according to their attitudes toward interracial marriage. The strength of association between the dependent variable and each of the independent variables is measured through the levels of significance of the chi-square values. Those levels are included in the table. The data in Table 3 show that half of Black respondents said that they were in favor of their close relatives marrying White persons. In contrast, only one fourth of Whites were in favor of their close relatives marrying Black persons. This pattern is consistent across the three periods. Are these differences also associated with individuals’ socio-demographic characteristics?
Percent of Black/White Respondents Who Favor a Close Relative Marrying a White/Black Person by Socio-Demographic Characteristics of Respondents; GSS 2000, 2010, and 2012.
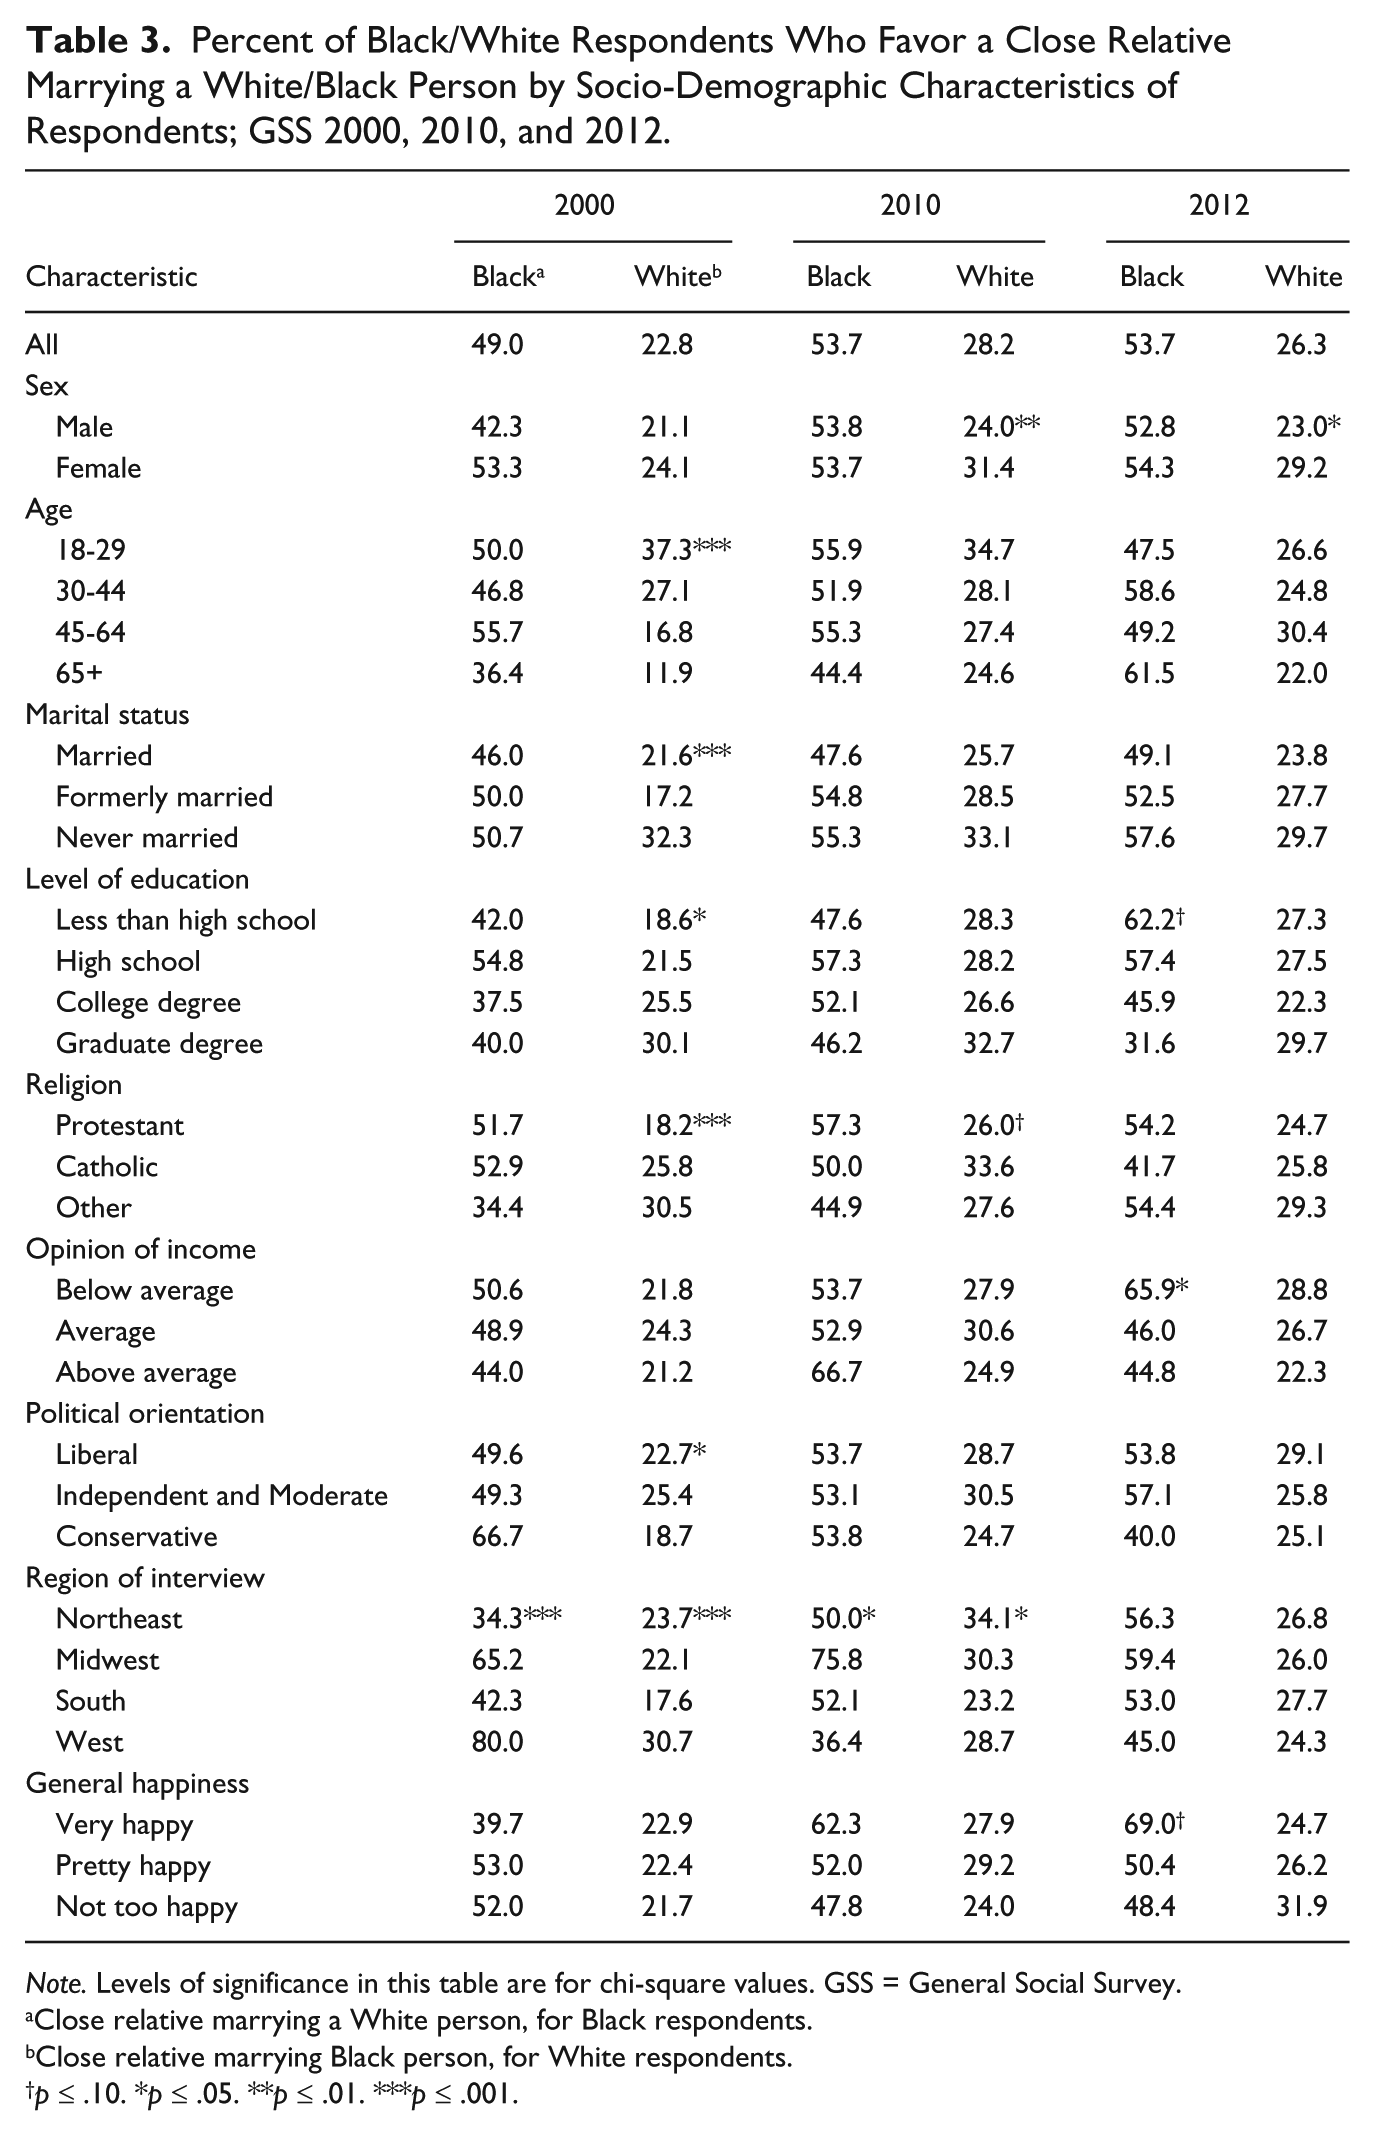
Note. Levels of significance in this table are for chi-square values. GSS = General Social Survey.
Close relative marrying a White person, for Black respondents.
Close relative marrying Black person, for White respondents.
p ≤ .10. *p ≤ .05. **p ≤ .01. ***p ≤ .001.
In both racial groups, women were more in favor of their close relative marrying outside their race than men. However, these sex differences were statistically significant only for White respondents in 2010 and 2012. Younger people also held more favorable attitudes toward Black-White marriage, but the effect was only significant for White respondents in 2000. The data in Table 3 also show that never married respondents were more likely to be in favor of their relatives marrying outside of their race than were their ever married counterparts. Still, that association was only significant for White respondents in 2000. The impact of education was weak and not all linear. The only significant associations were observed among Whites in 2000 when higher schooling was positively linked to a favorable view on interracial marriage; and among Black respondents in 2012 when education had a negative influence on respondents’ attitude on Black-White marriage.
The results on religious affiliation were statistically significant only for White respondents. For the latter, being a member of a Protestant church was associated with unfavorable attitude toward Black-White marriage, but the results were statistically significant only in 2000 and 2010. Although not consistent for all three periods, the association between income and racial exogamy over time suggests that those who consider their family wealth to be below average are more likely to be in favor of their close relative marrying outside their own race. Nonetheless, that association was only statistically significant for Black respondents in 2012. In contrast, the association between political orientation and favorable attitude toward Black-White marriage was in the expected direction during the three periods only for White respondents; and the association was statistically significant only in 2000.
In terms of region of residence, White respondents who lived in the South were less accepting of their close relative marrying a Black person in 2000 and 2010; years for which the association was statistically significant. Among Blacks, the pattern was more mixed; in 2000, Blacks who lived in the Northeast were the least to accept their close relative marrying a White person; in 2010, it was those living in the West who were the least likely to approve of such marital unions. No significant regional effect was observed in 2012 for either Blacks or Whites. The associations between general happiness and attitude toward Black-White marriage were weak and only significant for Black respondents in 2012. Apparently, happiness is linked to acceptance for interracial marriage only among Blacks.
Determining Factors of Favorable Attitude Toward Black-White Marriage
To determine the socio-demographic factors that significantly influence respondents’ views on interracial marriage, we ran logistic regression equations in which we predicted the likelihood of being in favor of one’s close relative marrying a Black person (for White respondents) or a White person (for Black respondents). The results are presented in Table 4. There are six equations in that table: three for Blacks and three for Whites, for each of the 3 years (2000, 2010, and 2012) considered in this study.
Odds Ratio Estimates From Logistic Regression Models Predicting the Likelihood That a Black/White Respondent Would Be in Favor of a Close Relative Marrying a White/Black Person; GSS 2000, 2010, and 2012.

Note. GSS = General Social Survey.
Close relative marrying a White person, for Black respondents.
Close relative marrying Black person, for White respondents.
p ≤ .10. *p ≤ .05. **p ≤ .01. ***p ≤ .001.
The results on sex are consistent across the three periods, and are statistically significant only for White respondents. Compared with White women, White men are less likely to be in favor of their close relatives marrying Black persons. Age was statistically significant only in three of the six equations in Table 4. The first two models are for Whites in 2000 and 2010 in which older persons were significantly less likely to favor Black-White marriage for their close relatives. The third age-significant model was for Black respondents in 2012. In that equation, only those 30 to 44 years old were significantly in favor of Black-White marriage, as compared with those below age 30. There was no significant difference in terms of marital status. The effect of education was only significant for White respondents in 2000. For the latter, higher educational attainment was associated with greater acceptance of Black-White marriage, especially among people with graduate degrees.
The influence of religion is mixed. For White respondents, Catholics seem more favorable to Black-White marriage than Protestants but that association was only significant in 2000. In addition, in 2000 and 2012, Whites who were not Protestant or Catholic were significantly more likely to be in favor of their close relatives marrying Black persons. In contrast, Black respondents who were not Protestant or Catholic were significantly the least likely to hold a favorable view of Black-White marriage in 2000 and 2010. Income and happiness were significant correlates of favorable attitude on Black-White marriage only for Black respondents in 2012. For them, having family income that is below average was significantly associated with positive view on Black-White marriage. In the same way, happier Blacks were significantly more likely to be in support of their close relative marrying a White person than were their less happy Black counterparts.
There was no significant association between political association and attitude toward Black-White marriage, except for White respondents in 2000. That year, White conservatives were significantly less likely to be in favor of their close relative marrying a Black person. The impact of region of residence was statistically significant for both Black and White respondents in 2000 and 2010, but not in 2012. In 2000, Black respondents who lived in the Midwest and the West were significantly more likely to be in favor of Black-White marriage than those in the Northeast. However, in 2010 only Blacks residing in the Midwest were significantly more likely to be in favor of interracial marriage than those in the Northeast. For Whites, only those who lived in the West were significantly more likely to be in favor of their close relative marrying a Black person, as compared with those in the Northeast in 2000. In 2010, Whites residing in the South were the only people that were significantly less likely to be in favor of Black-White marriage.
Discussion
The purpose of this study was to determine how Black and White Americans feel about their close relative marrying outside of their race. Unlike previous studies which used general questions on approval of interracial marriage (Baars, 2009; Haider-Markel & Joslyn, 2005), we used three of the recent GSS data sets that have new questions on how respondents feel about their close relative marrying outside their race. The 3 years chosen were the first time that question was asked (2000); the most recent year for which the data were available (2012); and the year 2010 used to see if the recent economic crisis would have changed the population’s attitude toward interracial marriage.
The results show that Black and White Americans’ attitudes on their close relatives marrying outside their race have not changed much during the 12 years that that question was included in the GSS questionnaire. Nonetheless, there are significant racial differences. In 2000, about half of Black respondents (49%) said they approve of their close relative marrying a White person. In contrast, a little less than one fourth of White respondents (22.8%) said they approve of their close relative marrying a Black person. Twelve years later, that racial difference remains at 53.7% for Black respondents and 26.3% for Whites. No significant change was observed between 2010 and 2012, suggesting that the last economic recession did not alter how Black and White Americans feel about interracial marriage for their relatives.
For this discussion, we focus on the results from 2012, year for which our key independent variable (general happiness) was statistically significant. As we hypothesized, we found that Black women were more in support of their relatives marrying White persons, whereas White men were the least likely to approve of their family members marrying Black persons. However, the gender difference was only statistically significant for Whites. Such results suggest that White women were more accepting of interracial marriage than White men.
The other significant correlate of attitude toward interracial marriage among Whites in 2012 was religion. Whites who were not members of Catholic or Protestant churches were more likely to approve of their close relatives marrying Black persons. This result shows that Whites in these two denominational groups were less tolerant of Black-White marriages when it involves their close relatives than those Whites who were in other religious groups or not denominationally affiliated.
For Black respondents in 2012, age, income, and happiness were also significant correlates of attitude toward Black-White marriage. The effect of age was not linear; only those 30 to 44 were significantly more in favor of their close relative marrying a White person as compared with those 18 to 29. In terms of income, Black respondents who said their family income were below average were significantly more likely to approve of Black-White marriage than those who felt their family income was average. Happiness was also an important factor for Black respondents. For them, happiness was positively associated with likelihood of approval of close relatives marrying White persons. Our hypotheses about age, education, marital status, political orientation, and region of residence were not supported by the 2012 GSS data.
Overall, this study shows that racial attitudes on interracial marriage have not changed much for Blacks and Whites, especially when one is asked more directly about how they feel when their close relative wants to marry outside their own race. It also shows that questions on how people feel if close relatives marry outside their race provide better measures of racial relations. For example, the comparison between levels of interracial marriage approval reported in previous studies based on general questions on how one feels about marriages between Black and Whites (84% for Whites and 96% for Blacks in 2013) (Newport, 2013), compared with our study (53.7% for Blacks and 26.3% for Whites in 2012) shows that many Americans are not ready for Black-White marriage in their own families. This may explain the lower rates of Black-White marriage we continue to observe in this country; of all marriages in the United states, less than 1% (0.7%) are Black-White couples (Field, Kimuna, & Straus, 2013; U.S. Census Bureau, 2012). There are also other structural and historical factors that may explain the differential attitudes toward interracial marriage found in this study. For example, previous studies have shown that intergroup contact is associated with interracial relations (Edmonds & Killen, 2009). Such information was not included in this study.
Despite the national representation of our data, there are two potential limitations. First, as Peter Blau suggests, attitudes toward racial relations go beyond demographic measures; people need to interact in order to know each other and have a better opinion about other races (Blau, 1977; Rytina, Blau, Blum, & Schwartz, 1988). More information is needed to measure respondents’ social distance and acquaintance with persons of other races. Second, our samples of Black respondents were relatively small. This may affect the validity of some results. Nonetheless, the lower effects of socio-demographic variables analyzed here even in the White samples, which are of large size suggests that there are probably other race-specific determinants of attitude toward Black-White marriage that should be investigated in future research. As such, this study contributes to the scholarship on racial relations by using a proxy measure of one’s opinion of Black-White marriage that is less biased than direct measures.
Footnotes
Declaration of Conflicting Interests
The authors declared no potential conflicts of interest with respect to the research, authorship, and/or publication of this article.
Funding
The authors received no financial support for the research, authorship, and/or publication of this article.