



Abstract
Recent findings have held that offender behavioral assessments unfairly predict the probation outcomes of racial/ethnic minorities. To that end, this study examines the extent and degree to which a commonly used offender risk needs assessment instrument equitably predicts probationer success and distributes predictive error. Findings suggest that the risk needs instrument predicts most equitably for “higher risked” probationers and that error is more likely for under-classified Blacks and over-classified Whites. The discussion presents issues for consideration by policy makers, practitioners, and future researchers motivated by the minimization of predictive bias.
Rarely does an issue receive more scrutiny or provide a greater shock to the conscious than racial bias. Intended to minimize subjectivity, bias in risk assessment has been an issue of concern for some time, particularly given that there are over 7 million offenders under the control of the American criminal justice system, the majority of which fall subject to some type of behavioral assessment. Predictive bias occurs when the regression slopes for predictor items vary by group affiliation (i.e., race/ethnicity, gender, age, etc.). Although there has been considerable research in this area, the results remain ambiguous at best (Raynor & Lewis, 2011; Rembert, Henderson, & Pirtle, 2014). Although most researchers conclude that risk assessment instruments equitably predict offender outcomes (Edens, Campbell, & Weir, 2007; Guy, Edens, Anthony, & Douglas, 2005; Olver, Stockdale, & Wormith, 2009; Schwalbe, 2007; Skeem, Edens, Camp, & Colwell, 2004), there are a few who have demonstrated that there remain racially/ethnically predictive inequities (Singh & Fazel, 2010; Whiteacre, 2006). Consequently, it has been suggested that predictive validation studies be extended beyond traditional analysis of regression lines to an understanding of the produced error. Only by determining predictive error are we able to unequivocally provide an accurate assessment of an instrument’s ability to suggest the appropriate level of supervision and rehabilitative services for each offender. Therefore, we examine the predictive equity of a commonly used risk needs assessment instrument on Black, Hispanic, and White probationers.
Previous Research of Risk Assessment’s Racial Predictive Equity
In general, the extant literature on the predictive accuracy of risk instruments has focused on mean scale score’s ability to predict offender re-arrest, reconviction, and/or supervision success. Among risk assessment, instruments examined for their ability to predict accurately across various racial/ethnic groups findings indicate that higher proportions of Whites in the sample equates to an increased predictive accuracy (Edens et al., 2007; Gendreau, Goggin, & Little, 1996; Leistico, Salekin, DeCoster, & Rogers, 2008). Others have found no significant racially predictive inequities (Edens et al., 2007; Guy et al., 2005; Olver et al., 2009; Schwalbe, 2007; Skeem et al., 2004). In other words, there remains ambiguity regarding predictive racial disparities.
Despite the focus of previous risk assessment research on racial group validations, most prior analyses have hinged on group classification proportionality and regression analysis, leaving bias, as measured by error, unexamined (Rembert et al., 2013; Singh & Fazel, 2010; Whiteacre, 2006). As a result, very little is understood about the degree of bias expressed in offender risk assessment. Understanding the impact of bias in risk assessment is ever more pertinent when considering the deleterious effect bias has been shown to have on legitimacy, authority, offender behavior, and compliance (Jackson, Huq, Bradford, & Tyler, 2013; Zinger, 2004). Accurate classifications also serve as the crux of rehabilitative efforts and appropriate supervision levels.
The Wisconsin Risk Needs Assessment Instrument
Common practice in the validation of the Wisconsin Risk Needs Assessment instrument is the use of cross-tabulations and basic correlational analysis, which are sensitive to the variance within the base rates and established classification cutoff points. It has become the norm in predictive validity research to utilize the Area Under the Curve (AUC) output from the Receiver Operating Characteristic (ROC) curve analysis, which, by plotting the instrument’s sensitivity, relative to its specificity, indicates the likelihood that an offender who successfully completes probation will have a higher risk and/or needs score than a probationer who does otherwise. AUC outputs of .50 are interpreted as being no better than a chance prediction, while the closer the AUC is to 1.0, the better the instrument’s predictive accuracy. The Wisconsin’s AUC has ranged from .614 to .664 (Henderson & Miller, 2013). No previous examinations of the Wisconsin’s AUC have been conducted relative to the probationer’s racial/ethnic classification, which would allow for the comparison of racial predictive error across multiple studies. Despite being a widely used instrument, none of these previous examinations have focused on assessing the exhibited psychometric racial bias, as determined by examinations of error—thus the motivation for this study.
The Current Study
Building on the recent suggestions (Raynor & Lewis, 2011; Singh & Fazel, 2010; Whiteacre, 2006) for further examinations of racial bias among risk instruments, this article seeks to examine predictive error utilizing a random sample of 117,071 Black, Hispanic, and White adult probationers. In particular, we determine the produced error of the Wisconsin Risk Needs Assessment instrument, relative to its prediction of successful outcomes for Black, Hispanic, and White probationers. In effect, this study’s contribution to the extant literature on offender risk assessment will manifest in several ways. First, it clarifies the ability of the Wisconsin Risk Needs Assessment Instrument to accurately predict probation success across various racial groups by focusing on the instrument’s produced error (i.e., false positives and false negatives). This initial contribution addresses a very limited body of knowledge examining a widely adopted risk instrument utilized to (a) predict probation success, (b) determine continued criminal activity, and (c) objectively assess the offender’s need for services (Henderson, 2013). Second, our analysis overcomes a critical oversight of the previous predictive validity literature in that we utilize a random sample of probationers from the largest probation population in the United States. Third, this study determined the extent and degree to which predictive racial/ethnic inequities exist, relative to the offender’s offense level. As a result, this study’s primary purpose is to examine the presence of predictive inequities within a widely adopted risk needs assessment instrument.
Method
Participants
Drawn from the Texas Criminal Justice Division database, the state’s central repository of probation risk assessment data, this sample consisted of 117,071 randomly selected Texas probationers who were released from probation between September 1, 2000, and August 31, 2010. Each probation department must submit their risk assessment data and probation closure type (i.e., successful or unsuccessful) to the state on a monthly basis. As noted in Table 1, the majority of the sample was Caucasian (41.3%), while the remaining participants were Black (40.3%) and Hispanic (18.5%). Approximately 21% of the sample did not complete high school, and 83% possessed a high school diploma or general educational development (GED). The average length of supervision time was 21 months (SD + 25.41), and a majority of the sample served a felony term. The average age of the sample was 28 (SD = 11.34) upon release from community supervision. Sixty-four percent of the offenders had never served a prior term on probation. It should also be noted that 89% of the sample were never convicted of a prior felony offense.
Sample Characteristics.
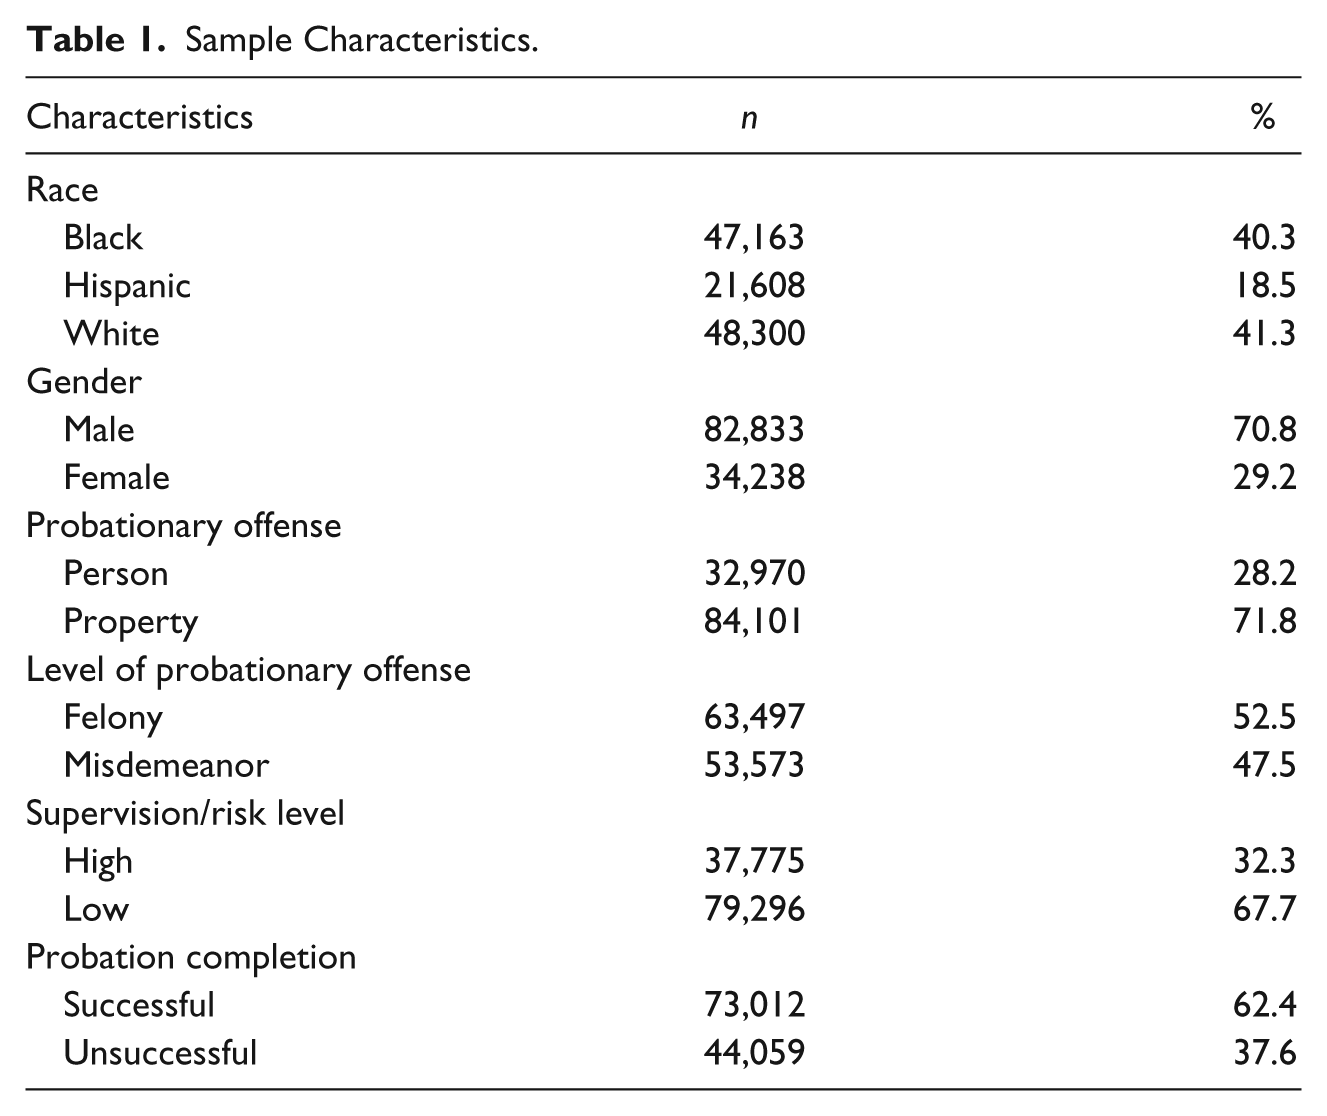
Demographic comparisons were examined to determine the existence of significant differences between the racial groups on gender, supervision level, probationary offense level, and offense type, of which there were no significant differences.
Measures
Wisconsin Risk Needs Assessment
In order to assess the potential bias of the independent measures under question, we included the Wisconsin total risk score and total needs score. The total risk and needs scores are summed totals of the static and dynamic items on the instrument and range from 0 to 43 for the risk score and from −8 to 58 for the total needs score.
The risk items are static and dynamic consisting of 11 items: number of address changes in the last year, percentage of time employed in last year, alcohol usage problems, drug problems, attitude of offender (e.g., negative thoughts), age at first conviction, number of prior periods of probation/parole supervision and revocations of such, prior felony convictions, prior or current assaultive adjudications of guilt, and convictions of either burglary, theft, robbery, worthless checks, or forgery. As an administrative override, due to the belief that assaultive offenders have a greater likelihood of violent recidivism, the assaultive adjudications are given more weight than the other risk items (Henderson & Miller, 2013).
The needs scale of the Wisconsin is much more subjective and based on the supervision officer’s perception of the offender’s needs. For example, the accessing officer determines the level of alcoholic service intervention warranted by asking the offender about their alcohol dependence and by reviewing the offender’s social history. A total of 12 items are included in the needs assessment: academic/vocational skills, employment, financial management, marital/family relationships, companions, emotional stability, alcohol usage problems, other drug usage problems, mental ability, health, sexual behavior, and the officer’s impression of offender needs. The needs section of the Wisconsin is the most underexamined, with very limited validations of its ability to predict behavioral outcomes.
The assessor, in all cases, a trained/certified supervision officer, reviews the offender’s criminal history, pre-sentence investigation reports, arrest reports, records of prior educational achievement, and any verifiable employment. Subsequent interviews are also conducted with family, friends, and employers of the probationer. As a result, being used to predict risk of reoffending and to identify needs for rehabilitative services, the Wisconsin’s items are weighted according to their severity, relationship to probation/parole violations, and criminal behavior.
The Wisconsin measure classifies minimum risk as scores ranging from 0 to 7, medium-risk scores range from 8 to 14, and maximum risk are those at 15 or above. The logic of the instrument’s weighting is that the lower values assigned to the needs items are representative of a lesser need. The assigned need level is premised on the assessor’s subjective determination of the offender’s need, unlike the objective basis underlying the risk portion of the instrument.
Previous peer-reviewed validations of the Wisconsin have regressed the instrument’s items on successful probation completion for parolees (Yacus, 1998) and probationers (Connelly, 2003; Eisenburg, Bryl, & Fabelo, 2009; Harris, 1994; Henderson, 2006; Henderson, Daniel, Adams, & Rembert, 2007; Henderson & Miller, 2013; Schauer, 1990; Yacus, 1998). In comparing Wisconsin’s extant literature, the validity estimates range from .27 to .68 for offender rearrests while serving probation (Gendreau, Little, & Goggin, 1996; Harris, 1994) and from .16 to .53 for supervision success (Connelly, 2003; Harris, 1994; Schauer, 1990). The Wisconsin’s relative improvement over chance (RIOC) predictions rate has never been found to be greater than 8% better chance, while most research noted that the instrument’s predictions were less than chance. In its prediction of probation revocations, the Wisconsin’s RIOC ranges from 24% to 55% (Connelly, 2003; Harris, 1994), which is only a 5% improvement over chance predictions. Despite these findings, the Wisconsin, similar to most risk/needs prediction instruments, has yet to be examined for the degree and extent to which it accurately predicts probation success for probationers relative to the race/ethnicity.
Common practice of the widely adopted Wisconsin’s agency evaluations is the use of cross-tabulations and basic correlational analysis, which is sensitive to the variance within the base rates and established classification cutoff points. It has become the norm in predictive validity research to utilize the AUC output from the ROC curve analysis which, by plotting the instrument’s sensitivity, relative to its specificity, indicates the likelihood that an offender who successfully completes probation will have a higher risk and/or needs score than a probationer who does otherwise (). AUC outputs of .50 are interpreted as being no better than a chance prediction, while the closer the AUC is to 1.0, the better the instrument’s predictive accuracy. The Wisconsin’s AUC had ranged from .614 to .664 (Henderson, 2013). No previous examinations of the Wisconsin’s AUC have been conducted relative to the probationer’s racial/ethnic classification, which would allow for the comparison of racial predictive error across multiple studies.
Successful probation completion
The outcome measure of successful probation closures was operationalized dichotomously (yes-no) and contingent upon any successful probation completion between the fiscal years of 2000 to 2010. As previously described, prior studies tend to rely on revocation as the outcome measure of choice despite probation being a better estimate of probationer behavior. Probation completion data were collected from the state database of probation closures, which is the central repository that all probation departments in the state submit their closure data, along with demographic, assessment, prescribed treatment modalities, and offender responses.
Statistical analysis
This analysis followed Crocker and Algina’s (2006) procedure for identifying psychometric bias that was adapted from Cleary (1968), with some modification to account for the data characteristics in this study. The criterion in the study was probation success/failure. Crocker and Algina describe a method for a criterion that is continuous. In order to make the method compatible with this current data set, the model was changed from a linear regression to a logistic regression. In other words, instead of predicting the level of some outcome, the model predicted the percentage of success at each level of the independent variable (in this case, risk score). Instead of producing a “majority group” regression line and a “racially underrepresented group” regression line, this method produces a majority and a racially underrepresented group logistic curve. In all models, the interaction between racially underrepresented group status and the independent variable of interest was checked for significance. If significant, that item was used in the final model that was reported.
Results
To control for the undue influence of a particular racial/ethnic group, three categories of race/ethnicity were used in this analysis: White, Black, and Hispanic. These were coded as two dummy variables: Black and Hispanic with White remaining as the comparison group.
Risk Score
Table 2 provides the distribution of the risk classification for the overall sample and each racial/ethnic group. For the total sample and each racial/ethnic group, most probationers were classified as medium risk. The percentages of high- and low-risk probationers were also similar across all groups. Blacks had the largest group of probationers classified as high risk (37%).
Distribution of Risk Classification Groups by Race and Ethnicity.
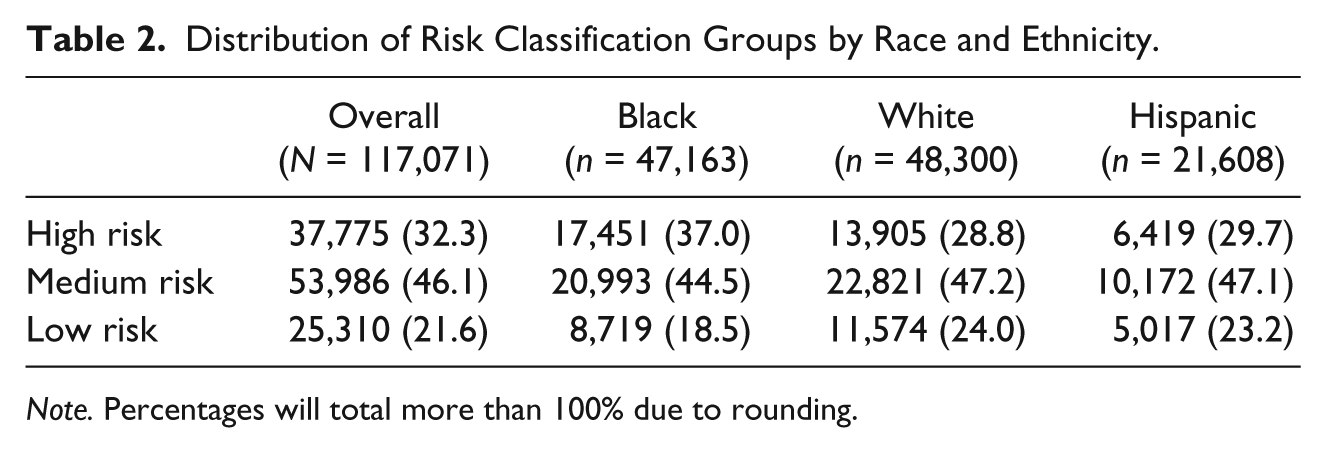
Note. Percentages will total more than 100% due to rounding.
Base Rates of Unsuccessful Probation Closures
As indicated in Table 3, the overall base rate for unsuccessful probation closures was 37%. As expected, 52.1% of the high-, 37.8% of the medium-, and 10.1% of the low-risk probationers unsuccessfully completed their probationary term. For each risk classification, African Americans had the highest percentage of those unsuccessfully released from probation. Chi-square analyses were used to determine whether these racial/ethnic relationships were significantly related to probation failure. African Americans were significantly more likely to unsuccessfully complete their probationary term at each risk level (χ2 = 2182.94, df = 2, p = .000).
Probation Closure by Risk Level, Race, and Ethnicity.

Note. Percentages will total more than 100% due to rounding.
p < .0001.
An ANOVA was run to examine whether the three racial groups showed overall differences on risk scores before examining the impact of covariates. Post hoc comparisons were subsequently conducted to determine whether there were bivariate differences between each racial/ethnic group. Three race groups demonstrated significant differences on the risk scores overall, F(2, 117068) = 555.30, p < .001 (see Table 4). Post hoc comparisons, using a Bonferroni adjustment to protect against the inflation of Type I error, demonstrate that the White and Black probationers had significant mean differences on their risk score (M difference = 1.51 points, p < .001) as did Black and Hispanic probationers (M difference = 1.37 points, p < .001). White and Hispanic participants did not differ significantly (M difference = 0.13 points, p > .05).
Risk Score and Need Scores by Race Category.

Predictive Bias/Error
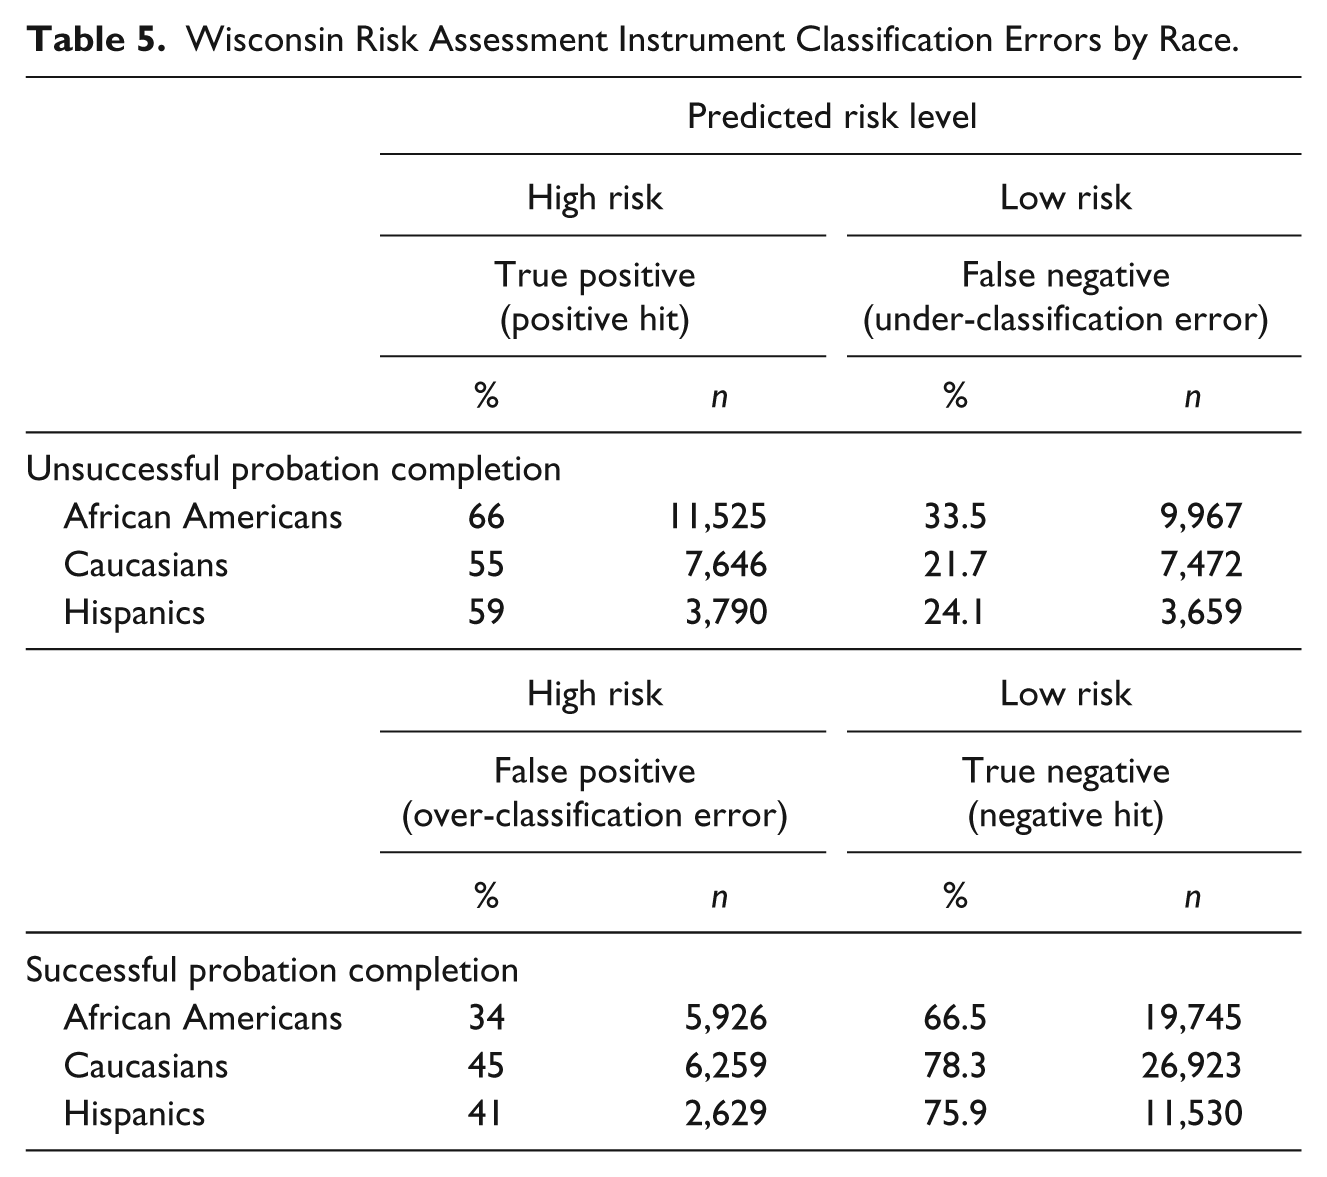
Consistent with psychometric bias testing in other disciplines (see Crocker & Algina, 2006), yet rarely examined in offender assessment studies, we ran risk-level contingency tables, which allowed us to examine the predictive error, relative to the offender’s racial/ethnic classification. The predictive error rates were examined for the high- and low-risk probationer and are detailed in Table 5. The high-risk predictions of the Wisconsin over-classified 45% of the Whites, 41% of the Hispanics, and 34% of the African Americans. Conversely, 33.5% of the Black, 21.7% of the White, and 24.1% of the Hispanic probationers were under-classified. From a practical perspective, false positives receive unnecessary levels of increased supervision and service delivery while false negatives do not receive the appropriate supervision and rehabilitative services, which have been shown to increase their likelihood of probationary success.
Wisconsin Risk Assessment Instrument Classification Errors by Race.
The next analysis was a modification of Cleary’s (1968) method for examining bias, which examines predictability of a dichotomous outcome across different racial/ethnic groups. A logistic regression model was run with risk score, racially underrepresented group (and a Risk × Racially underrepresented group interaction) predicting failure on probation. The interaction terms in this model test whether the differences between the majority and racially underrepresented groups are a function of the risk score. In other words, it allows the lines showing the predicted percentage of failure by race and risk scores to be non-parallel (so the racial differences could vary by the risk score of the individual). This model was significantly better than the no predictor model, χ2(5) = 17953, p < .001, and had a Nagelkerke R2 of 19.4, indicating this model predicted 19.4% of the variation in the dependent variable. As indicated in Table 6, the model correctly classified 69.8% of subjects as either successful or non-successful probationers, which is an improvement upon the previous research findings of the instruments predictive accuracy.
Logistic Regression: Predicting Probation Failure (N = 117,071).
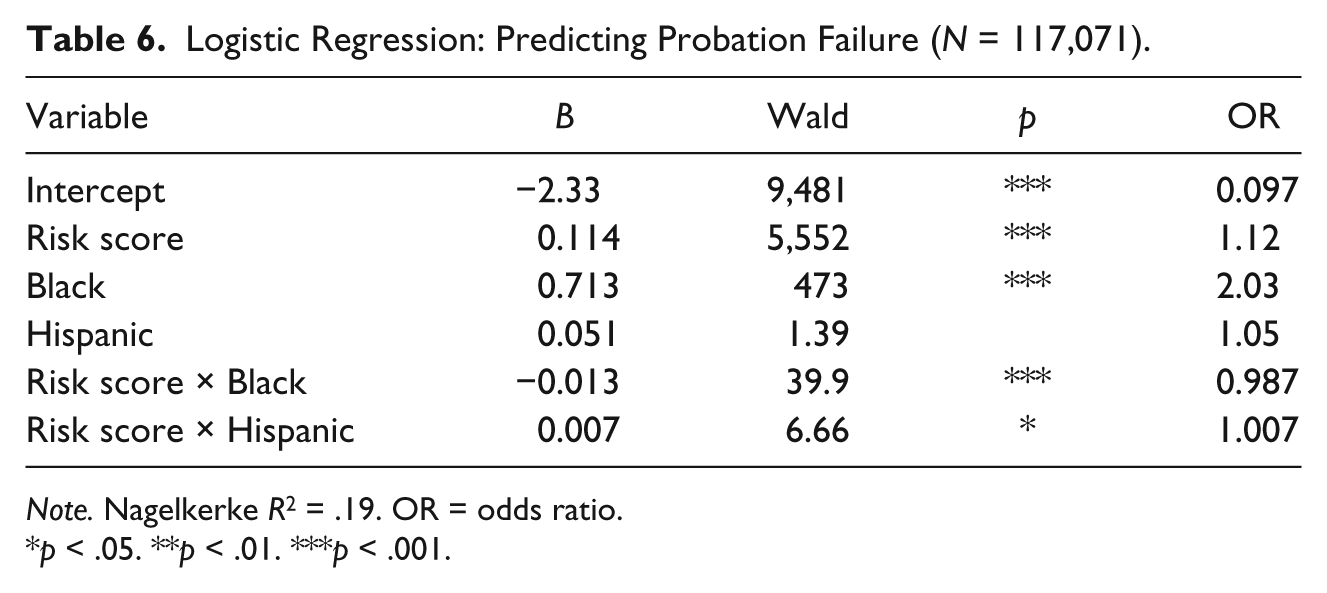
Note. Nagelkerke R2 = .19. OR = odds ratio.
p < .05. **p < .01. ***p < .001.
This model demonstrated that there were significant differences in outcomes for racially underrepresented group probationers when compared with White probationers, but these differences were dependent on the risk score assigned (see Figure 1). Outcomes for lower risked Hispanic probationers were no different from White offenders. In other words, the Hispanic intercept was not significantly different from zero. But as the risk scores increase for Hispanic probationers, higher percentages were failing probation than Whites with equivalent risk scores, as indicated by the positively significant coefficient on the “Risk score × Hispanic” interaction. Although significant, it should be noted that with a risk score of 30 (near the upper end of the scale), the percentage difference in failures was less than 5%.
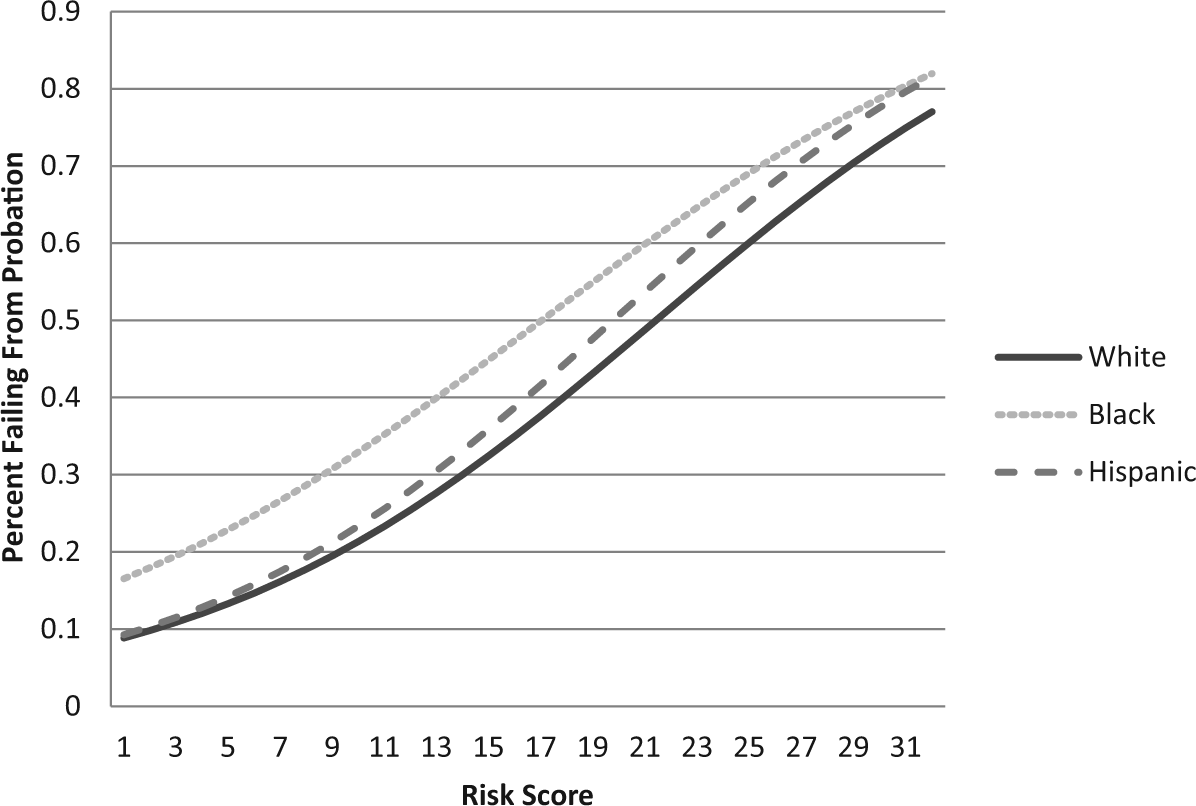
Group bias of risk score predicting percentage failure from probation.
In contrast, Black probationers were more likely to unsuccessfully complete probation than Whites at lower risk scores, but the failure rates became equitable for these two groups as risk scores increased. This can be seen in the significant coefficients on the intercept for “Black” and the significant coefficient on “Risk Score × Black.” At the lower risk scores, Black subjects were 2.03 times more likely to fail, but this difference narrowed as risk score increased. For example, at a risk score of 30, the difference between Black and White subjects was only about 5%.
Finally, a logistic regression predicting failure from probation was run with the same variables as the prior model, but severity of the presenting offense was added. This was done to determine whether the severity of the offense accounted for some of the predictive racial bias in the risk assessment. The addition of the extra variable significantly improved the model fit, χ2(1) = 2889, p < .001. The Nagelkerke R2 of this new model was higher than the previous logistic model, indicating that the new model predicted 22.3% of the variance in probation failure.
Adding presenting offense rendered the Hispanic × Risk score interaction no longer significant but left most of the other coefficients almost the same as in the prior model (see Table 7). In other words, in this model, after controlling for all the risk need assessment items, Hispanics had about the same probability of failing probation as Caucasian offenders. Severity of presenting offense significantly predicted probation failure (odds ratio [OR] = 1.24, p < .001). Every increase in the severity of the offense (e.g., from a Misdemeanor A to a Third-Degree Felony, or from a Felony 1 to a Felony 2) made the offender 1.24 times more likely to fail probation, even after controlling for risk score.
Logistic Regression: Predicting Probation Failure (N = 117,071).

Note. Nagelkerke R2 = 22.3. OR = odds ratio.
p < .05. **p < .01. ***p < .001.
Needs Score
Given that the needs items were premised on professional judgment and not previously validated items, coupled with its practical use as an establisher of rehabilitative services, we decided to examine the ability of the needs items to express bias. Overall, there were significant mean differences between the racial groups on the needs score section of this risk assessment, F(2, 1170680) = 107, p < .001 (see Table 2). Post hoc tests using Bonferroni adjustments indicated that Black probationers had higher need scores than White (M difference = 81, p < .001) or Hispanic probationers (M difference = 0.75, p < .001). Hispanic probationers did not have significantly different needs scores than White probationers (M difference = 0.054, p > .05).
To look at the racially predictive differences expressed by the needs assessment portion of the Wisconsin Risk Assessment, a modified version of the Cleary (1968) analysis was run. 1 A logistic regression model was run with race/ethnicity, need score, and the interactions of need score by each racial/ethnic category predicting failure from probation. The interactions between need score and race ethnicity were significant; as a result, these interaction terms were used in the final model along with the main effects of the need score and the race/ethnicity categories.
This model was significantly better than the no predictor model, χ2(5) = 16750, p < .001, and had a Nagelkerke R2 of .182, indicating that this model predicted approximately 18% of the variation in probation failure for this population (see Table 8). Overall, the model correctly classified 68% of offenders according to their likelihood of probation success.
Logistic Regression: Predicting Probation Failure (N = 117,071).
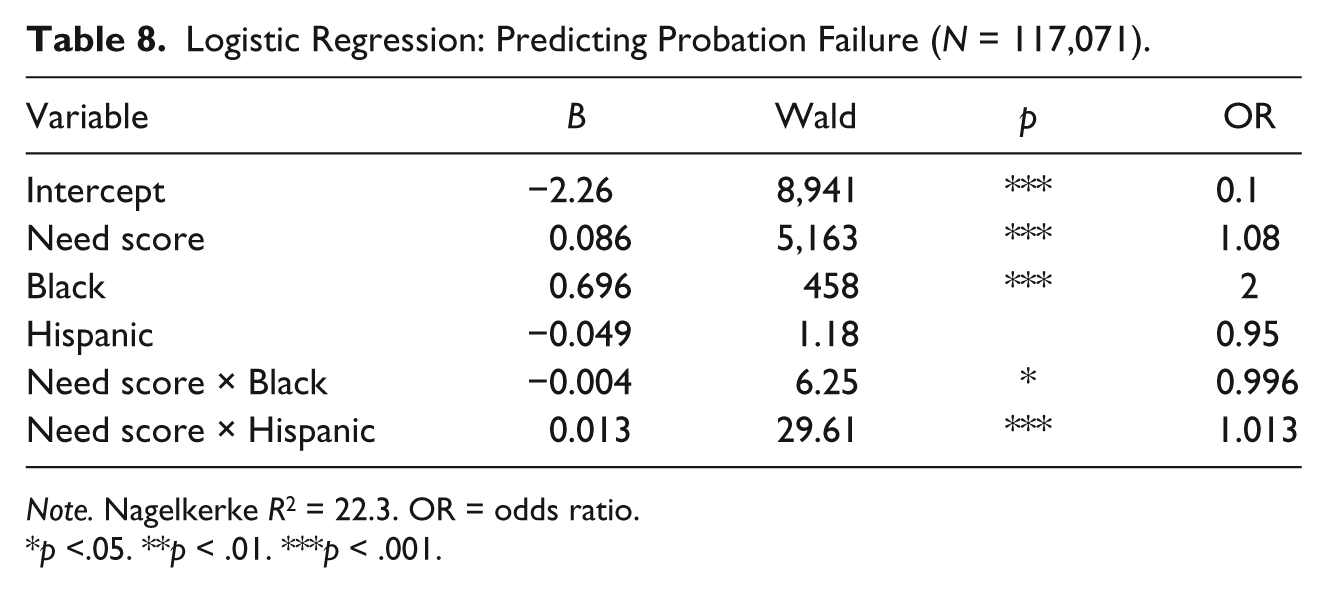
Note. Nagelkerke R2 = 22.3. OR = odds ratio.
p <.05. **p < .01. ***p < .001.
As noted in Figure 2, the need score model exhibited similar predictability characteristics as the risk score model found in Figure 1. In fact, African American probationers were more likey to be unsuccessful than Caucasian offenders of the same need score. There was no difference between failure of Hispanic and Caucasian offenders at lower risk scores, but Hispanic offenders at higher risk levels offended at levels more similar to the African American offenders.
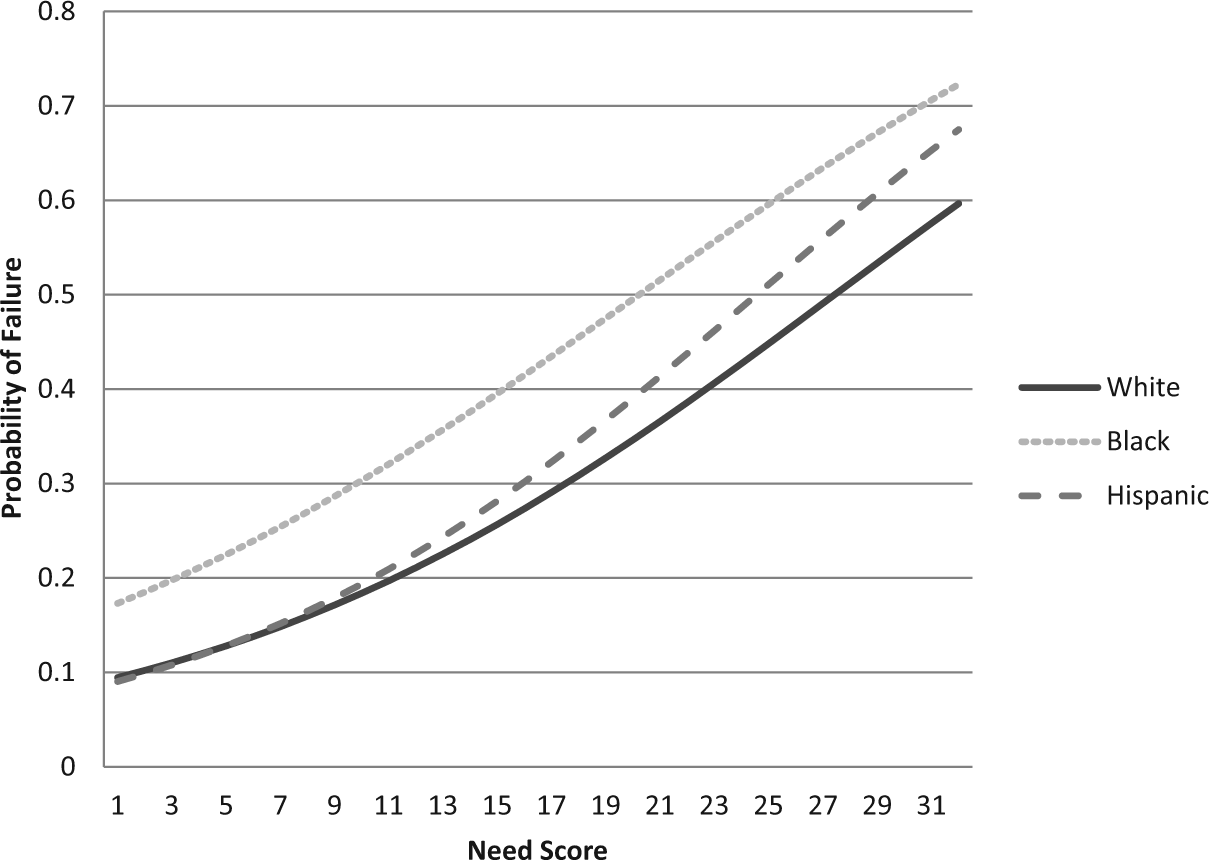
Group bias of need score predicting percentage failure from probation.
ROCs
Given that bivariate analyses are only able to provide the extent and not the degree to which variables are related and their assumption of an evenly distributed outcome measure, AUC estimators are commonly utilized in risk assessment research. The AUC is a measure of the risk instrument’s accuracy when the outcome measure is dichotomously operationalized. Specifically, in our case, plotting the false positives against the false negatives for each racial group, the AUC will provide an indication of the likelihood that an unsuccessful probationer will have a higher score than the successful probationer (Henderson & Miller, 2011). Given that outcome measure under question is not evenly dispersed across racial/ethnic groups, the use of the AUC allows for (a) the correction of this assumption and (b) a common denominator by which our findings can be contextualized to the extant literature. Instruments predicting better than chance will score at least .51 on the AUC with scores moving closer to 1.0 indicating increasing levels of accuracy.
As indicated in Table 9, a final analysis was run to examine the racial/ethnic predictive accuracy (i.e., AUC analysis) of probation failure. This analysis revealed that the risk score had the best utility for Caucasian and Hispanic probationers (AUC’s of .719 and .727, respectively) and a slightly less predictive utility for Black offenders (.700). The 95% confidence intervals overlapped for the Hispanic and White probationers but not the Black offenders. In short, the risk assessment predicted failure from probation similarly for White and Hispanic offenders, but less accurate for Black offenders.
ROC Analysis: Area Under the Curve By Race.
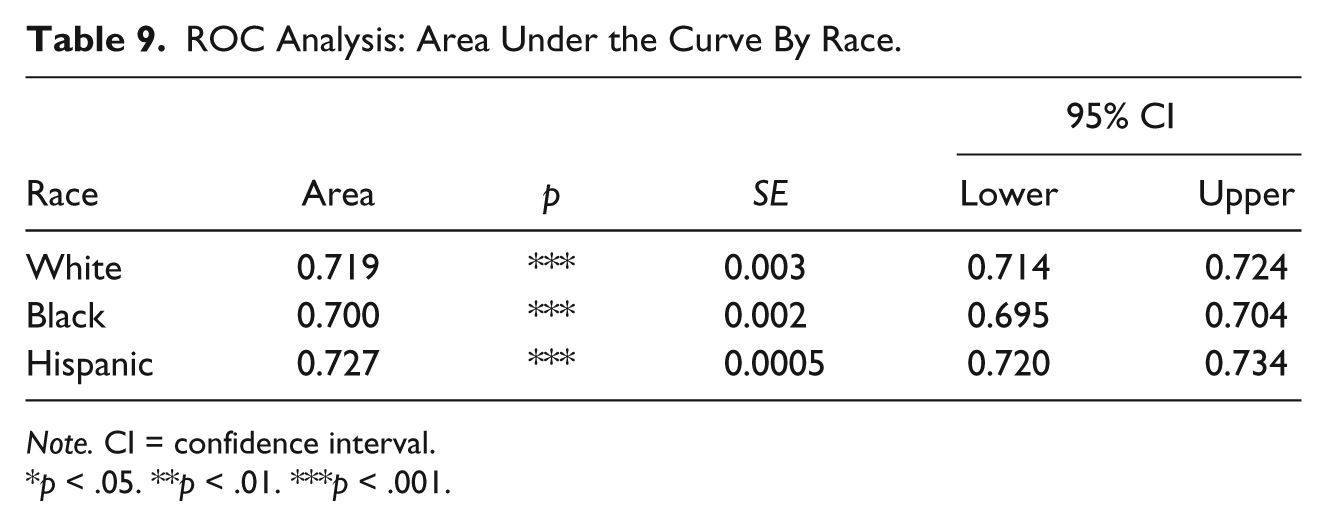
Note. CI = confidence interval.
p < .05. **p < .01. ***p < .001.
Discussion
By focusing on regressing predictive items on an outcome measure, the extant literature has misdiagnosed the applicability of risk instruments across various demographic groups. Despite advancing the body of knowledge, only using regression analysis does not allow for the understanding of produced error, ever more important when racial/ethnic equity is of concern. Unexplained error presents a challenge to risk assessment, in that the presence of such indicates the potential loss of freedoms, increased supervision, and a lack of service provisions. When this error is relative to an offender’s ascribed class (albeit, socio-economic, racial/ethnic, or gendered) without random application, therein lies a violation of the offender’s human rights, thus representing a potential indication of systematic discrimination, an issue worthy of continual scholarly inquiry.
This study is the first to examine the extent and degree to which racial/ethnic bias exists within a random selection of probationers from a large probation population. We extended the traditional regression analysis to a comparative examination of predictive error, ROC curve differentials, and significance testing, of various racial/ethnic probationer groups. We highlight the need to examine more than regression coefficients for an appreciation of risk and need assessment predictive equitability.
Unlike most predictive validity studies, which do not control for the impact of the probationers instant offense type, this study’s findings demonstrated that the presenting offense level provides additional predictive value, in spite of the risk score. This finding was unexpected as it is assumed the instant offense would be allotted for in the criminal history measures of the risk instrument. In short, the previously mentioned finding provide an indication of the failure of the risk instrument to optimally utilize the information available to the probation officer at the time of assessment, an issue worthy of further inquiry.
Given that probationers have a tendency to be lower and “minimally risked,” our finding, which identified that the bias of the risk instrument was much larger for low-risk probationers, creates an interesting observation. In other words, for the average probationer (i.e., lower and minimally risked), this instrument expresses its greatest level of racial bias/error. An alternative perspective on this finding is that the Wisconsin appears to be a more unbiased predictor of probation success for the “higher risked” probationer. Building on the literature and its failure to control for risk level and predictability, subsequent research would further the body of risk assessment knowledge by examining those factors, which predict the likelihood of this inverse observation (more bias for the “lower risked,” more common, probationer).
The finding that the risk score predicts outcomes better and exhibited less bias than the need score of the assessment is consistent with the original intent of the needs portion. In fact, the need items portion of the instrument were created from the subjective determination of officer assessments (i.e., not established from empirically tested dynamic items). Although this finding is supportive of the instruments’ original intent, research suggest that the utilization of risk and needs items optimize the instruments’ predictability (Henderson & Miller, 2013). It should be noted that in reality, the needs items of the Wisconsin are utilized as predictors in conjunction with the risk assessment portion of the instrument. In fact, assessing officers utilize the higher classified of the risk or needs score. In short, supervising officers utilize the higher ranked of the two scores to determine the offender’s supervision level and treatment needs. Therefore, continued examination of the needs assessment portion warrant future objective examination.
Conclusion
This research examined the ability of the Wisconsin Risk Needs Assessment to equitably predict probation success and distribute error across racial/ethnic groups. Our findings indicate that the risk instrument under question predicts better for “higher risked” probationers. The finding that the error is more likely for under-classified Blacks and over-classified Whites presents a critical suggestion for future researchers to determine those predictive factors most associated with predictive inequities. Further inquiry in this area also provides an opportunity for researchers and practitioners to collaborate on seeking a solution to disproportionate service delivery and program fidelity.
Despite making a contribution to the ambiguity of predictive racial equity, classification, and error, this study falls victim to a few limitations that, if addressed, provide a foundation for subsequent scientific inquiry. First, comparing groups of different sizes has the potential to affect the distribution of risk scores and prediction error for each group). As a result, this study’s findings must be contextualized with respect for the number of probationers within each racial/ethnic group. An approximate weighting of the racial/ethnic groups relative to their proportion within the given population should be included in future research. Similar to most risk validations, this study did not include a measure of the actualized rehabilitative services for the probationer while under supervision. Consequently, our findings could be as much about the impact of services received than they are about the assessment of the instrument’s predictive accuracy. Therefore, future research should seek to include a measure of the rehabilitative program efficacy as well as longitudinal measures of offender motivation and opportunity for resiliency. Addressing the extant literature on risk assessments, this study provides a more stringent analysis of a predictive instrument’s level of predictability across racial/ethnic groups. We attempt to change the inquisitorial trajectory of risk assessment research and direct it toward an inclusion of the examination of error, in conjunction with the commonly used regression analysis. Reliance on regression analysis oversimplifies predictive bias (i.e., error) within objective assessments seeking to provide the best opportunity for probationer success. In the end, the goal of risk assessment should be to adhere to the equal application of services and not become a mechanism for institutionalized bias couched within the realm of offender control.
Footnotes
Declaration of Conflicting Interests
The authors declared no potential conflicts of interest with respect to the research, authorship, and/or publication of this article.
Funding
The authors received no financial support for the research, authorship, and/or publication of this article.