
Abstract
Sustainability drives the development of new or optimised methods in plastics technology, one of which is the vacuum assisted rotational foam molding process, as it refrains from the use of chemical blowing agents. Process inherent air inclusions in the polymer melt thereby act as nuclei for cell growth induced by means of an applied vacuum. This manuscript addresses the influence of the moisture content in the employed powders and characterizes its impact on the foaming level. The findings reveal that the formation of air inclusions, beyond those generated during sintering processes in melting is significantly intensified by the evaporation of water molecules during polymer heating. The increased number of initially present gas inclusions allows to obtain higher foaming degrees. Two types of thermoplastic polyurethane (TPU) materials with distinct hardness levels were examined closely, revealing a positive correlation between elevated shore hardness and a shift in the water release to higher temperatures. In materials with lower shore hardness, water release occurs at lower temperatures, before the polymer melt forms, and thus does not contribute significantly to foaming. The effect is believed to be due to a stronger molecular binding of water through hydrogen bonding in the material with a higher hard segment content. Notably, the contribution to foam expansion is more pronounced at higher hardness gradients. This work provides an overview of the possibilities to influence the foaming degree through the initial moisture content in the materials used, as well as the importance of proper material conditioning for better property prediction.
Keywords
Introduction
Rotational molding allows the production of hollow parts, free of residual stresses and excels due to its cost-effective machinery technology and simple tool technology. In most cases, time-consuming finishing processes are redundant and waste products are generally avoided through complete material utilisation, which makes the process attractive, especially in times of sustainability. Typical product representatives are large volume components that may be found in a variety of industrial sectors, such as tanks, furniture, machine housings, kayaks or boat shells. 1 Many rotationally moulded parts are produced with foamed structures that either ensure an increased stiffness-to-weight ratio, provide buoyancy due to their low density or are used for thermal or sound insulation.2–4
Foaming can be facilitated in rotational molding via a number of different process approaches, all mainly based on the usage of chemical blowing agents (CBAs), which are constantly being further developed from an economic and ecological point of view, as well as in order to generate improved product properties.5,6 The vacuum assisted rotational foam molding 7 ranks among new process approaches that have been developed in the course of lean and sustainability approaches. 7 The well-researched phenomenon of the formation of bubbles in the polymer melt in the course of sintering and melting processes in the particle-based material systems8–10 is exploited by using the bubbles as cell nuclei for subsequent cell growth. This is achieved by applying a vacuum when the polymer is in the molten state. According to Boyle-Mariotte’s law, the pressure of ideal gases is inversely proportional to the volume at constant temperature and gas quantity in a closed system. If the pressure acting on the air reservoirs, i.e. the bubbles trapped in the melt, is reduced, they therefore expand. With subsequent cooling, the newly formed cellular structure solidifies and is maintained. The process method is characterised by shorter cycle times compared to the conventional process, as the otherwise undesirable bubbles are not to be eliminated by extensive heating of the mold 10 and thus longer process times, but on the contrary are a requirement for foaming. Recent experiments confirm the assumed correlation between pressure and volume according to Boyle and show an influence of the vacuum application temperature. 7 Furthermore, it was successfully demonstrated that the effects of particle size and shape on bubble dimensions are propagated through the subsequent foaming process. 11
Previous research has primarily focused on polyethylene, the most commonly used material in rotational molding applications. Due to its hydrophilic nature, there has been limited attention given to the conditioning of the material through drying, as well as the effects of water content on the rotational molding process and foaming. The present study aims to analyze the effects of using unconditioned versus dried material in the vacuum-assisted rotational foam molding process. For this purpose, thermoplastic polyurethane (TPU) with varying hard-segment contents was chosen, as the grade variation significantly influences the water desorption mechanism and, consequently, the foaming results. This material selection highlights the need to understand the role of water as a foaming agent, which is addressed in this study. It is crucial to investigate the behavior of hygroscopic materials and establish proper conditioning guidelines.
State of the art
Overview and current trends in foaming for rotational molding
In rotational molding, foams are used to enhance thermal and sound insulation properties or to manipulate product density and stiffness. Foam structures offer significant potential for energy absorption, helping to manage mechanical shock, vibration, and noise. To optimize various properties, multi-layer composites are often employed. The foaming of polyolefins is commonly practiced in rotational molding and has been explored in various studies.12,13,14 The predominant method uses chemical blowing agents (CBAs), which are typically processed either as a dry blend with the polymer powder or by pre-compounding them into the polymer, ensuring a uniform dispersion within the polymer matrix. This results in a foam with a consistent cell size distribution, reduced cell size, and increased cell density. 15
Physical blowing agents (PBAs) are less compatible with rotational molding because they require high-pressure systems to dissolve into a single-phase solution with the polymer melt. Once pressure is released, the PBAs expand rapidly, creating cells within the material. However, rotational molding typically operates under low-pressure conditions, which do not facilitate this phase transition and expansion effectively. While less commonly used in rotational molding, an alternative involves polymer microspheres filled with liquid droplets that expand at elevated temperatures. However, this method can reduce mechanical properties such as Young’s modulus and elongation at break. 16
Foam structures in rotational molding can vary considerably. Without a precise synchronization of sintering conditions and blowing agent decomposition, as well as sufficient melt strength, foams tend to show coalescence and cell enlargement, which limits uniformity. 14 By applying strategies like crosslinking, suitable resin grades with sufficient melt strength, nucleating agents, or careful control of foaming kinetics, finer and more homogeneous cell structures can be achieved. Depending on material and processing conditions, densities can be significantly reduced compared to the solid polymer while maintaining structural integrity. Reported rotational foam molding densities predominantly fall within the range of high-density polymer foams (ρ > 0.240 g cm−3) according to common density-based classifications. 4
This paper covers a new approach where air inclusions, formed during the sintering activities during the heating phase, act as an intrinsic PBA, providing an innovative alternative to traditional physical foaming methods. Once formed a vacuum is applied which leads to an expansion of the air inclusions evolving into a cellular structure within the polymer melt. The bubble growth can mainly be attributed to Boyle’s law. Depending on the pressure level, different cell geometries and sizes result. Another influencing factor is the vacuum application temperature and thus the viscosity of the melt at the time of vacuum application, constituting an acting counter force to the bubble expansion. Since the air pockets act as nuclei for cell growth, the formation of the cell structure is largely dependent on their existence, number and size in the unfoamed state, which can be effectively controlled via the particle size and dimensions of the raw material.7,11
Water as a foaming agent in polymer foam production
Water has been reported in the literature to serve as an effective blowing agent in a variety of material matrices, including thermoplastics, thermoplastic elastomers (TPEs), and composites, thanks to its foaming properties. 17 It can be incorporated into a thermoplastic or TPE matrix in either gaseous or liquid form, allowing for various processing methods such as extrusion and injection molding. In these processes, water interacts with the polymer matrix, generating foam as it vaporizes or evaporates. When combined with chemical blowing agents (CBAs), water further enhances the foaming effect, leading to improved foam expansion and structure. Additionally, surfactants or carriers, such as NaCl, can be added to stabilize the foam structure and prevent collapse during processing. However, it is important to note that excessive amounts of these additives may cause precipitation, which can negatively impact foam stability and the mechanical properties of the final product.18,19
Water has gained recognition as a sustainable blowing agent, particularly when compared to traditional agents like CFCs, HFCs, and VOCs, which have been partially banned for environmental reasons. Its low volatility, minimal solubility, and environmental benefits make it an attractive alternative. Furthermore, water is cost-effective, readily available, and requires no specialized handling or high-pressure systems, as it can be injected in liquid form from a low-pressure reservoir. This feature allows for precise metering, improving foaming efficiency without the need for the high-pressure equipment typically required for gases like CO2 or N2.
Although water has been widely used as a blowing agent in thermoplastics and thermoplastic elastomers (TPEs), its application in elastomeric matrices, particularly in rotational molding, remains less explored. However, with the increasing demand for foamed elastomers, its potential is gaining more attention. Research has shown that water can significantly improve foam quality in thermoplastic elastomer blends, such as PP/EPDM TPEs. 17 Building on these findings, this study aims to investigate the incorporation of water into thermoplastic polyurethane (TPU), focusing specifically on its effects on foam formation during the vacuum-assisted rotational foam molding process. The proposed mechanism by which water acts as an additional blowing agent involves the release of moisture from the material, followed by evaporation, which generates gas bubbles within the polymer melt. The following section will therefore provide an overview of the chemical structure of the materials used, alongside relevant literature on the incorporation of water in TPU formulations.
Molecular structure and water integration in TPU
TPUs are block copolymers with alternating hard and soft segments. The schematic structure and chemical composition of the polyether TPUs used in this study are shown in Figure 1. The material marketed by BASF SE (Ludwigshafen, Germany) under the trade name Elastollan is essentially produced by the reaction of long-chain diols (polyols), diisocyanates, and short-chain diols. During polymerization, the polyols and the short-chain diols react with the diisocyanates through polyaddition, forming a linear polyurethane. The characteristic soft segment is formed by the reaction of polyol with diisocyanate, while the hard segment is created by the combination of diisocyanate and the short-chain diol. In this study, Elastollan types with various hardness grades were used. The hardness grade is largely determined by the proportions of hard and soft segments.20,21 Schematic structure of TPU and chemical structural formula of the ether-based TPUs used, according to [20, 21].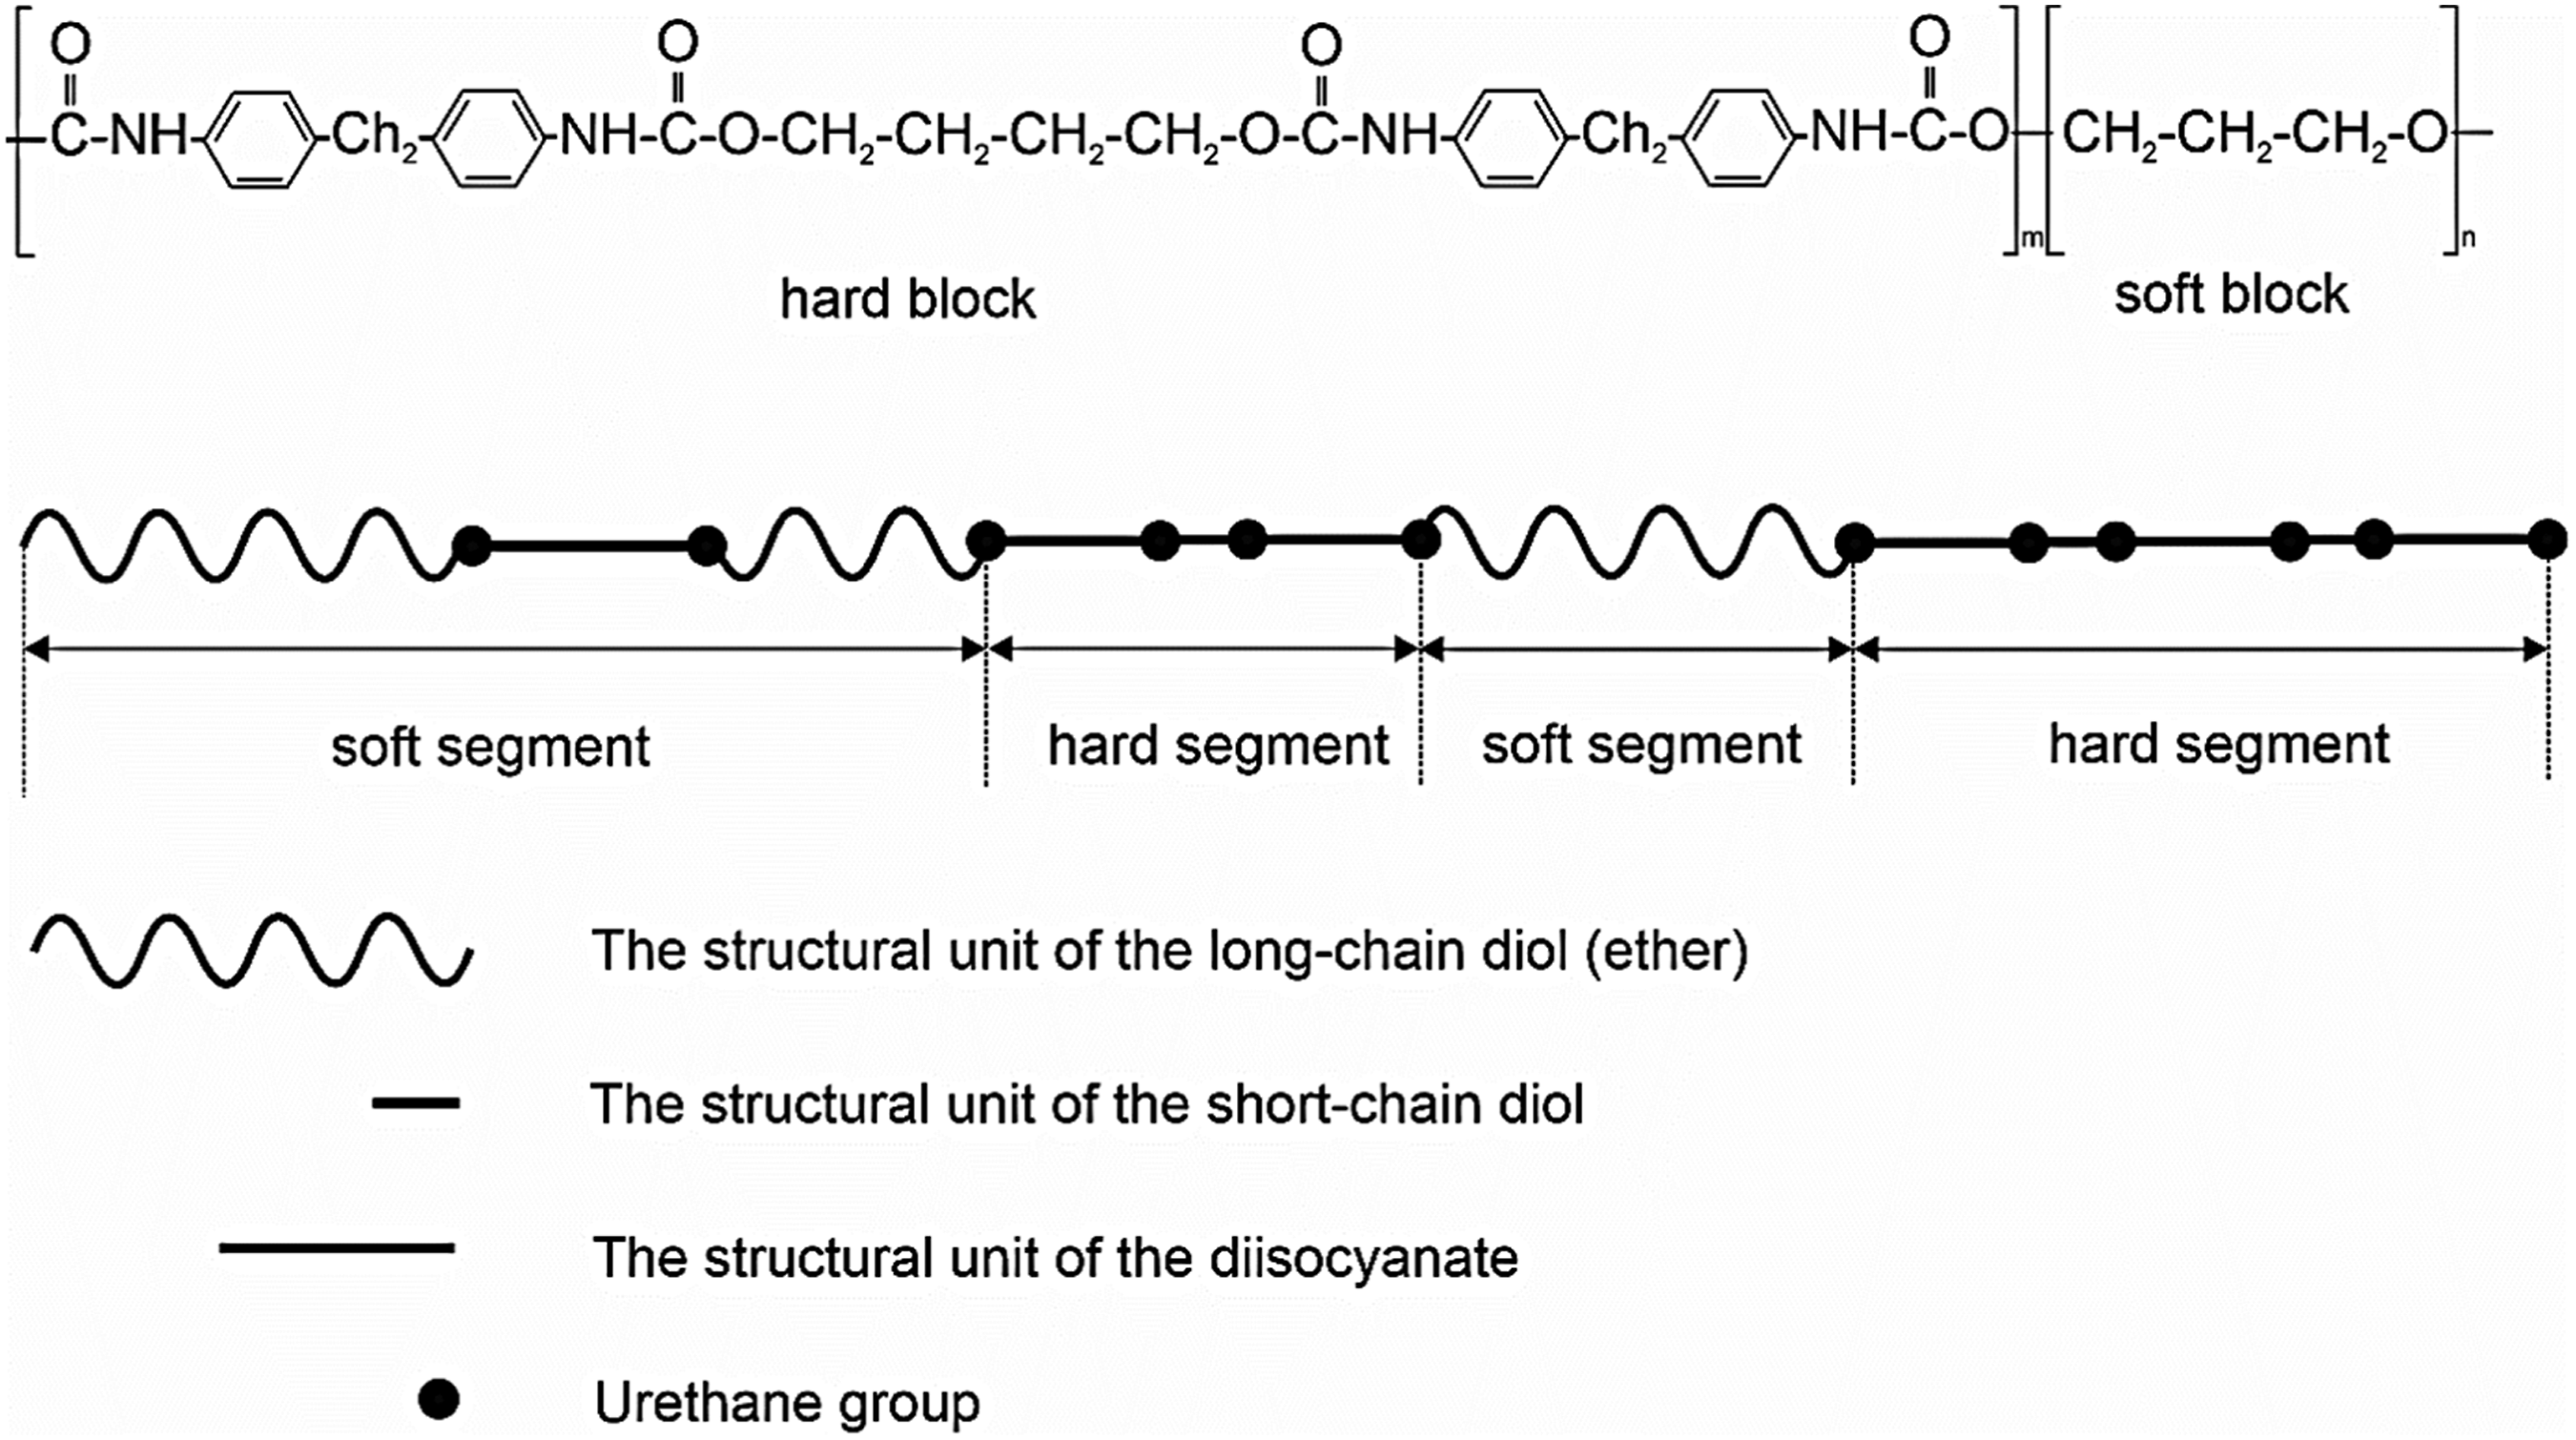
Extensive research has been conducted on the influence of the ratio of hard to soft segments, the type of hard segments, the type of chain extenders, and segment length on hydrogen bonding, as well as on crystallization behavior 22 and mechanical performance in TPU materials.23–25 It was shown that a higher hard-segment content increases hydrogen bonding, directly influencing the material’s structural properties.22,26 Additionally, moisture-induced changes in microphase morphology, enabled by hydrolysis, were found to disrupt hydrogen bonds, leading to the aggregation of hard segments over time. This process initially increases hardness but eventually homogenizes the soft and hard segments, resulting in altered viscoelastic behavior. 27
Water absorption influences the polymer’s properties by weakening hydrogen bonding between N–H and C = O groups, resulting in a reduction in the glass transition temperature (Tg). Free water, which evaporates at relatively low temperatures, has minimal impact on Tg and mechanical behavior. In contrast, bound water, which requires significantly higher temperatures for removal, causes a notable and almost linear decrease in Tg and strongly affects tensile properties. Upon sufficient heating to remove all absorbed water, the Tg returns to its original value under dry conditions. 28 These findings highlight the critical impact of moisture and hydrogen bonding on the mechanical and thermal performance of TPU materials.
In continuation, this study aims to close the gap in understanding how moisture content affects foaming behavior, by correlating existing knowledge of water incorporation in TPU material systems with insights into the specific processing sequence in vacuum-assisted foaming. The formation of hydrogen bonds plays a crucial role in this. Amine groups (N–H in the hard segments) act as proton donors, while carbonyl groups (C = O in the hard segments) and ether groups (C–O in the soft segments) serve as proton acceptors. Due to phase separation, two types of hydrogen bonds can form: between N–H and C = O in the hard segments, and between N–H and C–O in the soft segments. However, because C = O groups are stronger proton acceptors and the hard segments tend to aggregate into separate domains, hydrogen bonding occurs predominantly between N–H and C = O within the hard segments, while interactions with ether oxygens in the soft segments play only a minor role.20,29
N-H and C = O groups may be either free or hydrogen-bonded. Water can infiltrate and dissolve existing bonds, weakening the material’s cohesion, or it can also bond to free groups.
29
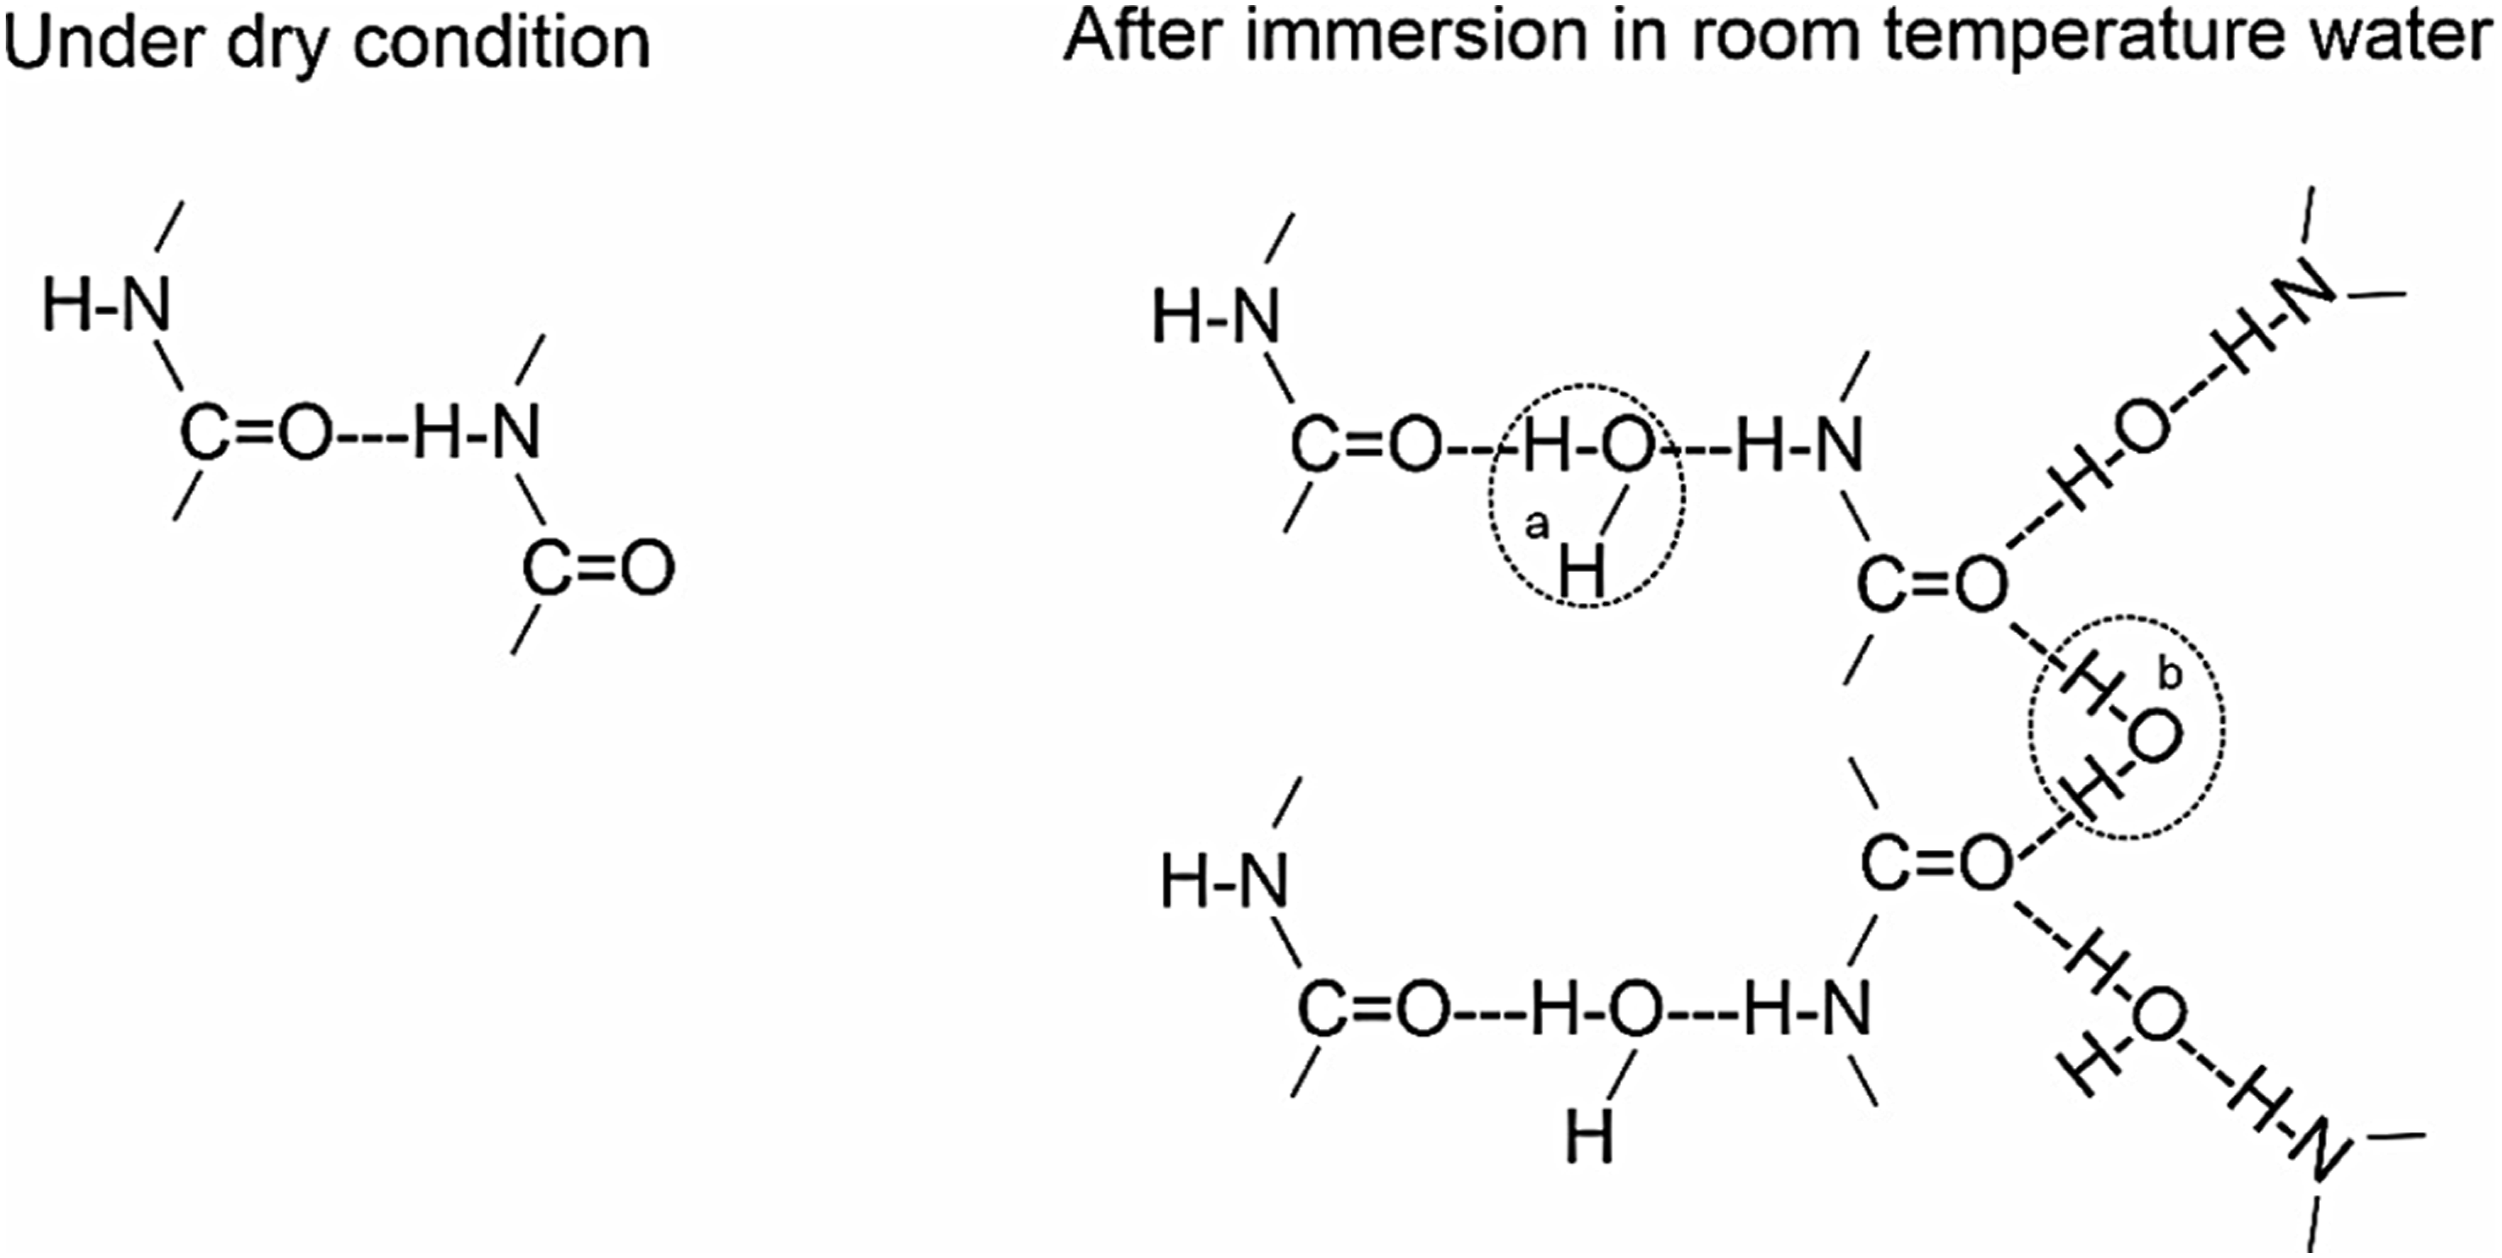
The incorporation of water can be explained using the following schematic model, see Figure 2, as outlined by Puffr and Sebenda.28,30 Water molecules first form a double hydrogen bond between the CO groups (b). Additional molecules create hydrogen bonds between the already bound CO and NH groups (a). The double hydrogen bond between the CO groups has been identified as a stronger bond,
8
which also results in higher thermal stability of the bond. Furthermore, water can loosely incorporate into intermolecular spaces due to capillary effects.
8
Experimental
Materials
Results of the optical particle analysis of the employed TPU raw materials.
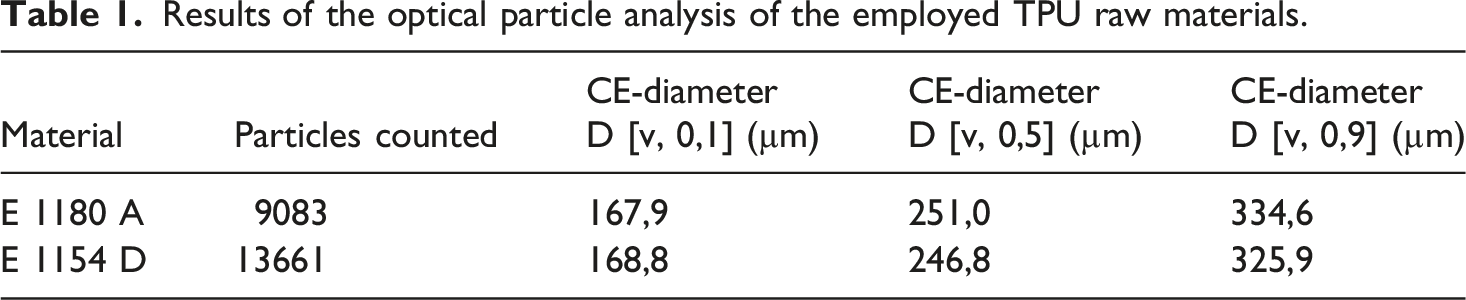
Density values provided by the manufacturer show values of 1.11 g cm−3 for E 1180 A and 1.17 g cm−3 for E 1154 D. The materials are particularly distinguished by their excellent hydrolysis resistance, flexibility at low temperatures, resistance to microorganisms, good abrasion resistance, high tensile strength, and effective damping properties. The method employed to assess the impact of moisture content, involved a comparison between rotational molding samples produced from dried and humidity-conditioned materials, examining porosity in unfoamed samples and foam density in foamed samples. Humidity conditioning was achieved by storing the materials in a standard climate at 23°C and 50% relative humidity for at least 24 h until they reached their saturation point (further storage did not lead to any additional increase in moisture content). Saturation values correspond to the first data points in Figure 8 before drying. Drying conditions for all materials consisted of storage in a dry air oven at 80°C for 10 h. For simplicity the materials will henceforth be referred to as “humid raw material” and “dried material”.
Rotational molding setup and experiments
The rotational molding trials were conducted on a laboratory-scale single-axis molding machine, model SM-03 from FILL GmbH (Gurten, Austria). The setup used a vacuum-sealed cylindrical mold with an inner diameter of 200 mm and a length of 225 mm, designed for uniaxial rotation along its axis of symmetry. Figure 3(a) provides an illustration of this vacuum-compatible mold arrangement. (a) Schematic illustration of the mold setup; (b) schematic pressure and temperature profile utilized for the rotational molding specimen trials TV: vacuum application temperature p0: ambient pressure; pV: vacuum pressure; TM: maximum process temperature; tH: isothermal holding time.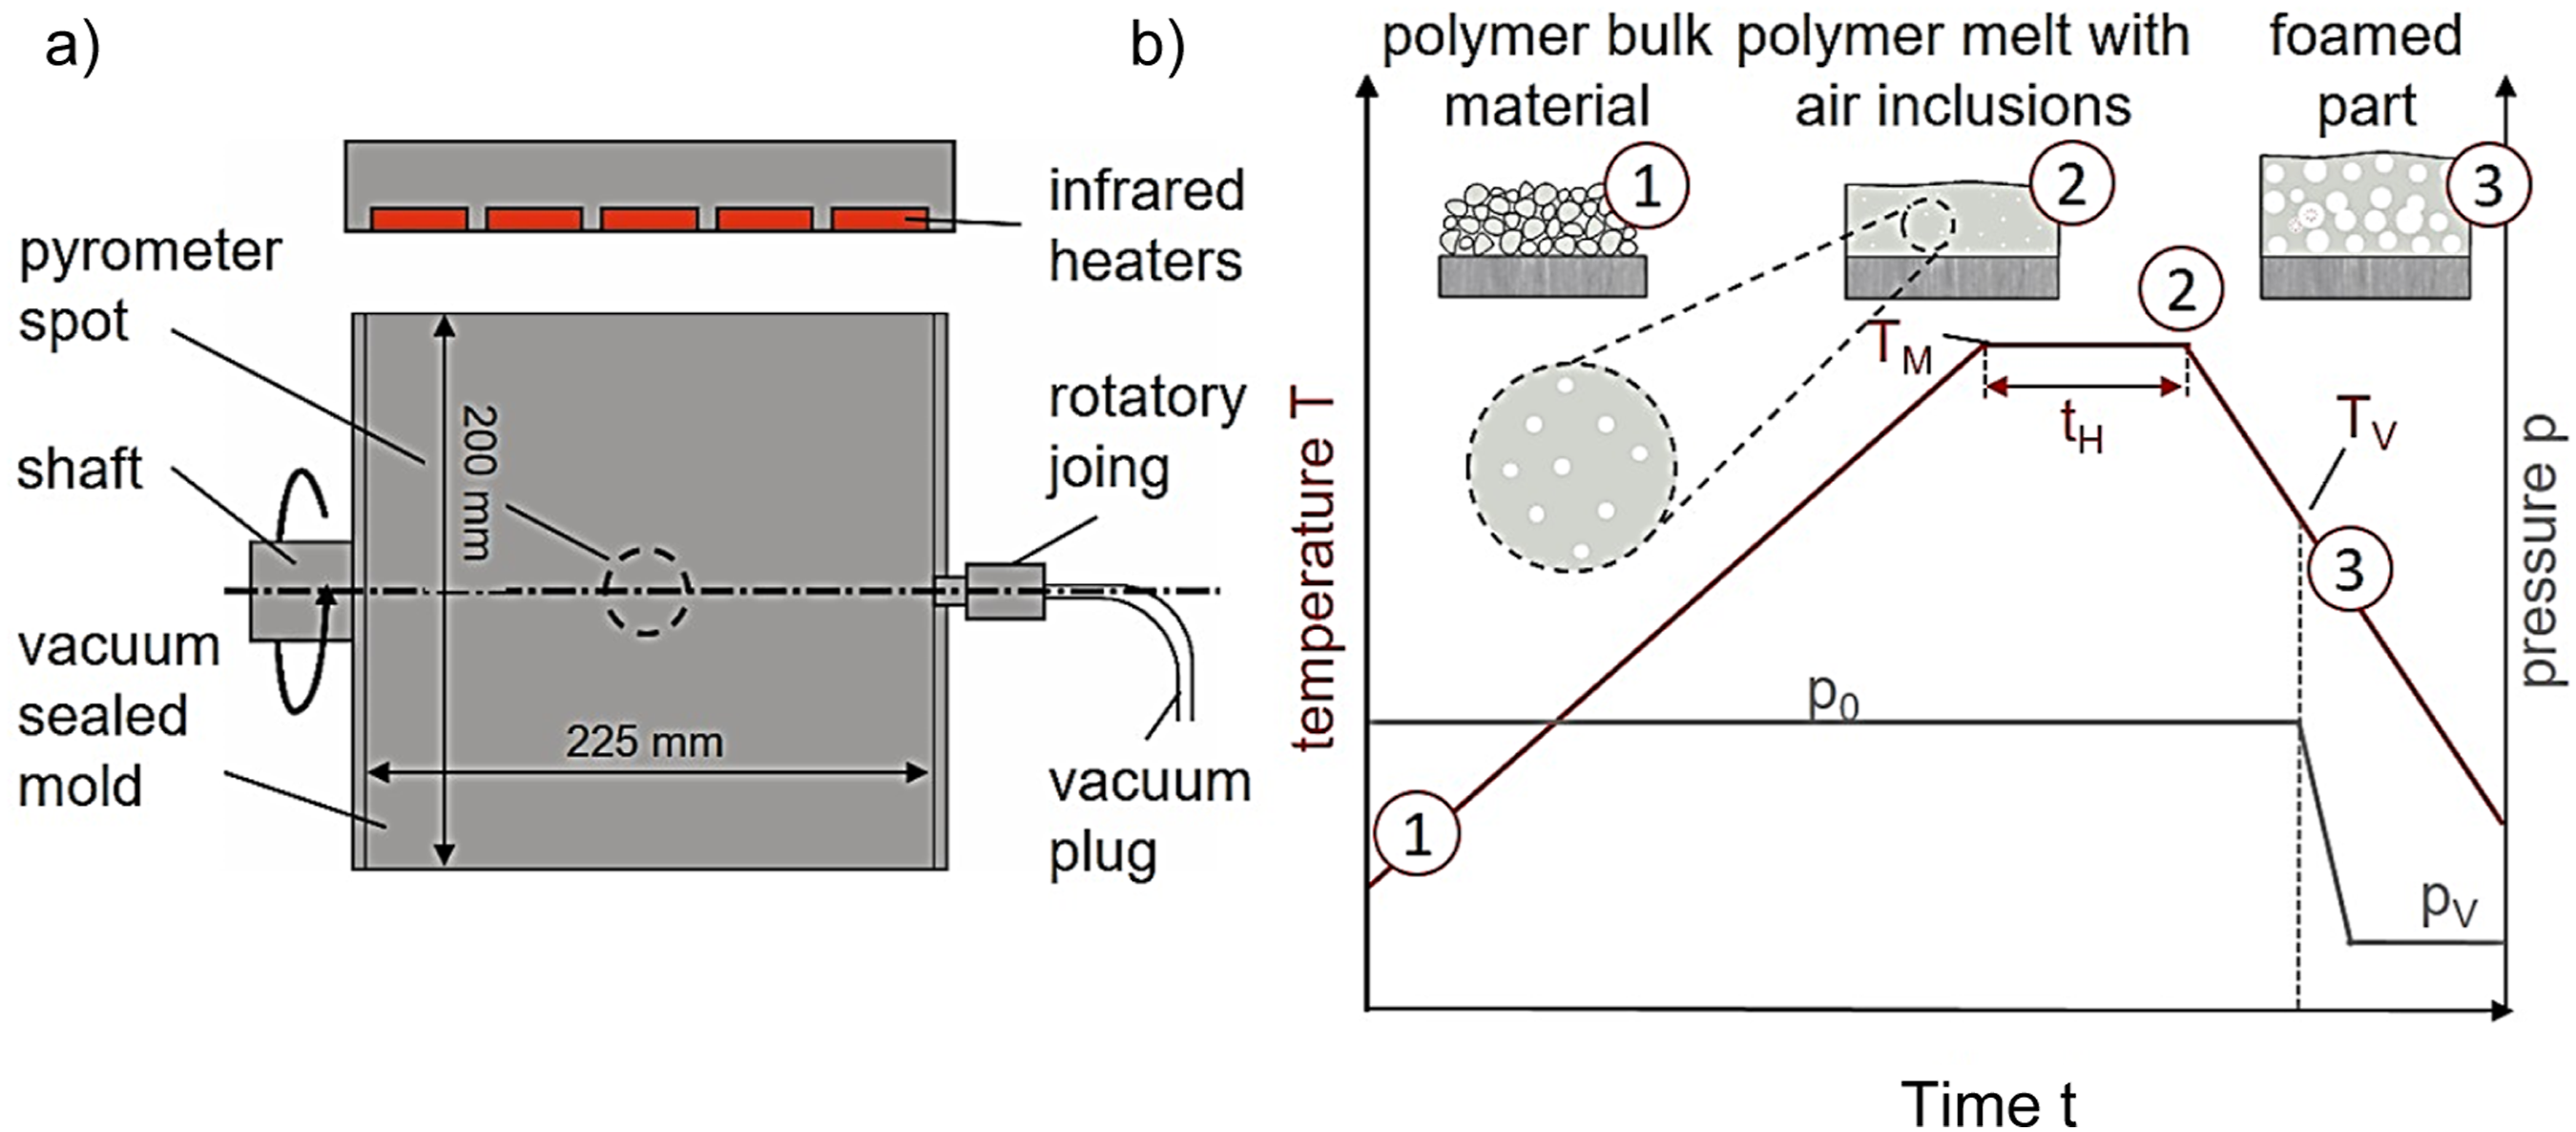
During the rotational molding tests, a vacuum-compatible rotary joint enabled vacuum application to the mold, which was evacuated using a Plastex R5 LAB vacuum pump from Dr.-Ing. K. Busch GmbH (Maulburg, Germany). Pressure was monitored with a bourdon-tube gauge. The mold was heated using infrared radiation, and its outer surface was coated in black to improve heat absorption from the infrared sources. Cooling followed with compressed air. For temperature monitoring, a pyrometer of the model IN 4000 from Optron GmbH (Garbsen, Germany) measured the mold’s exterior temperature, while internal temperatures were taken via type K thermocouples. Three thermocouple sensors, positioned at 52.5 mm, 112.5 mm, and 172.6 mm from the mold’s opening, provided inner mold surface readings in replicated trials (n = 3) using identical parameters to those in the specimen production tests.
Rotational molding process parameters.

aThermocouple measurements type K.
Characterization methods
Material characterization
Moisture analysis was done by a moisture-analysis system of the type HydroTracer HT3 by aboni GmbH (Schwielowsee, Germany). The HT3 has been specifically designed to meet the requirements of processors and enables precise measurement of trace moisture down to single-digit ppm levels. The measurements were carried out with sample weights of approximately 4 g at a measurement temperature of 150°C.
Differential scanning calorimetry (DSC) measurements were conducted using a calorimeter of the type Q 2000 of TA instruments (New Castle, Delaware, USA) to examine the melting behavior of the materials, which plays a critical role in correlating with the timing of moisture release. The results are presented based on the second heating cycle, conducted according to DIN EN ISO 11357 with constant heating and cooling rates of 10 K min−1 under nitrogen atmosphere.
In-situ FTIR spectroscopy was employed to investigate hydrogen bonding as a function of temperature. A Rheonaut system, which combines a rheometer with an FTIR module, was used to conduct the measurements at varying temperature levels. This system allows for precise temperature control and enables the analysis of hydrogen bond dynamics under thermal conditions. In the FTIR technique, an infrared beam is directed through a crystal onto the sample surface to generate attenuated total reflection, which is then analyzed using a deuterated triglycine sulfate (DTGS) detector. The FTIR absorption measurements were recorded with a spectral resolution of 4 cm−1, using six repeat scans over the range of 4000–600 cm−1. The sample was initially measured at room temperature, and then heated from 40°C to 240°C in 20°C intervals. At each temperature stage, the sample was held for 3 min, with a heating rate of 5°C/min between each step. These measurements provided valuable insights into the thermal stability and the breaking of hydrogen bonds as the temperature increased.
Component characterization
The density of the samples was determined according to EN ISO 845. The volume was determined by measuring the specimen dimensions according to ISO 1923 using an outside micrometer with a measuring diameter of 5 mm for thickness determination and a caliper gauge for length determination. Therefore, specimens with a side length of 100 mm in the direction of the axis of rotation and an arc length of 105 mm in the direction of rotation were prepared from the middle the cilindrical rotational molding components. The specimens extraction position is shown in Figure 4. Specimen preparation for microscopy, density and computed tomography measurements.
For the quantitative and optical evaluation of the resulting cell structures, additional computed tomography (CT) analyses were conducted on specimens with a square surface measuring approximately 20 × 20 mm2, Figure 4. These dimensions represent the maximum size at which sufficient image accuracy and sharpness can still be ensured during CT scanning. However, for the analysis of cell structures, the evaluation area was standardized to a consistent 8 × 8 mm surface to allow for comparable results across samples. Despite this limitation on the evaluation surface, the entire sample thickness was visualized, enabling a comprehensive spatial analysis of the cell structure. The analysis was performed using a subµCT system from Fraunhofer EZRT (Fuerth, Germany) with the following measurement parameters: 80 kV voltage, 100 mA current, 800 ms exposure time, 1200 projections, and a voxel size of 6.6 µm. From the CT data, the mean cell diameter was calculated using the MAVI software developed by Fraunhofer ITWM (Kaiserslautern, Germany). For each cell, the diameter was defined as that of a perfect sphere with the same volume as the corresponding cell.
Results and discussion
Effects on water on unfoamed samples
To analyse the effect of water within the material on the foaming process the initial test conditions of the raw material in terms of present water content were measured. The TPU E 1180 A powder that was dried for 10 h showed a water content of 0.11 ± 0.01%, whereas the E 1154 D material that underwent the same 10 h drying process showed a water content of 0.19 ± 0.02%. The non-dried samples, which will be referred to as humid within the course of the manuscript, showed similar water contents of 0,63 ± 0,02 % for E 1180 A and 0,62 ± 0,02 % for E 1154 D.
A pore analysis of non-foamed samples using computed tomography will illustrate the influence of the water content. In vacuum-assisted foaming, the air inclusions present prior to the foaming process serve as the initial conditions for the resulting foam. By looking at the unfoamed samples prior to examining the foamed samples, the influence of the water content in the raw material can be analysed isolated from the influence of the vacuum pressure. Also given that the subsequent foaming process leads to increased cell connections and cell collapse, it is preferable to demonstrate the impact of water content via the boosted amount of pores within the non-foamed samples. The effect that arises with the included foaming process will also be presented later in the manuscript, thereby clarifying the overall effects of water on the foamed specimens. The boxplot, depicted to give an overview over the pore sizes within the evaluated sample section, shows no significant differences in pore dimensions for the E 1180 A, comparing the unconditioned and dried samples, Figure 5. Meanwhile for E 1154 D there is a dimensional shift towards higher pore sizes as shown by the shift of the boxplot towards higher CE-diameters. This phenomenon can also be observed in the 3D computed tomography scans, Figure 6. The 3D model also shows very clearly the increase in the number of air inclusions with higher water content. As the base number of air inclusions is inherently higher for E 1154 D in comparison to E 1180 A, independent of the water content, a porosity amplification factor pA was derived. It is calculated by dividing the mean porosity value of the unfoamed samples by the mean porosity value of the dried samples and shall serve to provide a comparative measure to better account for the differing baseline levels and clarify the impact of moisture on the increase in air inclusions for both materials: ΦA = porosity amplification factor ΦD = Porosity of the dried samples ΦH = Porosity of the humid samples Computed tomography analysis of pore dimensions as a function of material classification and its pre-processing material conditioning (a): the powder was dried for 10 h at 80°C in a dry air oven before processing; (b): the powder was stored under standardized conditions at 50 % relative humidity at 23°C for 24 h before processing). Comparison of dry and ambient material conditioning prior to foaming based on computed tomography images of non-foamed rotationally molded samples (square prism with 8 mm side length, serving as size reference; inverted representation: pores as solid structures; polymer matrix as void space).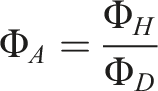
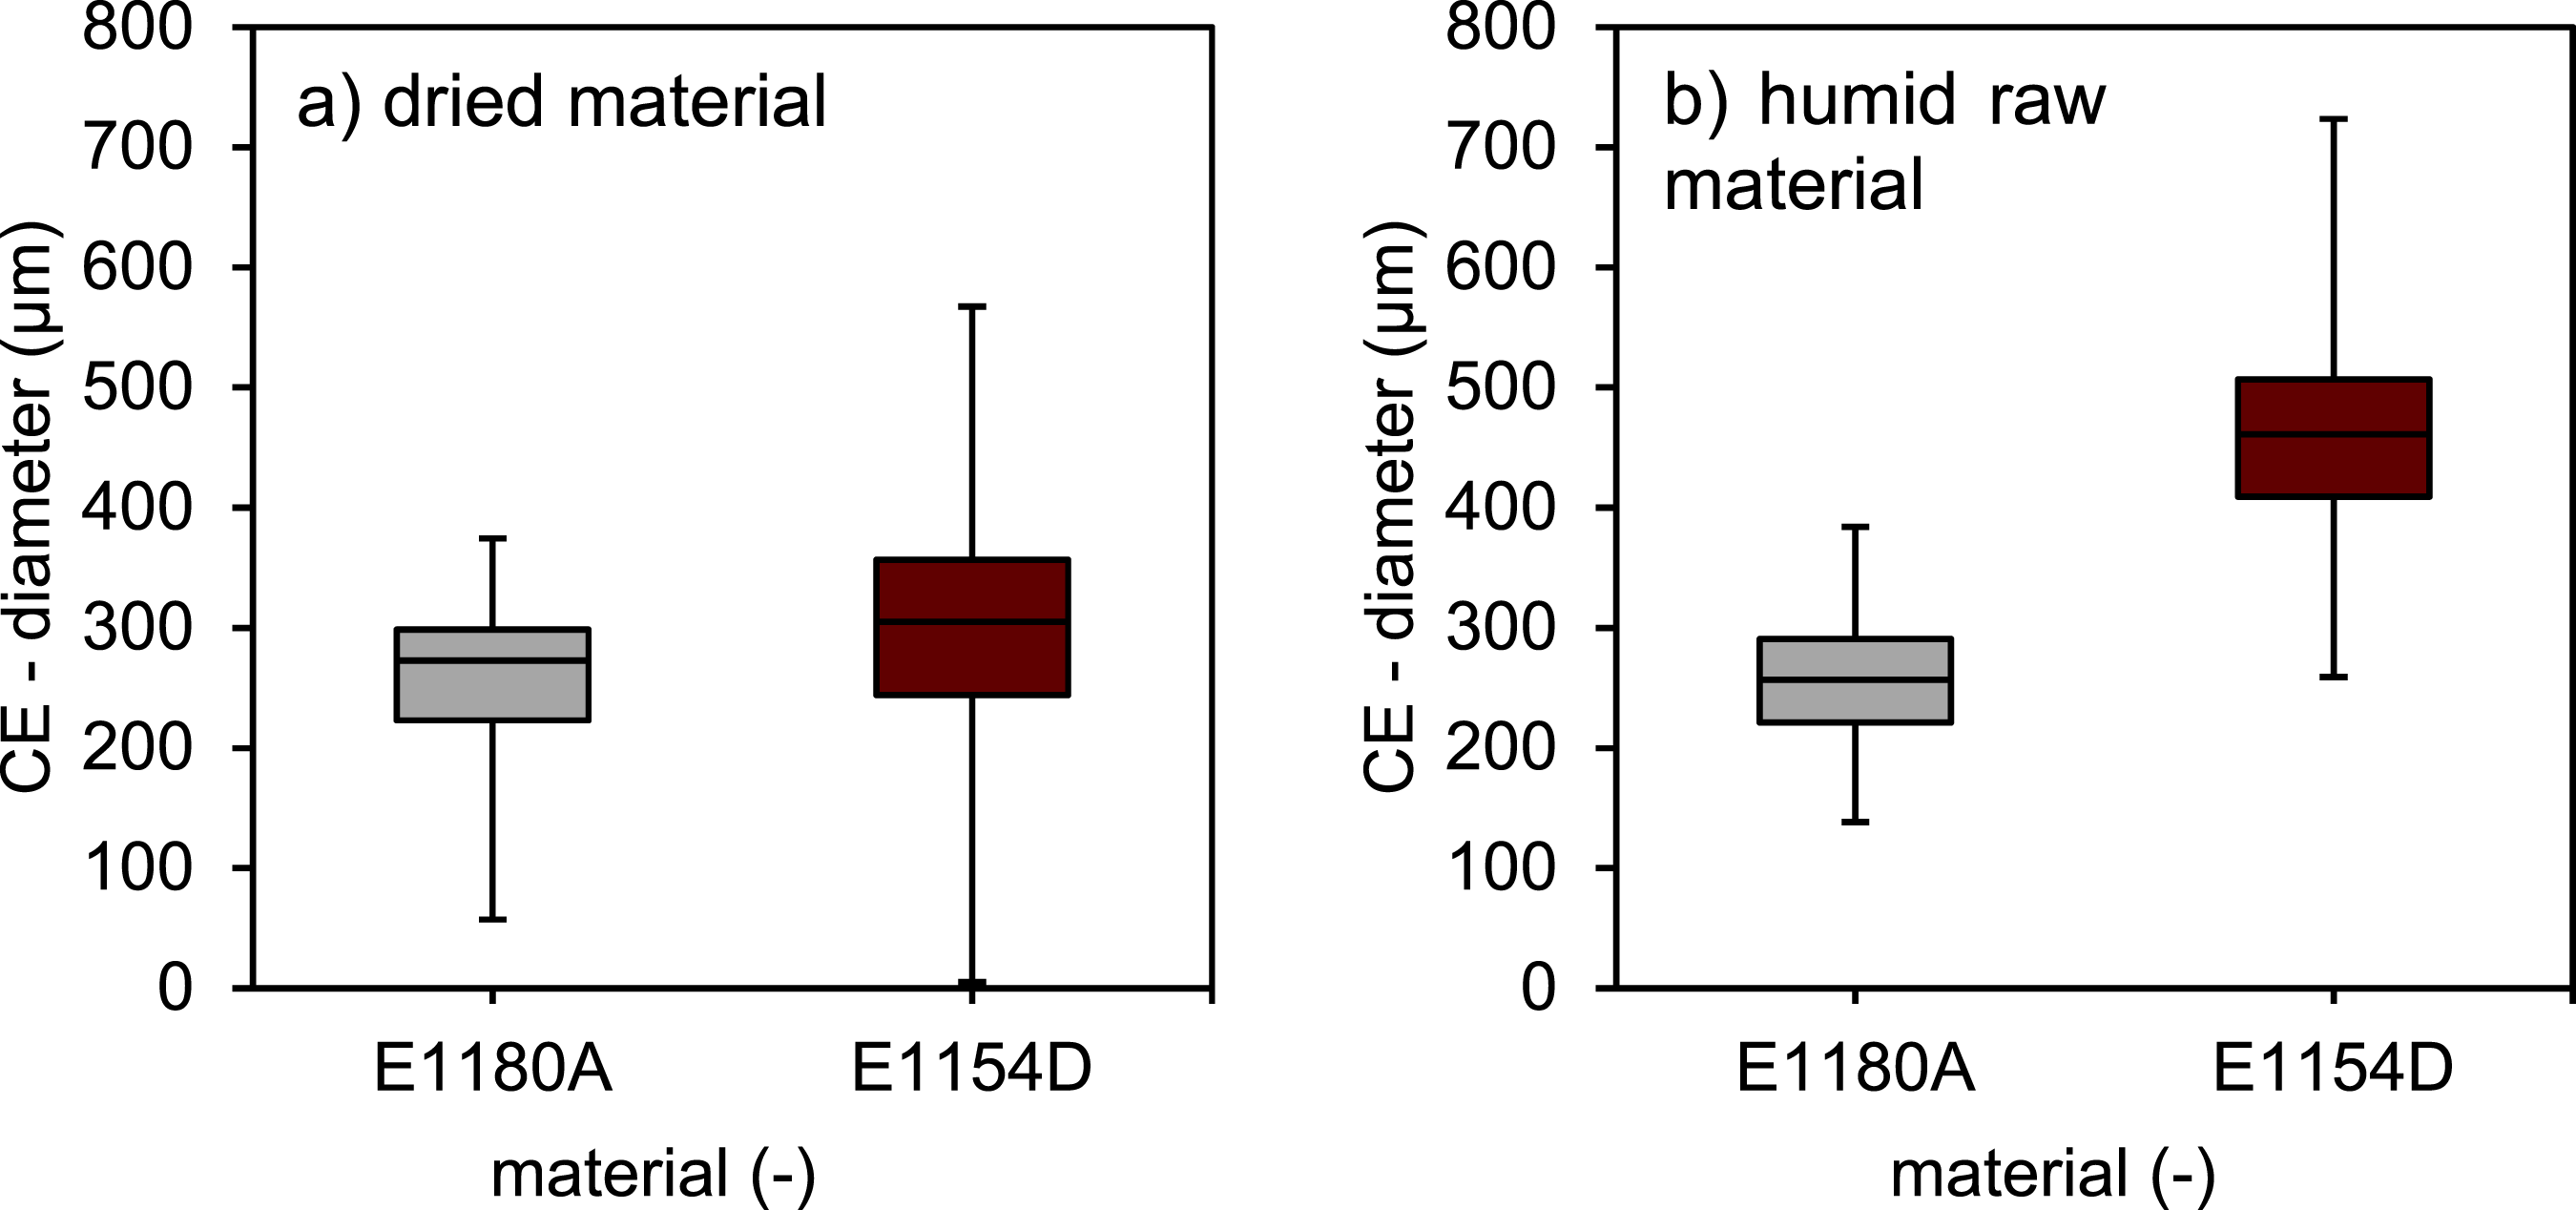
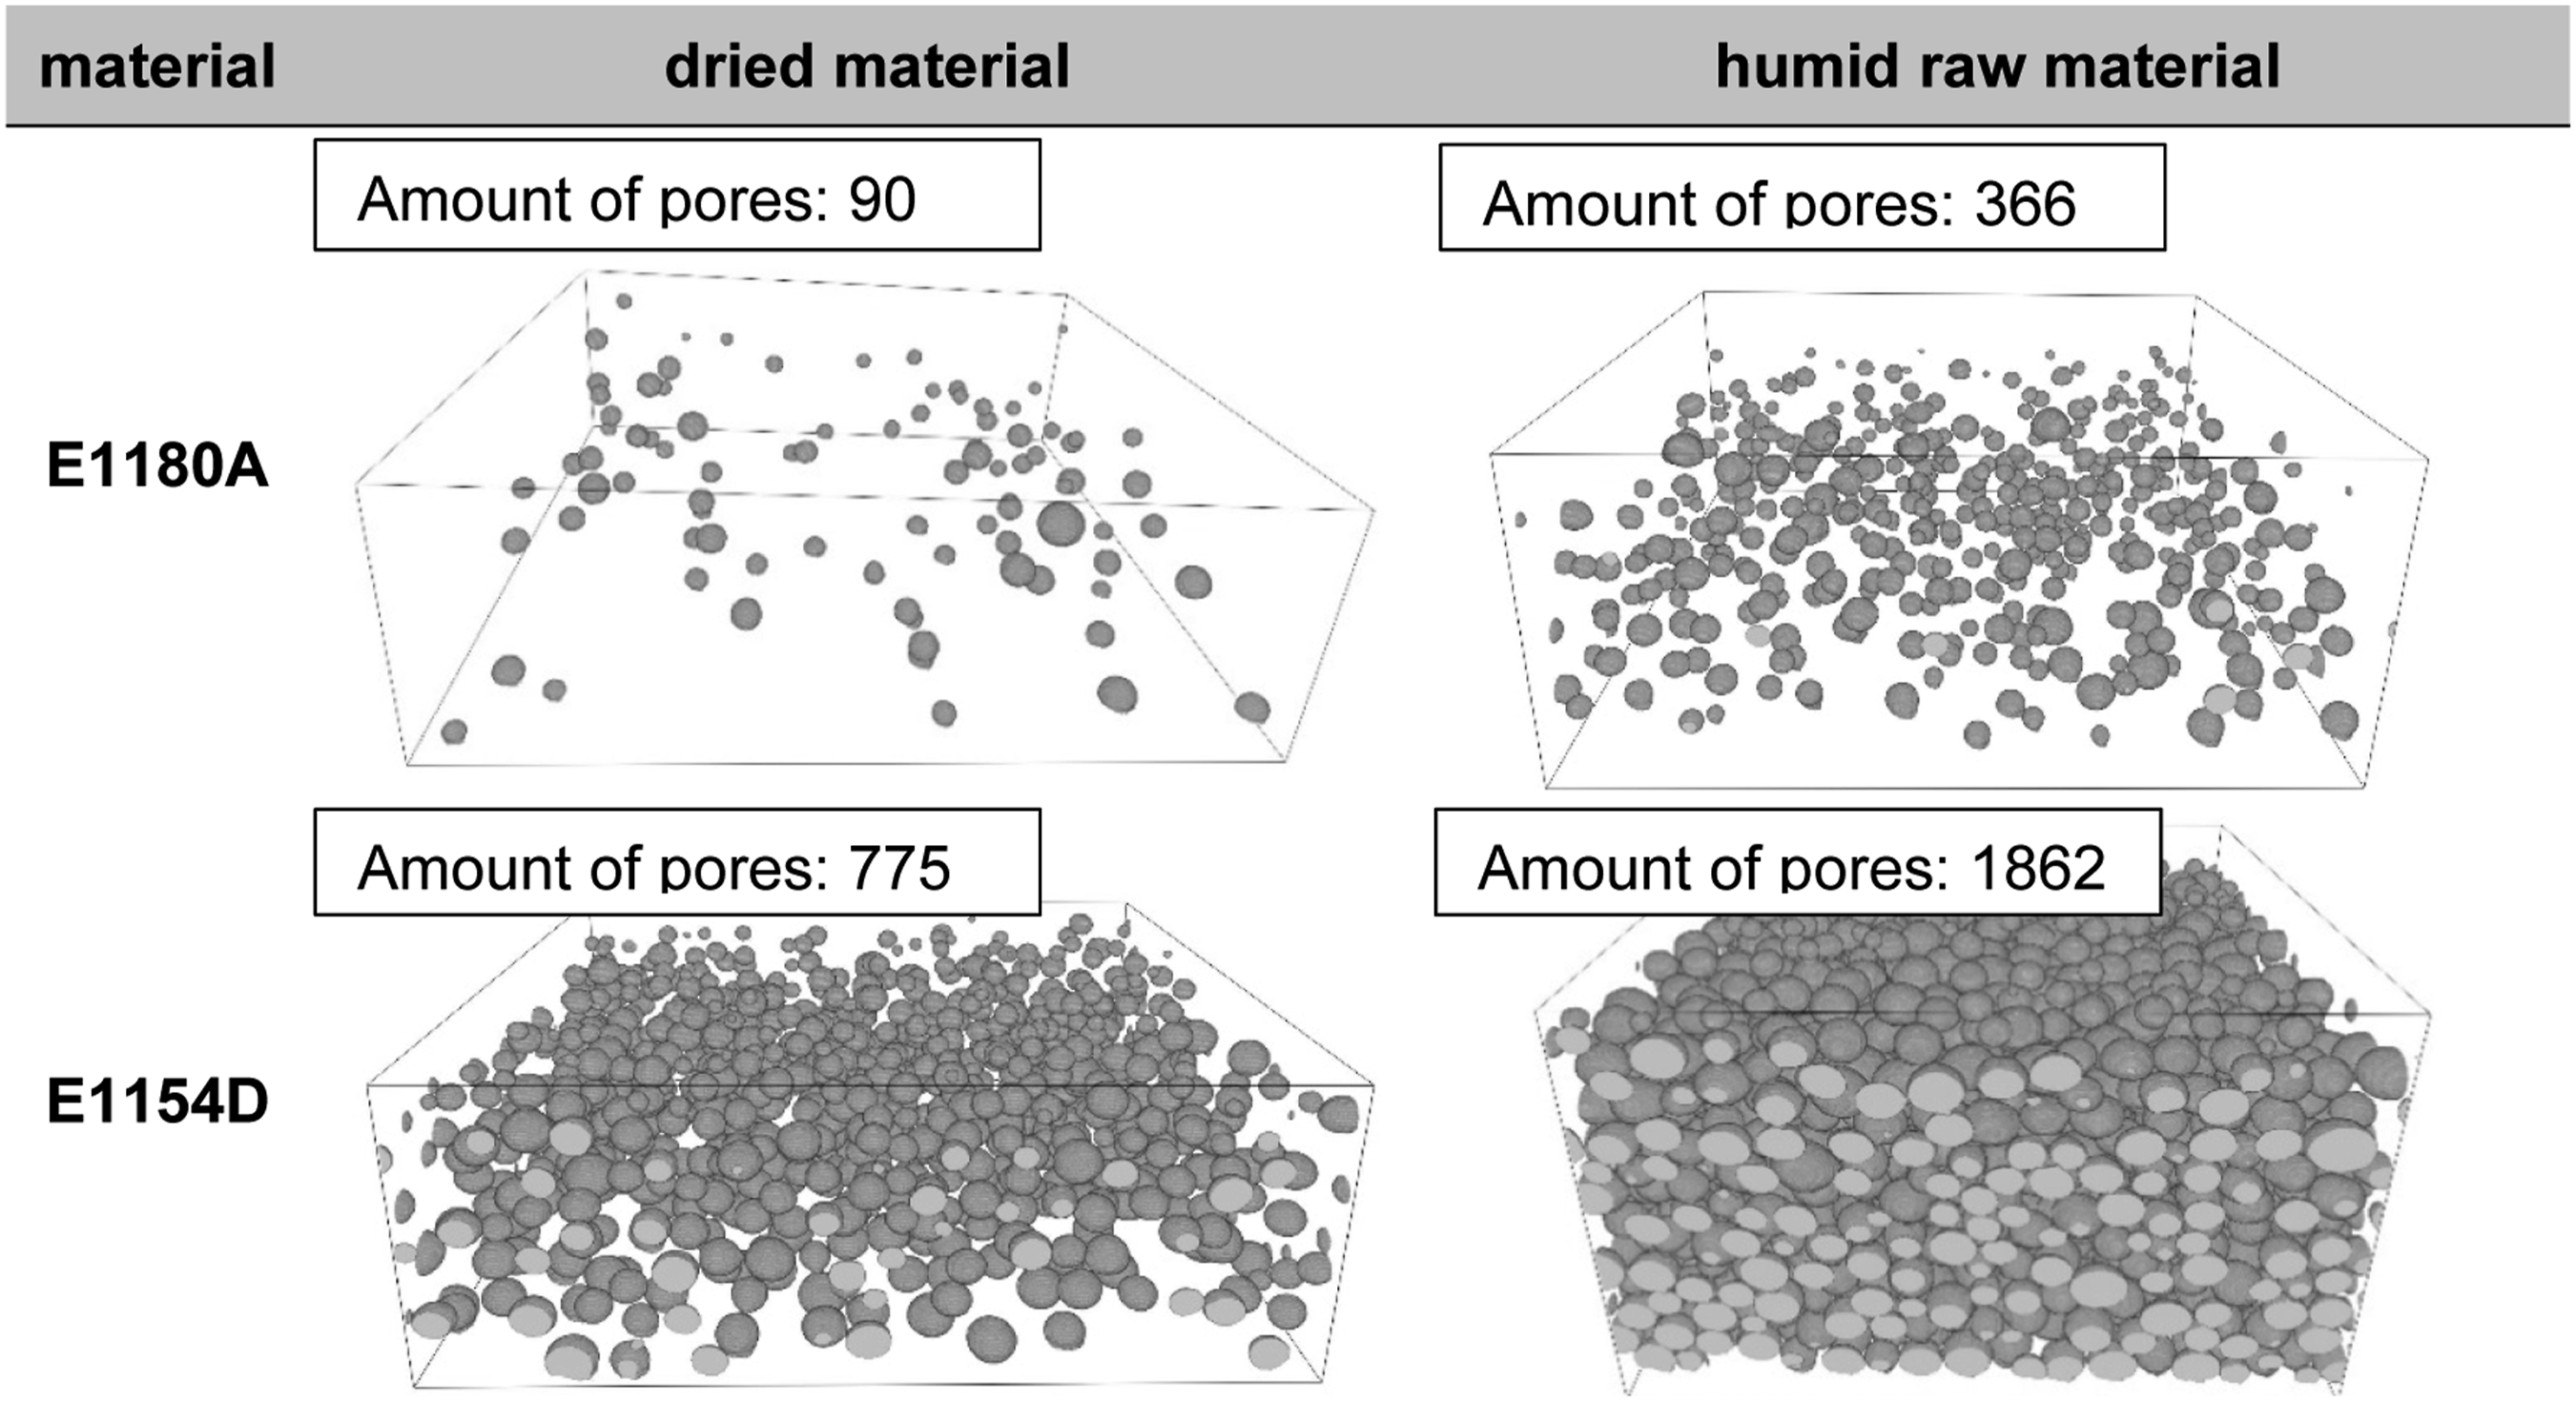
Figure 7 shows porosity values which were derived from density measurements of the unfoamed samples. For E 1180 A, the humid samples exhibit a slightly higher porosity of 3.9% compared to 2.6% for components produced with dried material, resulting in a porosity amplification factor of 1.5. In contrast, E 1154 D demonstrates a significantly higher porosity, with 15.6% for the dried material and 44.8% for the humid raw material, leading to a porosity amplification factor of 2.3. However, due to the considerable combined standard deviation in the porosity amplification factor, while a clear trend toward higher amplification factors in materials with a higher proportion of hard segments is observed, this trend does not reach statistical significance. Porosity values of unfoamed samples as a function of the material type and as a function of the material conditioning and derived porosity amplification factors.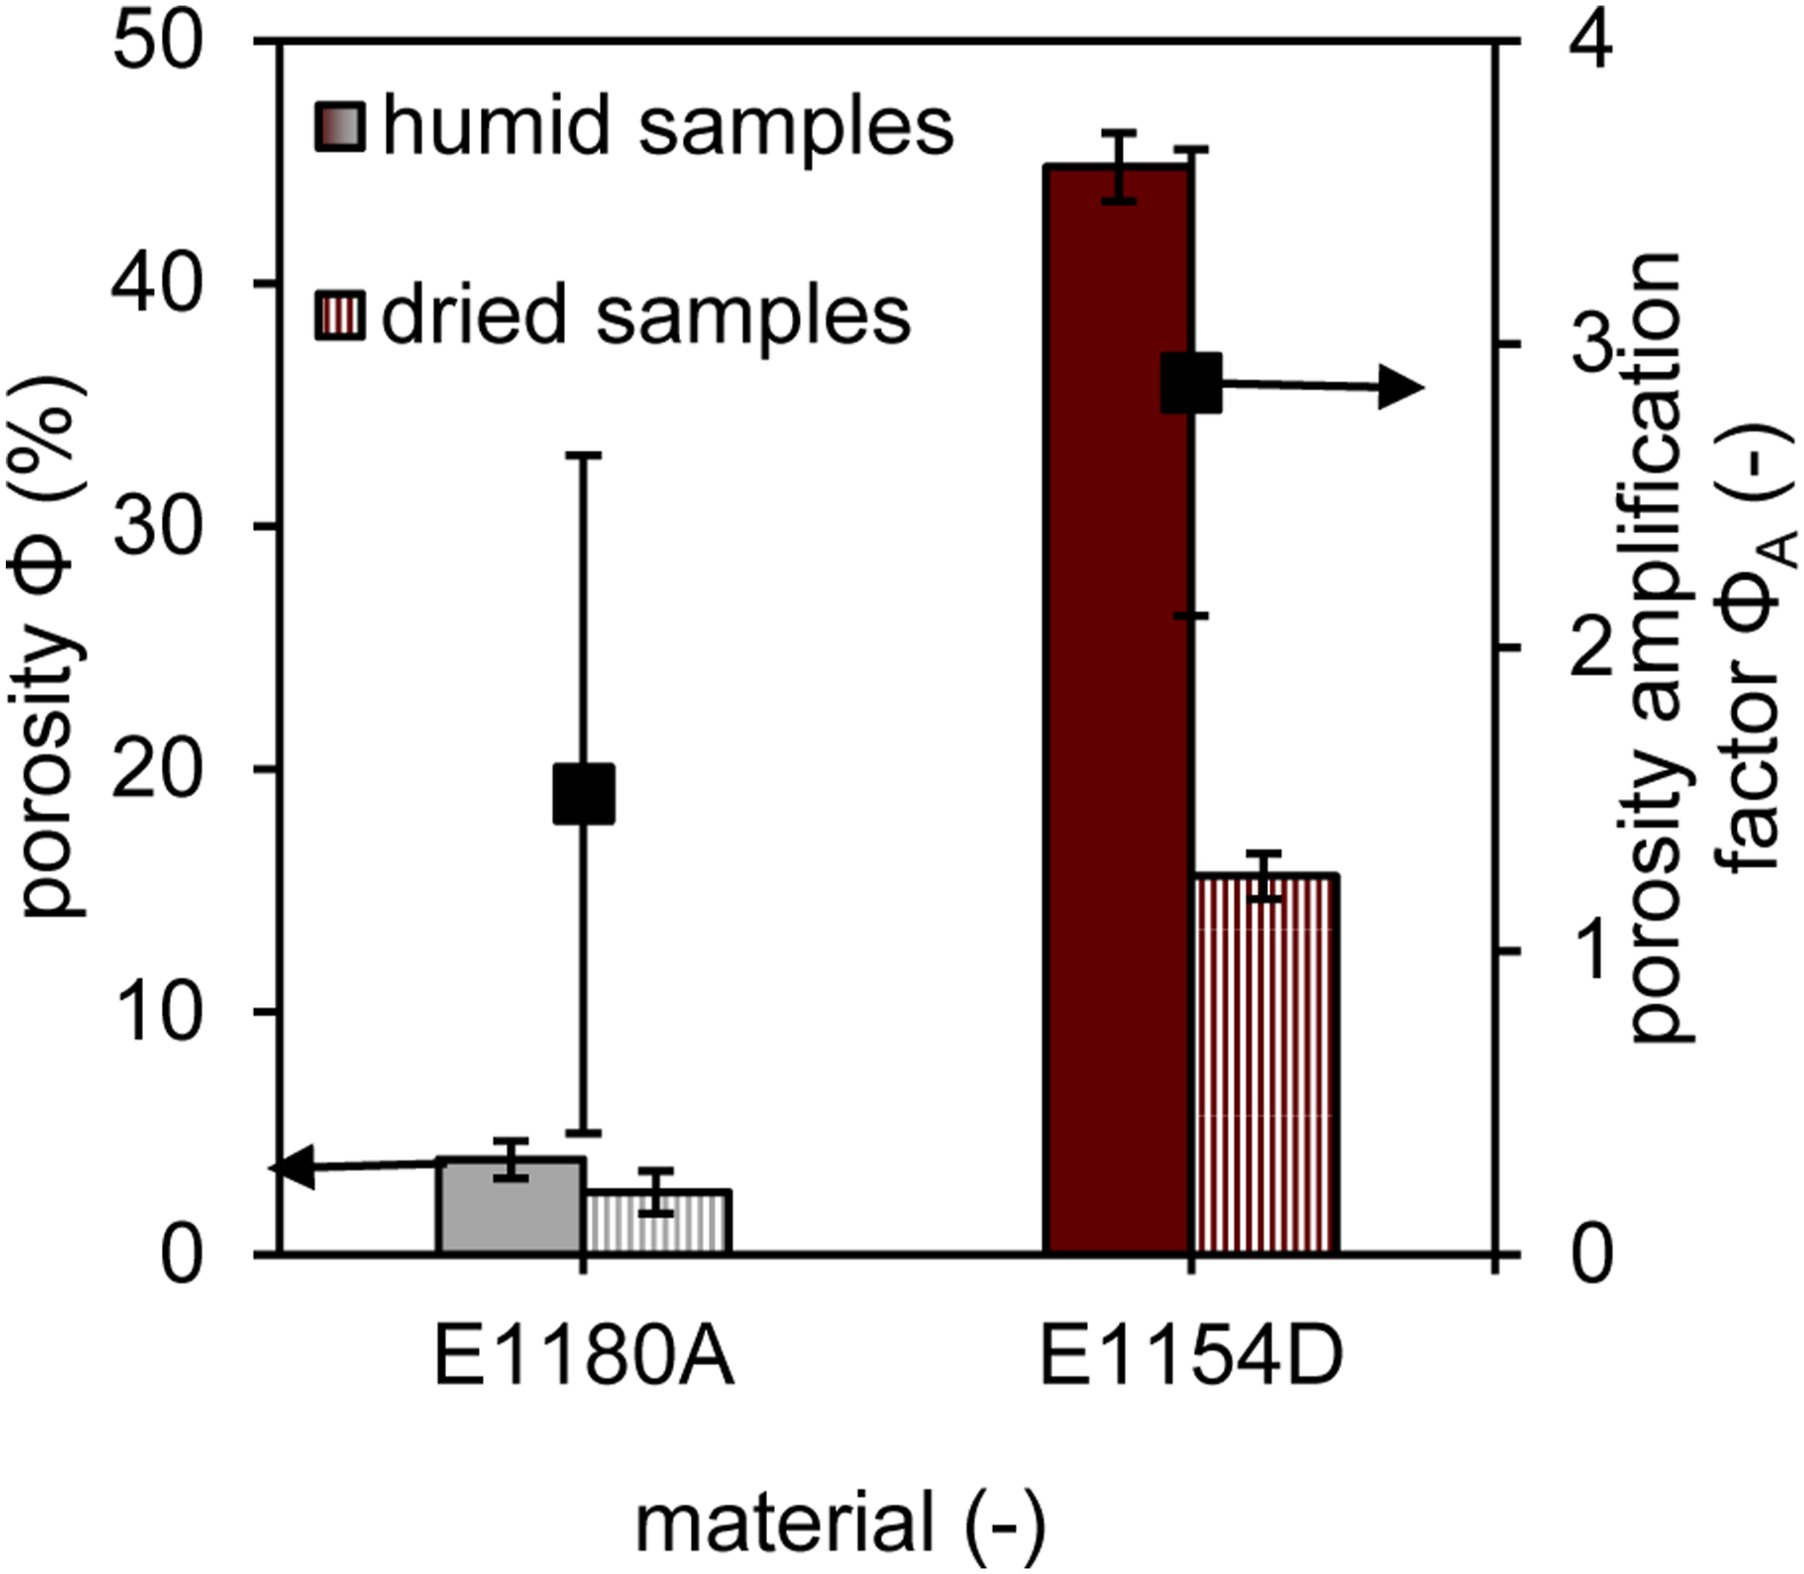
It becomes evident from the 3D CT images that the additional air inclusions formed due to moisture do not significantly differ from those created by sintering processes. The quantitative analysis further highlights that moisture content has a pronounced effect on the porosity of TPUs, with E 1154 D showing a more substantial increase in porosity when exposed to higher water content. To understand why E 1154 D is more affected by moisture, a detailed analysis of the material properties is necessary.
Results of the material characterization
To get a deeper understanding of the material behavior which ultimately leads to the shown effects of water on the bubble formation the materials were characterized with respect to their water absorption behavior respectively its desorption behavior. Figure 8 shows the water content of the materials under saturated conditions after being stored at 50% relative humidity for more than 24 h, allowing the material to reach equilibrium. This results in water content values of 0,63 ± 0,02 % for E 1180 A and 0,62 ± 0,02 % for E 1154 D. Although showing similar values regarding the water absorption ability, which were identified as saturation points for the respective materials, the materials desorption behavior differs drastically. While E 1154 D shows a nearly linear decrease of moisture over time, until reaching an equilibrium at around 0,18 %, E 1180 A shows a rapid decline in moisture content with a moisture content of 0,28 %, measured half an hour after the beginning of the oven conditioning and then just dropping to slightly lower values over an extended oven time. The results indicate that the water is incorporated in different ways into the materials and different bonding mechanisms could be resulting in different desorption velocities. Desorption behavior of humid raw material samples under defined drying conditions.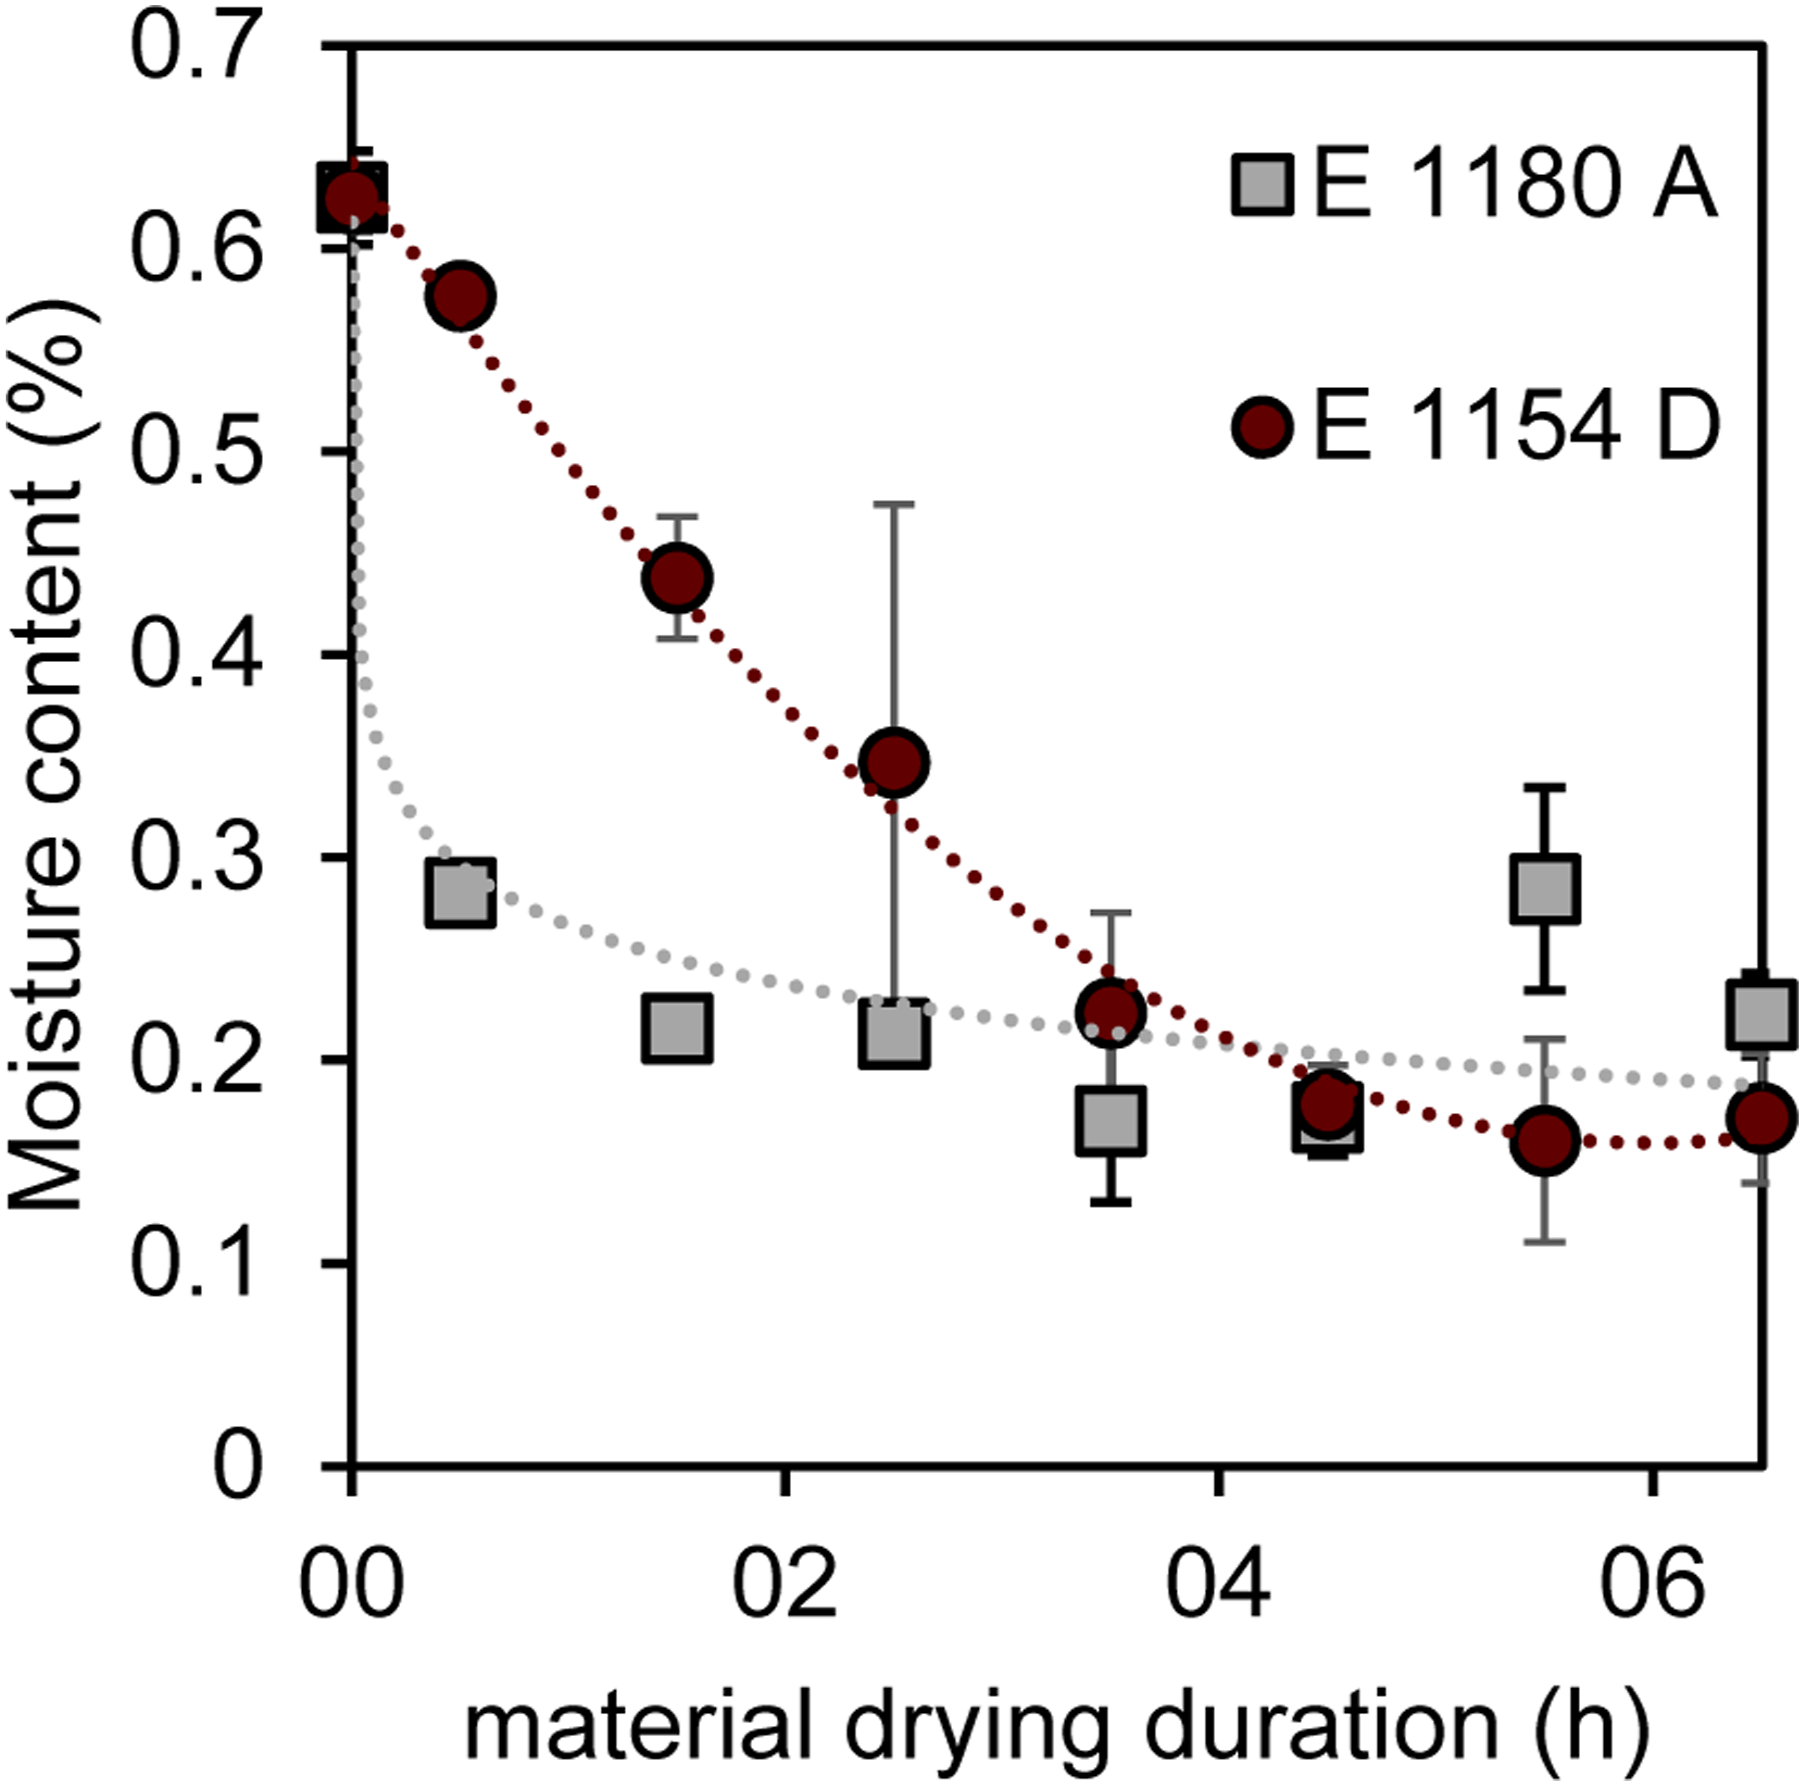
As water can only contribute to bubble formation in the vacuum-assisted rotational molding process once the material is in its molten state, a thermogravimetric analysis was performed to study the desorption behavior as a function of temperature. Heating rates inside the mold were determined in the interval between 100°C prior to melting onset and the maximum processing temperature, yielding average values of approximately 9.5 K/min for both materials. Therefore, a heating rate of 10 K/min was selected for the material characterization to closely reflect the processing conditions. Mass loss profiles revealed a continuous decline in weight for the humid E 1180 A, most likely contributed to water release, until reaching a temperature of approximately 240°C when decomposition of the material starts. For the dried pendant as well as for both E 1154 D variants a significant mass loss can only be detected starting at approximately 240°C, directly transitioning into the decomposition phase. The melting behavior of both materials, based on DSC analysis during the second heating cycle is shown in Figure 9. Constituting process near heating rates, the TGA results indicate that water desorption for E 1180 A begins significantly prior to melting whereas for E 1154 D the majority of the stored moisture will only start emanating from the material when being in its molten state, thus contributing to a higher bubble formation. Mass loss profile from thermogravimetric analysis (TGA) with a heating rate of 10 K/min (a) and differential scanning calorimetry (DSC) analysis (b).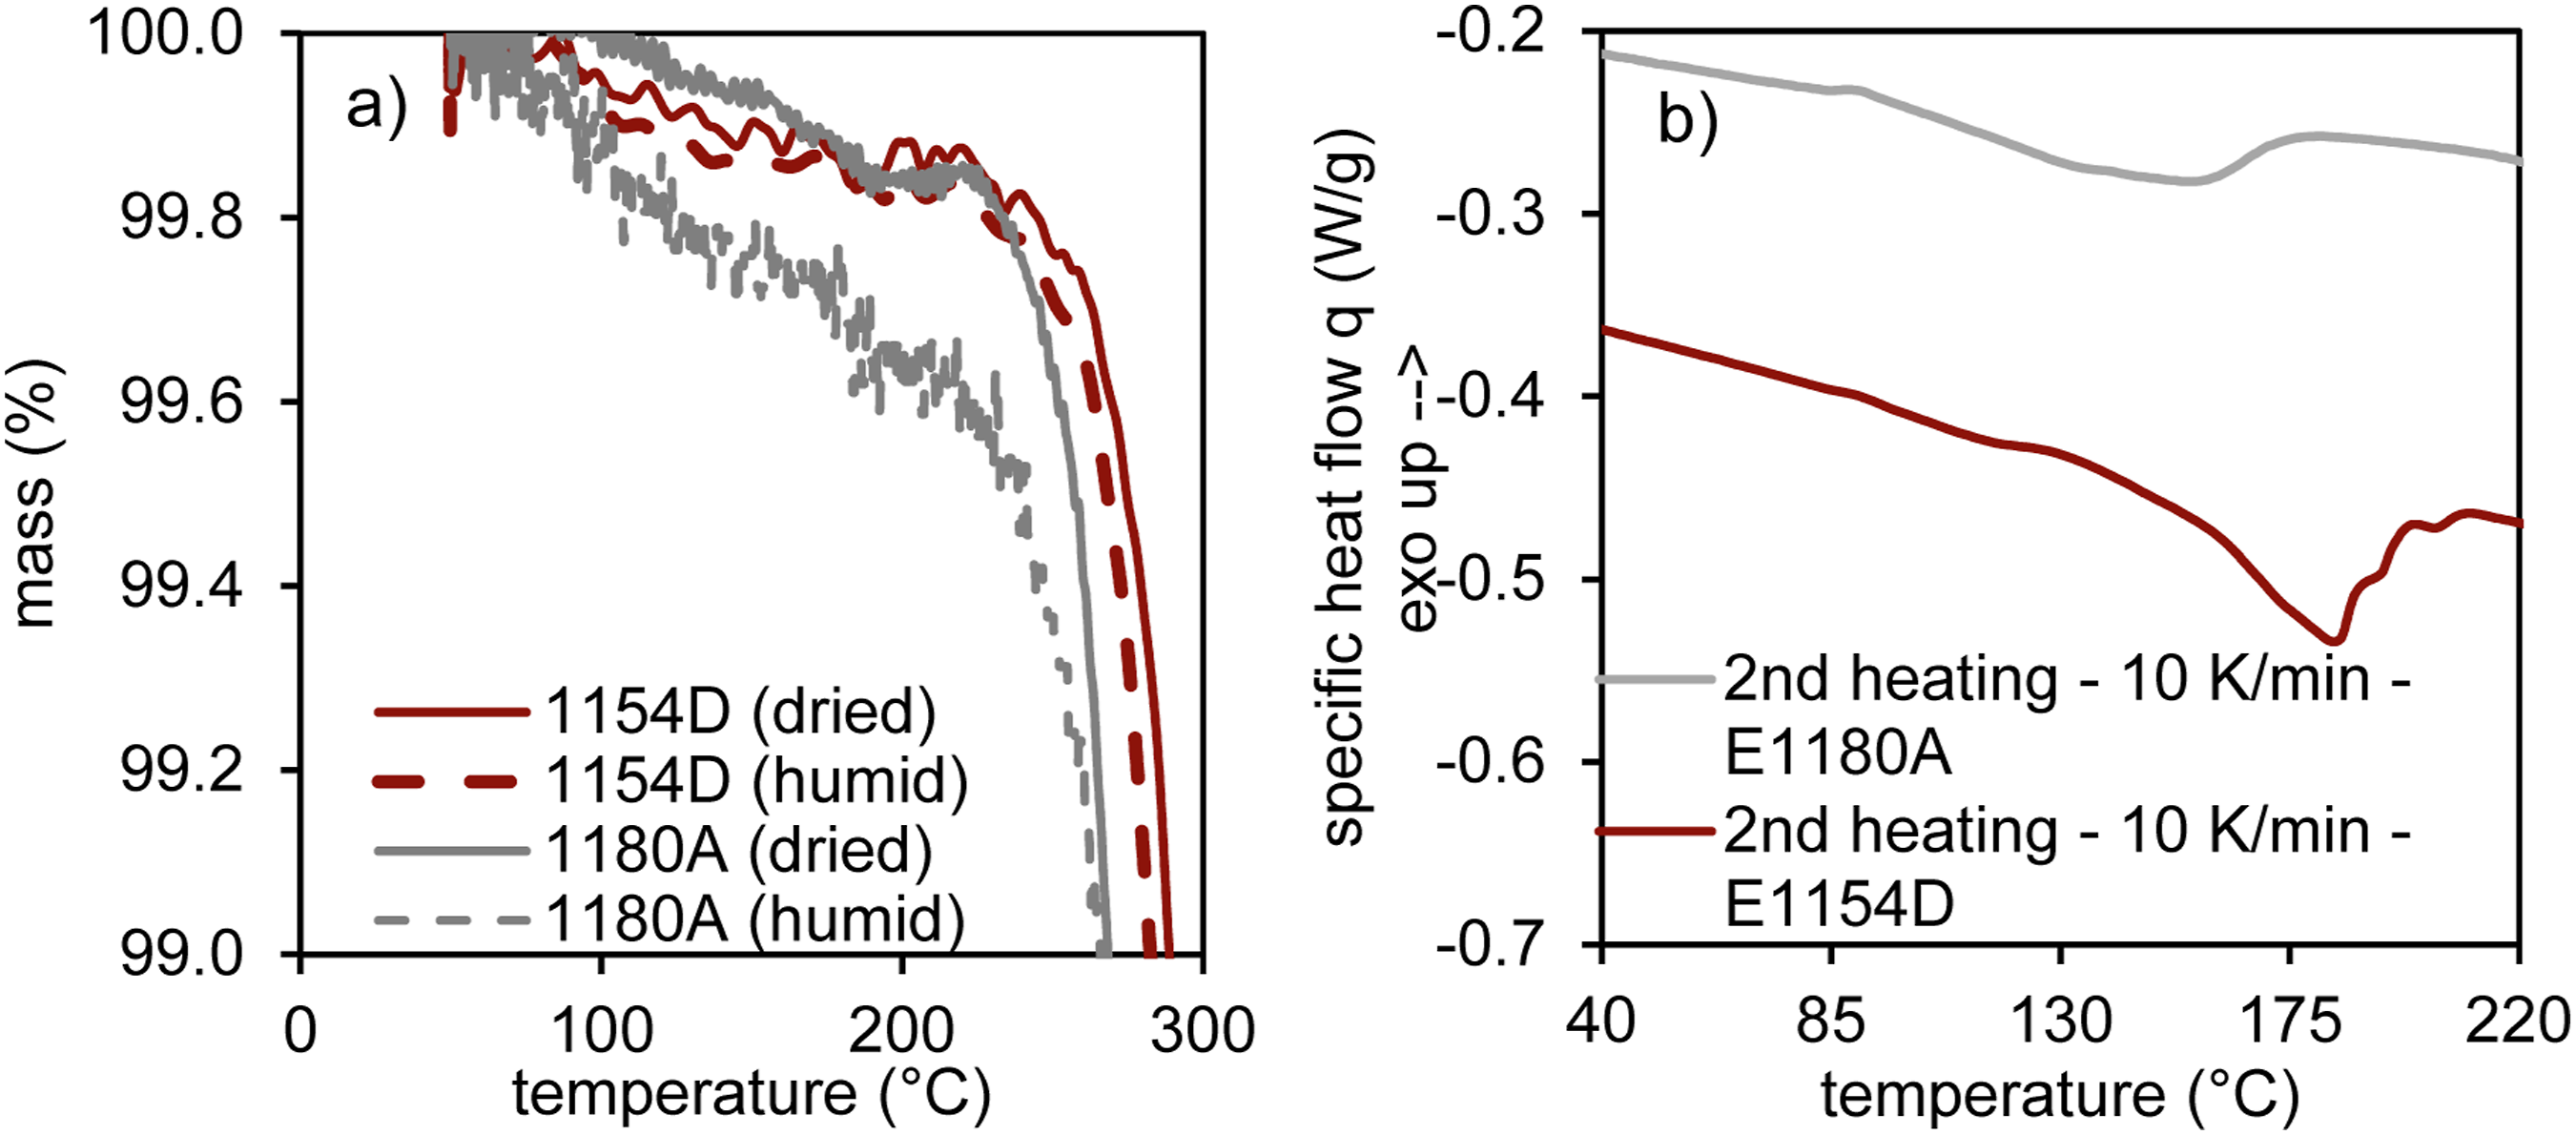
Based on the results, particularly the differing water release rates during the drying process, it can be concluded that water is incorporated or bound differently within the material. A slower moisture reduction in E 1154 D suggests a stronger binding of water molecules. The logarithmic curve progression in the water desorption curve of E 1180 A, see Figure 8, may indicate that water is incorporated into the molecular structure or material in a different way. To confirm this hypothesis, FTIR spectroscopy was further employed in the study to analyze hydrogen bonds and their disruption during the polymer melting process, aiming to gain insights into potential interactions with water. Figure 10 presents the full FTIR spectrum of both E 1154 D and E 1180 A under standard climatic conditions, showcasing the characteristic bands of TPU materials. The peaks at 3430 cm−1, 3332 cm−1, 1740 cm−1, and 1700 cm−1 are attributed to the hard segments of TPU. Specifically, the peak at 3430 cm−1 corresponds to the N-H stretching vibration of free N-H groups, while the peak at 3332 cm−1 is associated with the stretching vibration of N-H groups bonded via hydrogen bridges. The peak at 1740 cm−1 is assigned to the stretching vibration of free C = O groups, whereas the peak at 1700 cm−1 corresponds to the stretching vibration of C = O groups bound through hydrogen bonds. Changes in the peak ratios are closely linked, according to the literature, with the breaking of hydrogen bonds, which also correlates with the release of water molecules incorporated via hydrogen bonding.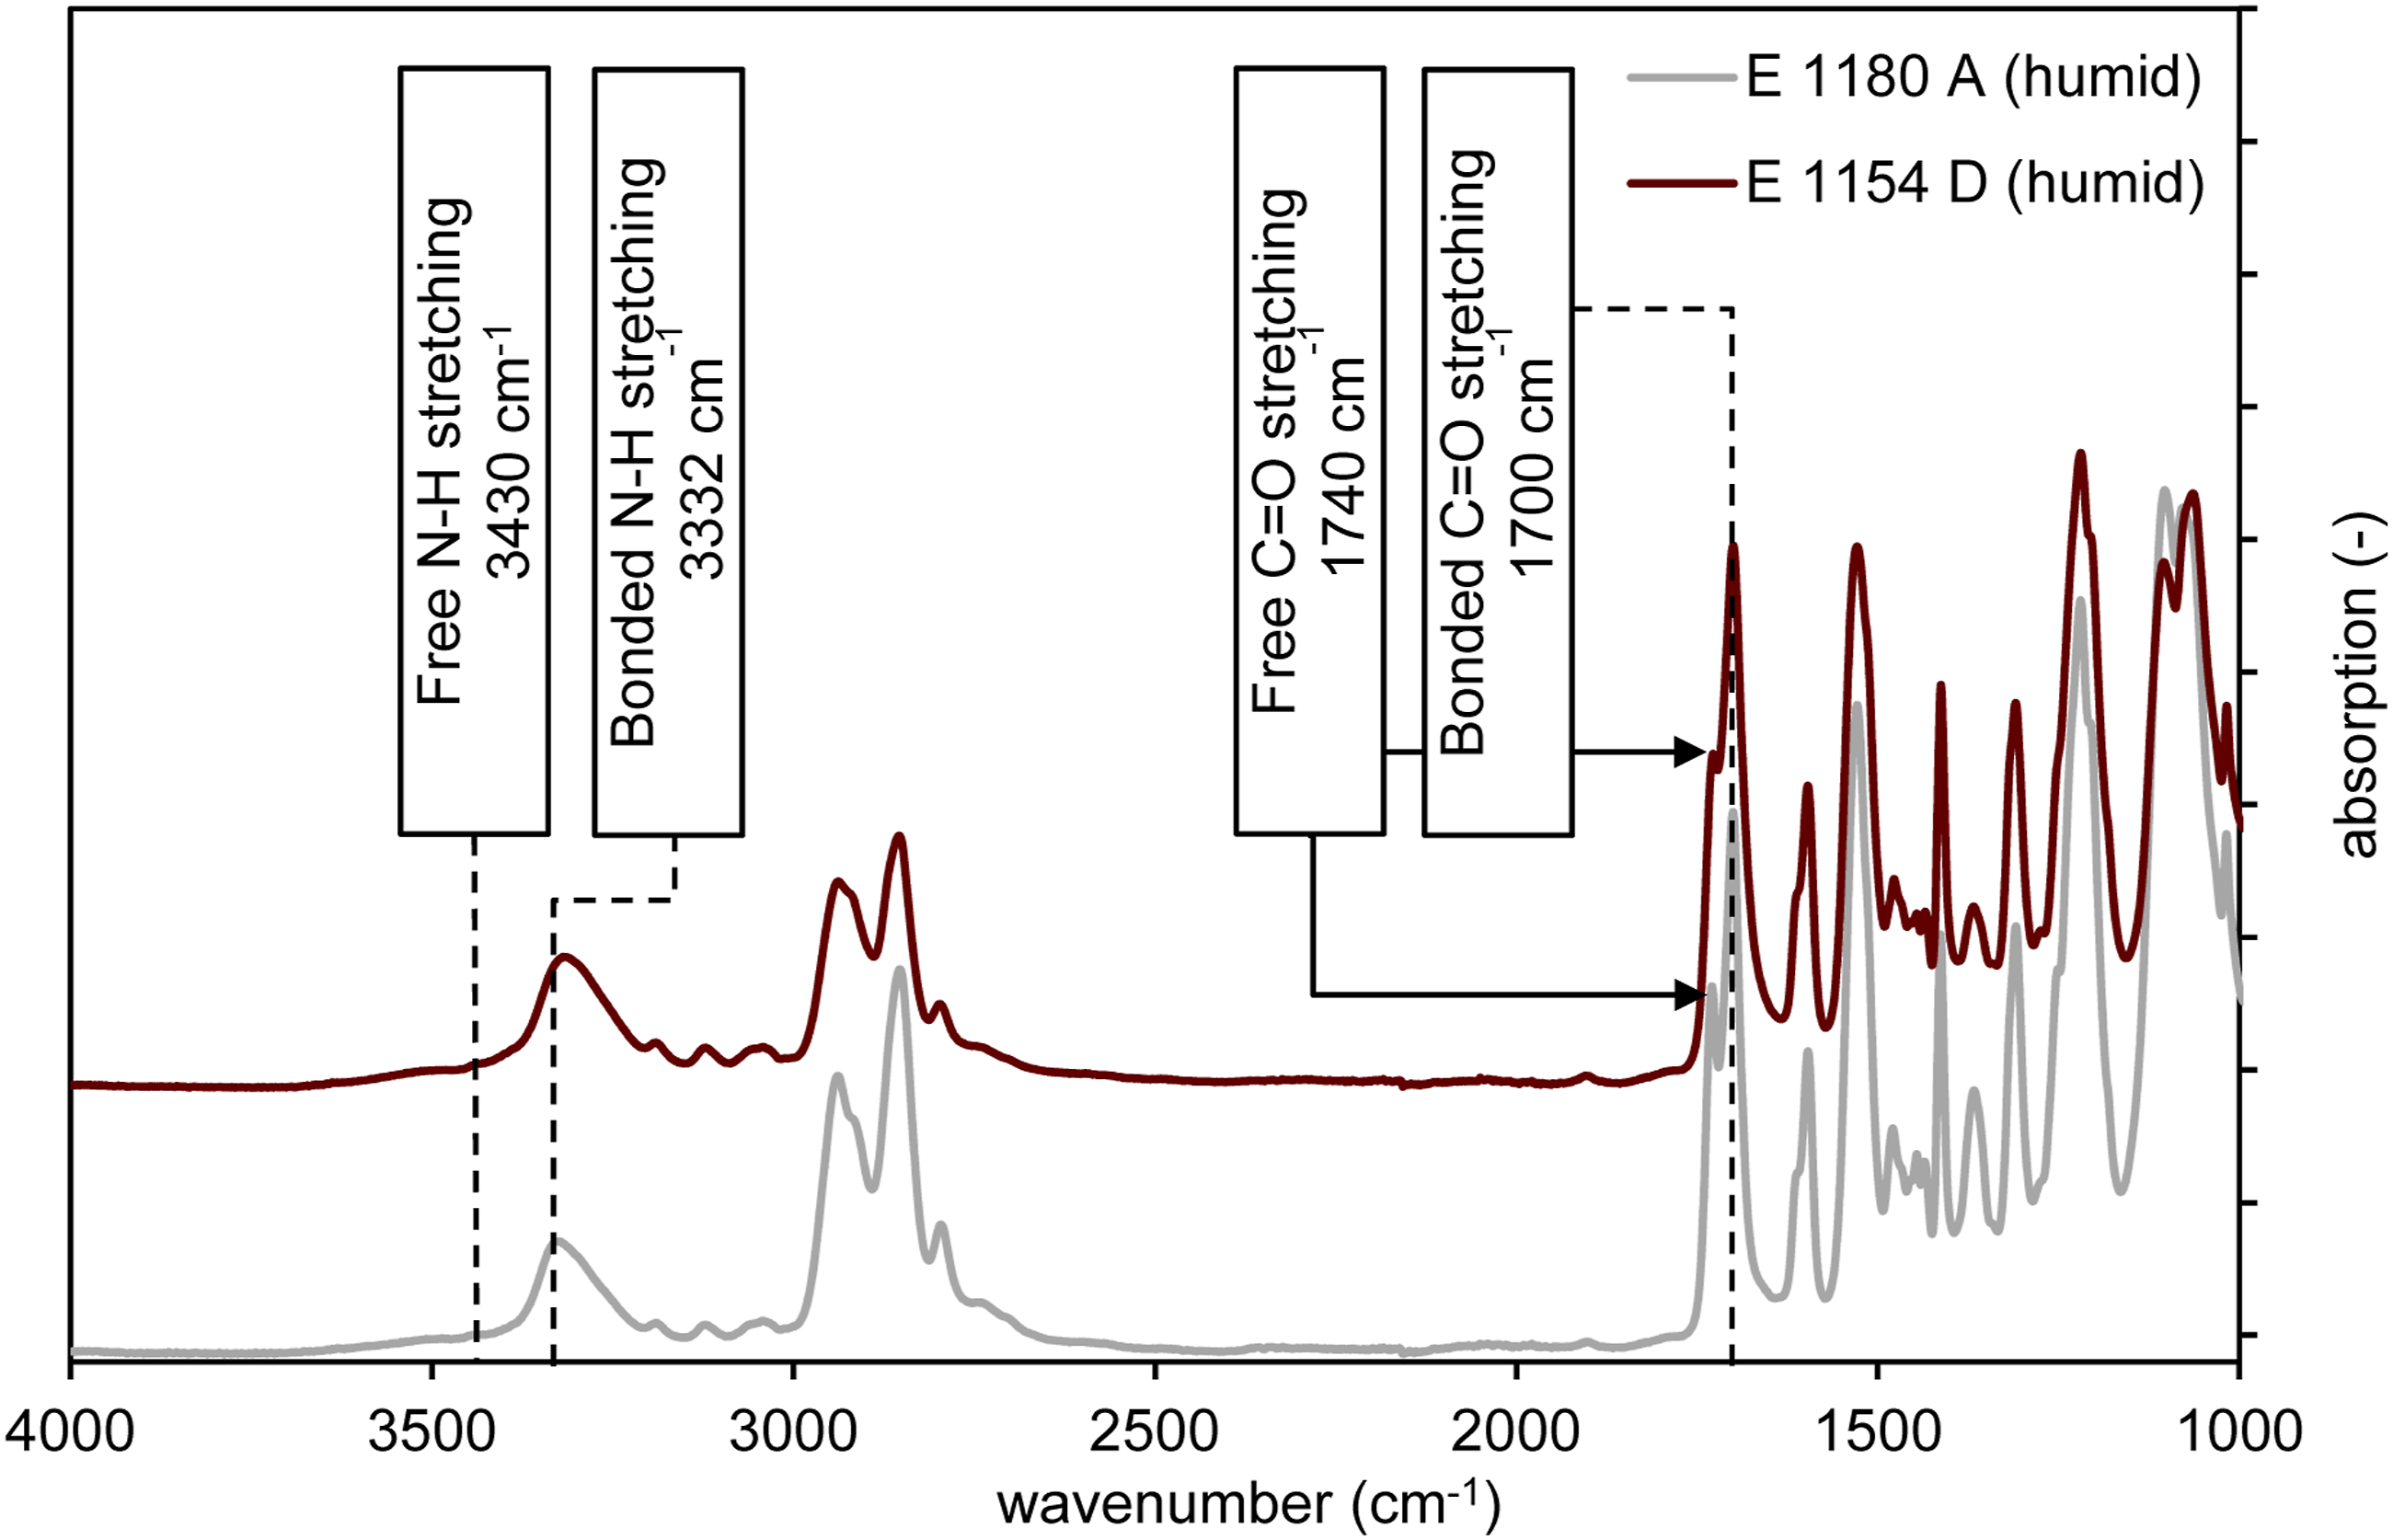
In Figure 11, the temperature-dependent changes in the free and bound N-H and C = O groups for both materials are shown. For both materials, an increase in temperature results in a significant reduction in the band intensity at 3332 cm−1, which is associated with the breaking of existing hydrogen bonds. Similarly, the number of free N-H groups increases, as indicated by the higher peak intensity at 3340 cm−1. For the C = O groups, a clear temperature-dependent decrease in the intensity of the bound groups is observed, accompanied by an increase in the free C = O groups. Water incorporation through hydrogen bonding is mainly assumed to occur via double hydrogen bonding to free C = O groups, as illustrated in Figure 2. Temperature-dependent FTIR spectra focusing on the characteristic bands of hydrogen bonding in TPU, measured using the Rheonaut system.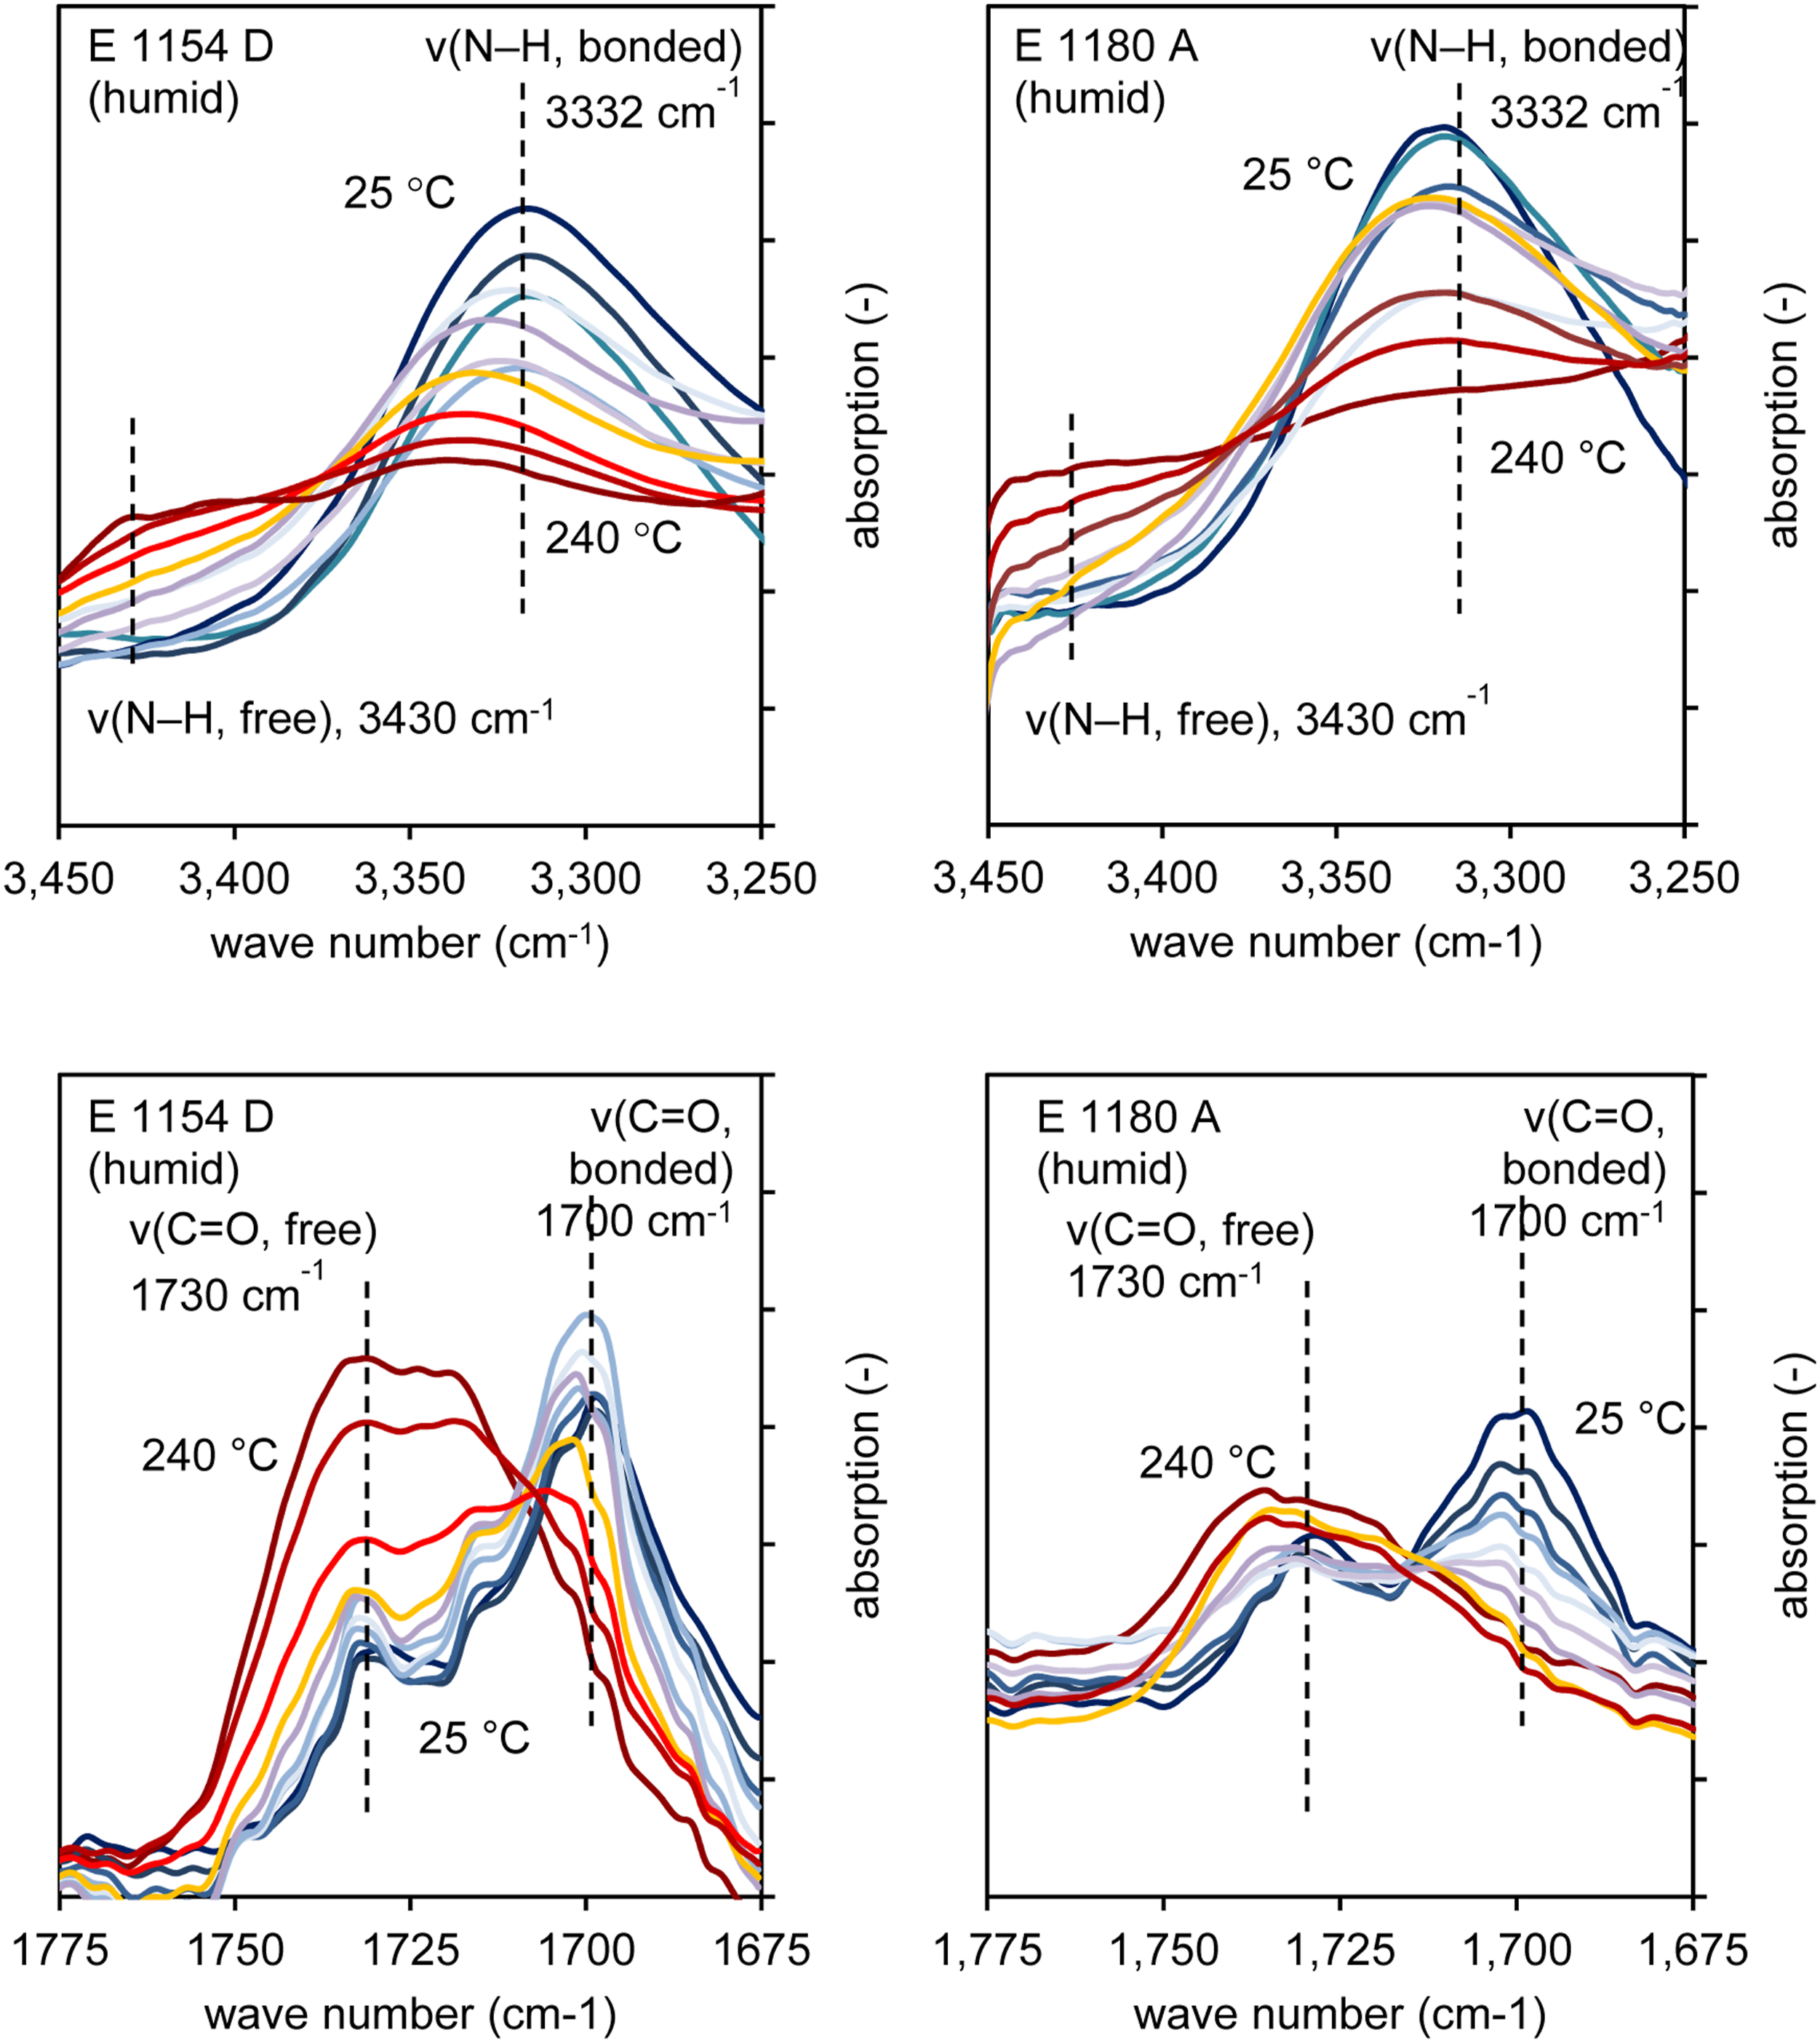
Due to differing baseline offsets, overlaying the curves was only possible by adjusting the scale. Therefore, the peak intensities of the free and bound groups were normalized within each measurement to allow for comparison between the curves. The resulting band ratio is shown as a function of temperature in Figure 12. It is hypothesized that changes in the peak ratios can be linked to the breaking of hydrogen bonds and the release of water. For both materials, there is no significant change in the band ratios between free and bound N-H groups. In contrast, the free C = O groups increase significantly with temperature. In the case of E 1154 D, a notable change in the peak ratios occurs only above approximately 200°C, whereas in E 1180 A, a continuous increase in free C = O groups relative to bound groups is observed even at lower temperatures and is followed by an equilibrium phase upon reaching 160°C. It is therefore supposed that bound water is released from the material at temperatures where the majority of the powder in the process is still in its solid state therefore not contributing to a bubble formation. In comparison for E 1154 D hydrogen bond breaking supposedly occurs only after reaching the molten state of the polymer therefore generating gas bubbles upon evaporation of the released water and contributing to bubble formation. Representation of band ratios between free and bound N-H and C = O groups as a function of temperature for E 1154 D (left) and E 1180 A (right).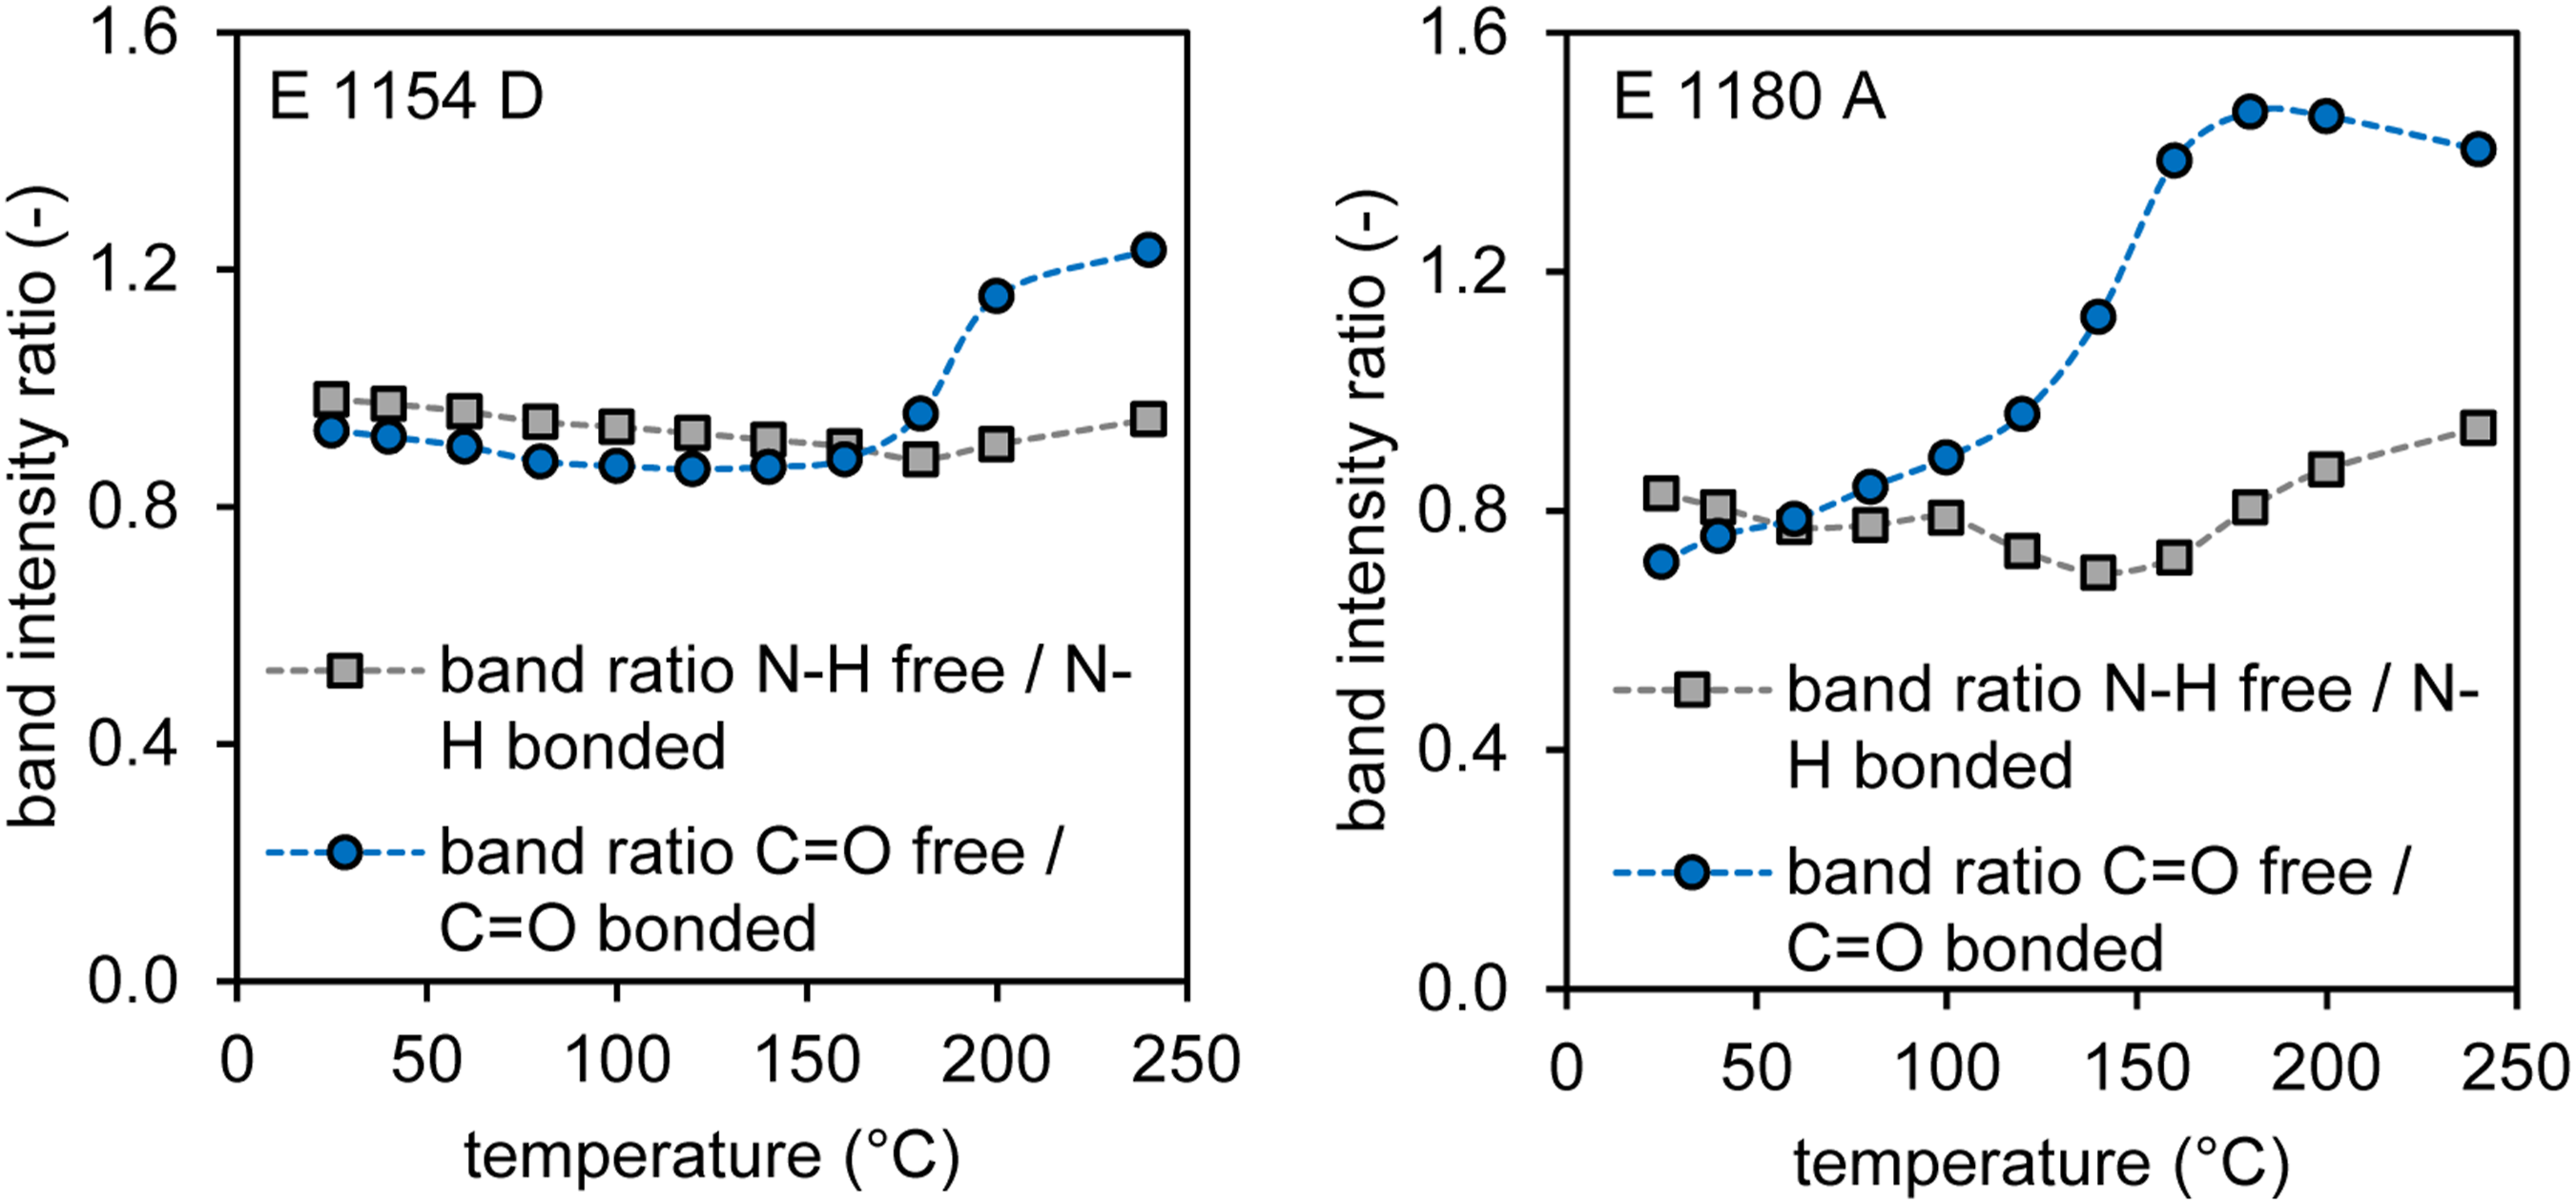
Effects of water on foamed samples
In vacuum-assisted foaming, the states generated during the melting process serve as the starting point for the subsequent foaming process, and the air pockets created act as nucleation sites for the expansion. Therefore, the trends observed in the unfoamed samples also continue when comparing the conditioned states in the foamed components. For the comparison, the foaming process was carried out at a uniform vacuum pressure of 150 mbar for both E 1180 A as well as E 1154 D. The vacuum application temperature was chosen as such that similar viscosity states were present (complex viscosity: approx. 5000 Pas; measured in the linear viscoelastic range at the zero viscosity point under shear stress; test setup: rotational rheometer with plate-plate configuration at 1 Hz and 0.3% deformation). The larger number of pores in the humid samples leads in both cases to cell coalescence at a theoretically identical pressure-dependent expansion factor compared to the dry condition. In some cases, the otherwise nearly spherical cell shapes (see dry conditioning) are simply deformed due to coalescence without cell rupture, while in other instances, cell connections occur, resulting in a mixed to open-cellular structure. In addition, distinct morphological differences between the two materials can be observed: E1180 A develops a more heterogeneous cell structure with irregularly shaped and partially deformed cells, which is attributed to its lower initial cell density, broader cell size distribution, and differing extensional viscosity characteristics. In contrast, E1154 D exhibits a more uniform foam with predominantly spherical cells, reflecting its higher initial cell density and more homogeneous size distribution. A more detailed investigation of these morphological effects is desirable and should be addressed in future work. Unlike in Figure 6, Figure 13 does not show pore counts, as the open-cell structure could distort the precise number, and a detailed comparison of pore diameters via quantitative CT analysis is also omitted in this case. Instead, Figure 14 will provide insight into the influence of moisture content on the foaming degree. Comparison of effects of dry and ambient material conditioning on vacuum assisted rotational foam molding samples based on computed tomography images (square prism with 8 mm side length, serving as size reference; inverted representation: pores as solid structures; polymer matrix as void space). Density values of unfoamed (a) and foamed samples (b) as a function of the material type and as a function of the material conditioning and derived density reduction factors for the foamed samples.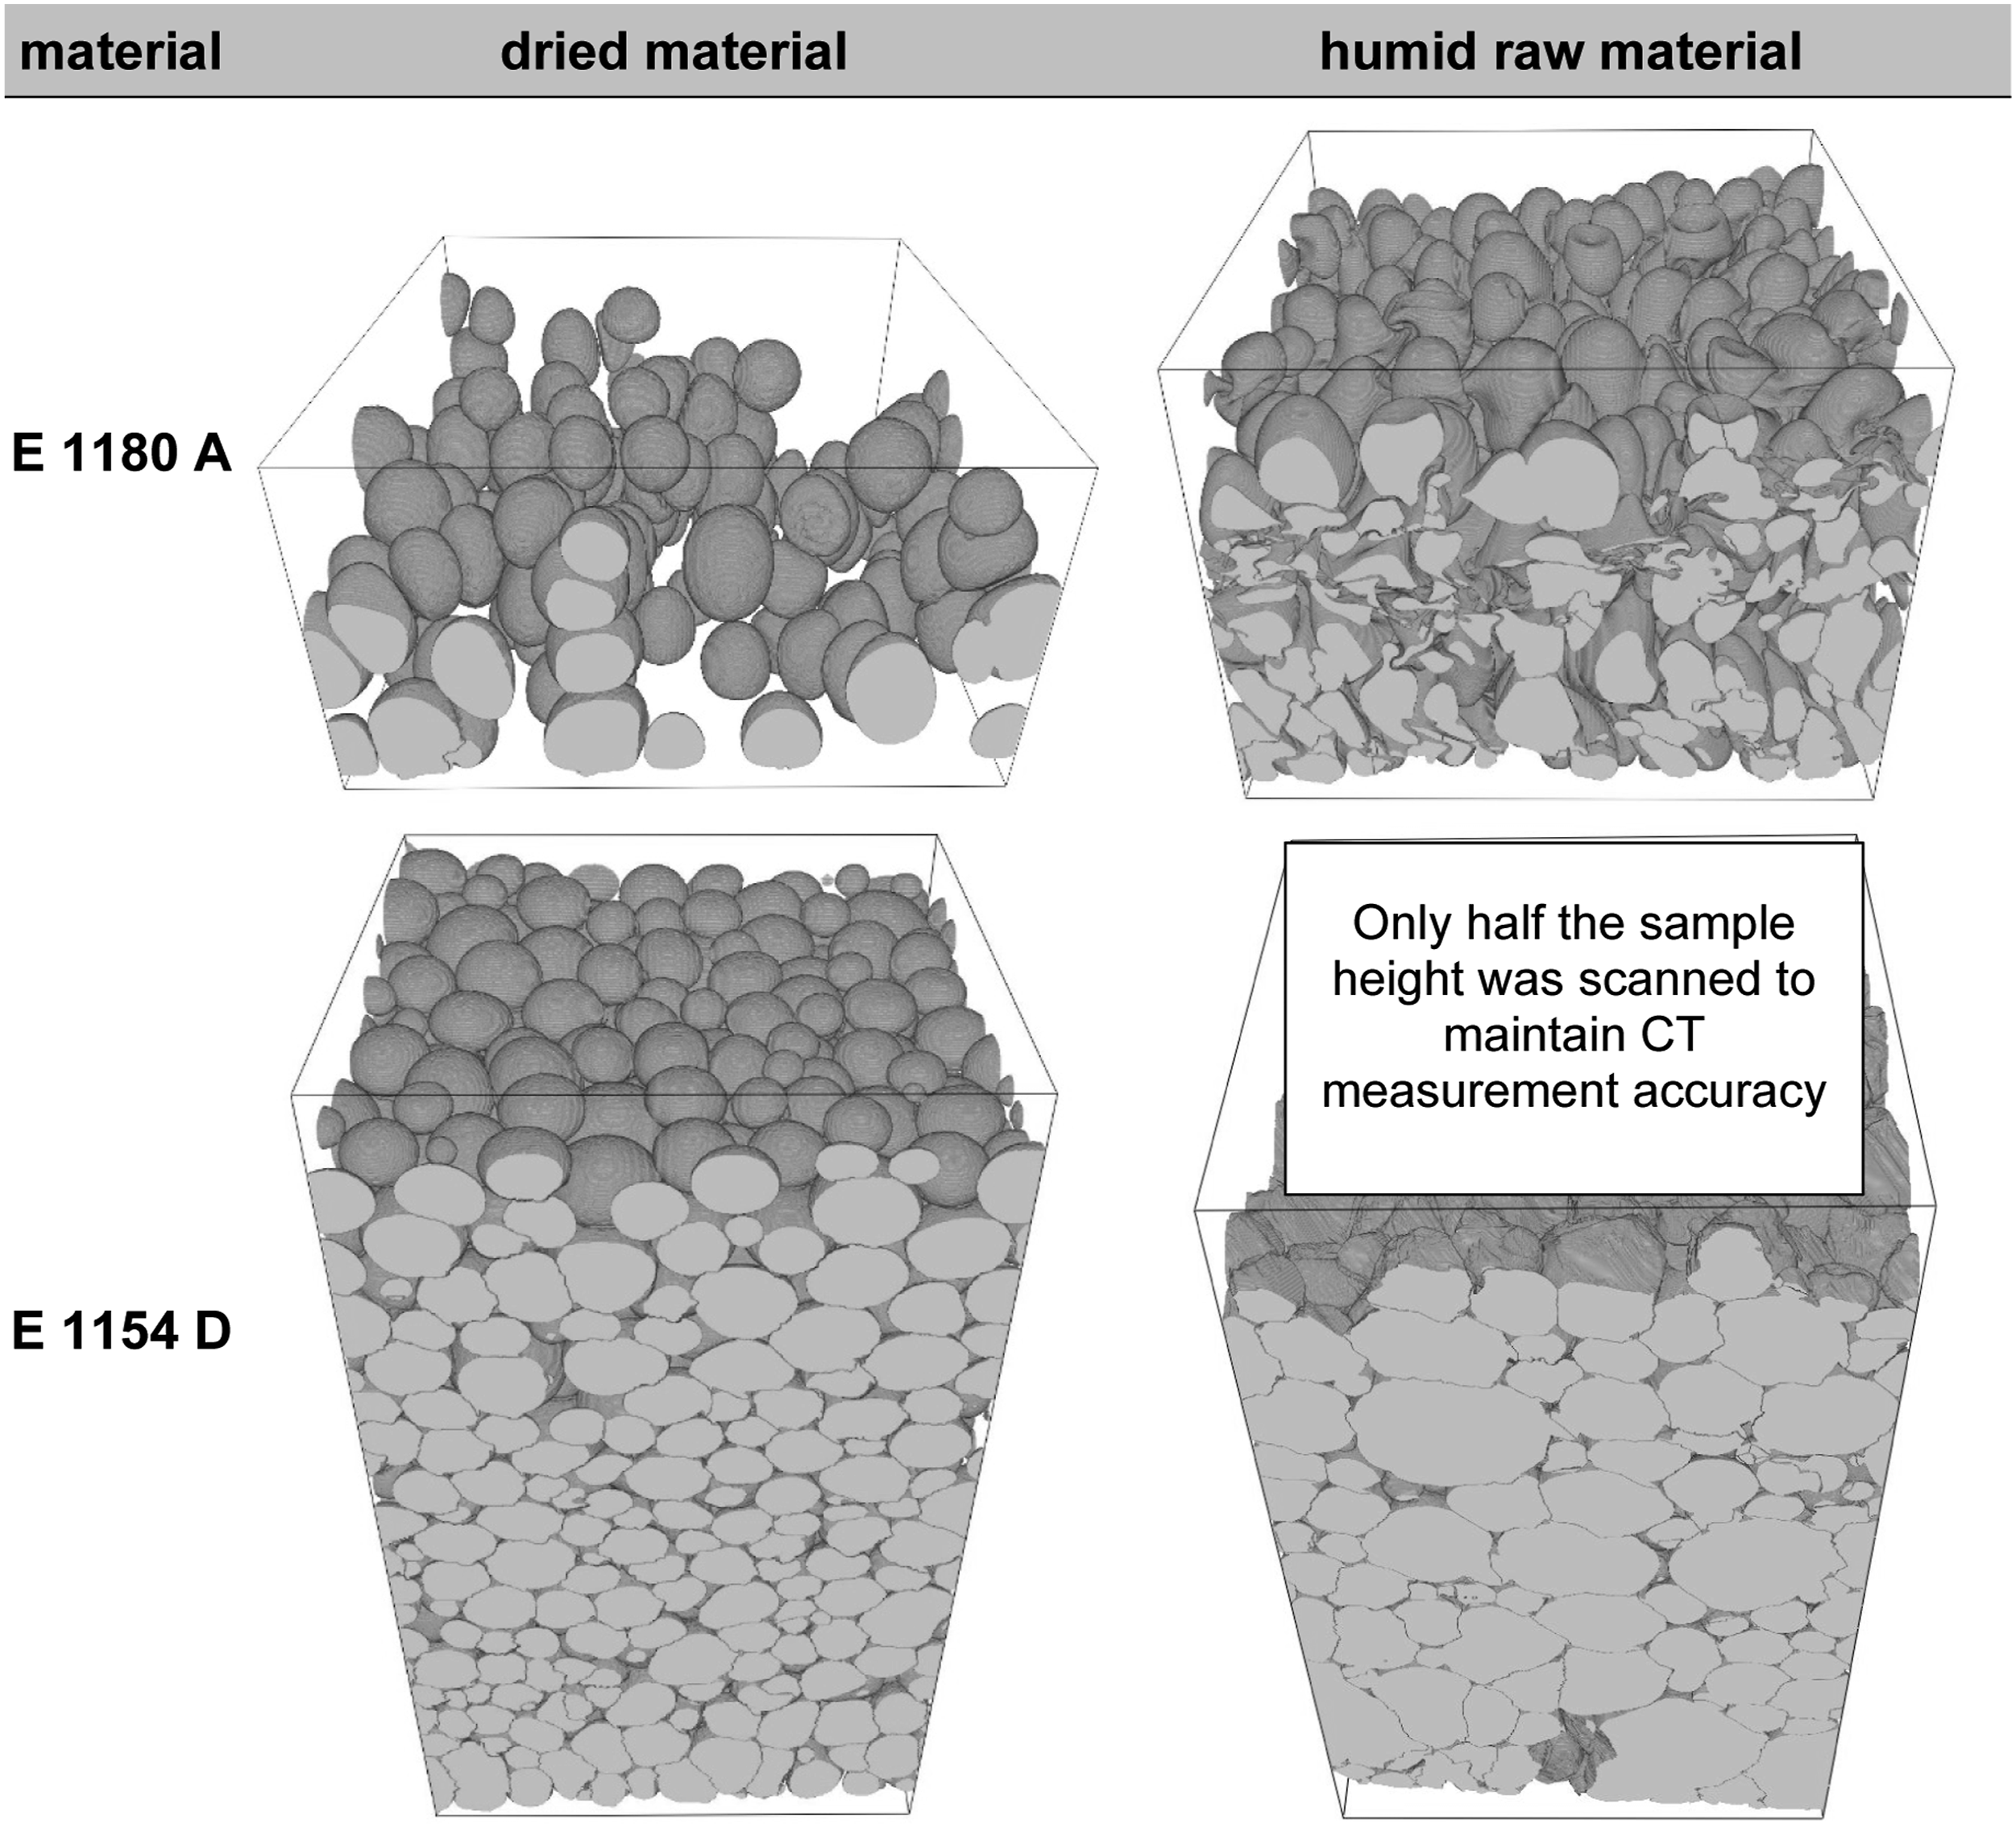
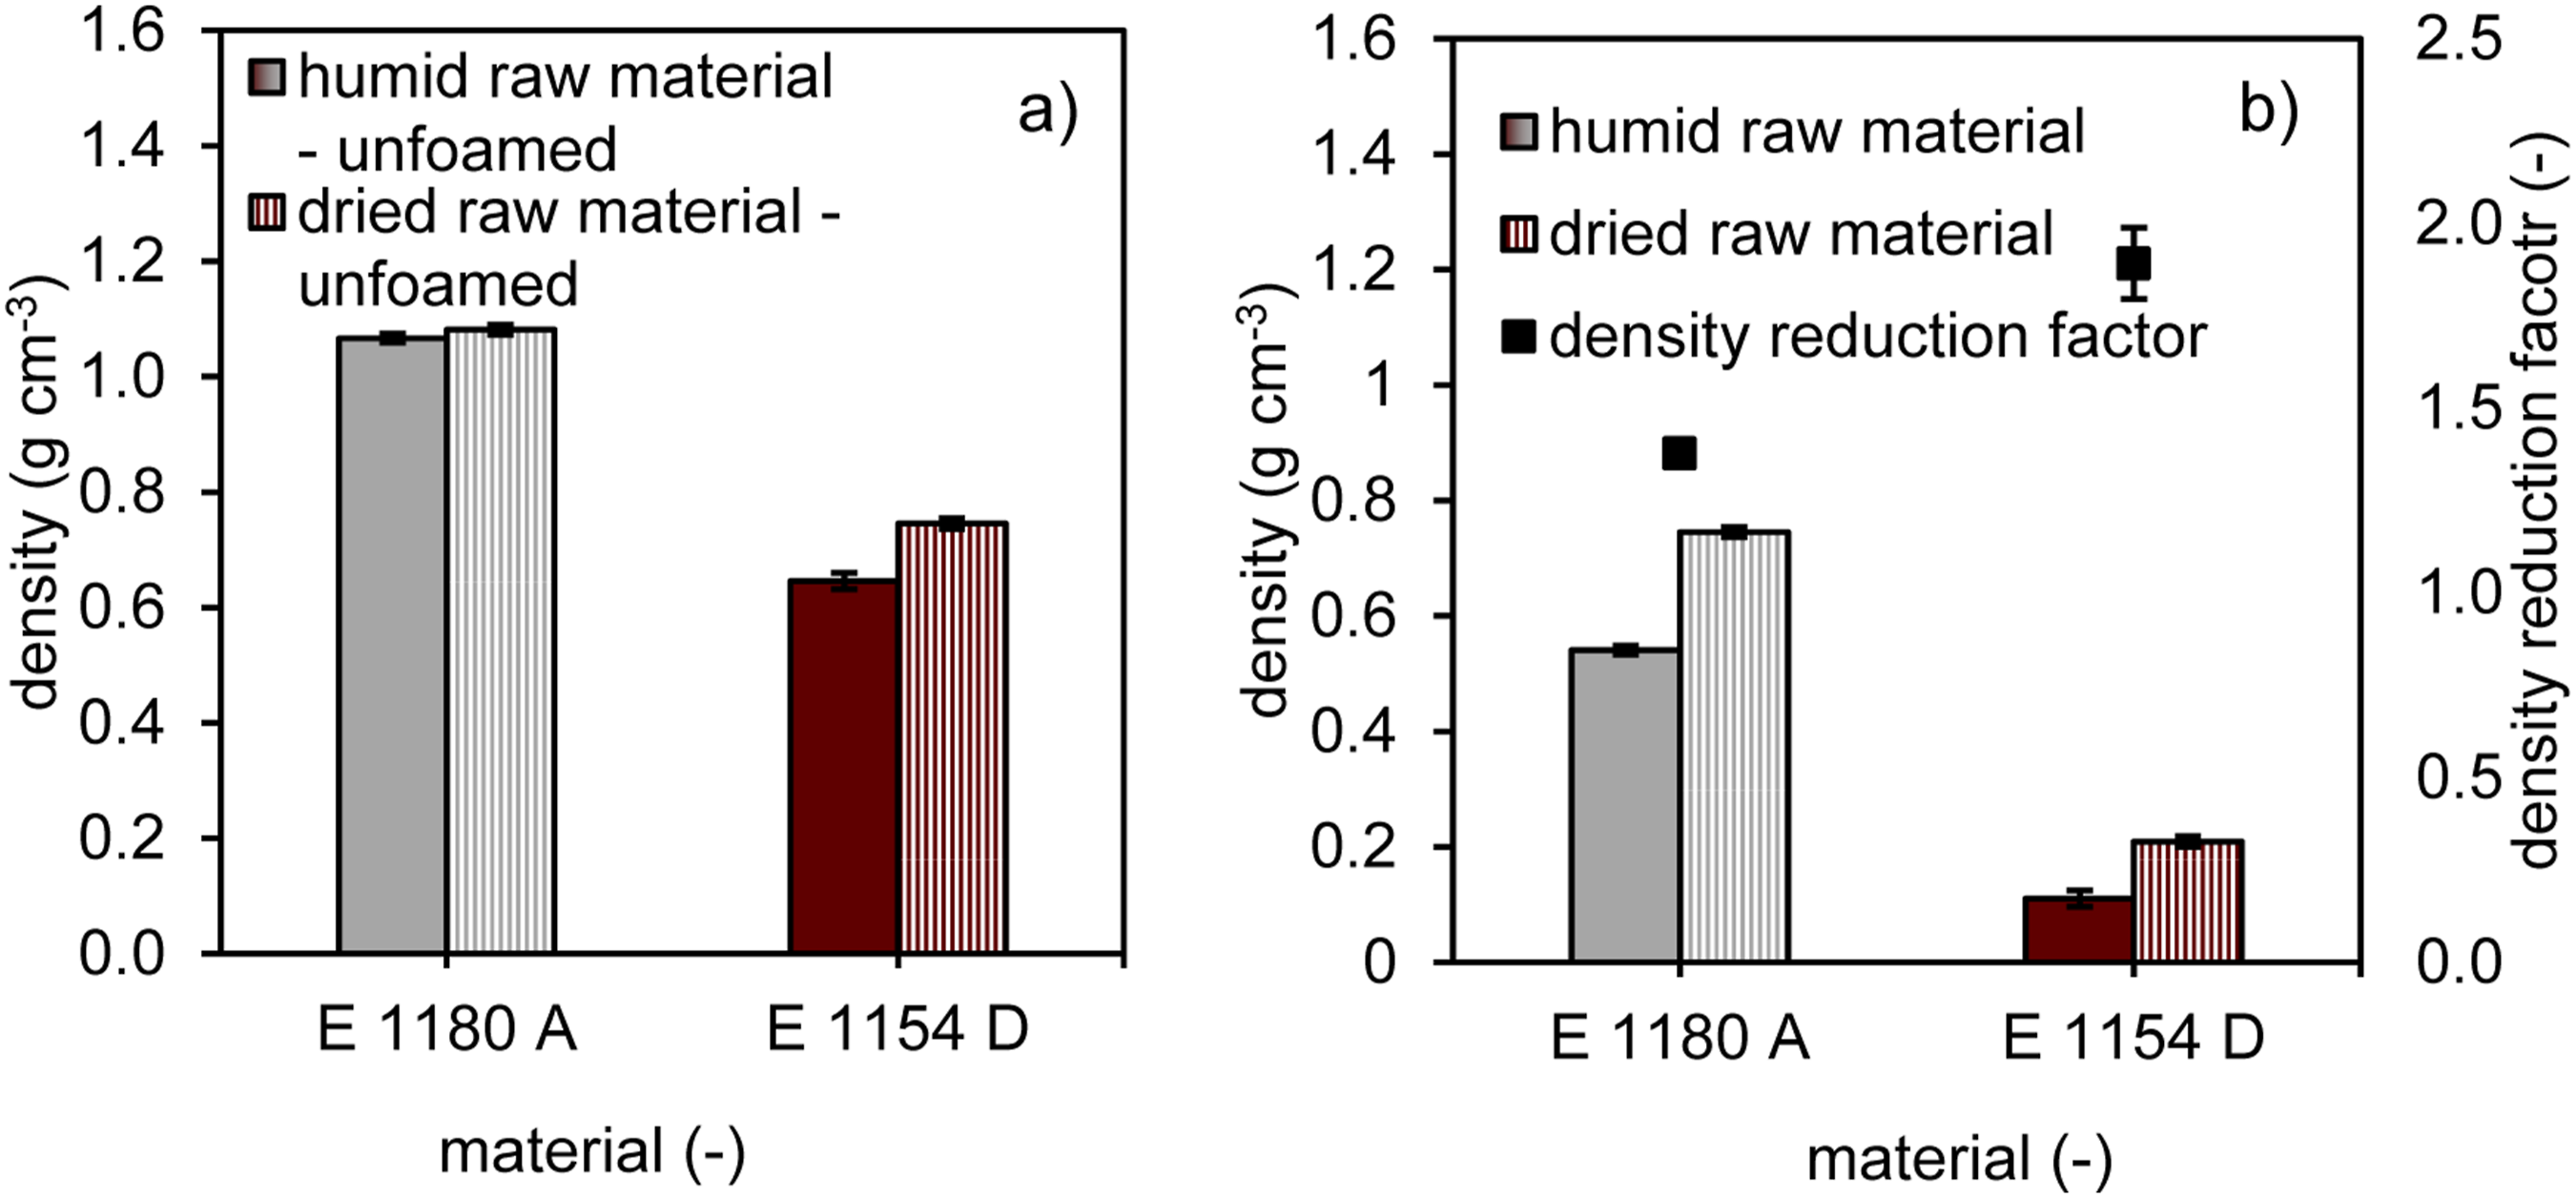
For the unfoamed state, the porosity data already presented in Figure 7 were converted into density values, Figure 14(a), and are used as a reference to provide an overview in comparison to the foamed samples, Figure 14(b). E 1180 A exhibits densities close to the raw material density of 1.11 g cm−3, with only marginal differences between humid and dried conditions. In contrast, E 1154 D already shows slightly lower densities than the raw material density of 1.17 g cm−3, which can be attributed to sintering effects and the larger fraction of entrapped air in the unfoamed samples. Similar to the porosity observed in the unfoamed samples, the density in the foamed samples also shows a statistically significant influence of the water content/material moisture. The lower initial bubble density in E 1180 A results in higher density values, regardless of moisture content, compared to E 1154 D. Furthermore, the observed trend of a stronger moisture effect at higher hard segment content is also evident in the comparison of the density reduction factor, with E 1154 D showing significantly higher values compared to E 1180 A.
Conclusion
Within the scope of this study, it was not possible to conclusively determine the exact bonding mechanism by which water is incorporated into each material. However, in line with the research objectives, valuable insights were gained into how water desorption behavior contributes to foam formation. Key factors influencing this process include the thermal and timely desorption behavior in correlation with the time-temperature behavior within the vacuum assisted foaming process. The study highlights the significant impact of moisture content on the foaming process, emphasizing the importance of controlled material conditioning and consistent monitoring of moisture levels in hygroscopic materials. Additionally, the findings indicate the potential for tailoring the foam properties through controlled water content, which could be strategically leveraged to enhance performance. Future research should focus on refining the understanding of water-polymer interactions and how these influence the foaming process at different scales, providing a foundation for more precise control over foam formation in industrial applications.
Footnotes
Author contributions
Jannik Werner: Conceptualization, methodology, investigation, data analysis, writing. Aryan Oktaee: Experimental support. Maximilian Wormser: Technical review. Hans-Peter Nürnberg: Technical review. Dietmar Drummer: Supervision, review and editing.
Funding
The authors disclosed receipt of the following financial support for the research, authorship, and/or publication of this article: This work was supported by the “Bayerisches Staatsministerium für Wirtschaft, Landesentwicklung und Energie” within the program “Neue Werkstoffe Bayern” [grant number 47-6665 g/1305/2-MW-2009-0005].
Declaration of conflicting interests
The authors declared no potential conflicts of interest with respect to the research, authorship, and/or publication of this article.
Data Availability Statement
The data that support the findings of this study are available from the corresponding author upon reasonable request.
Author consent
All authors have read and approved the final manuscript and agree to its submission to the journal.