
Abstract
The use of fused filament fabrication (FFF) for 3D printing of continuous fibre composites has significantly improved composite manufacturing. With its ability to manufacture geometrically complex, high strength composites, parts that would have not been achievable through traditional composite manufacturing methods can now be explored. 3D printers that print continuous metal wires have been prominent in recent research because of their wide range of applications including sensing and shape memory behaviour. Previous studies in the field of 3D-printed continuous wire polymer composites (CWPCs) have identified the presence of voids around the wire reinforcement location but have not addressed mitigation techniques. Voids can significantly decrease adhesion between the matrix and reinforcement material, causing a decrease in strength and stiffness. Traditional composite manufacturing methods, such as hot-pressing or compression molding, are used to decrease voids after manufacturing. In this study, continuous nickel-chromium wire thermoplastic composites are manufactured using FFF 3D printing. This study develops a consolidation procedure which utilizes the principles of hot-pressing and resistive heating, accompanied by thermal modelling of the transient conduction and resistive heating of the sample. Optical microscopy and three-point flexural tests are carried out to quantify the void volume fraction, as well as the flexural strength and flexural modulus after the consolidation procedure is performed. Void content was found to be decreased by 63.9% and 91.6% after hot-pressing and consolidation, respectively. Three-point flexural test results show that the consolidated samples displayed a 5% and 12% increase in flexural strength and modulus, respectively.
Keywords
Introduction
Additive manufacturing (AM) has filled a significant gap in the composite manufacturing industry which allows geometrically complex composite parts to be fabricated consistently. In particular, fused filament fabrication (FFF) allows for the manufacturing of geometrically complex composite parts in a cost-effective manner. Short-fibre thermoplastic filaments, such as polyethylene terephthalate glycol (PETG), nylon, or polyetheretherketone (PEEK) reinforced with short carbon or glass fibres have been printed using commercial and desktop FFF 3D printers.1–3 Companies such as Markforged and Anisoprint make dual-extrusion 3D printers that print high strength-to-weight ratio thermoplastic parts reinforced with continuous carbon, glass, or aramid fibres. However, these printers can come with high initial costs.4,5 Due to their high strength and ease of manufacturing, there has been a significant increase in research on continuous fibre-reinforced 3D-printed parts, both using industrial printers and custom machines in an effort to address current high costs. The use cases of continuous fibre 3D printed parts that have been studied includes studies on increased strength,6–10 4D printing of shape memory polymers, 11 sensing applications, 12 and improved thermal properties. 13
Recent studies have substituted metal wires as the reinforcement material for increased strength, using modified desktop 3D printers. The electrically conductive metal wires also enable sensing capabilities. Similar to continuous fibre composites, these metal-wire-reinforced 3D-printed parts exhibit high strength compared with their thermoplastic counterparts while providing different functionalities such as in-part heating, sensing applications, and shape memory behaviour. Ibrahim et al. 14 developed a method of co-extruding continuous metal wire and polymer matrix using a modified Prusa i3 MK3. They then performed three-point flexural tests on continuous wire polymer composites (CWPCs), testing multiple filament materials reinforced with nickel-chromium (NiCr) wire. Ultimate flexural strength improvements up to 20.2% were found in CWPC samples compared with the non-reinforced 3D-printed samples. 15 In subsequent studies, the author used
NiCr wires due to their high electrical resistance to fabricate CWPC de-icing panels 16 and continuous copper wires for improved thermal conductivity of 3D printed parts. 17 Using the same manufacturing method, Saleh et al. 18 used continuous copper and NiCr wires for structural health monitoring by taking in-part strain measurements during tensile testing. Thompson et al. 19 built a printer with separate wire and polymer print heads to reinforce polylactic acid (PLA) samples with aluminum wire in a stacking sequence. This study saw a significant increase in the tensile stiffness and strength of the materials with 25% wire volume fraction. While previous work in continuous metal wire composite 3D printing has shown significant improvements in strength, previous studies have also identified voids in their samples, mainly surrounding the continuous wire reinforcement due to the nature of the manufacturing method. This decreased adhesion between the polymer raster and the wire reinforcement material can cause decreased strength and stiffness, as well as decreased accuracy in applications involving sensing. Void volume fractions in literature have been found to be between 2.01% and 24%.15,18–20
The presence of voids in composite materials is known to have a negative effect on mechanical properties such as flexural strength, transverse strength, and interlaminar shear strength by decreasing the adhesion between the fibres and matrix which act as stress concentrations under loading.21–23 A detailed finite element study by Tang et al. found that 2% void content in unidirectional AS24 carbon fibre composites can cause a 25% decrease in transverse and shear strength. 24 Voids are common in both polymer and polymer-composite 3D printed parts and can be affected by printing properties such as raster orientation and infill density. 2 However, they still yield high void content, resulting in a need for more void reduction techniques. Previous studies have used different post-processing heat treatment methods on 3D-printed composite materials, and these have reduced voids between printed layers.25–27 A study performed by Valvez et al. 28 studied the annealing effects of non-reinforced, discontinuous carbon-fibre-reinforced, and discontinuous-Kevlar-reinforced PETG samples. Samples were annealed at varying temperatures above the glass transition temperature (T g ) in an oven, and they displayed 10.2%, 31.8%, and 11.1% increases in flexural strength, and 17.6%, 61.1%, and 62.6% increases in flexural modulus, respectively. In-situ methods for layer-by-layer consolidation have also been performed on continuous fibre 3D printed composites. Some in-situ consolidation methods include alternating the printing path, 29 infrared laser curing the deposited layer, 23 or using custom print-heads with a laser to keep the polymer matrix heated, and a consolidation roller following the printing nozzle to compact the continuous reinforced raster as it is printed.30,31 Asano et al. 32 performed layer-wise compaction on 3D-printed nylon samples reinforced with continuous carbon fibre. They found the compaction roller decreased the porosity in samples from 11% to 2.8%. Their compaction rolling process yielded a 32.6% and 11.2% increase in flexural modulus and strength, respectively.
Post-processing techniques have also proven to be effective, mainly using compression molding or hot-pressing techniques. A study conducted by van de Werken et al. 33 tested the hot isostatic pressing (HIP) of 42% fibre volume fraction carbon fibre/PEEK composites which were 3D printed using a 5-axis robot arm. Their study showed a significant decrease in void content at several elevated temperatures between the glass transition and heat deflection temperatures of PEEK and the composite, respectively. The study found that flexural and interlaminar shear strength improved for HIP temperatures closer to the glass transition temperature but decreased the closer the HIP processing temperature got to the heat deflection temperature. A subsequent finite element analysis (FEA) study by Kashfi et al. 34 found that a 52% decrease in void fraction percentage due to HIP resulted in the most significant increases in flexural modulus, flexural strength, and interlaminar shear strength.
Unidirectional reinforced CWPCs are most often fabricated and tensile tested. However, flexural, shear and transverse properties are more significantly affected by voids, due to the loading distribution between fibre and matrix under non-tensile loads. This study aims to develop a consolidation procedure, combining the principles of resistive heating and hot-pressing for composite manufacturing and the reduction of voids in 3D-printed continuous wire-reinforced samples. Resistive heating is used for the first time alongside hot-pressing to reduce the voids in 3D-printed CWPCs. Resistive heating implements uniformly distributed heating of the continuous wire in each layer and helps to close the voids between the wire and rasters, while hot-pressing heats the samples from the top and bottom through the thickness, and provides the compaction required to remold the polymer rasters to fill in the voids. The resistive heating is an additional element to the thermal consolidation of the samples meant to specifically target the voids surrounding the wires, as resistive heating can bring the polymer to its glass transition efficiently and uniformly. Furthermore, resistive heating allows for heating of the parts internally for thicker parts where hot-pressing inadequately heats the sample through the thickness. A thermal model was created and validated to estimate the consolidation procedure parameters. Image processing was utilized to assess the effect of the procedure developed on the cross-section of unidirectional reinforced CWPCs by quantifying the void and wire volume fractions. Three-point flexural tests were performed as well to determine the flexural strength and stiffness of the CWPCs.
Materials & methodology
Materials & sample fabrication
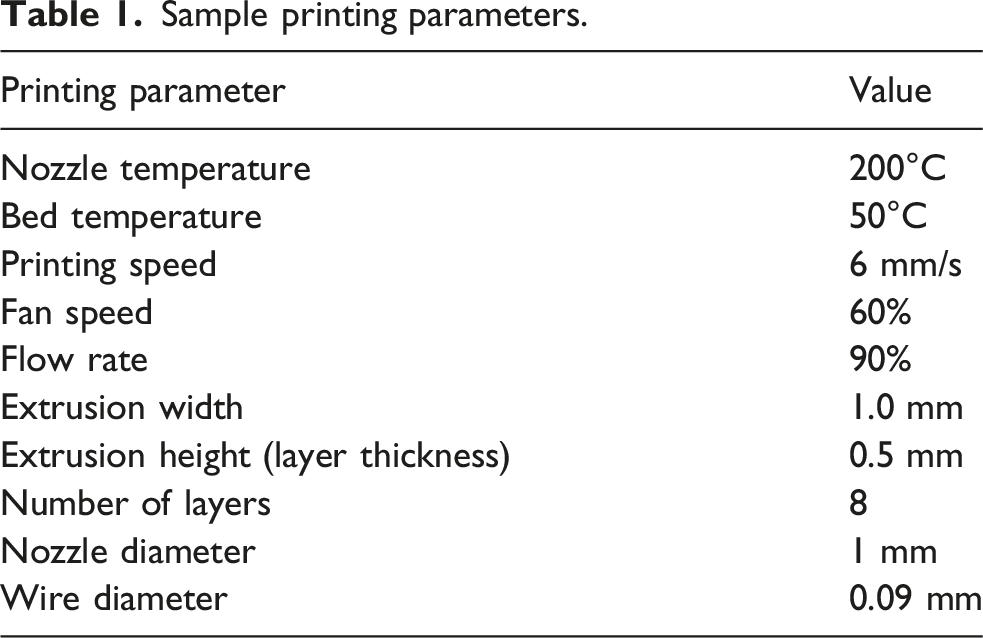
A modified FFF 3D printer (Prusa i3 MK2, Prusa Research, Prague, Czech Republic) co-extruded continuous wire reinforcement in each deposited polymer raster through a single commercial 1 mm diameter hardened-steel tip nozzle (CM2 1.0 mm nozzle - RepRap (V6), Microswiss LLC., Minnesota, United States), as seen in Figure 1. The print head used was the same one used by Ibrahim et al.,14,15 so a nozzle diameter of 1 mm was chosen as it was roughly 10 times larger than the diameter of the wire used in this study. The layer height, or extrusion height, was chosen as 0.5 mm, since it is common in 3D printing to use a layer height that is half of the nozzle diameter for good bed adhesion. (a) Modified print head design for co-extrusion of continuous wire and polymer raster and (b) sample with visible wires printed unidirectionally embedded in polymer rasters.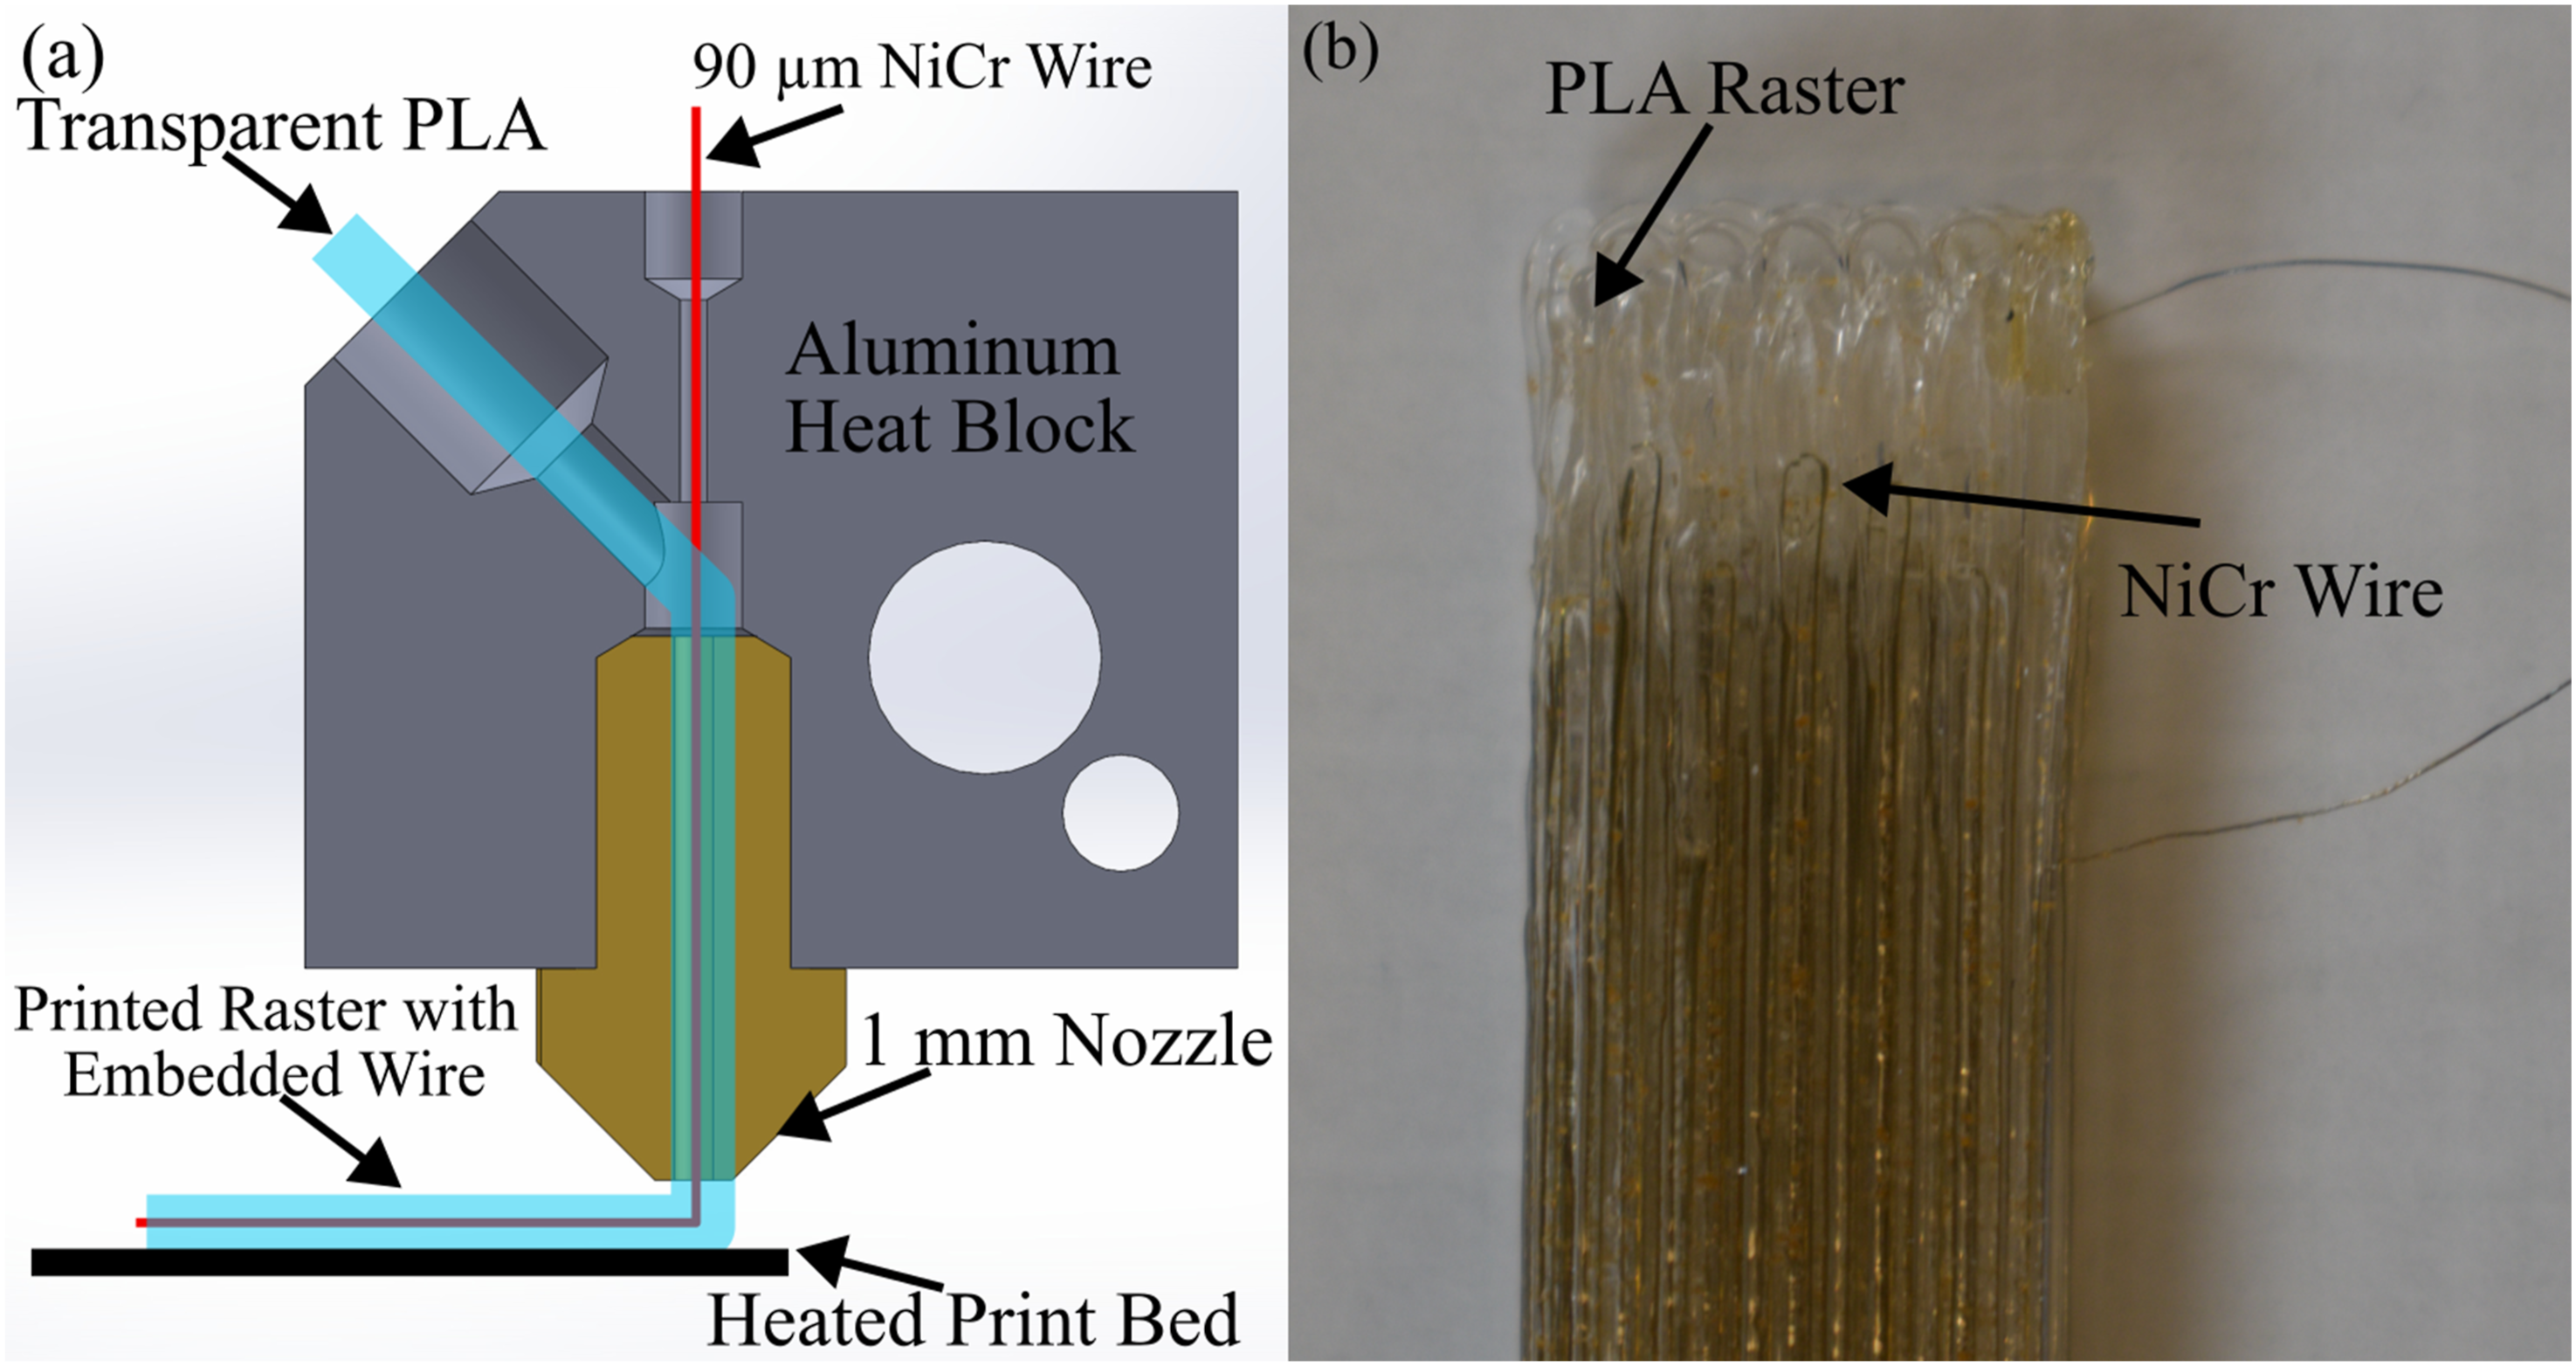
The polymer used was transparent PLA filament (1.75 mm Transparent PLA, Eryone, China), while a continuous 0.09 mm diameter ML polyamide enamel coated NiCr resistance wire (39 AWG Evanohm Alloy S Wire, Carpenter Technology Corporation, Pennsylvania, United States) was used for the reinforcement material. The wires were pre-measured to obtain repeatable lengths in the samples. Each end of the wire was extended out from the printed sample to allow for connections during the consolidation procedure. A custom GCode was generated using an open-source GCode design program (FullControl GCode Designer, Loughborough, England) to customize the path of the print head (Figure 2).
35
Preliminary sample printing trial and error was performed by varying printing parameters such as flow rate, nozzle temperature and printing speed to determine the parameters that yielded the optimal results. The printing parameters used for the study can be seen in Table 1. Printed continuous wire polymer composites: (a) display of toolpath from FullControl GCode and (b) printed unprocessed sample. Sample printing parameters.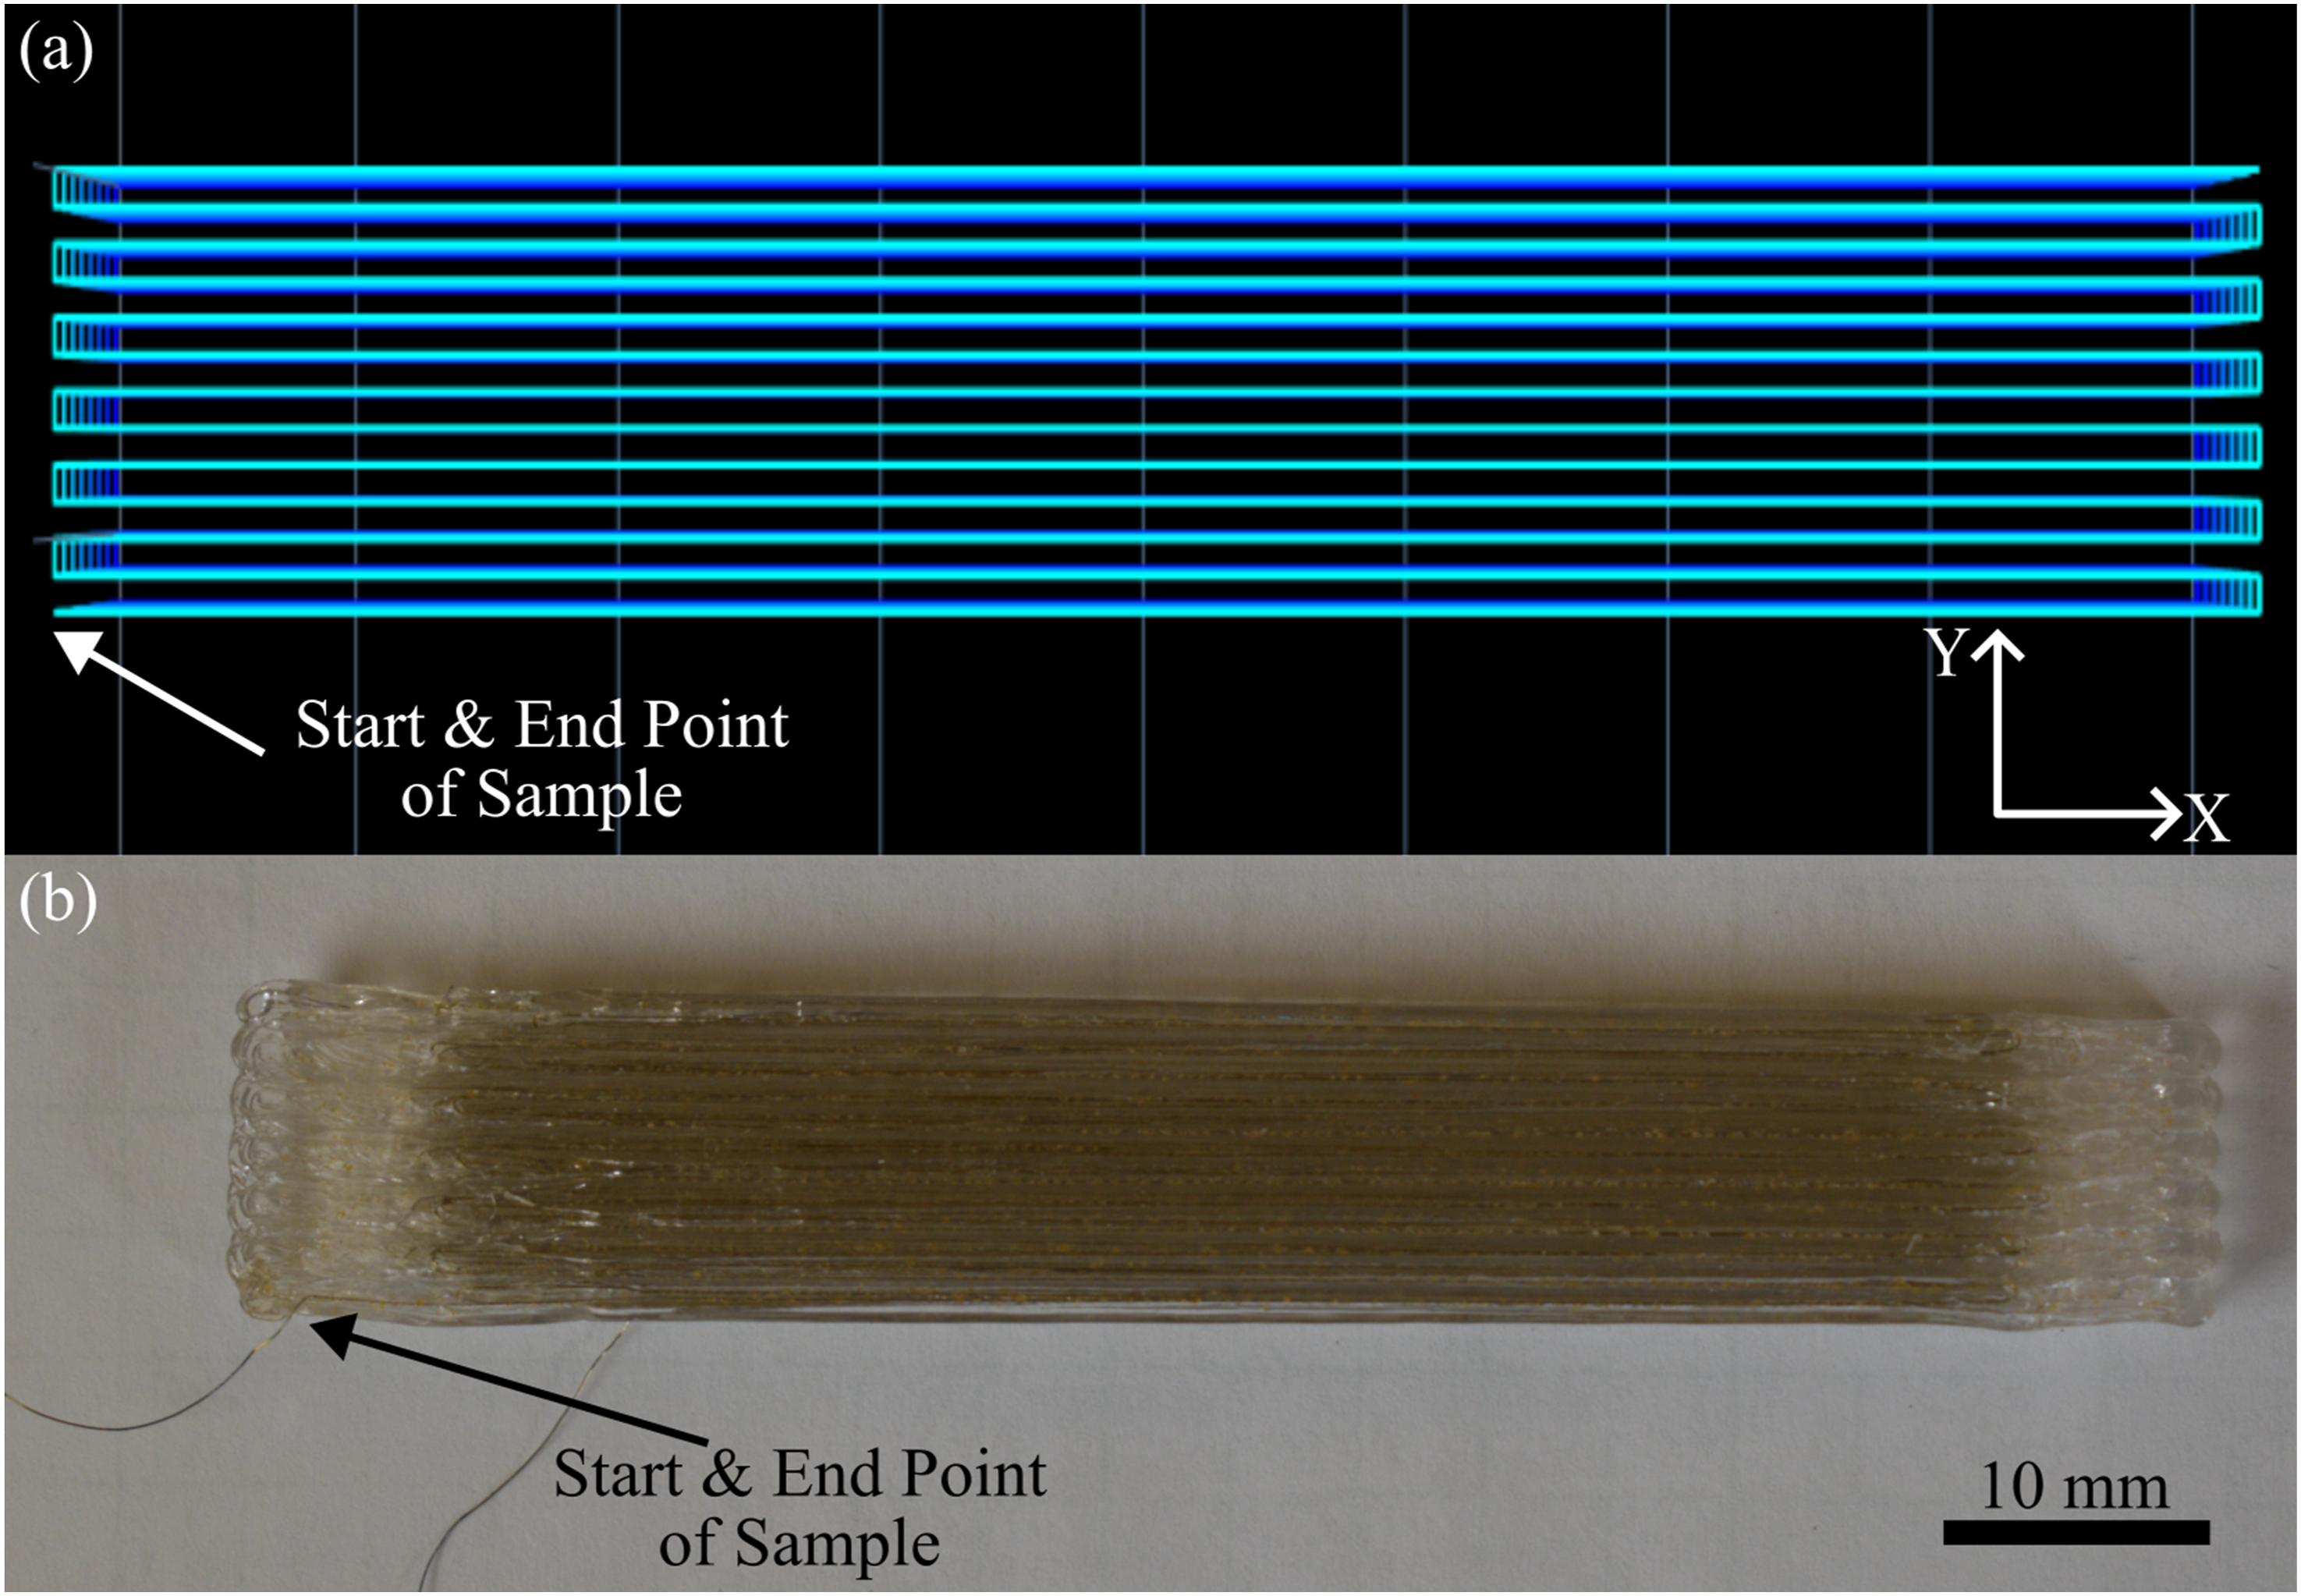
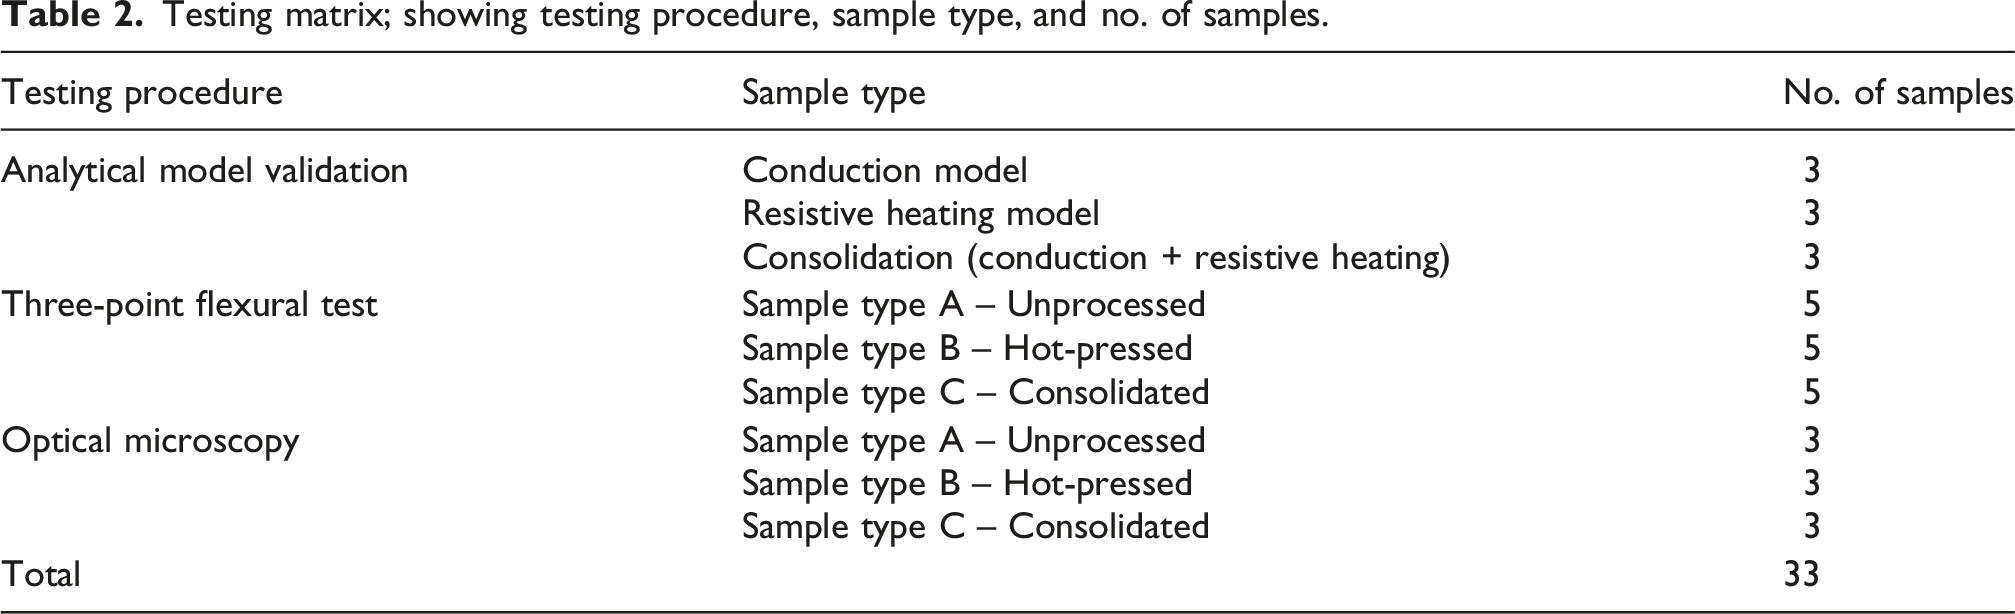
Testing matrix; showing testing procedure, sample type, and no. of samples.
Consolidation procedure
The consolidation procedure developed aimed to combine hot-pressing and resistive heating to decrease the voids in 3D-printed CWPC samples. Hot-pressing applies conduction, typically to the top and bottom faces of the sample, to heat them. It is a non-uniform method of heating as it heats the sample from the outside-in. Resistive heating is the phenomenon that results from heating a resistive element by applying a constant voltage. Used alongside hot-pressing techniques, the aim of the consolidation procedure is to remove voids more effectively and efficiently by uniformly heating the samples in each layer via resistive heating, while still applying conduction through the thickness via hot-pressing. After the sample is in its glass transition region, a compaction force can be applied to remold the sample to fill in the voids faster and more effectively than just with hot-pressing. The polymer is processed close to its glass transition to prevent the samples from being fully molten, to keep the overall shape as consistent as possible to the original printed samples. The consolidation procedure required samples to first be heated to a temperature above the glass transition temperature (T
g
) of the PLA using two aluminum platens mounted to a 3 kN load cell, and then uniformly compressed. Type B samples underwent hot-pressing, where they were heated above T
g
by 1D transient conduction only. Type C samples underwent the consolidation procedure developed in this study. The consolidation procedure heated samples above T
g
by applying 1D transient conduction, combined with resistive heating of the continuous reinforcement wire for uniform internal heating (Figure 3). Schematic of the heating step of CWPC samples through 1D conduction from heated platens and resistive heating of the continuous wire from an external power supply, outputting thermocouple data from platens to LabVIEW program for consistent temperature versus time readings.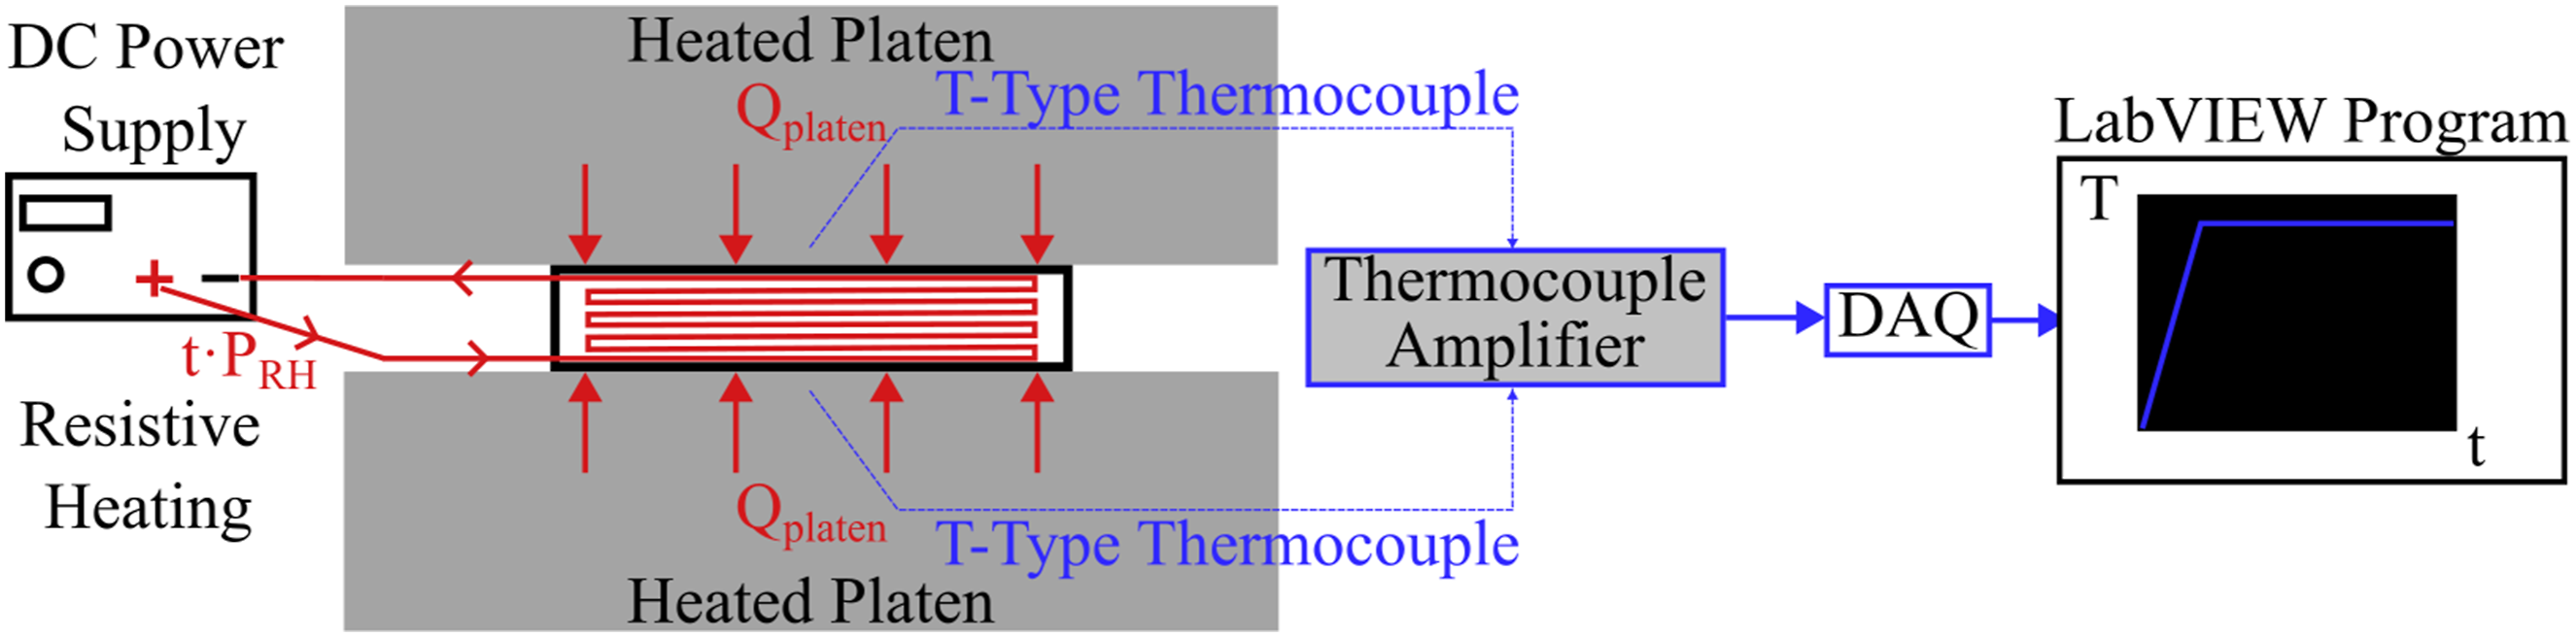
PLA filament characterization using DSC analysis
PLA is a thermoplastic semi-crystalline polymer; therefore, it has both a T g and a melting temperature (T m ). In order to reshape and improve the bond between rasters while preventing significant sample deformation, samples were heated to an equilibrium temperature above their T g but below their T m . Differential scanning calorimetry (DSC) was performed according to ASTM D3418-21 37 to determine the T g of the polymer matrix using a differential scanning calorimeter (Discovery DSC 250, TA Instruments, Delaware, United States). Three samples with masses of 10.3 mg, 10.6 mg, and 10.3 mg, were tested in a nitrogen atmosphere with a flow rate of 50 mL/min. To remove the thermal history, samples were heated to 215°C at 20°C/min, kept isothermal for 5 min, cooled to 0°C at 20°C/min, and then kept isothermal for another 5 min. The samples were then heated a second time to 215°C at a rate of 20°C/min.
The normalized heat flow versus temperature graph for the second heat cycle was plotted for all three samples (see Figure 4). The extrapolated onset and end temperatures were approximated for each graph, and the midpoint temperature was determined as the glass transition temperature, as outlined in ASTM 3418. The average T
g
and T
m
of the three samples was 58°C and 168°C, respectively. DSC second heat cycle results for three PLA filament samples showing glass transition and melting temperatures.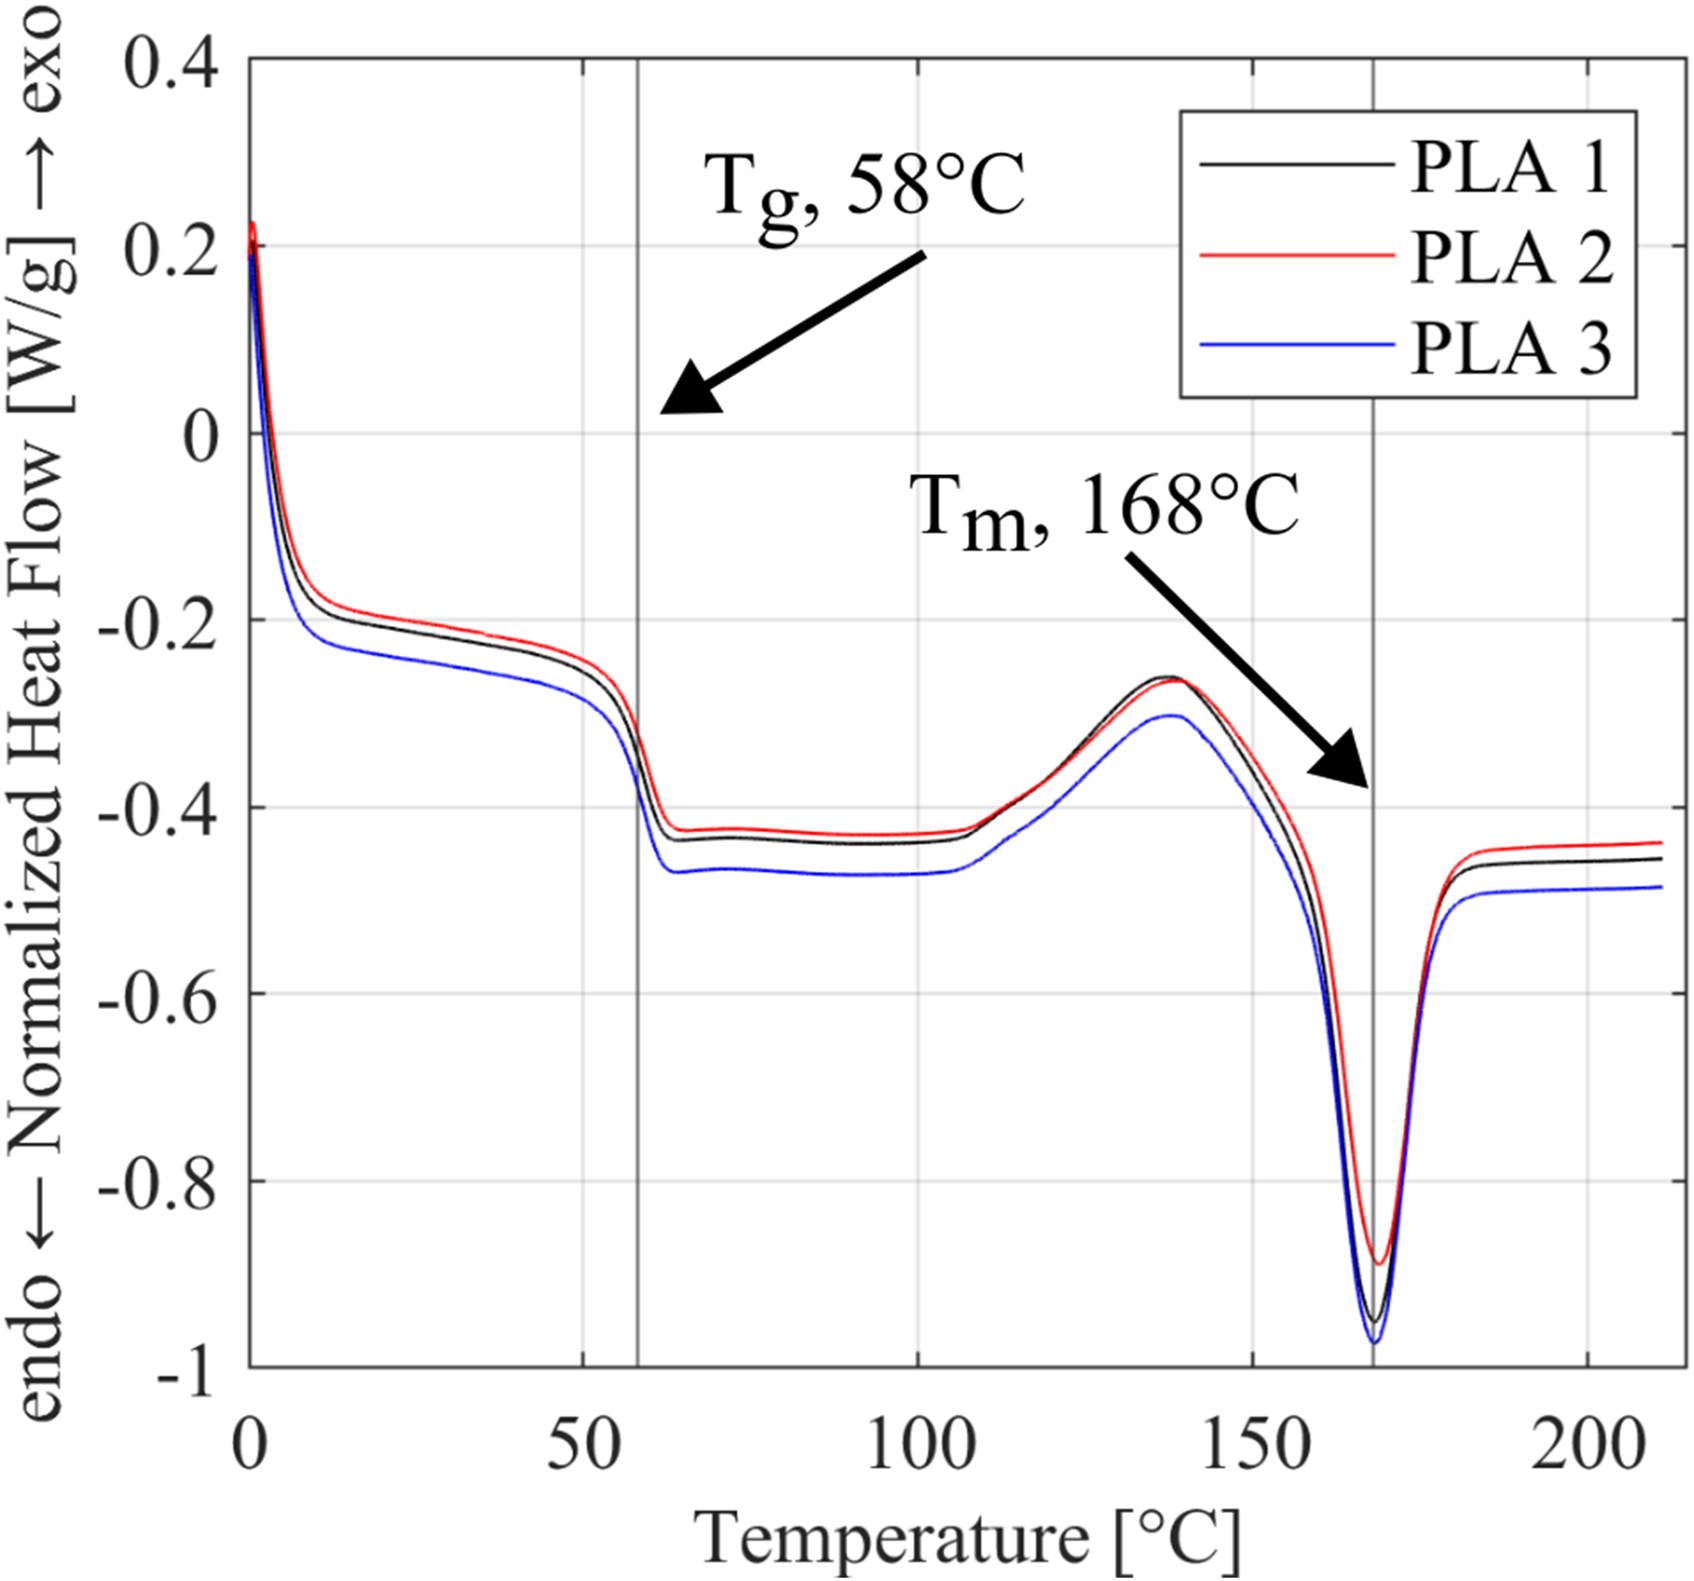
Consolidation procedure
Instrumented aluminum platens were mounted to a 3 kN load cell universal testing machine (UTM; ElectroPuls E3000, Instron, Massachusetts, United States). A consolidation procedure was developed and performed to heat the polymer matrix to above its T g ; then, voids in the samples were filled by applying a controlled compression force using the heated aluminum plates mounted in the UTM. Heating of the samples was performed by conduction between the aluminum platens and resistive heating by passing a constant voltage through the continuous NiCr wire reinforcement. The aluminum platens were fastened to the top grips and load cell of the UTM and heated to 70°C, which is 12°C above the calculated T g of the PLA matrix. Both the hot-pressing and consolidation procedures consisted of the same steps; timing differed based on the thermal modelling and testing results. In the first step of both procedures, samples were placed on the bottom platen, and the top platen was lowered until it made contact with the top of the sample. The top platen was held at this position for 120 s during hot-pressing and 45 s during consolidation. During the consolidation procedure, a constant 90 V was supplied for the 45 s from a 120 V DC power supply (6655A, Hewlett Packard, California, United States) connected to the ends of the continuous wire in the samples. Analytical models for the 1D transient conduction temperature response and resistive heating were developed. The time required to heat samples to the glass transition temperature was determined from the results of the analytical model validation testing. To ensure thermal equilibrium through the thickness of samples for both hot-pressing and the consolidation procedure, the samples were heated for longer than the thermal model testing required. After thermal equilibrium was reached and the sample was at the glass transition temperature, 2.8 MPa of compression, using the maximum force applicable by the UTM, was applied and held for 15 s. After compression, the top plate was lifted, and the sample was removed and allowed to cool to room temperature.
Thermal modelling of consolidation procedure
Thermal modelling was performed to determine the time required to heat the samples to the desired temperature before compression. A 1D transient heat conduction model was developed for the temperature response of the centre of a plane wall during hot-pressing and Ohm’s law was used to determine the time required to heat the sample to the desired temperature by resistive heating. Equating the thermal energy from the platens and the resistive heating during the consolidation procedure allowed for faster sample heating. The desired temperature of the centre of the sample was 65°C, chosen because it was above T
g
, but well below T
m
. The initial temperature of the centre of the sample was taken as room temperature, 20°C. The specified constant surface temperature assumption was applied, which assumed that from time t = 0 s, the surface temperature of the sample was held constant at, in this case, the temperature of the platen, 70°C. Figure 5 shows the schematic of the full heating step of the consolidation procedure, including 1D conduction from the platens and the energy generated from the resistive heating. Heating step of the consolidation procedure, showing the temperatures of the platens and the initial sample centre temperature, with the thermal energy from the platens by 1D transient conduction and resistive heating energy generation within the sample.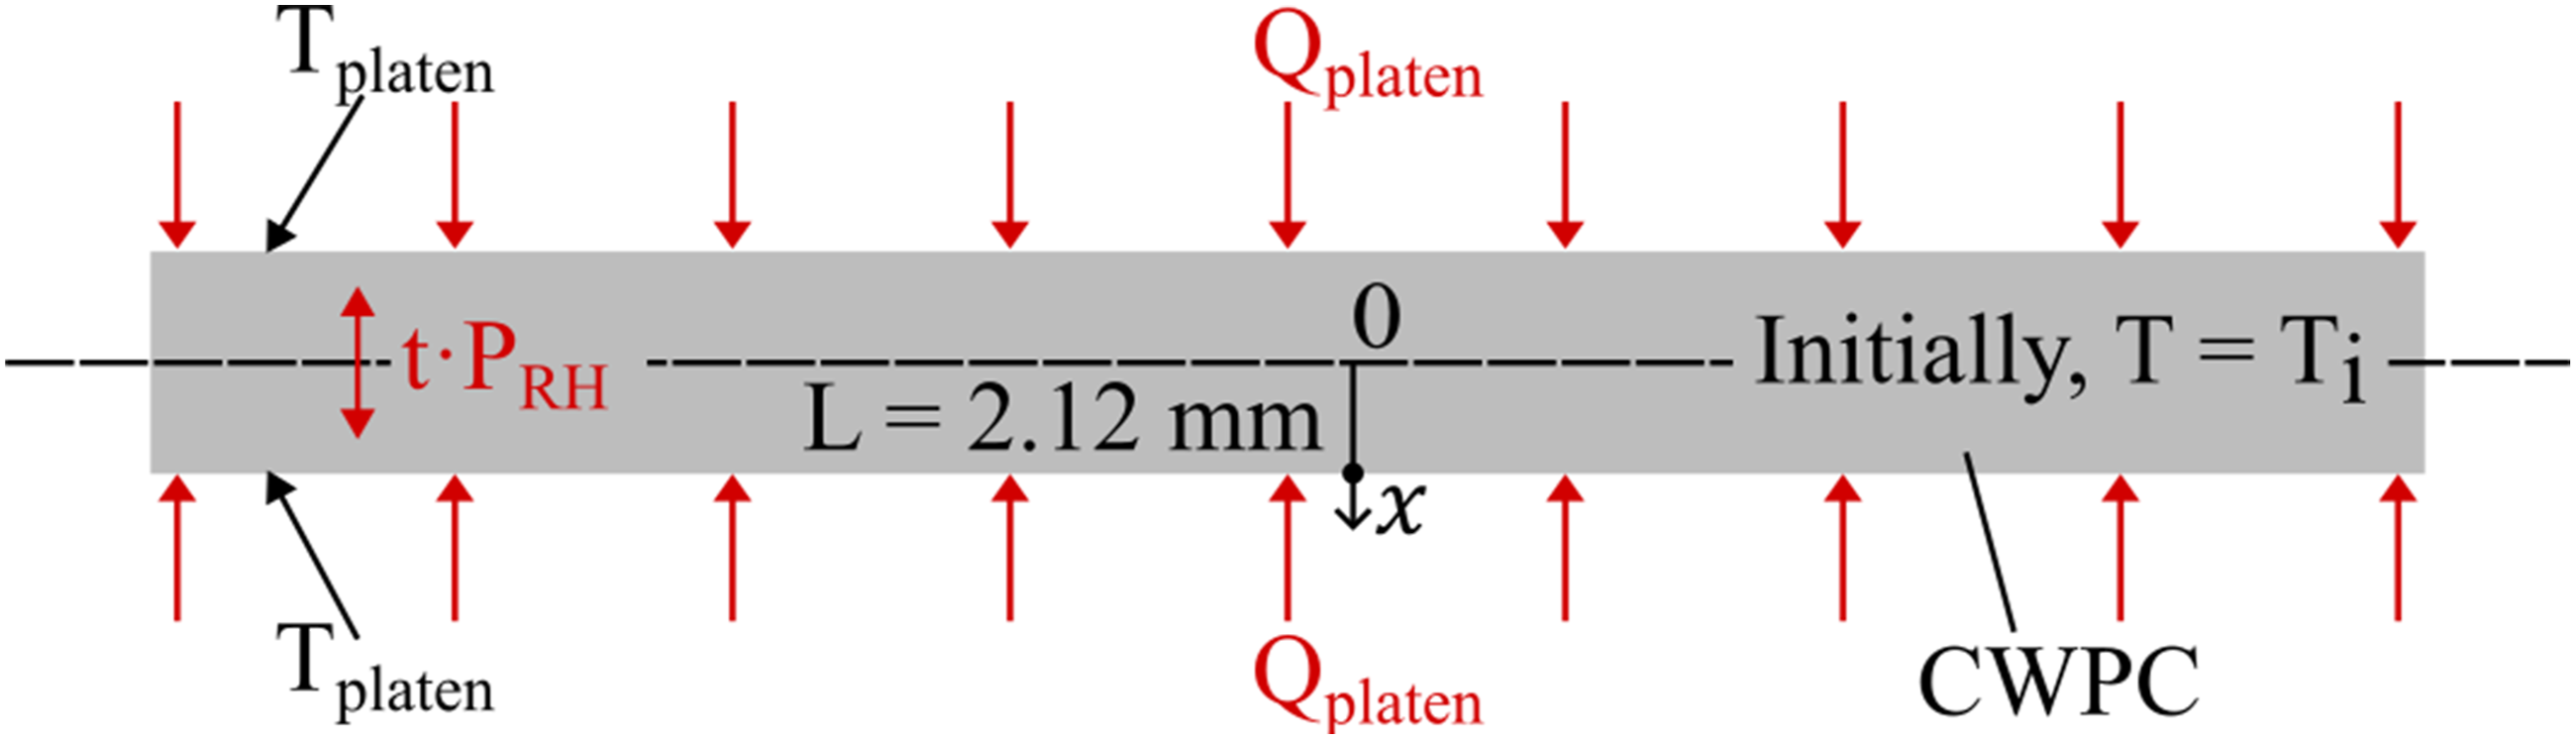
A 1D conduction model was used to determine the time required to heat the samples to the desired temperature. The dimensionless temperature response at the sample centre is given by the one-term approximation for a plane wall
38
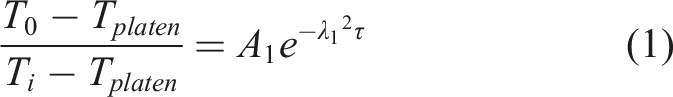
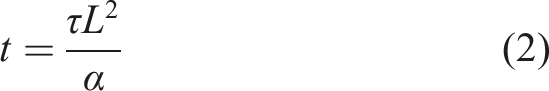
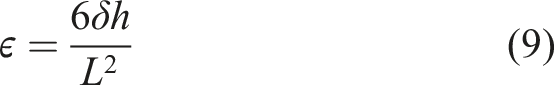
The relation given in (Equation (1)) is used to determine the value of the dimensionless time, or Fourier number τ. The equation for τ is rearranged to find the time t, required to heat the sample through the centre to the desired 65°C using
38
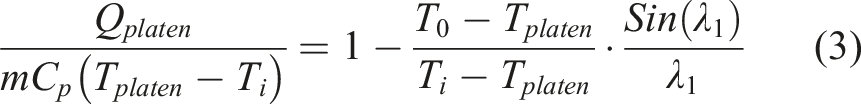
The fraction of thermal energy through the sample by 1D conduction is given by
38
Resistive heating occurs when running an electrical power through a resistive material. NiCr wire was chosen for its high electrical resistance of 66.6 Ω/ft,
40
allowing for self heating of the sample. Ohm’s law gives the electrical power through the wire by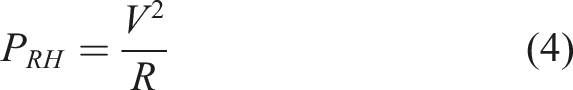
The consolidation procedure developed in this study aimed to decrease the time required to heat the sample through the centre by applying equal thermal energy externally from the heated platens and internally through resistive heating. Given the Q
platen
found in (Equation (3)), the time required for samples to heat to 65°C was calculated using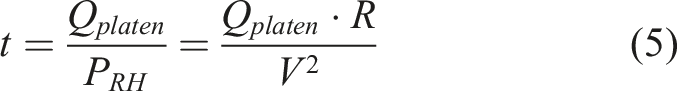
the average measured wire resistance of the resistive heating thermocouple-embedded samples was R = 1456 ± 3 Ω.
Bare T-Type thermocouple wires (COCO-005, Omega Engineering Inc., Connecticut, United States) were embedded in the fourth layer of nine samples, with the junction placed in the centre (Figure 6) to test the validity of the 1D transient conduction model, the resistive heating model, and the developed consolidation procedure. The results from the thermal analysis were used to determine the time required for proper consolidation. CWPC sample with T-type thermocouple embedded in middle layer, in the centre of the sample.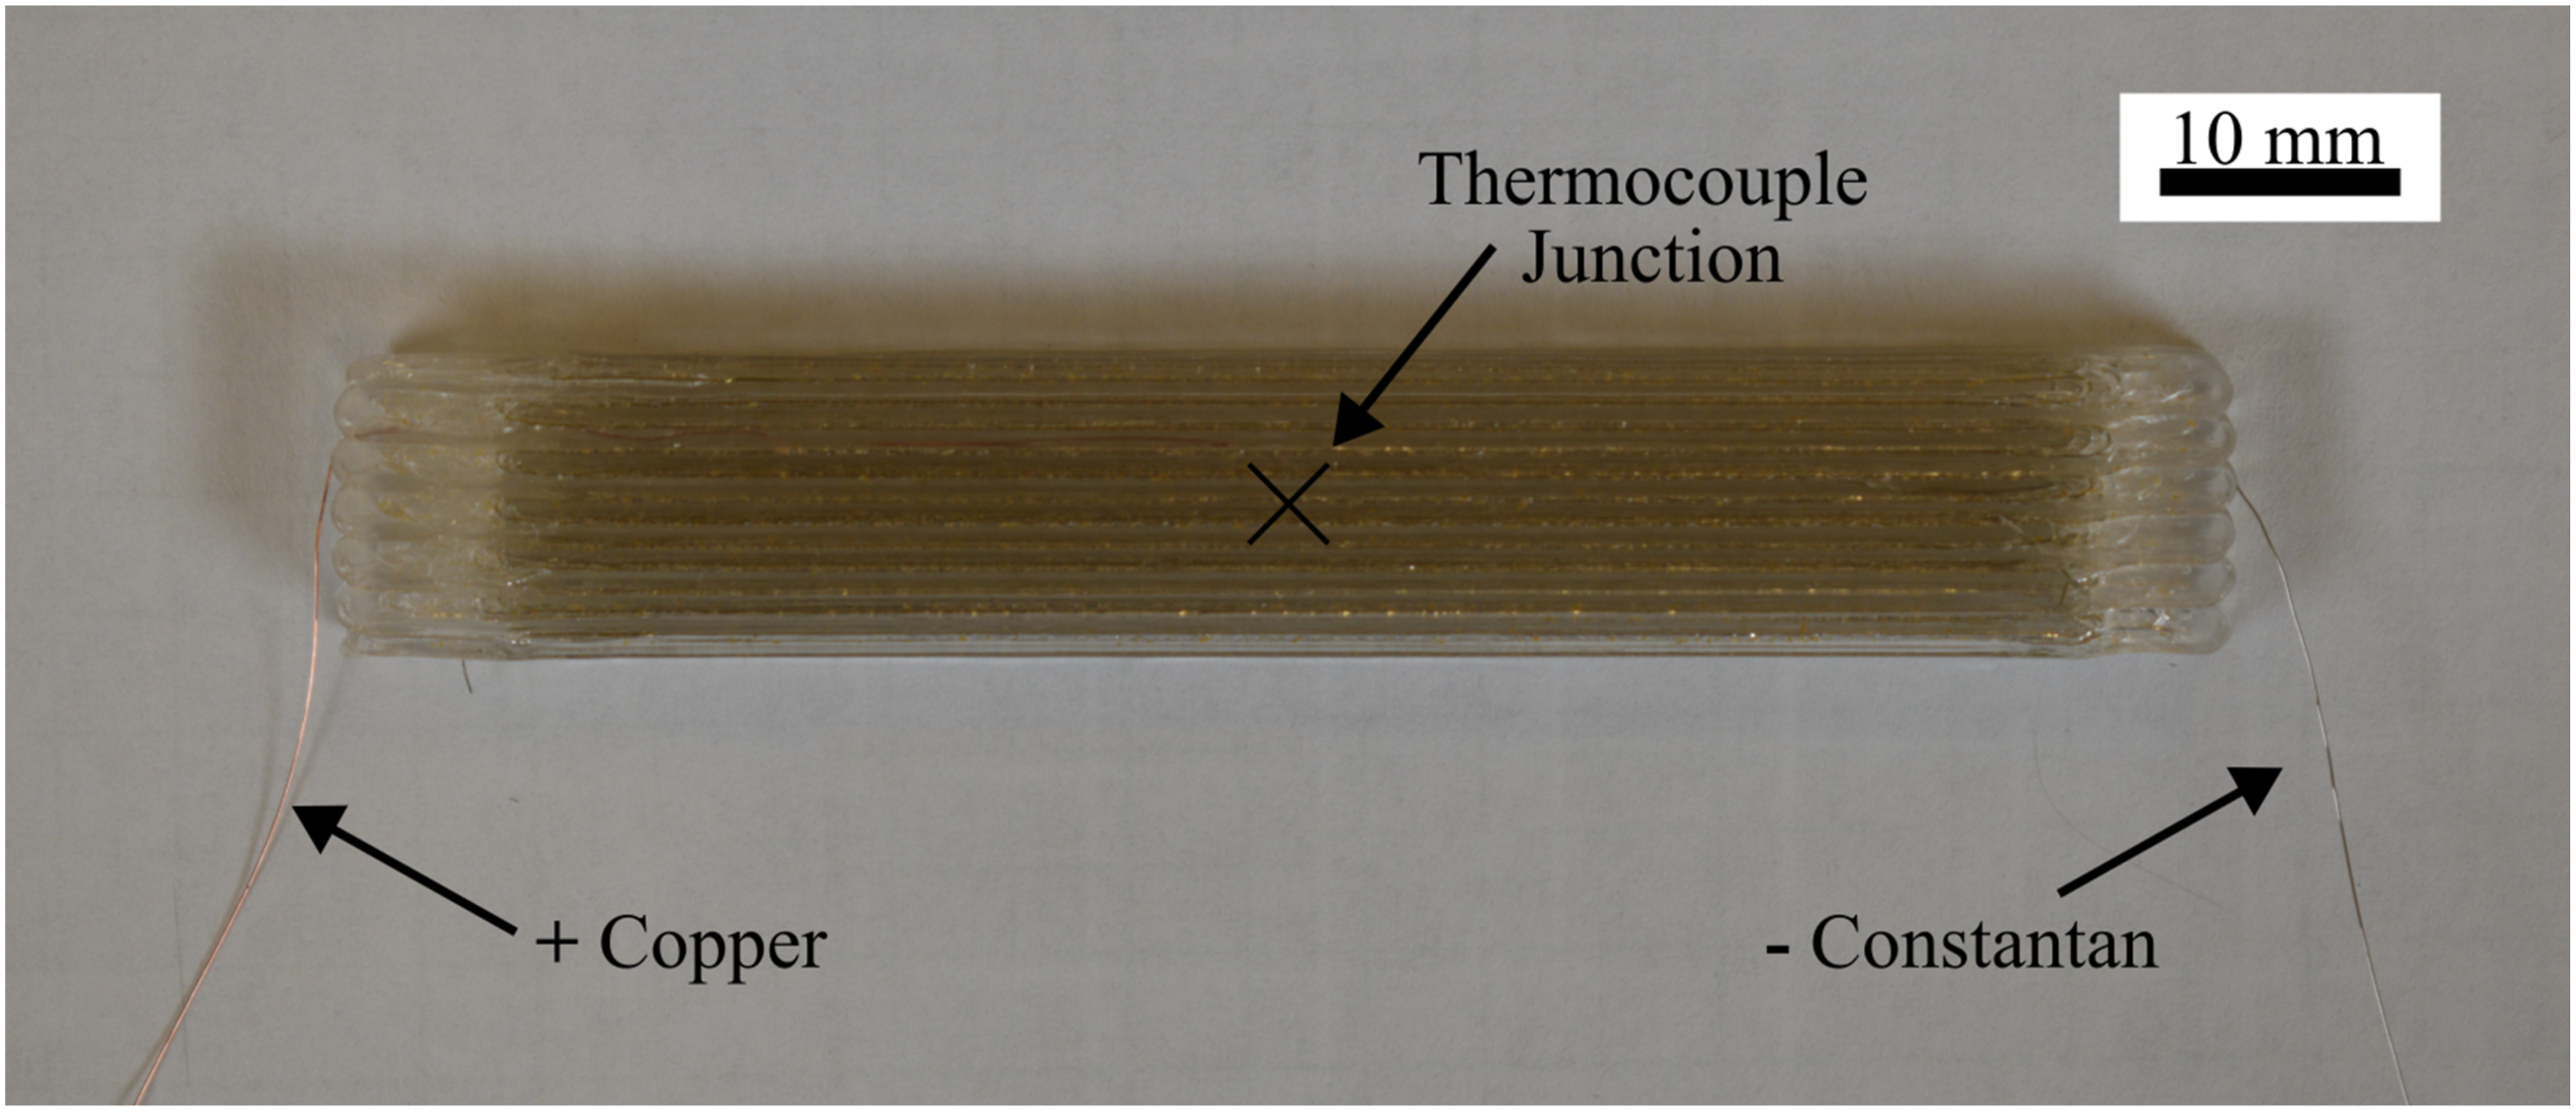
Optical microscopy & image processing
Samples were cut and mounted in clear epoxy (West Systems 105 Epoxy Resin, West Systems, Michigan, United States). The samples were sequentially ground using 120, 400, 600, 800, and 1200 grit sandpaper discs. Next, they were polished using 1.0 μm followed by 0.05 μm alumina powder. After grinding and polishing, optical microscopy with 2.5× magnification was performed on the samples to view the cross-section of the samples (ZEISS Axiocam 506 color, Axio Imager 2, Zeiss Group, Baden-Württemberg, Germany). Cross-section microscope images of samples were stitched together with a 25% overlap using image processing software (ImageJ, National Institutes of Health, Maryland, United States). The image processing steps for sample type A are shown in Figure 7. Image processing steps: (a) optical microscope image of unprocessed sample with white background for image processing with subsequent (b) cross-section of sample with centroidal axis highlighted for image processing, (c) segmented image of wires, and (d) segmented image of voids.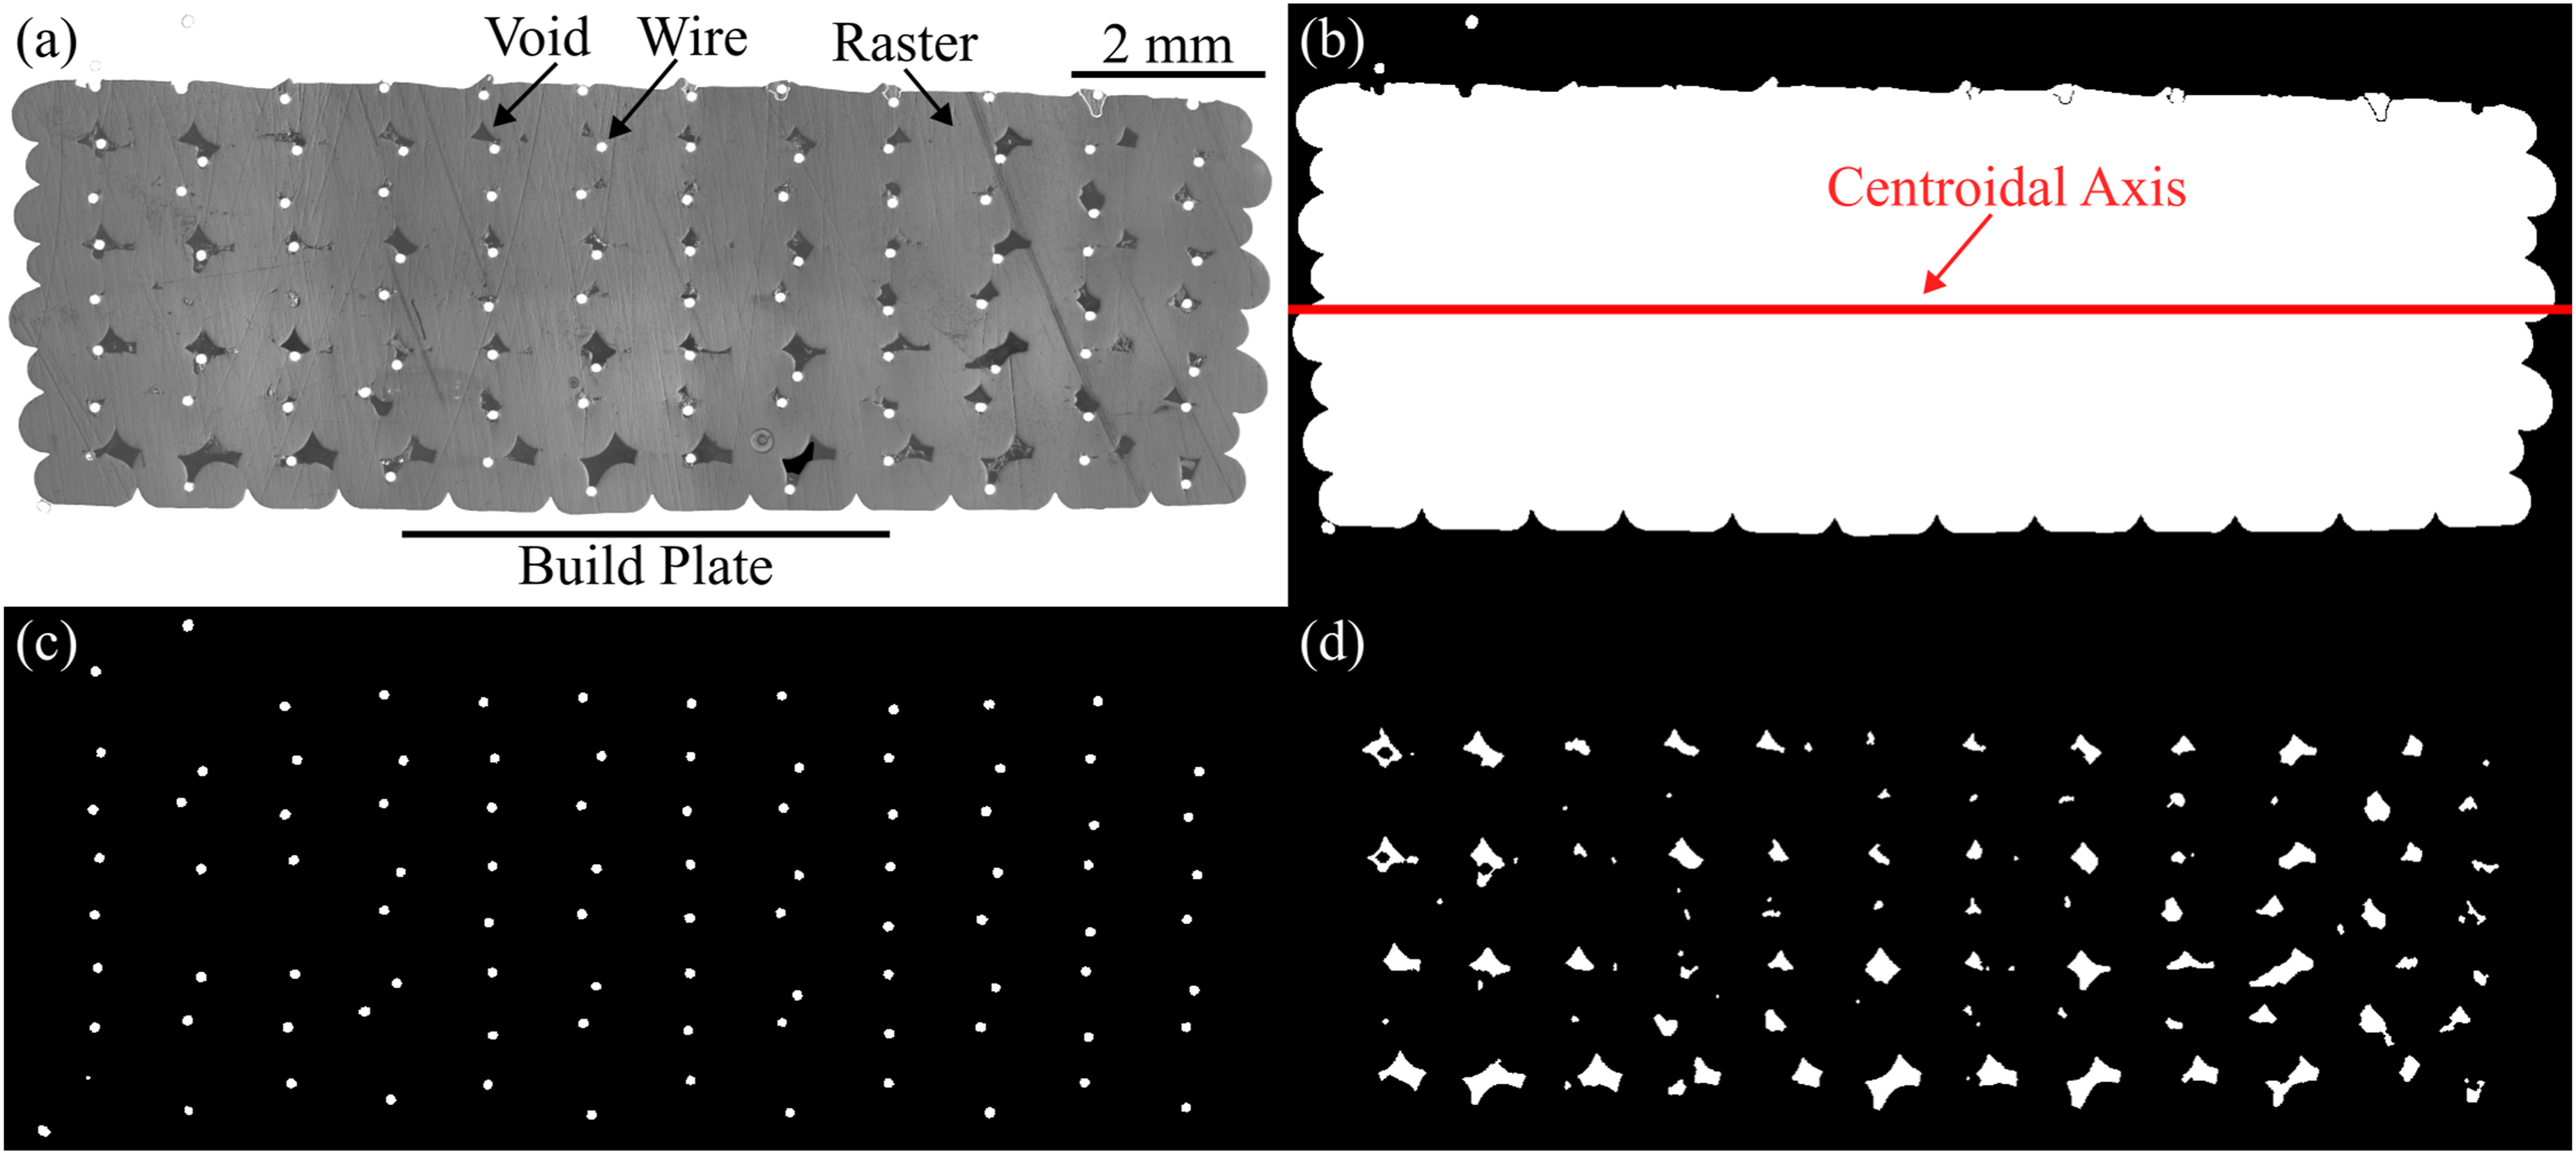
The paintbrush tool in ImageJ was used to fill in voids which were not contrasted in the background of the images or were filled with the alumina powder. The background of the stitched images were painted black for the wire analysis, then inverted to white for the void image analysis to remove the noise caused by the light reflection on the epoxy.
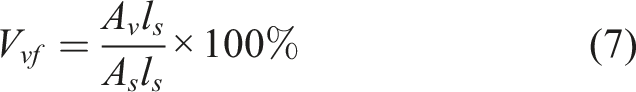
A MATLAB image processing code (MATLAB R2023b, The MathWorks Inc., Massachusetts, United States) was written to determine the wire volume fraction (W vf ) and void volume fraction (V vf ). Thresholding, binarization, and morphological operations were performed to isolate wires and voids in images for processing. Histogram equalization and a median filter were applied to void images as necessary to enhance contrast between the voids and rasters, enabling more effective processing. The cross-section of the sample was isolated by thresholding, and the centroidal axis for the samples were found using the regionprops function in MATLAB (Figure 7(b)).
The regionprops function in MATLAB was used to determine the areas of the wires (Figure 7(c)) and voids (Figure 7(d)) to calculate the W
vf
and V
vf
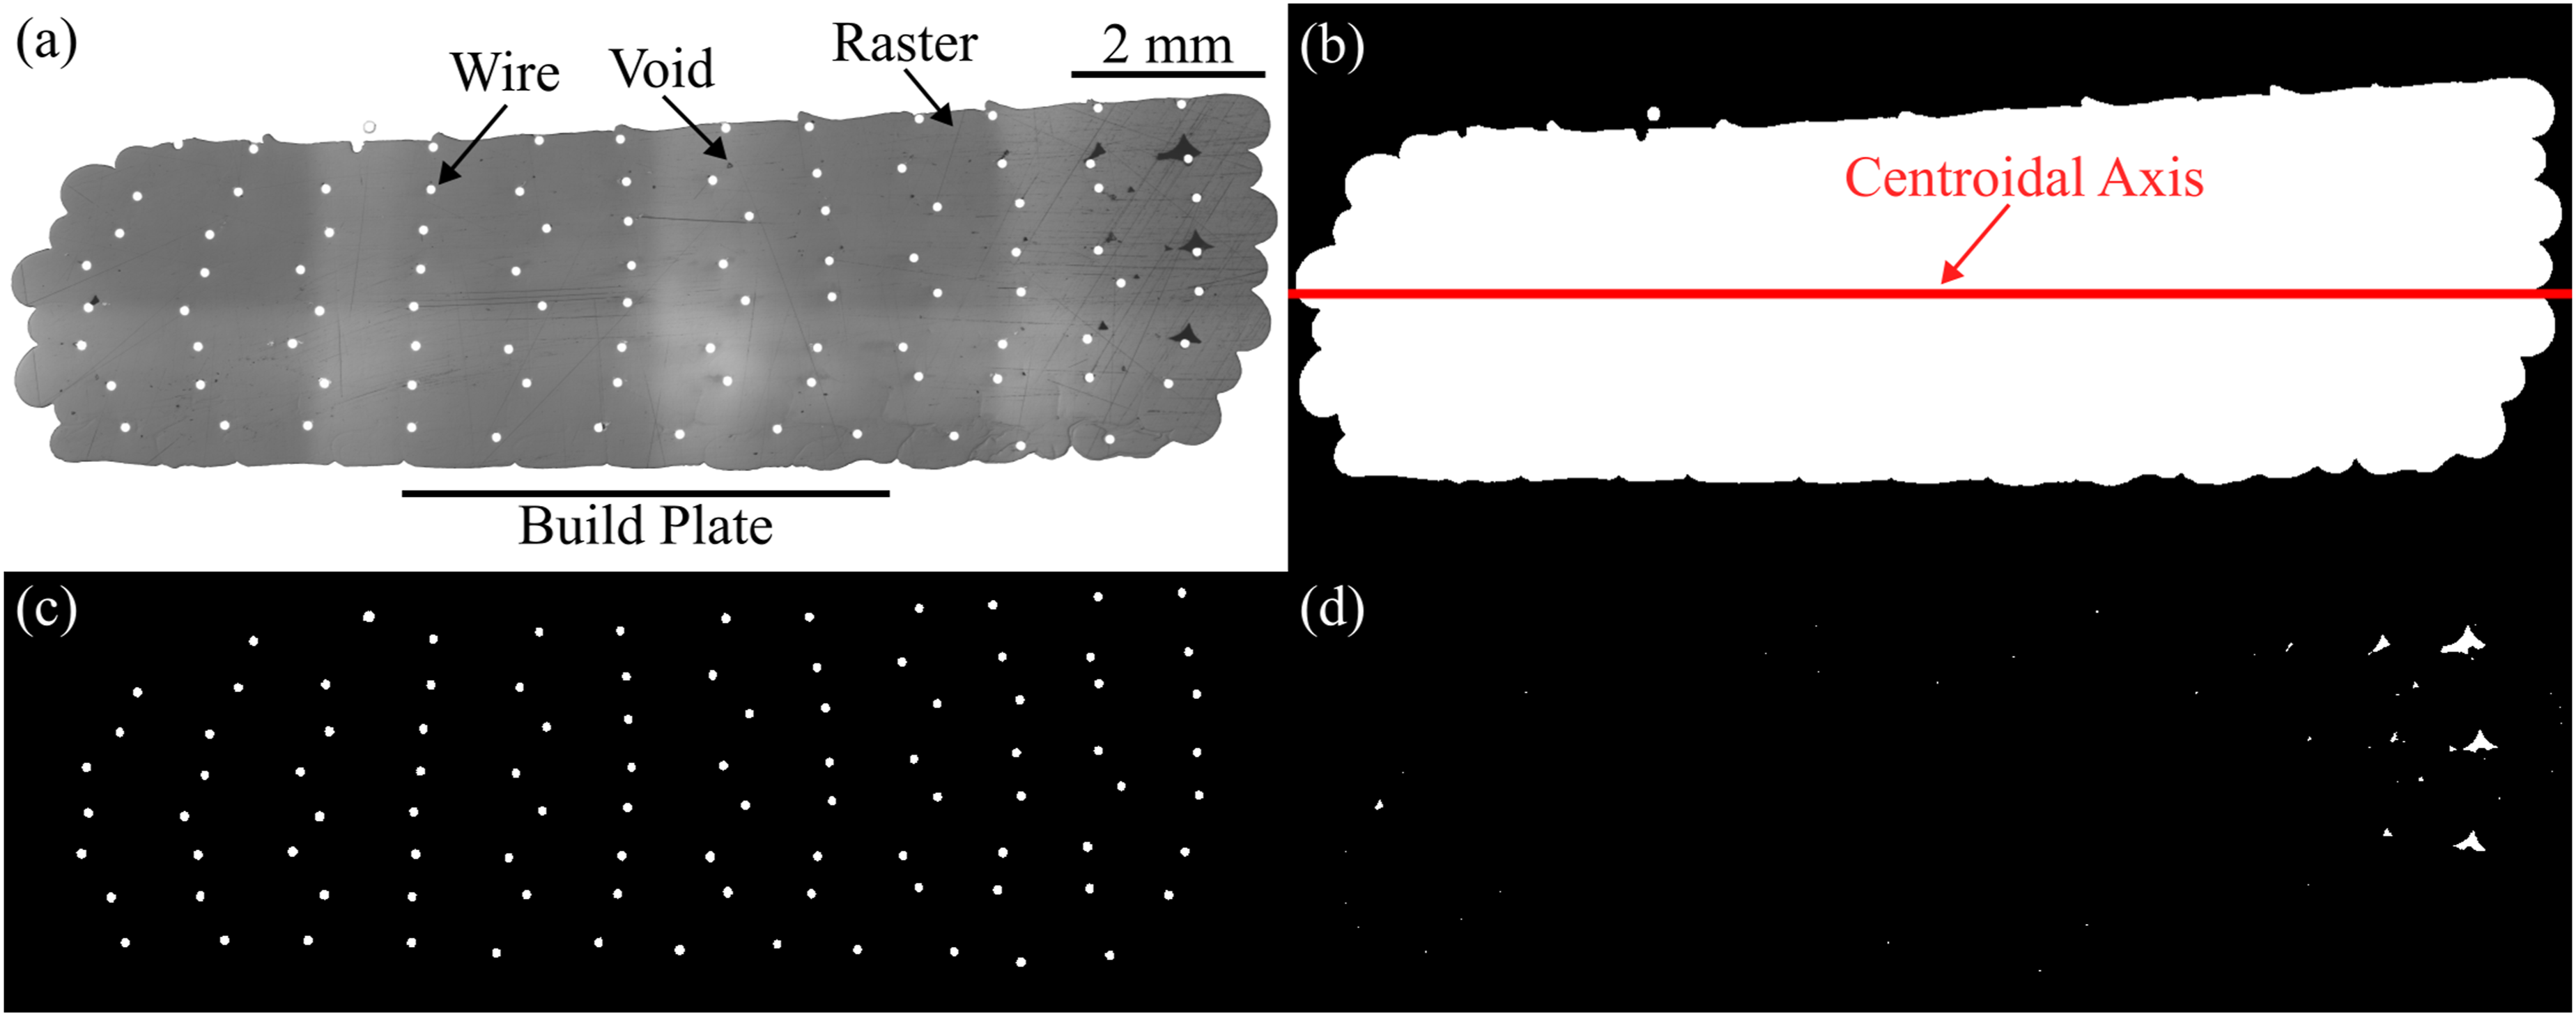
, respectively. The location of the centroid of each void relative to the centroidal axis of the sample was found using regionprops to determine the effect of the consolidation procedure on the size of the voids relative to their location. The image processing steps for sample type B and sample type C can be seen in Figures 8 and 9, respectively. Image processing steps: (a) optical microscope image of hot-pressed sample with white background for image processing with subsequent (b) cross-section of sample with centroidal axis highlighted for image processing, (c) segmented image of wires, and (d) segmented image of voids. Image processing steps: (a) optical microscope image of consolidated sample with white background for image processing with subsequent (b) cross-section of sample with centroidal axis highlighted for image processing, (c) segmented image of wires, and (d) segmented image of voids.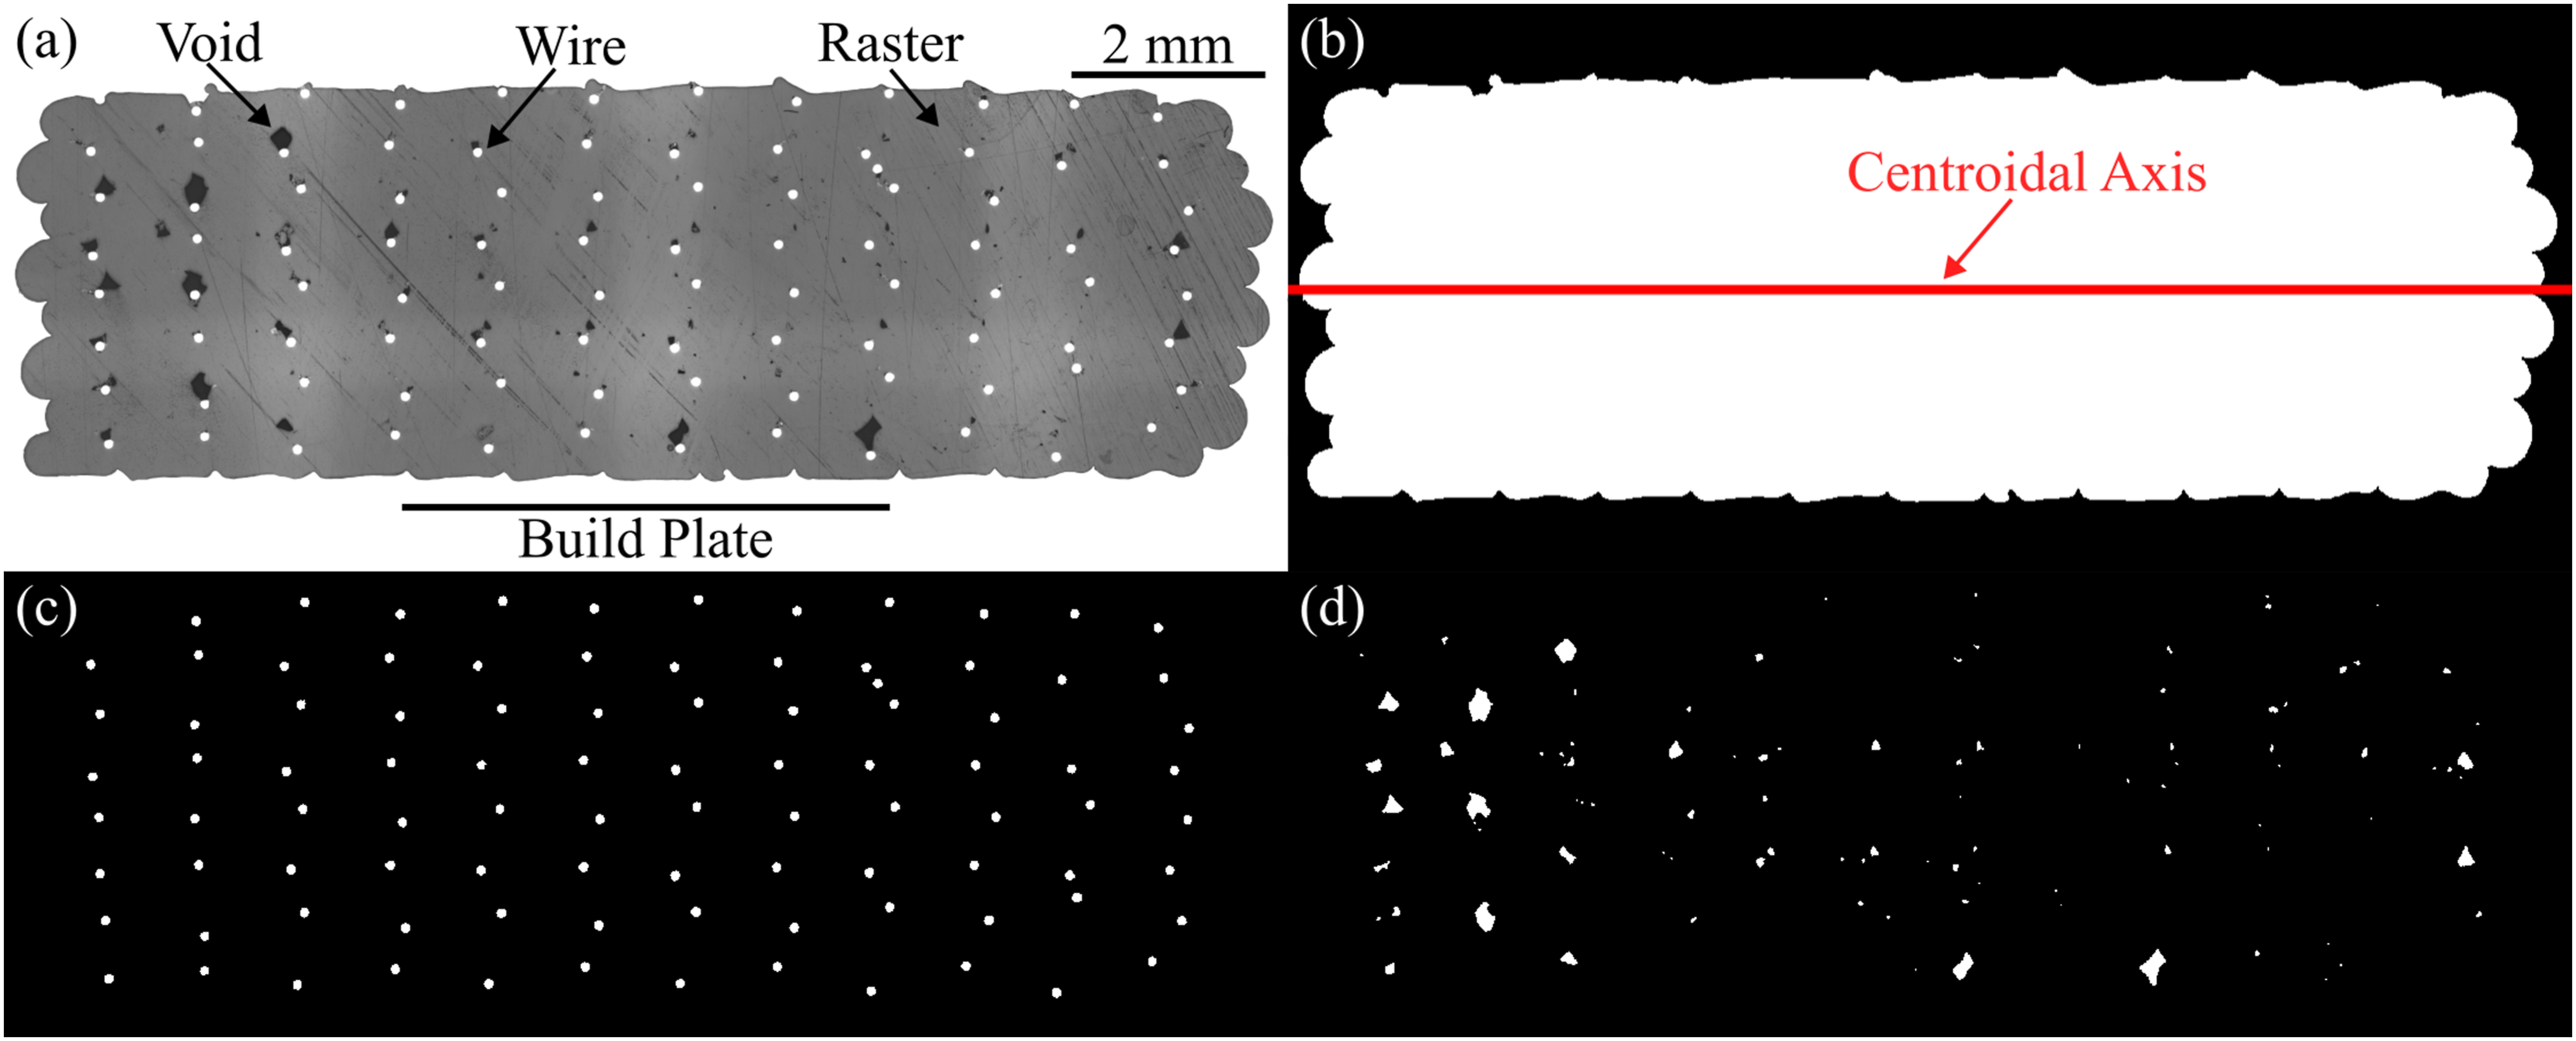
The W
vf
and V
vf
are given by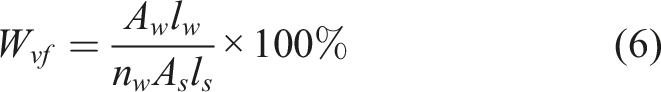
Three-point flexural testing
Three-point flexural tests were performed according to ASTM D7264 to obtain the flexural stress–strain graph and determine the flexural strength and stiffness of samples. A support span-to-thickness ratio of 16:1 was used instead of the typical 32:1
36
to keep the samples within the dimensions of the compacting aluminum platens. Given the sample thickness of 4 mm, the support span was set to 64 mm. The length of the samples was 80 mm, which was approximately 20% longer than the support span length. The samples were placed on the three-point flexural fixture and the same UTM (UTM; ElectroPuls E3000, Instron, Massachusetts, United States) used for consolidation, with a loading rate of 1 mm/min (Figure 10). Schematic of three-point flexural test setup.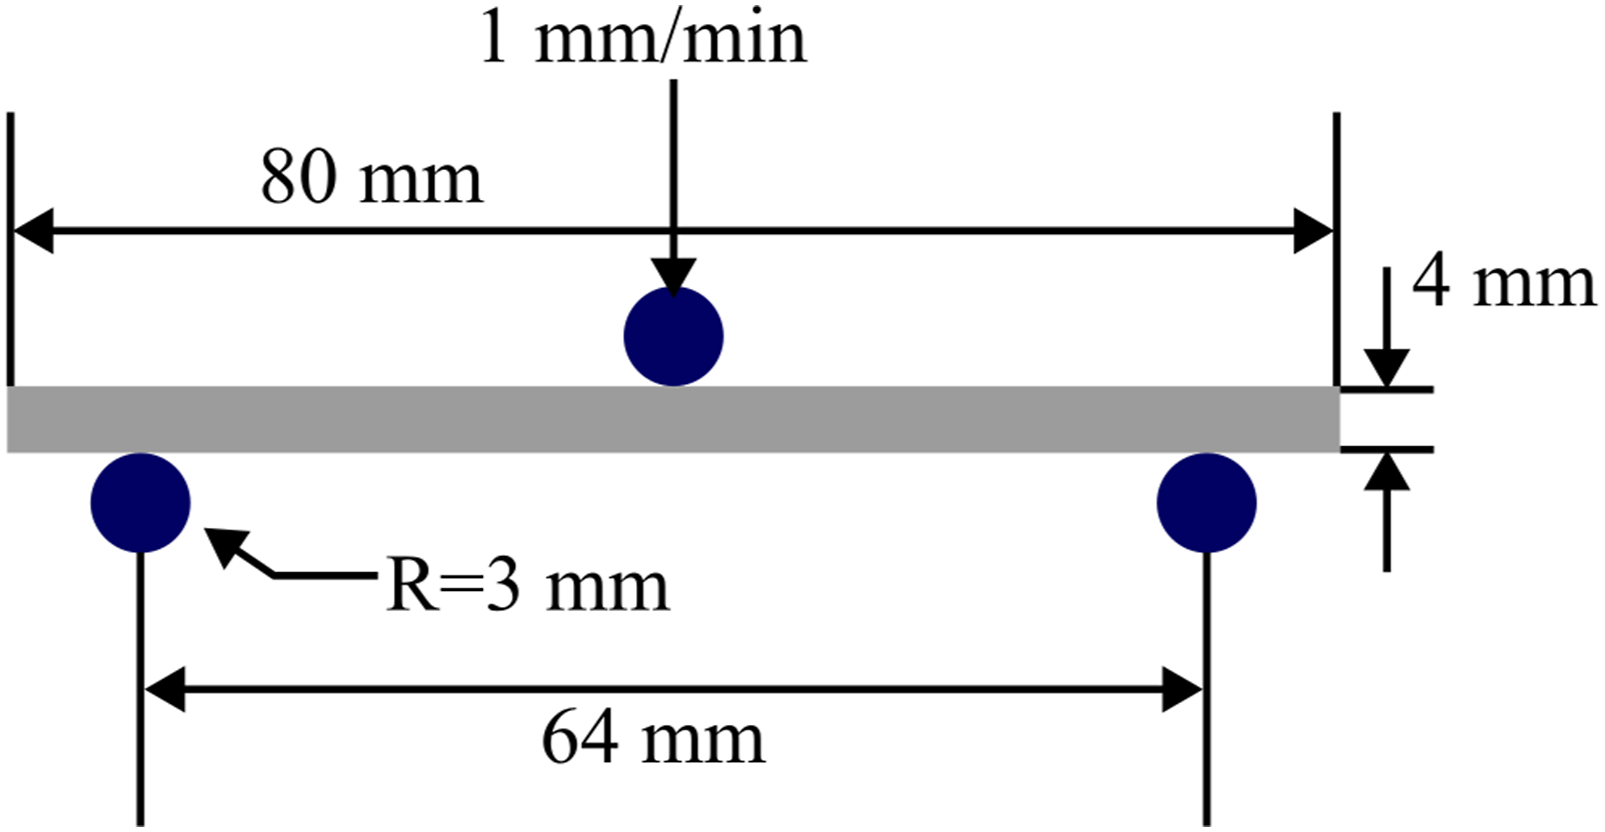
The geometric area moment of inertia was calculated for each sample, and the stress was calculated using the flexure formula. The face of the loading nose was painted a flat black, then speckled with white paint by an airbrush. A digital image correlation (DIC) setup was used to track the displacement of the loading nose and was used as the mid-span deflection (Figure 15). A LaVision camera (Imager M-Lite 5M, LaVision, Göttingen, Germany) equipped with a 50 mm lens (MVL50M23 50 mm, Navitar, New York, USA) captured images of the flexural test at a frame rate of 5 fps. A working distance of 300 mm between the camera and the loading nose was necessary to yield a 50 mm × 38 mm field of view to capture the loading nose at the beginning and end of the test. LaVision’s Davis 10.2.1 software was used to track the location of the speckles on the roller with a subset window and subset size of 29 px and 10 px, respectively.
Assuming the unidirectional samples are orthotropic, the flexural stress and strain were calculated using the homogenous beam theory formulae from ASTM D7264
36
given by
Results & discussion
Thermal model validation
Due to the one-term approximation relationship used, the analytical model was plotted for Fourier numbers 0.2 and greater, which, for the sample thickness in this study, starts at time t = 15.5 s.
38
Figure 11 shows the plot of the analytical model with the experimental results for (a) the 1D conduction thermal model, (b) the resistive heating experimental results, and (c) the consolidation procedure experimental results. (a) 1D conduction analytical model compared with experimental results, (b) resistive heating temperature profile experimental results, and (c) consolidation temperature profile experimental results.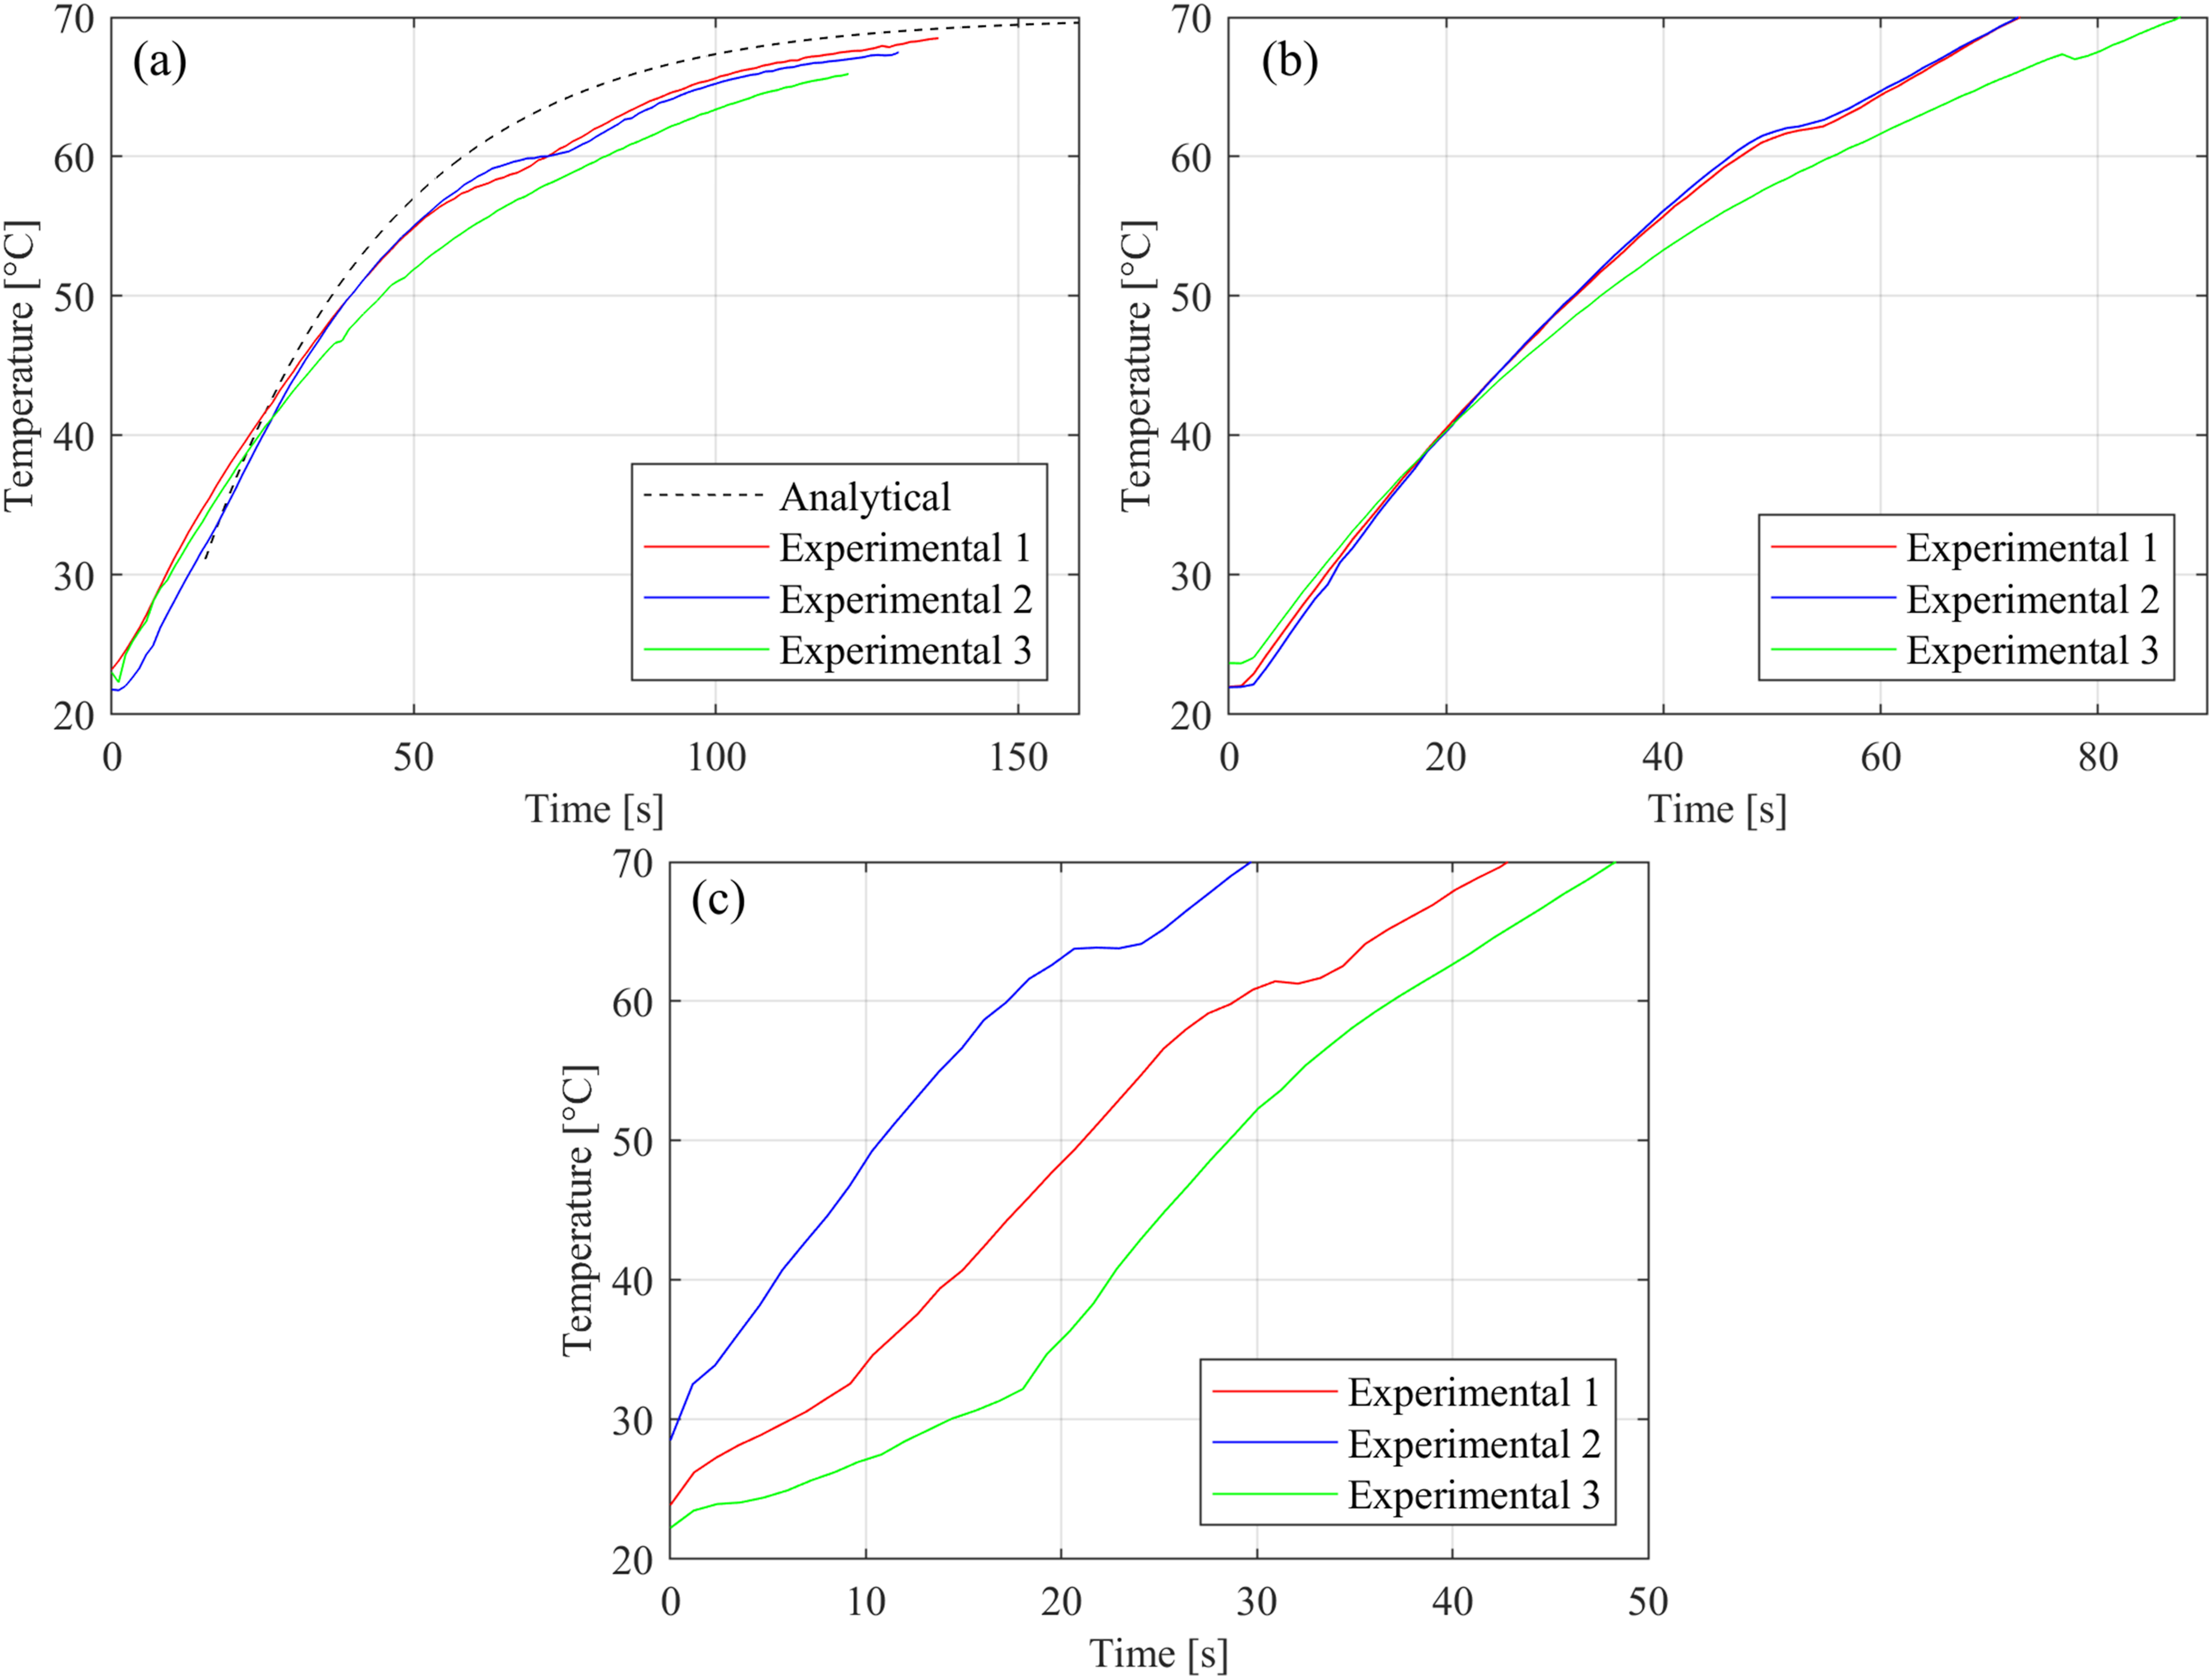
The theoretical times for the 1D transient conduction and resistive heating models to reach 65°C were 79.9 s and 76.1 s, respectively. The model for transient conduction underpredicted the results, on average requiring 101.9 s ± 8.9 s. A chi-squared goodness-of-fit test was used to calculate an average root mean squared error of 8.8 s between the analytical and experimental results of the transient conduction model. 41 The discrepancy in the analytical model is due to the assumption that all sample surfaces are held at 70°C from t = 0 s. In the experimental setup, 73.7% of the surface area was in contact with the heated platens during the procedure. The time required for resistive heating was shorter than expected, with an average of 63.8 s ± 4.8 s. This discrepancy is due to the fact that the model applied equal thermal energy in joules from both the 1D transient conduction and resistive heating processes. While the time to heat the samples was assumed to be the same, the temperature response from the resistive heating was more linear and theoretically infinite, as opposed to that of the 1D conduction model, which is asymptotic at the temperature of the platen, 70°C. This means the temperature response, and therefore the time required to reach 65°C, was shorter than the resistive heating model anticipated. The time for the consolidation procedure, using both the 1D transient conduction and resistive heating to heat the sample resulted in a significantly decreased processing time, at an average of 34.7 s ± 8.9 s.
The one-term approximation used to determine the heat transfer by 1D conduction by (equation (1)) assumes all surfaces of the sample are held at a specific temperature from t = 0 s. As previously stated, the sides of the sample are not in contact with the plates, causing a discrepancy in the analytical model. The average thickness of samples tested was 4.24 mm. Thinner samples should have higher accuracy compared to the 1D conduction thermal model. Molds where each surface of the sample is heated simultaneously could also be used to increase the accuracy of the 1D conduction thermal model.
Optical microscopy & image processing
To view the images of the cross-sections of different sample types alongside their respective void segmentation, Figure 12 displays the images of the different sample types from the optical microscopy at 2.5× magnification. The 2.5× magnification of the Zeiss Axiocam 506 color provided a scale of 1.82 µm/px (0.00182 mm/px). This is to see the difference in void content between sample types more clearly. Cross-sectional microscope images at 2.5× magnification of samples identifying wires, voids, and polymer rasters: (a) unprocessed sample, (b) unprocessed sample segmented voids, (c) hot-pressed sample, (d) hot-pressed sample segmented voids, (e) consolidated sample, and (f) consolidated sample segmented voids.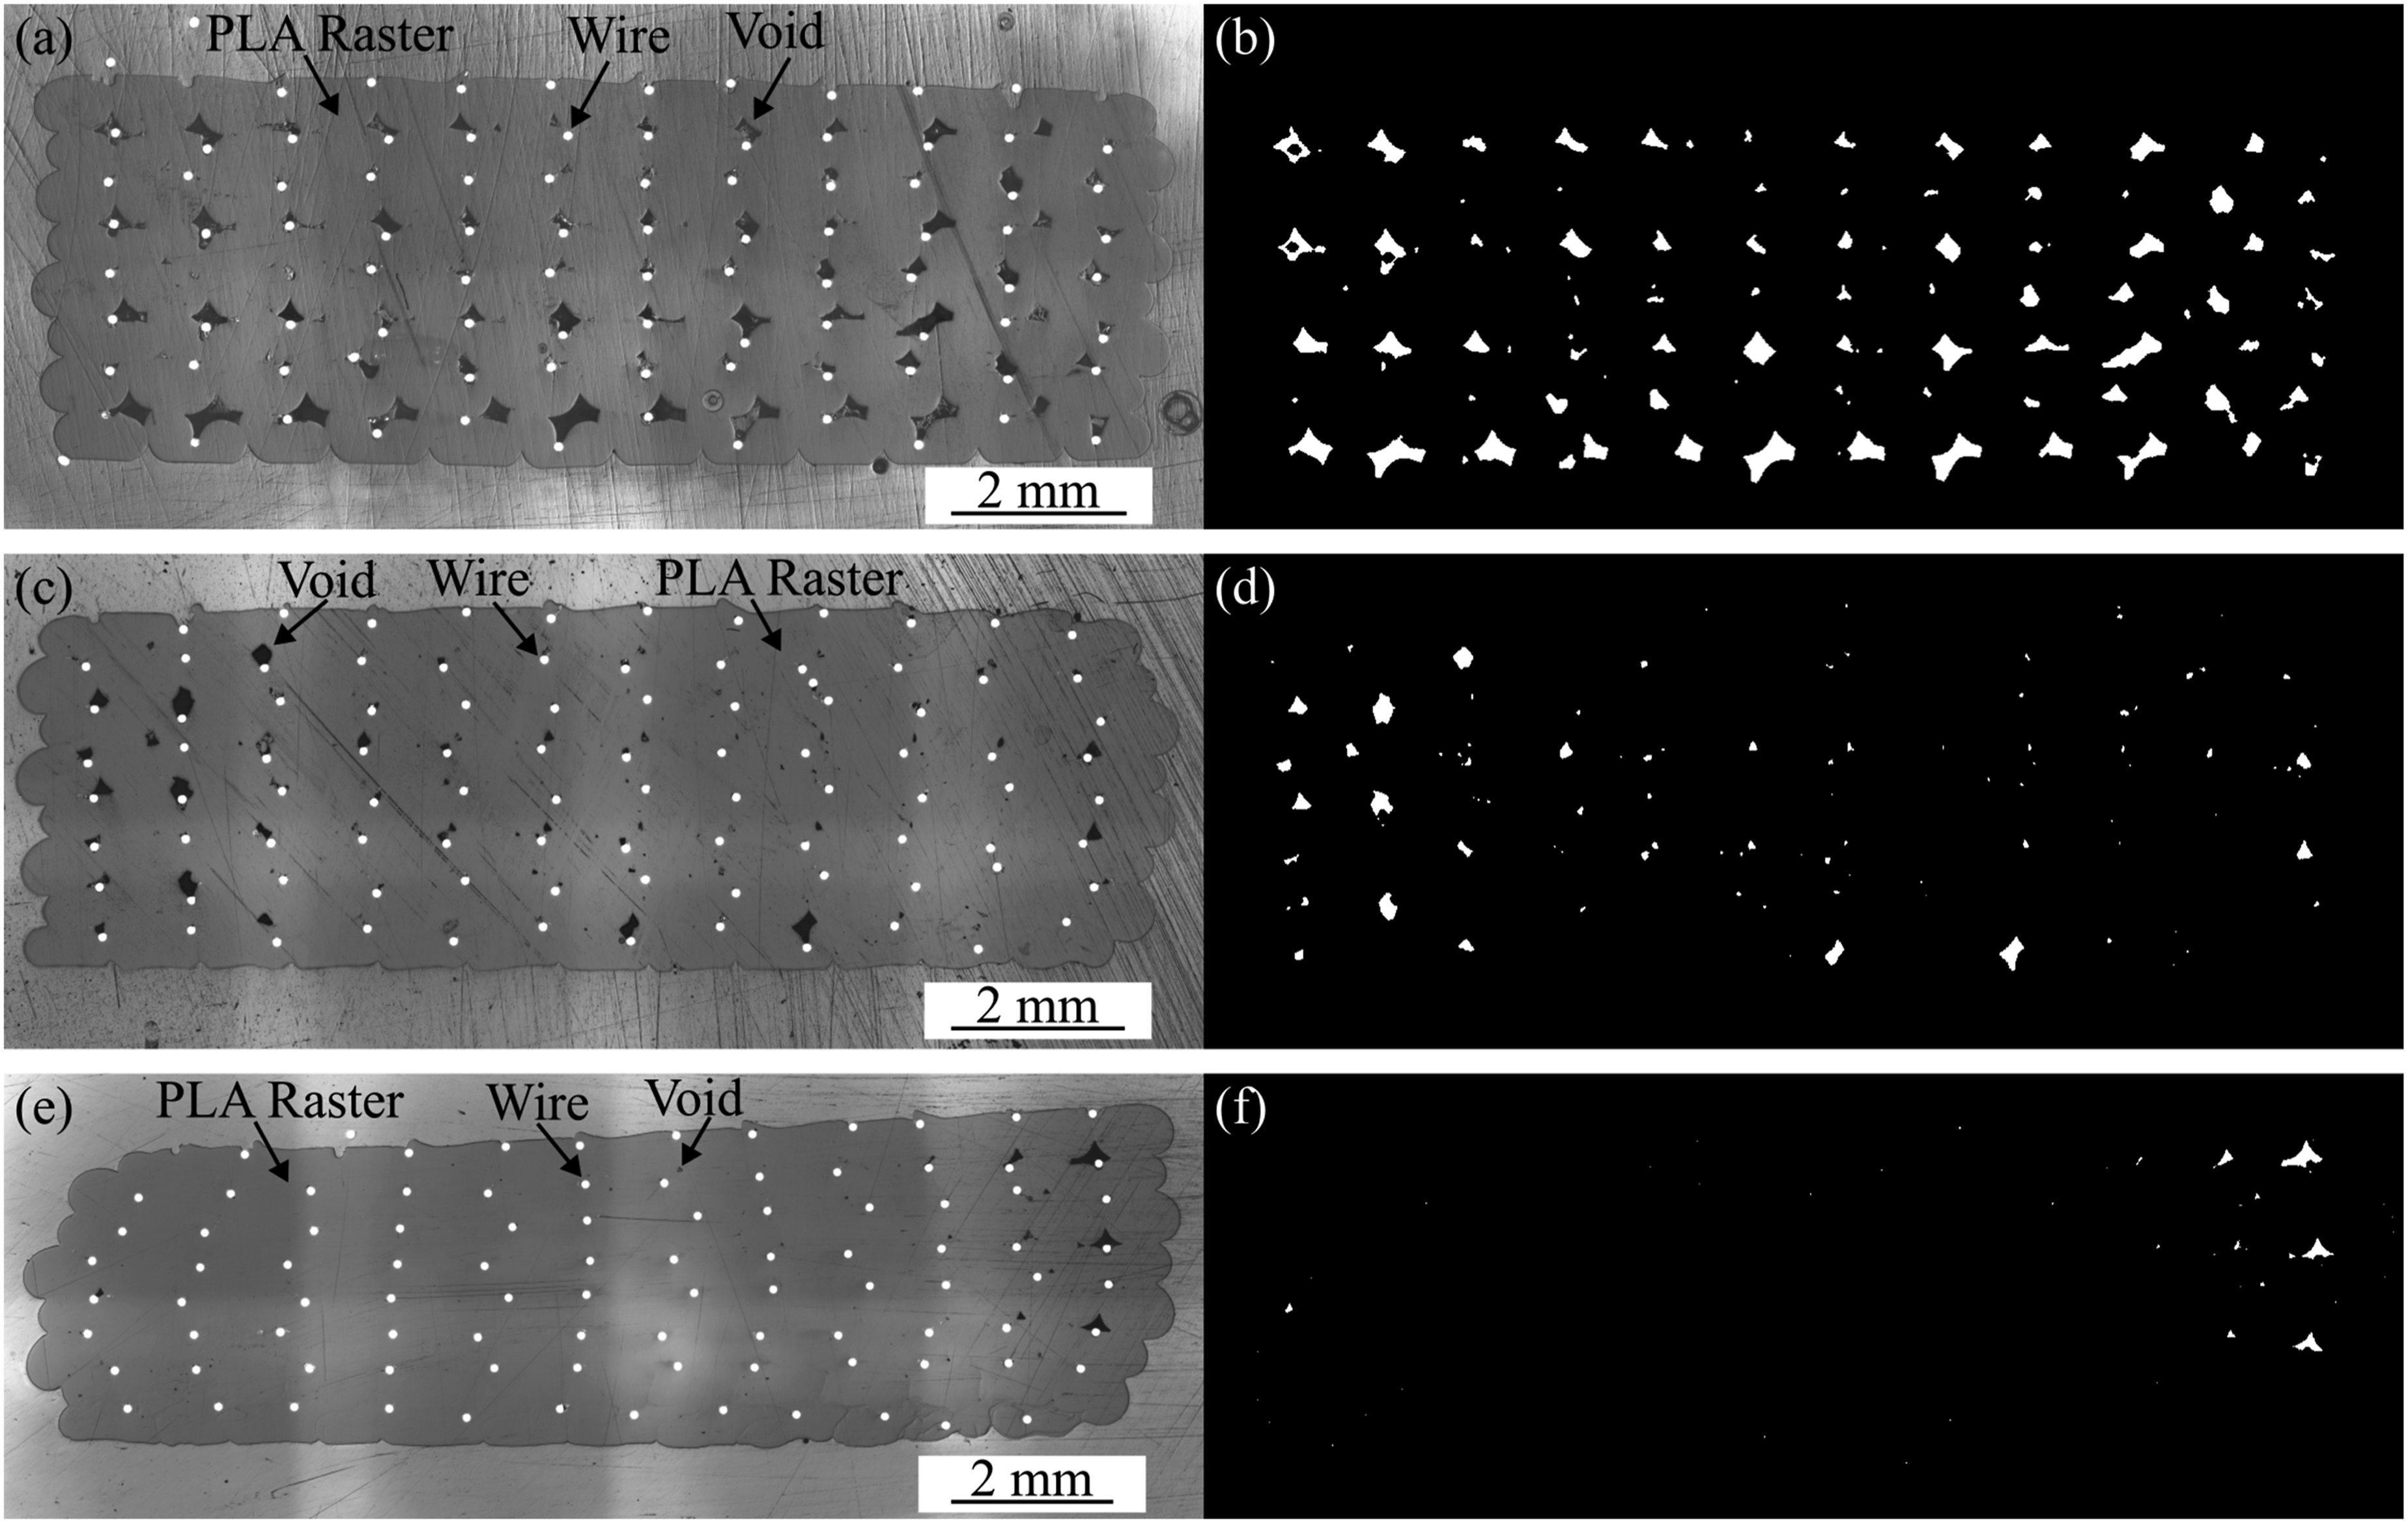
As seen in Figure 12(a) and (e), the wires shift from being uniformly distributed to shifting in a more random pattern after being subjected to the consolidation procedure because the polymer rasters are in a viscous state. The sample’s cross-section is also observed to be non-horizontal due to platen misalignment. These cause an uneven distribution of the load-bearing of a sample with a small wire volume fraction. This low wire volume fraction shows the load is being carried more by the matrix material, and random wire distribution transfers more load distribution to the matrix than a more evenly distributed wire pattern, which can cause lower strength and stiffness. Molds or other lateral confinement tools could prevent the wires from shifting by keeping the viscous polymer raster in place to maintain the cross-sectional geometry, while improving the platen alignment using linear rails to maintain a consistent pressure across the top of the sample would improve the mechanical properties by providing an even surface for even load distribution across the width of the sample during flexural testing.
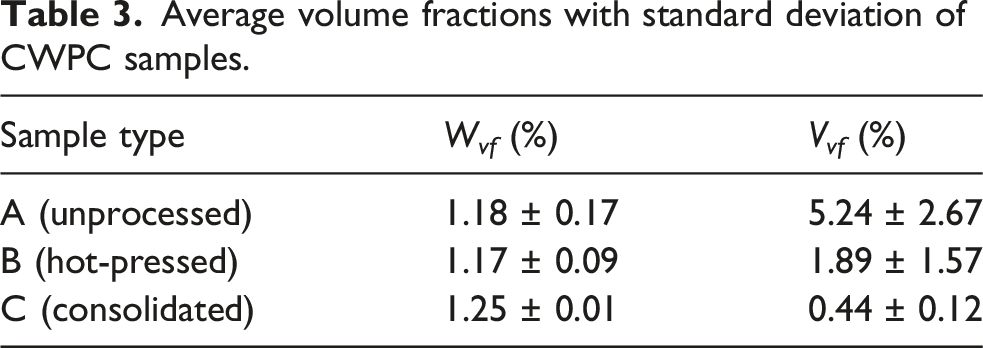
The values for the wire volume and void volume were calculated from the MATLAB image processing results. These were divided by the volume of the composite, based on the image processing results, to find the average W vf and V vf of the three microscope samples per sample type.
Average volume fractions with standard deviation of CWPC samples.
To quantify the void change and the size of the voids through the thickness of the sample, the centroidal axis was used as a reference point, as shown in Figure 7(b). Regionprops was used to determine the coordinates of the centroid of each void. The y-coordinate of the void centroid was subtracted from the centroidal axis y-coordinate to determine the distance between the two; negative values indicate voids below the centroidal axis. Figure 13 shows the results of the cross-sectional areas of the voids relative to their distance from the centroidal axis of the sample. Void area versus the distance from the centroidal axis for: (a) unprocessed samples, (b) hot-pressed samples, and (c) consolidated samples.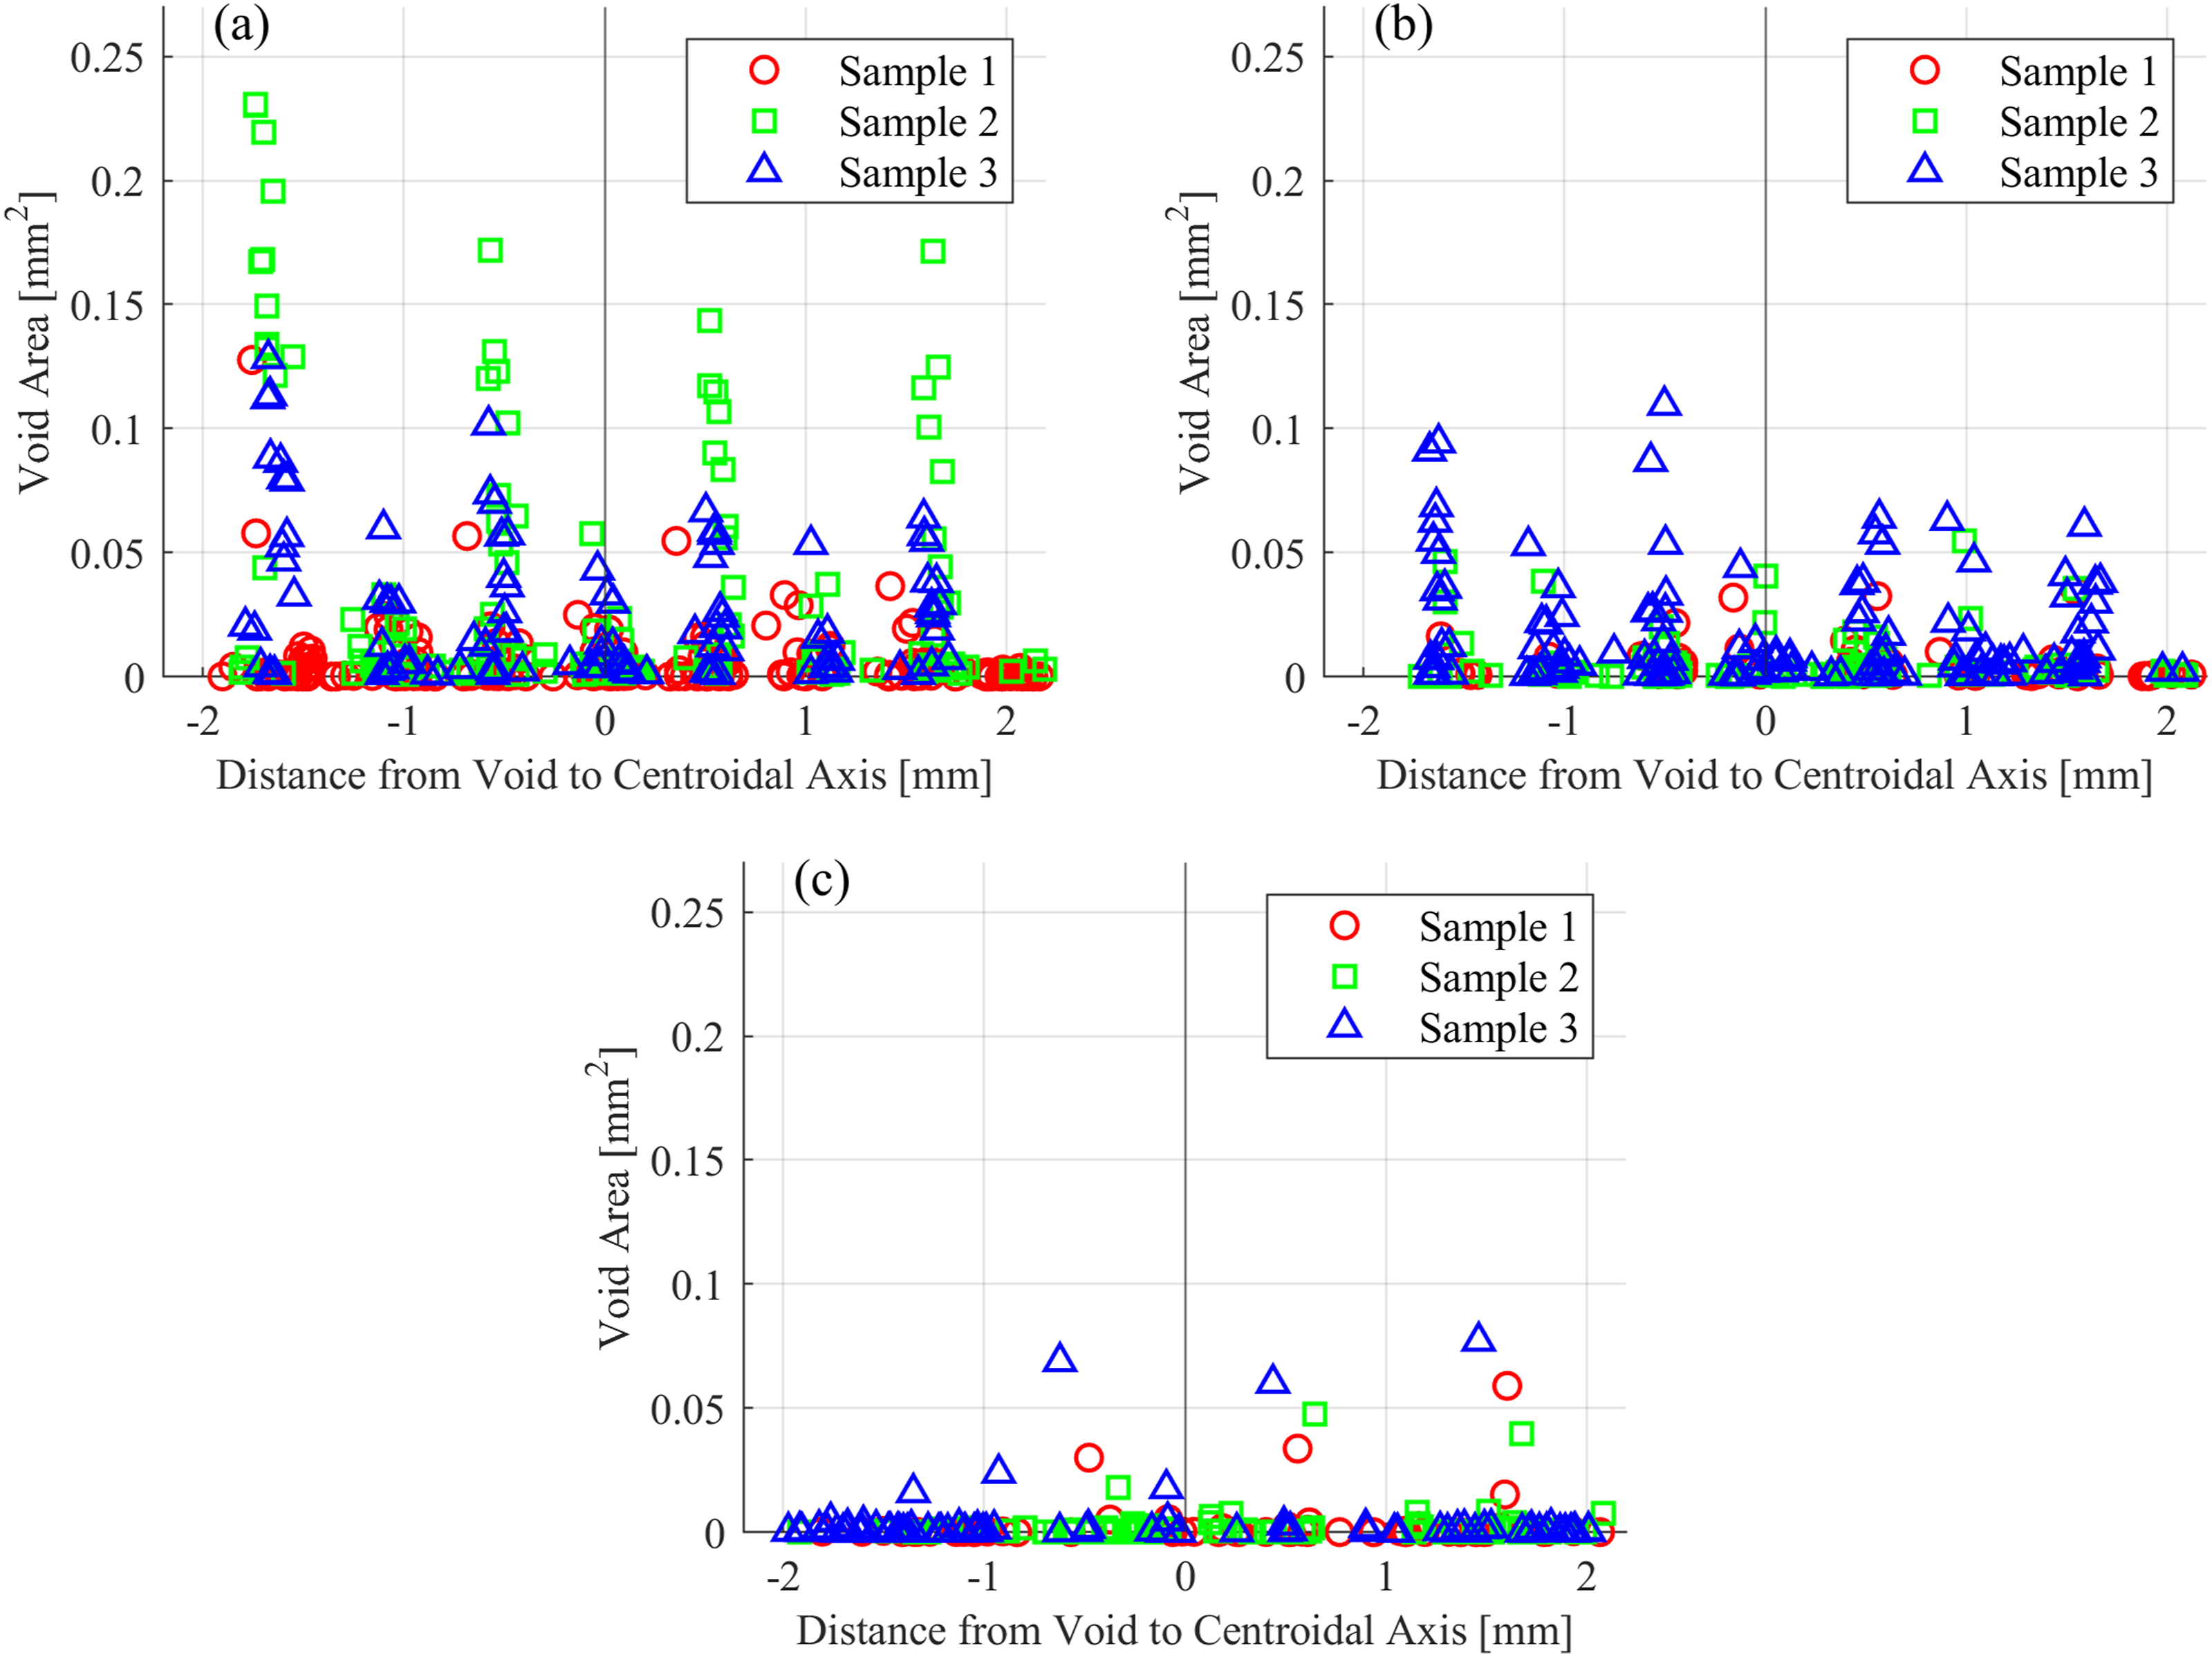
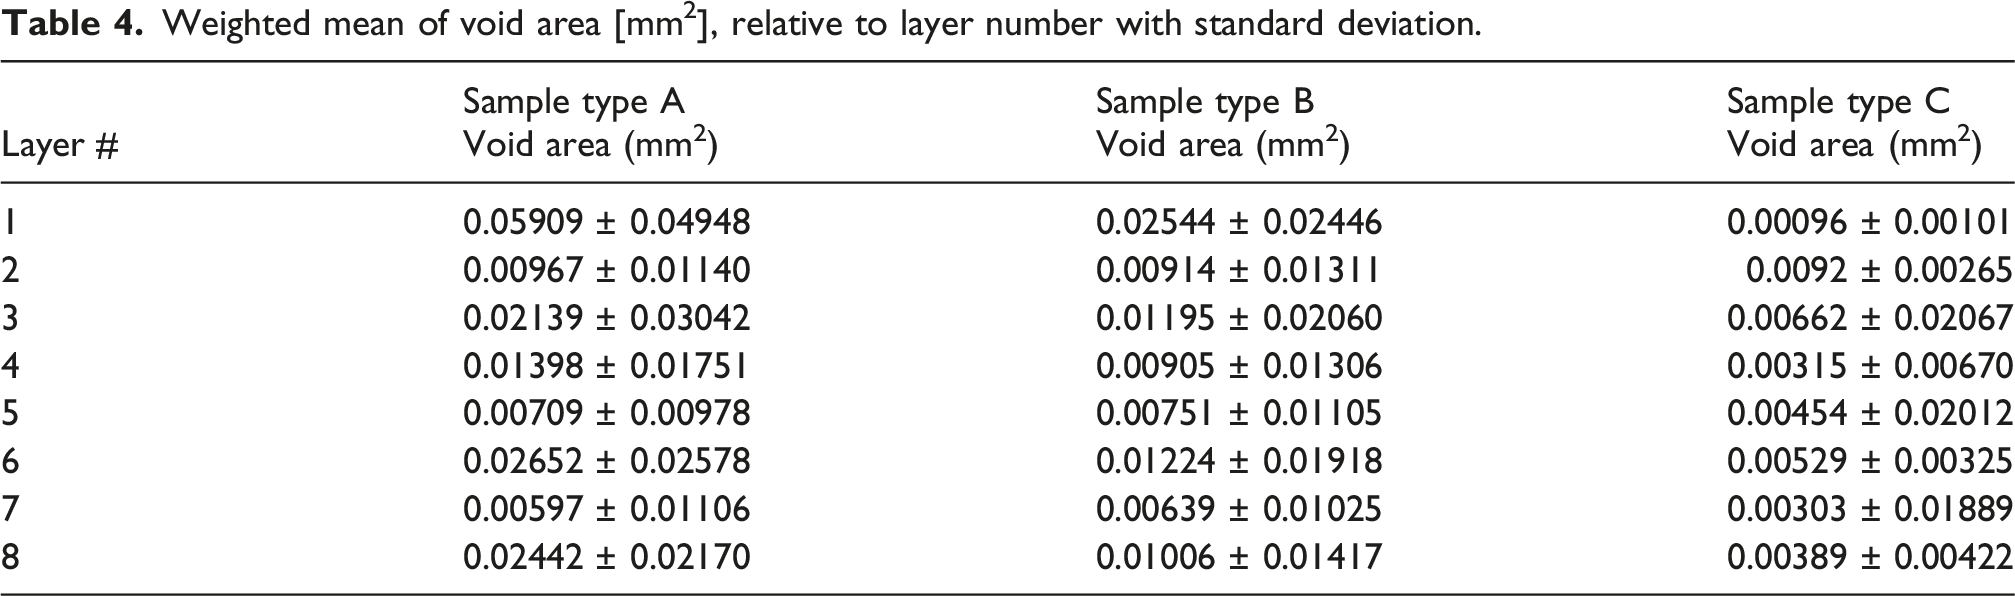
Weighted mean of void area [mm2], relative to layer number with standard deviation.
Material, nozzle diameter, wire diameter and Vvf of literature for comparison to the current study.

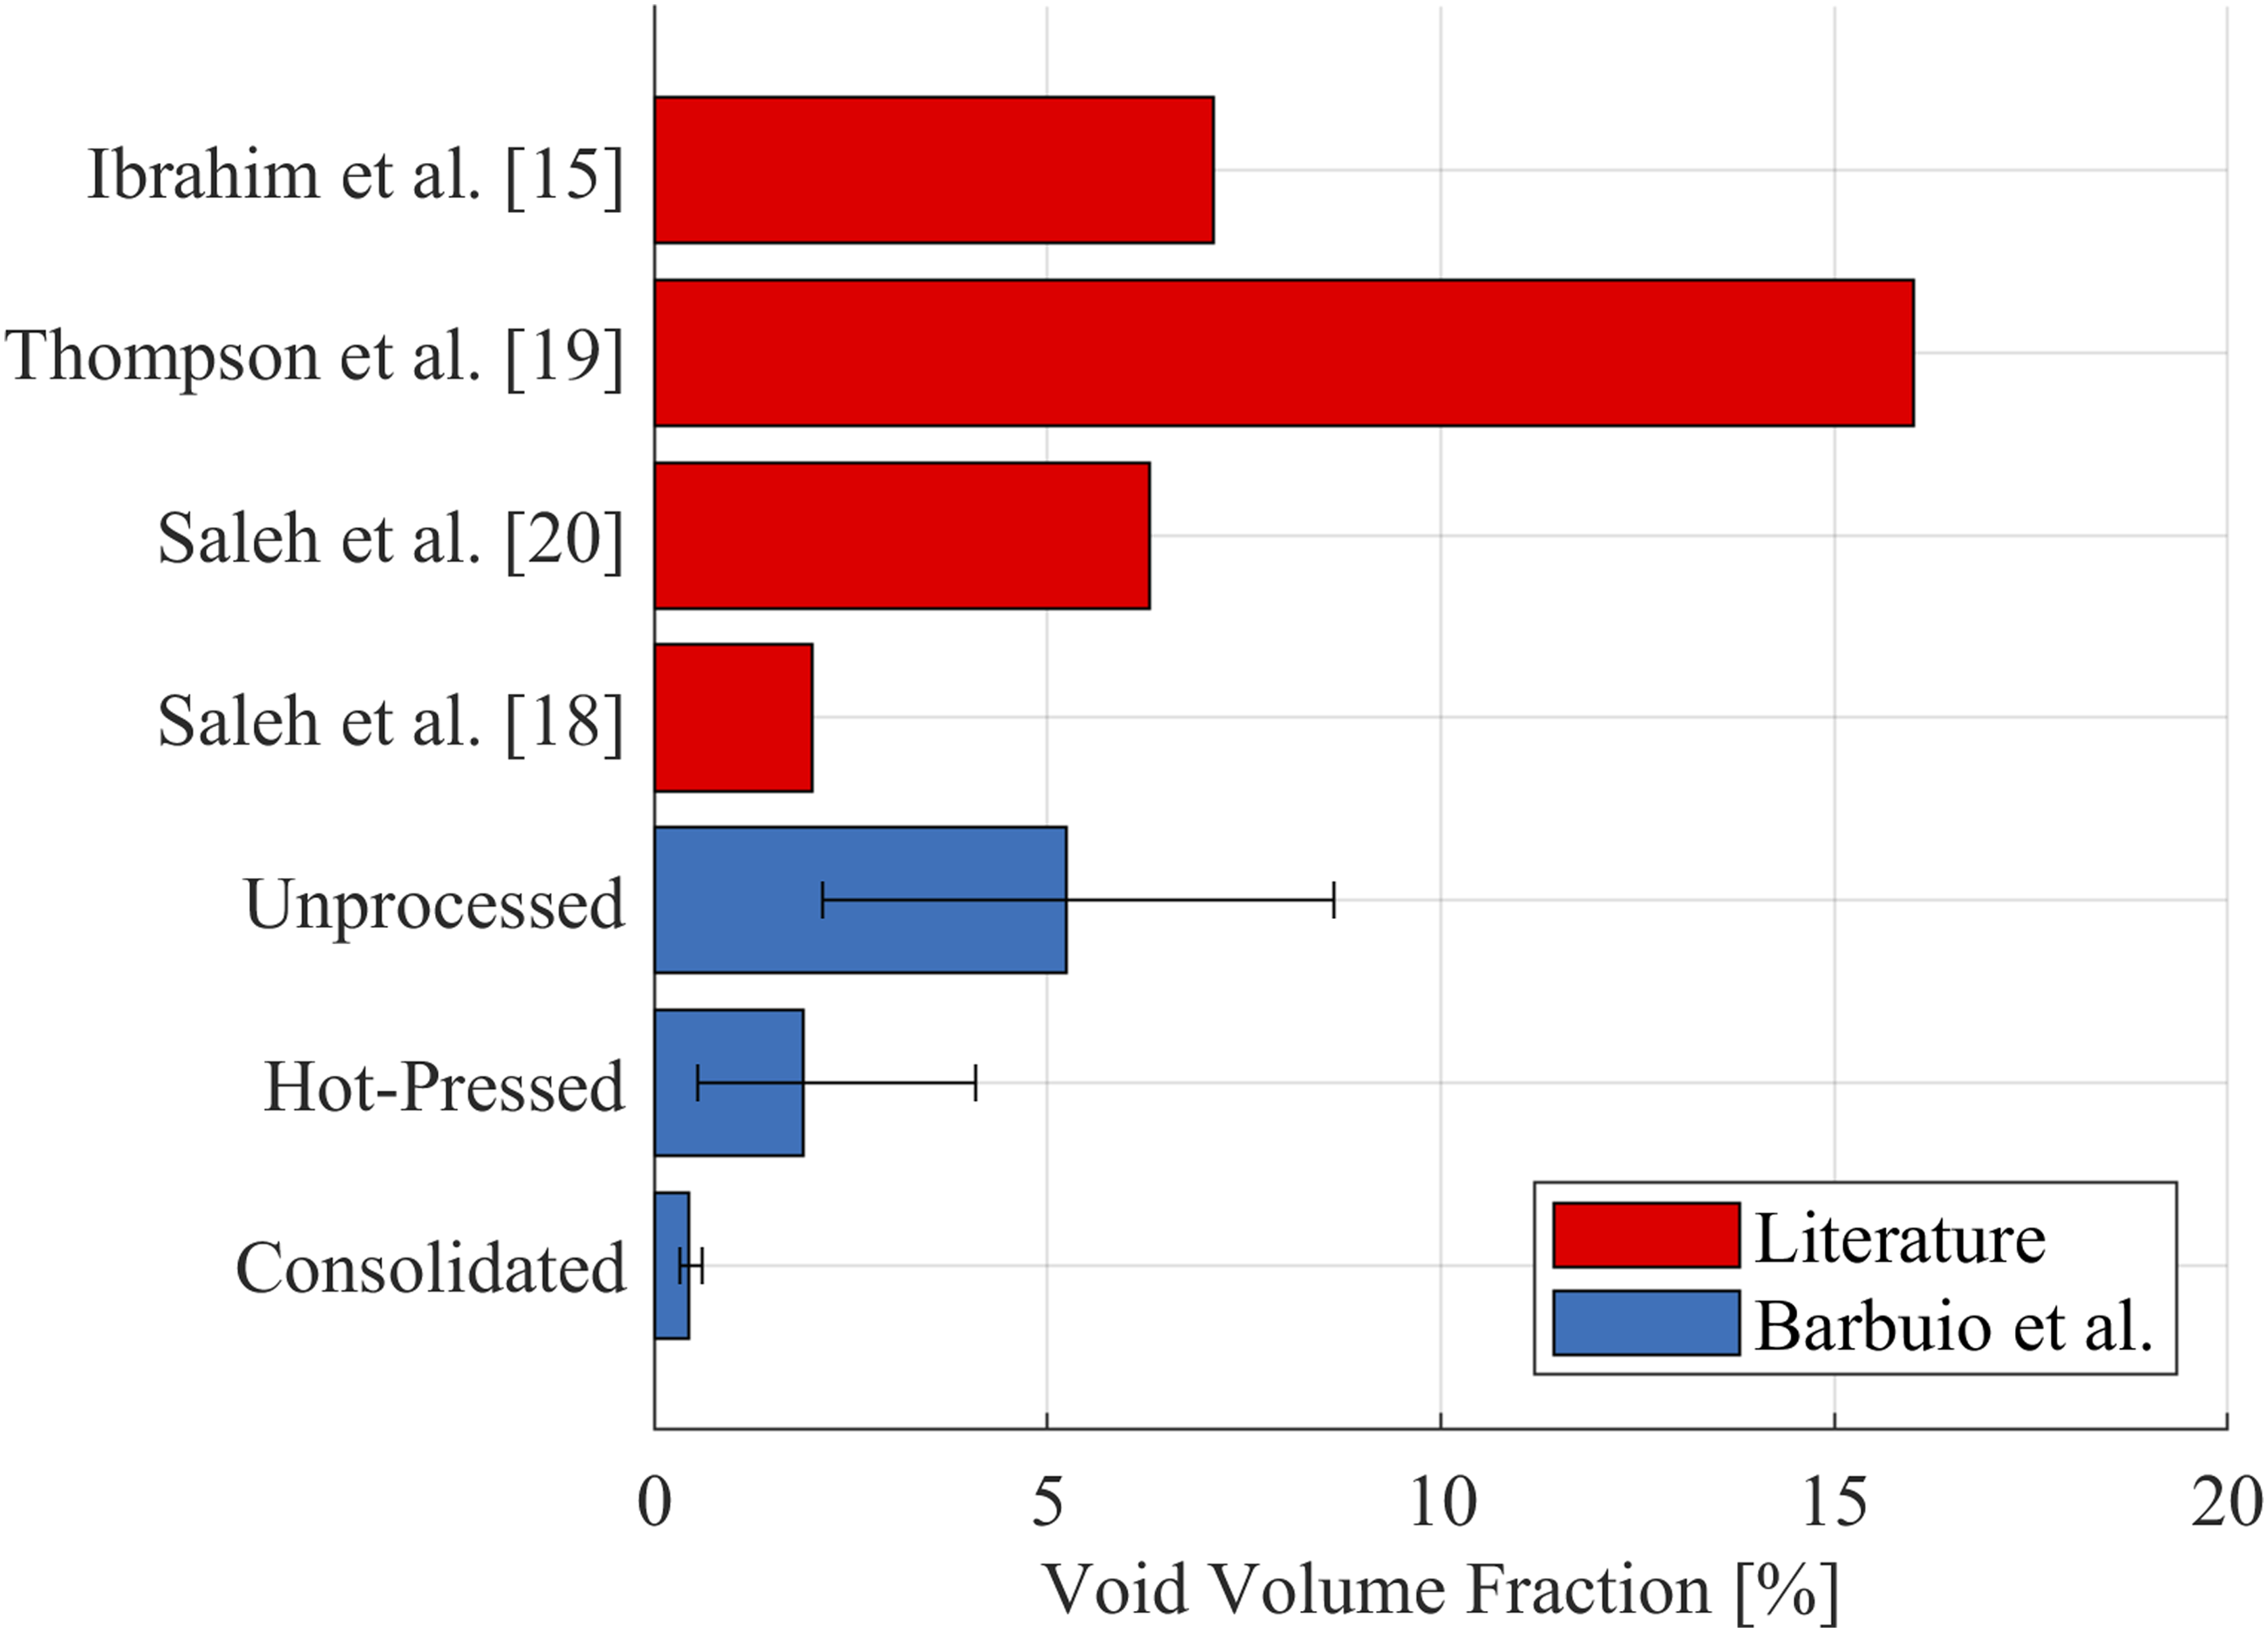
Comparison of Vvf % from different sample types to Vvf % in literature.
Figure 14 demonstrates the stark difference in V vf as a result of the consolidation procedure. The V vf was found to be 0.44%. It is observed that the consolidation procedure also yields lower variation in V vf compared to hot-pressing, which can result in a temperature gradient through the thickness of the sample due to being heated externally, which is mitigated during consolidation due to the uniform internal heating. This shows results comparable to other thermoplastic composite manufacturing techniques such as AFP and compression molding.45,46
Three-point flexural testing
The load-displacement results were obtained from the DIC analysis. The displacement of the point of maximum deflection was determined using the displacement of the loading nose (Figure 15). DIC analysis used to obtain displacement of load roller: (a) speckled loading nose and sample before flexural testing and (b) fractured sample and coloured displacement.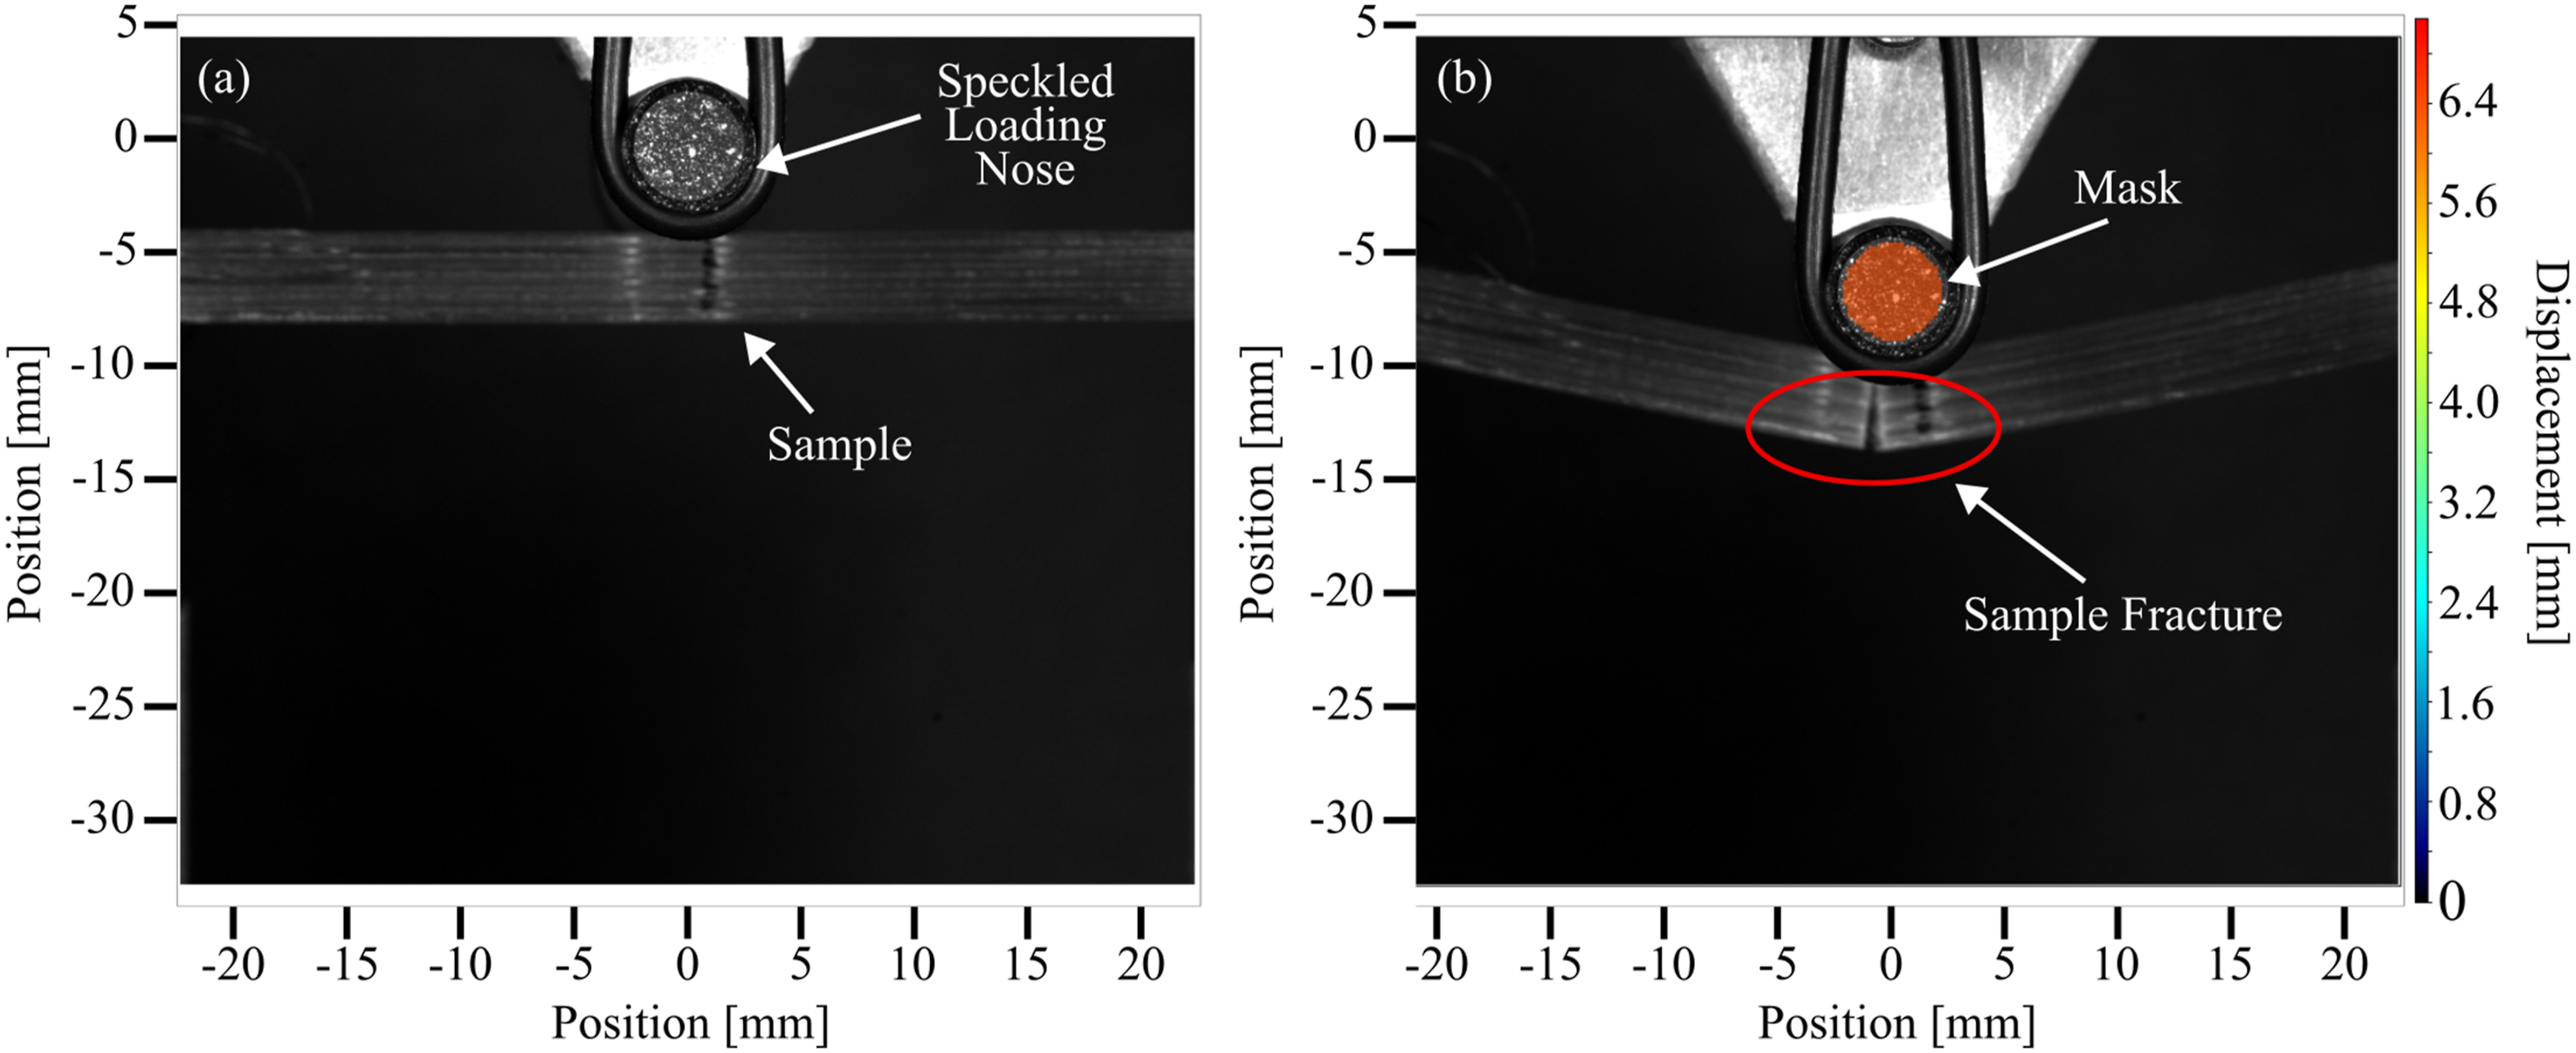
Figure 16 displays the flexural stress–strain curves for the unprocessed, hot-pressed, and consolidated samples. Flexural stress–strain curves for unprocessed, hot-pressed, and consolidated samples.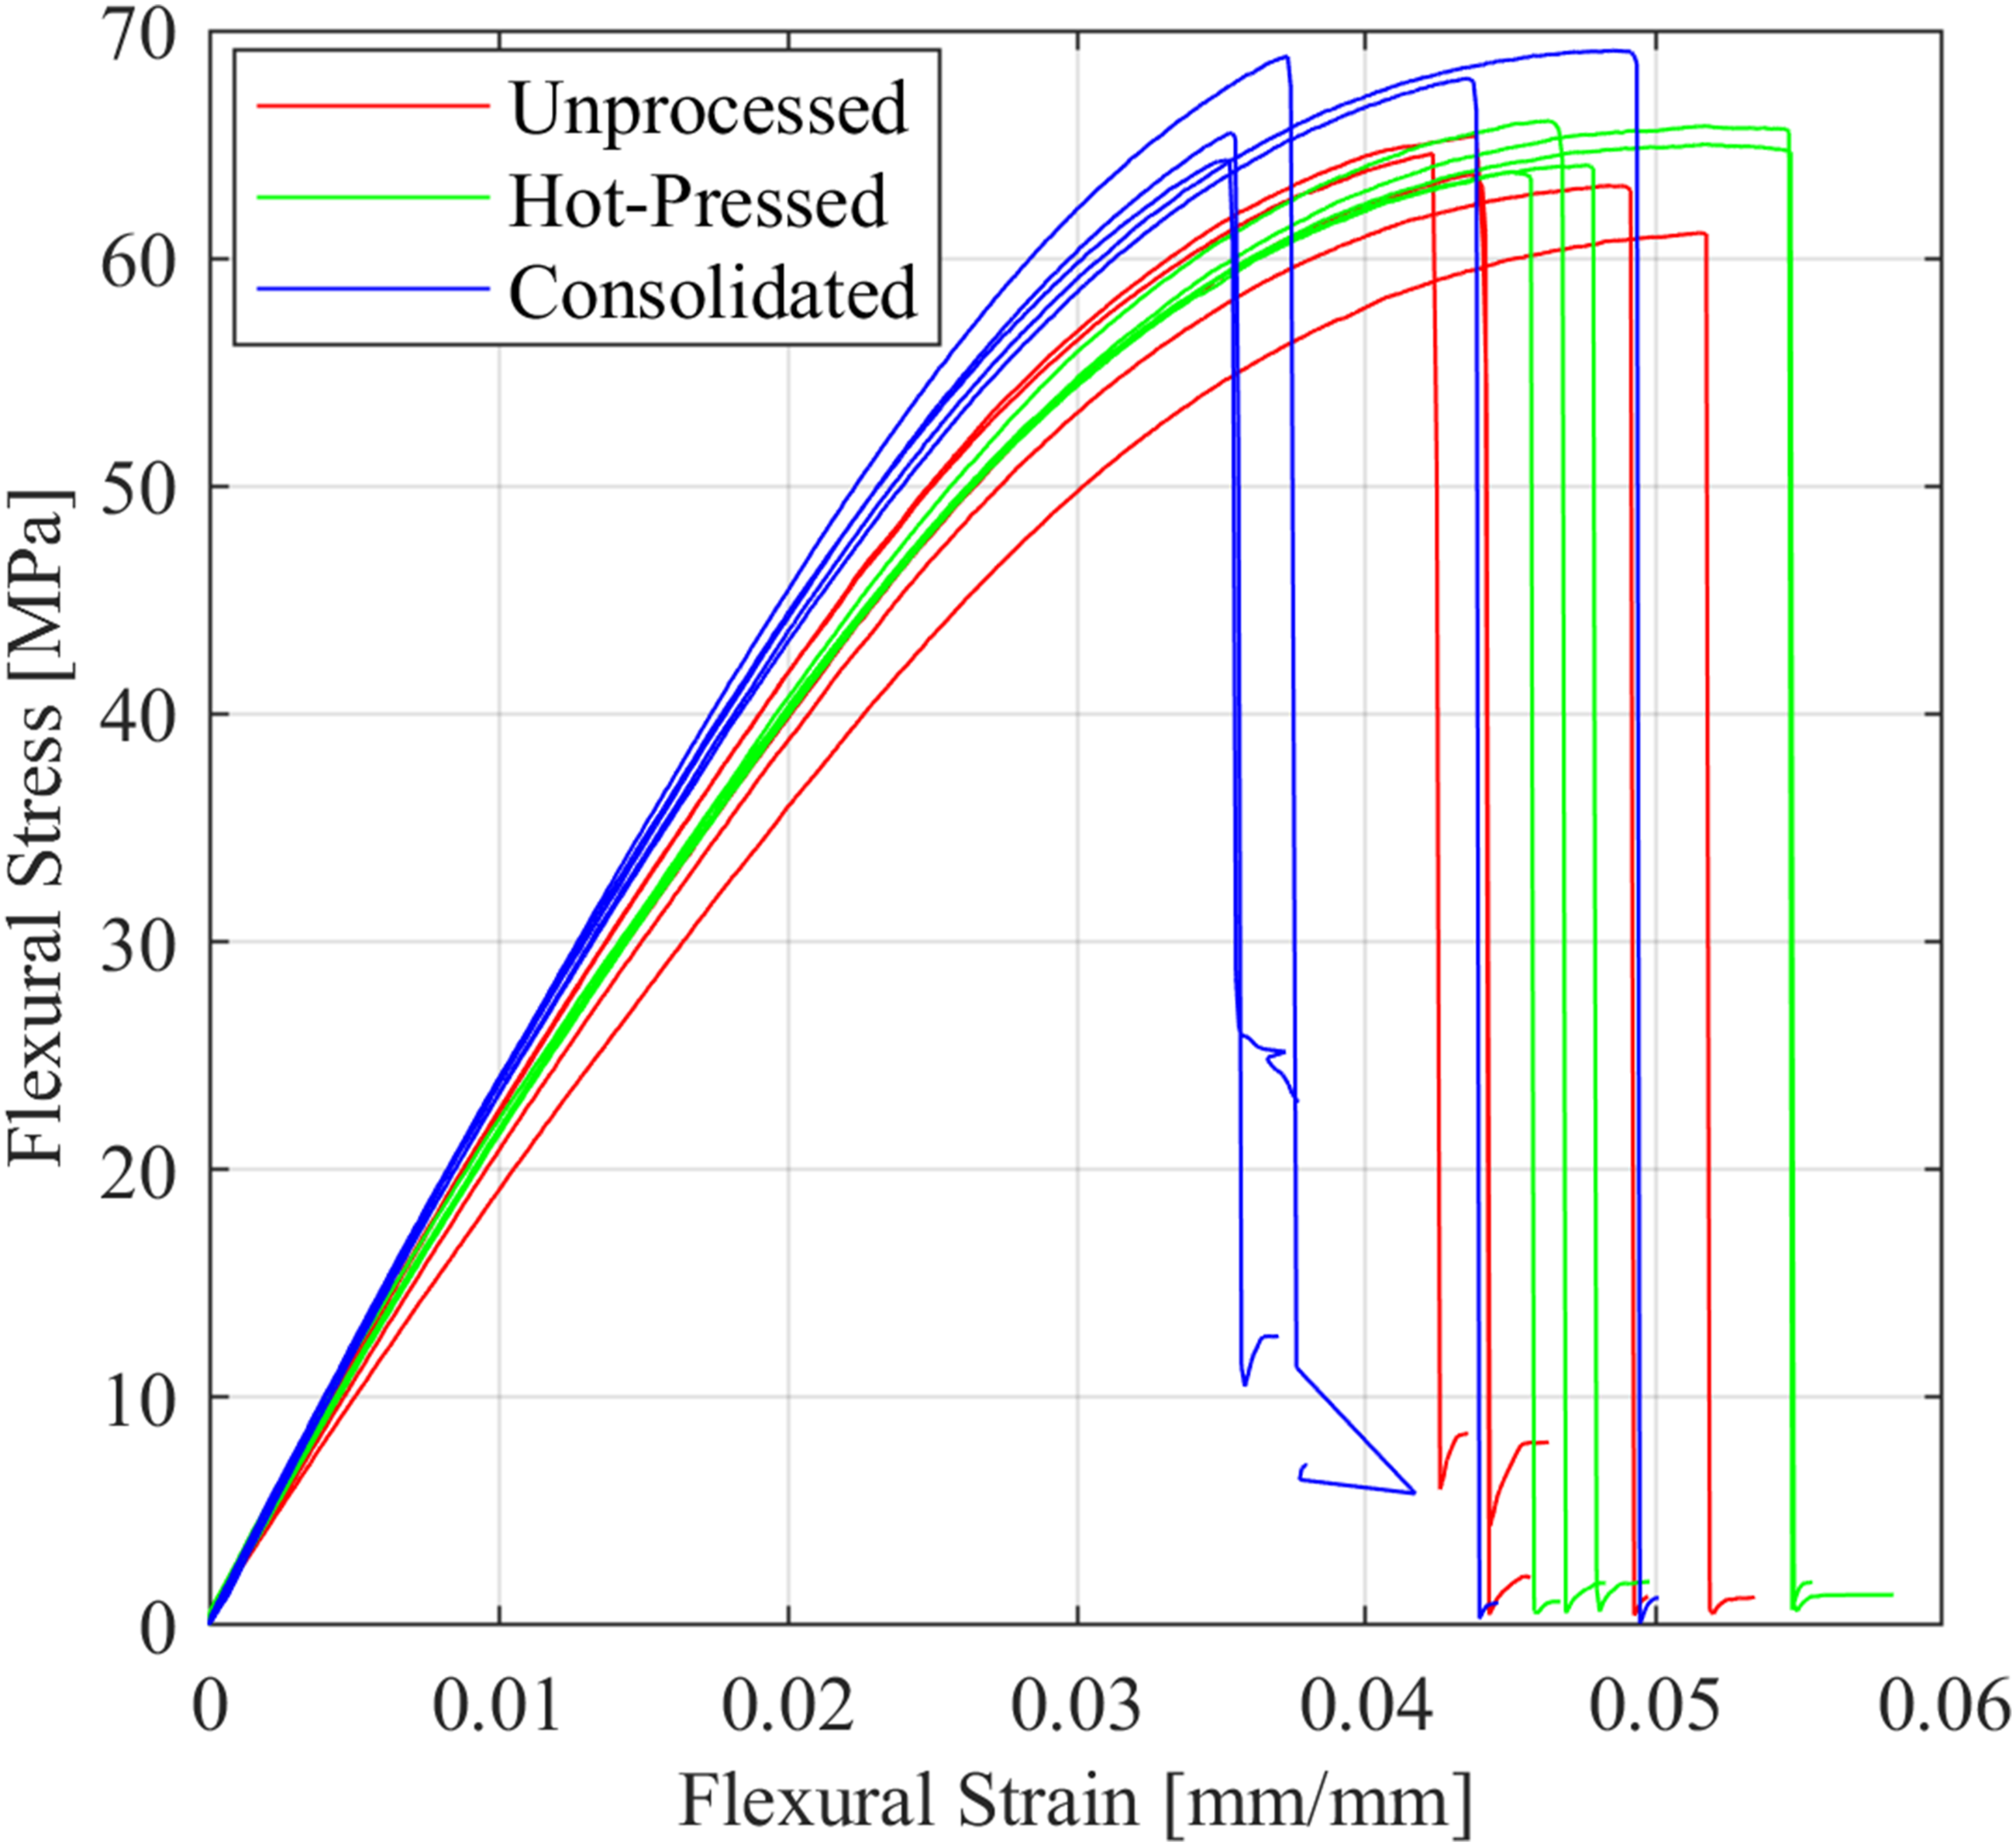
Average three-point flexural test results with standard deviation based on sample type.
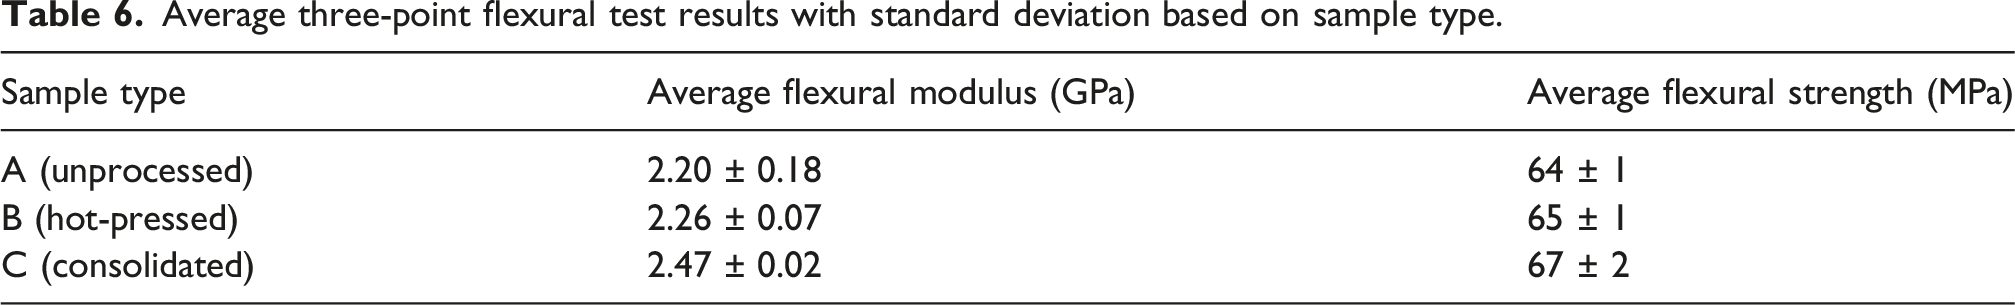
Samples that were subjected to the consolidation procedure had an average flexural strength of 67 MPa and flexural modulus of 2.47 GPa, a 5% and a 12% increase from unprocessed samples in flexural strength and stiffness, respectively. The bending stiffness, EI, of the CWPCs were also observed to be 7.4% and 16.2% lower for hot-pressed and consolidated samples, respectively, compared to unprocessed samples. As previously discussed, the non-uniformity of the wire distribution in the cross-section in hot-pressed and consolidated samples (Figure 12) also decrease the flexural strength and stiffness by causing uneven distribution of the load-bearing to the polymer matrix, which can cause premature failure as the wires are supporting less loading than if they were uniform throughout the cross-section of the hot-pressed and consolidated specimens. The non-horizontal surface of consolidated specimens as a result of platen misalignment could have also caused an underprediction in flexural results, as the loading nose applied uneven load to the sample surface during flexural testing.
A one-way analysis of variance (ANOVA) test was performed to determine the statistical significance of flexural properties between sample types with a 95% confidence interval. 41
Results of Tukey–Kramer method of multiple comparisons—flexural modulus and flexural strength results.
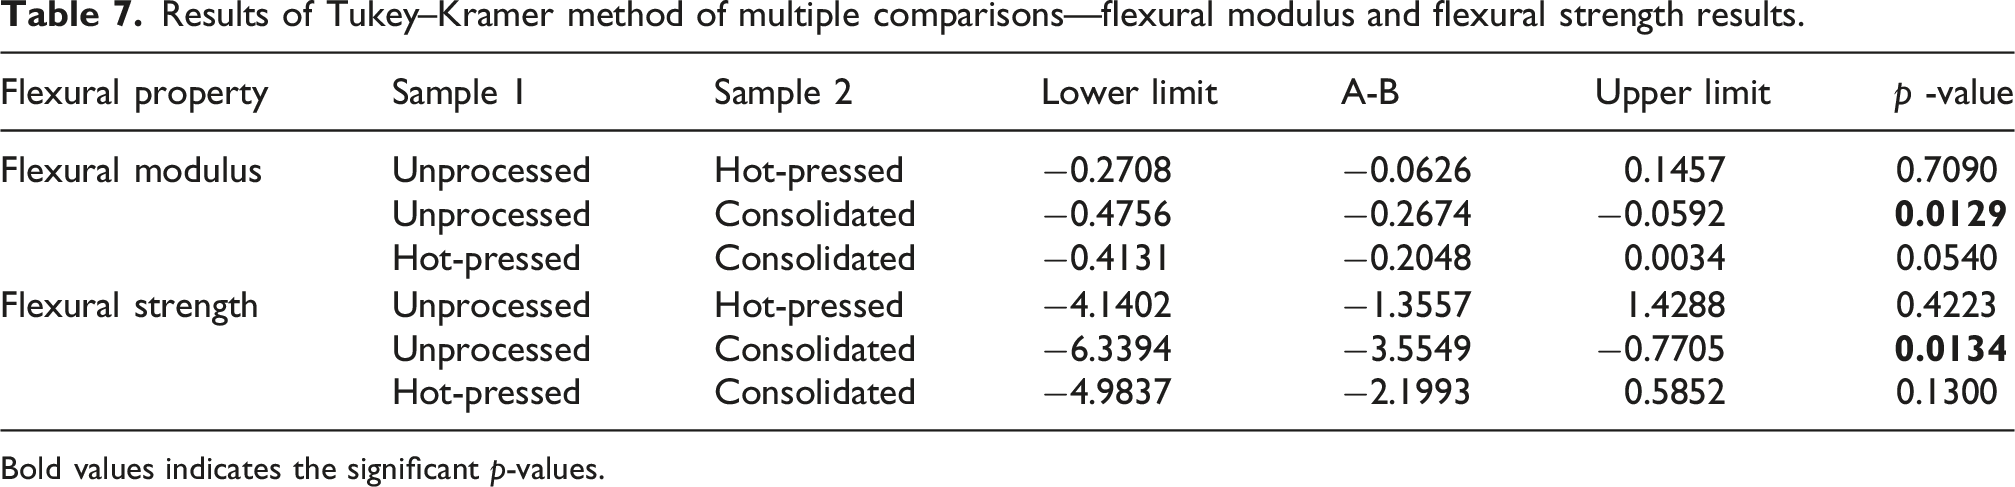
Bold values indicates the significant p-values.
The results from the multiple comparison tests showed a statistically significant increase in flexural strength by 5% and 12% increase in flexural modulus due to the consolidation procedure. Further, there is no statistically significant difference between the results of the unprocessed and hot-pressed samples or the hot-pressed and consolidated samples. In other words, hot-pressing does not have a statistically significant effect on the flexural strength and stiffness of the samples, but consolidation statistically significantly improves the flexural strength and stiffness of the samples by 5% and 12%.
The increase in flexural properties is due to the decrease in V
vf
, leading to an improved bonding between the reinforcement wires and the PLA matrix, consistent with other studies.28,32–34 The W
vf
remains consistent and relatively low, indicating the PLA matrix still carries the majority of the load. A study on the crystallinity of the PLA matrix was carried out in a DSC machine (Discovery DSC 250, TA Instruments, Delaware, United States) by applying a heating cycle according to ASTM D3418-21.
37
A 5 mg sample was cut off from microscopy samples of each sample type (A, B and C). The DSC samples were heated from 26°C to 215°C at a rate of 10°C/min in a nitrogen atmosphere. The crystallinity of the polymer matrix was calculated as done by van de Werken et al.
33
using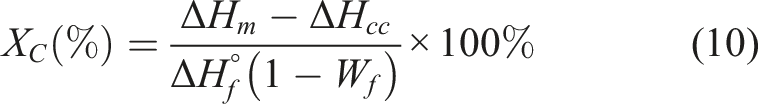
Conclusion
This study established an effective consolidation procedure for continuous wire polymer composites (CWPCs) by integrating resistive heating with hot pressing to significantly reduce void content in additively manufactured specimens. Thermal models were developed and validated, demonstrating strong agreement with experimental measurements obtained from embedded thermocouples, and enabling reliable prediction of processing parameters.
Mechanical characterization through three-point flexural tests confirmed that consolidation enhances structural performance. Specimens reinforced with a continuous nickel–chromium wire at a 1.18% volume fraction exhibited substantial reductions in void content, with microscopy revealing decreases of 63.9% after hot pressing and 91.6% following full consolidation. This resulted in a final void volume fraction as low as 0.44% in 3D-printed samples. Correspondingly, consolidated specimens showed notable improvements in flexural properties, with increases of 5% in strength and 12% in modulus. Statistical analysis further confirmed that these improvements are significant.
While this study focused on NiCr wire with a relatively low reinforcement fraction, the results highlight the broader potential of this consolidation approach. Future work should investigate the influence of processing parameters such as platen temperature, applied pressure, and boundary conditions to further optimize heat distribution and minimize geometric distortion. Extending this method to multidirectional laminates may help mitigate premature failure associated with anisotropy by reducing internal defects and crack initiation sites.
Beyond structural applications, the improved wire–polymer adhesion achieved through consolidation enhances the feasibility of embedded sensing, including structural health monitoring and wearable sensor systems subjected to complex loading conditions. Expanding this approach to other reinforcement materials such as higher-resistance metal wires or synthetic fibres like carbon and aramid, particularly at higher volume fractions offers significant potential for further improvements in mechanical and functional performance.
Footnotes
Funding
The authors disclosed receipt of the following financial support for the research, authorship, and/or publication of this article: The authors gratefully acknowledge the financial support from the Natural Sciences and Engineering Research Council of Canada RGPIN-2025-06295 (Melenka) and RGPIN-2018-05879 (Kempers).
Declaration of conflicting interests
The authors declared no potential conflicts of interest with respect to the research, authorship, and/or publication of this article.
Data Availability Statement
Data will be made available upon request.