
Abstract
The primary objective of this article is to advance the development of early warning of intrastate conflict by combining country-level structural and events data in a logistic regression model calibrated and validated using split-sample cases. Intrastate conflict is defined by the occurrence of one or more highly destabilizing events collectively termed a crisis of interest (COI). Two separate two-year periods between 1990 and 2005 were examined in twenty-five globally dispersed countries. COIs occurred in about 6 percent of all the half-monthly periods examined. While model accuracy (total correct predictions of COI and non-COI) usually exceeded 90 percent, the model did not generate sufficiently high and consistent precision (correct number of COI over total predicted) and recall (correct number of COI over total observed) for practical use.
I can calculate the motion of heavenly bodies but not the madness of people.
Sir Issac Newton
The need to forecast sufficiently early those countries at risk of failing so that appropriate responsive action might be taken is premised on “[T]imely, strategic, and integrated analysis…” (US Agency for International Development [USAID] Strategy, 2005). This view was recently emphasized by O’Brien (2010) when describing the goals of the Integrated Crisis Early Warning System (ICEWS). In particular, O’Brien (2010) highlighted the need to account for the complexity of interactions among actors and the identification of early warning indicators for forecasting. The focus on intrastate instability as part of a process leading to state failure in particular stems from its accounting for about 85 percent of current global conflict (Hot Standby Router Protocol [HSRP] 2008), and from several analyses that implicate the presence of certain transnational terrorist groups and criminal organizations within weak, collapsed, and failed states (Hagel 2004; Eizenstat, Porter, and Weinstein 2005; Training and Doctrine Command [TRADOC] 2005; Rabasa et al. 2007; Maxwell 2007; Haims et al. 2008; Hewitt, Wilkenfeld, and Gurr 2008; Roper 2008; Tikuisis 2009). Thus, early warning and its relationship to conflict onset leading to state failure requires a solid analytical and conceptual base from which one can derive a common understanding of cause and effect.
The present variant of early warning conceptualization is primarily concerned with identifying antecedents to crises of interest (COI)—defined in detail in the following—that constitute significant turning points in state stability. We argue that COI are hypothetically linked to significant destabilizing events and the structural changes that precede them. In addition to building on the relevant theories that contribute to an understanding of how instability is linked to failure, identifying the number, intensity, timing, and type of preceding events that produce a COI is the core objective of this research.
In this article, we combine country-level structural factors with events data in a logistic regression model for the purpose of forecasting a COI in a relatively short time interval (e.g., about two to four weeks). Notwithstanding that this interval is generally considered short for an intervention plan based on state structural factors (e.g., elemental aid), it is aligned with the recommendation advocated by Nyheim (2009) for “a crisis prediction capacity that enables proactive decision making,” if not for development agencies, then at least for immediate security contingency planning, preventive diplomacy, and stabilization. The type of analysis proposed herein, namely, the formal combination of structural factors and events data for estimation and forecasting, has rarely been attempted until recently (O’Brien 2010). Continued efforts in this direction, though nascent, represent an important contribution to the existing literature. The main contribution of this research is its high postdictive predictive potential, providing the basis for validating a model using root causes. However, its chief weakness is correlational analyses limiting predictive, probabilistic modeling.
Apart from this introduction, there are five other sections in this article. The first section reviews the current state and goal of instability forecasting, and the purpose in combining data sources with a view to focusing on intrastate conflict with potential for state failure. A summation of the data is provided in the second section followed by model development and testing in the third section. Results are presented in the fourth section. The article concludes with a discussion of the findings and recommendations for further work in the fifth section.
Literature Review
Numerous models and methodologies exist that purport to forecast state instability, state failure, and intrastate conflict, whether based on structural factors, events data, and/or other indicators such as accelerators, triggers, and decision processes (comprehensive summaries are provided by Barton et al. 2008; Carment, Samy, and Prest 2009; Mata and Ziaja 2009; Nyheim 2009; O’Brien 2010). One aspect of the instability research is its focus on considerations of short-term intervention during periods of crisis rather than on medium- to long-term development goals. In particular, the Office of the Coordinator for Reconstruction and Stabilization within the Department of State is the new locus for American response to fragile states. It is intended to coordinate all civilian government efforts within states deemed to be at particular risk of instability, to pose the greatest risk of regional destabilization, or to impact most seriously on American national security.
Most early warning practitioners generally focus monitoring and analytical attention on high risk structural conditions prior to a state completely weakening, and most models that support practitioner decision making are designed to identify structural factors that create specific crises. This approach is intuitively appealing since one of the most apparent means of predicting intrastate disturbances is to identify a causal structural pattern as it developed from the past. Such structural patterns (e.g., inequality, demographic stress, neighboring state influence, conflict history, etc.) in combination can, at least in principle, provide the basis for testing predictions regarding the correlates of crisis situations. A series of situations suspected to be of high risk can then be compared to the incidence of crisis actually occurring in these situations. Therefore, propositions on structural preconditions that are empirically well grounded can form the basis of predictive models of events that focus on the existence of certain preconditions.
For example, the early work of the Political Instability Task Force (PITF; Goldstone et al. 2000) identified various structural factors that statistically distinguished failed states from those that averted failure over the last few decades. Infant mortality, openness to international trade, and type of governance are the three factors that correlated most highly with the state failure (defined by the occurrence of ethnic war, revolutionary war, genocide/politicide, and/or adverse regime change). The latest rendition of the PITF model suggests that regime type, when finely categorized, can forecast with 80 percent accuracy the onsets of both violent civil wars and nonviolent democratic reversals (Goldstone et al. 2010). Yet, as pointed out by Dixon (2009), the correlation between regime type and civil war is still an open question. Overall, however, structural data are useful for understanding the root causes, enabling conditions, and background factors associated with state failure. They identify societal factors associated with weakness and can account for changes in political, social, and economic demands over long periods. They may, under some circumstances, be able to explain why groups end up fighting over resources, political space, and territory. But they cannot explain specific events or patterns related to conflictual human social interaction. Nor can they can account for variations in the scope, severity, and timing of such patterns.
Individuals and groups may be persuaded by elites to organize and mobilize, and they may be driven by mass pressures to react violently in some cases, but the probability of specific events occurring at specific points, depends on the opportunities and constraints that present themselves to factions and their leaders at specific points in time. State failure/instability, as forecasted by PITF, are two years forward, which can be valuable for mid- to long-term planning, but is inadequate for more immediate crisis response, as previously suggested by O’Brien (2002).
Kalil and Waghorn (2008) applied a logistic regression model to factors associated with the onset of civil war for predicting intrastate conflict within a five-year period. They concluded that the model could be improved with the inclusion of “trigger” variables, defined as events that escalate state tension to the outbreak of conflict (Harff 1998; Hales and Miller 2008). In brief, structural data can only explain part of the picture; other sources of information such as events data are deemed necessary for more immediate crisis prediction. 1
The ICEWS is a Defense Advanced Research Projects Agency (DARPA) initiative to exploit a capability-based approach to crisis response strategies for the US government. 2 ICEWS has applied several different modeling approaches to forecast events of interest (e.g., domestic political crisis, rebellion, regime change, etc.) within a few months of occurrence using various inputs that included structural factors and events data (O’Brien 2010). Best performance was obtained by integrating different models, 3 as opposed to using any one individual modeling approach. Although prediction accuracy was generally high (>90 percent), the number of onsets/cessations of events of interest correctly predicted was modest (<56 percent within the year of occurrence) and the prediction of domestic political crises (considered as precursors to rebellions and ethnic/religious violence) was disappointingly poor.
Ward, Greenhill, and Blakke (2010) recently noted that most conflicts are more localized than can be adequately explained by analyzing country-level data. They suggested that structural data alone are insufficient to draw firm conclusions about the intensity and frequency of intrastate conflict. What is required is more nuanced and detailed information regarding the date and location of conflict-related events. To address the deficiencies of structural data analysis and the use of ad hoc proxy measurement, the systematic collection and evaluation of dynamic data—also known as events-based information analysis—has become highly relevant to programming on fragility processes. Whether drawn from the systematic analysis of media sources or country experts, such data are useful for identifying up-to-date trends in popular perceptions, preferences, policy announcements, and stakeholder behaviors (Nyheim 2009). Events data analysis adds considerable value through regularized and standardized reporting. It can deepen and contextualize understanding of trends found in structural data and can highlight trend reversals. For example, a statistical study may show a steady decline in violent events over a series of years, but current events may evidence a sudden surge in violent demonstrations, one that will show up in structural data only in the aggregate, and only considerably after the fact. Event-based information can also provide a window into stakeholder perceptions, how they are reacting to real-time changes, and why they are doing so. Thus, events data can possibly bring higher resolution to the modeling effort.
A number of scholars led by Philip Schrodt and Deborah Gerner have produced a reliable means of machine coding capable of deriving meaningful content from news services for the purposes of substate analysis (Schrodt and Gerner 1997, 2000; Schrodt 2000). Their project, known as the Kansas Events Data System (KEDS), has raised text processing and sparse parsing of language to a high level of consistency and efficiency. KEDS exploits automated coding of English-language news reports to generate political event data focusing on the Middle East, Balkans, and West Africa. These data are analyzed and weighed for their role or contribution to the escalation or mitigation of conflict and are subsequently used in statistical early warning models to predict political change. Events data analysis continues to evolve considerably, especially with the advent of auto-coding via computer algorithms (Bond et al. 2003; Schrodt 2006; Russell and Clark 2009). However, despite these advances, a remaining challenge is to weigh events according to the contextual environment in which they occur, whereby a highly destabilizing event in one state might only contribute marginally in an already fragile state (Barton et al. 2008; Goldstone 2008).
Using a similar methodology to KEDS, the Early Recognition of Tensions and Fact Finding (FAST) research group (FAST- Early Recognition of Tensions and Fact Finding 2009; formerly of the Swisspeace Institute) applied a combination of human and auto-machine coding of events data (Krummenacher 2006). That methodology was developed by Bond et al. (1997), which was then modified for commercial use by Virtual Research Associates (VRA 2008) in affiliation with Protocol for the Assessment of Nonviolent Direct Action (PANDA) to guide and inform the automated coding of events (news reports), both violent and otherwise. VRA has since expanded the PANDA protocol into a more generic framework or ontology suitable for use in monitoring events in social, economic, and political sectors (Bond and Meier 2005).
FAST, VRA, and other similar machine-coded event-specific applications entail four types of difficulty. As already noted, events data draw from a myriad of open sources assembled and catalogued by humans or via computer and through machine-coded language. In either case, when each discrete event is analyzed in a structured and systematic fashion, patterns of performance can emerge, but only if there is sufficient events-related information collected on a sufficiently regular basis over a sufficiently long period of time. Such commitments obviously require significant resource investment. Pattern recognition is especially critical to the analyst who is engaged in continuous monitoring, whose goal is to derive projections about short-term changes within a country on the basis of recent trends, and to determine in advance if a situation is deteriorating or improving. Event-based analysis cannot supply the full context for complex situations nor can it provide a complete representation of root causes. The challenge lies in sorting through events ex post facto to determine which class of event might serve as antecedent to a crisis in the future. Establishing situational dependence is problematic. Not all events are significant in the sense that they may or may not be causally related to fragility or failure.
The combination of structural factors with events data can bridge the requirement for a more comprehensive analysis. Indeed, it is considered essential for accurately describing stability/instability in a country. However, this effort is also considered daunting since research has not yet conclusively identified key events as conflict indicators (Schrodt 2006) and their relative importance to structural factors (Lundin 2004). Briefly, when analyzed over time, events data give analysts an indication of a country’s current trajectory, and some context within which to understand unfolding developments, while structural data are useful for understanding the baseline conditions associated with state failure.
In sum, structural models alone are insufficient for short-term early warning since their forecast horizon is typically two to five years. As O’Brien (2010) observes, “integrated crisis early warning is fundamentally concerned with identifying those perhaps seemingly benign, policy relevant factors that, when combined with other factors, systemically preceded crises in a probabilistic way.” We build on prior research by Carment et al. (2006), Krummenacher (2006), and Nyheim (2009) who developed operational frameworks for exchanging information about events and structure. The common feature among these projects was the assumption that states that experience increased fragility will exhibit an increased level of politically violent events. However, the main difference between these projects and that of O’Brien (2010) and Ward, Greenhill, and Blakke (2010) is that the former did not attempt to develop a formal linkage between structural factors and events in explaining incidences of intrastate conflict. The key similarity is that they assumed politically violent events are not random and can be linked to preceding events that are distinct from other less destabilizing periods. If so, then such events can serve as indicators of an imminent COI. 4 A graphic representation of our conceptualization of combining state structural data with events data for early warning modeling is provided in Appendix A.
Data Collection
All data must be quantifiable for statistical modeling. It must also be readily available and collected and analyzed in an unbiased and consistent manner. The approach taken here was to identify two independent sources of country structural factors and two independent sources of events data that would allow a 2 × 2 crossover design for comparative testing of best fit to the statistical model.
Structural Factors
A metric was sought that scores a country’s annual status of stability against various indicators of performance characterized by political, economic, and social conditions, measured as changes in fragility scores from Country Indicators for Foreign Policy (CIFP; defined further later). The recently introduced “Failed States” index (Fund for Peace 2006) meets this requirement, but country evaluations are available only from 2005 onward, thus precluding long-term time series analysis. Other candidates that are applicable over a longer period in the past are the fragility index (FI) developed by CIFP (Carment, Samy, and Prest 2009) and the estimate of the risk of future political instability (PI) developed by PITF (Hewitt, Wilkenfeld, and Gurr 2008).
The FI is a metric that encompasses three dimensions of stateness (i.e., state power and recognition): authority, legitimacy, and capacity. This triad Authority-Legitimacy-Capacity (A-L-C) essentially captures a country’s ability to secure its sovereignty and citizens, its claim to national and international recognition as the legitimate power, and its capability to mobilize resources for internal social and economic development, and for international transactions, respectively (Carment, Samy, and Prest 2009). Thus, fragility for us is a measure of the extent to which the actual practices and capacities of states differ from its idealized image. It is a matter of degree, not kind. It is intended to be a general term, one within which related, though more specific terms, including weakness, failure, and collapse may be located. Fragility is a measure of the extent to which the actual institutions, functions, and processes of a state fail to accord with the strong image of a sovereign state, the one reified in both state theory and international law (Carment, Samy, and Prest 2009). By our definition, all states are to some extent fragile, which we believe is a closer representation of reality than an arbitrary line, however drawn, between weak and strong. Obviously, some countries have sufficiently robust capabilities across all vital dimensions of stateness that we would not apply the adjective “fragile” to them, even as some states are so challenged across various measures that few observers would argue that they are anything but fragile (if not failing or failed). States are considered fragile by the extent to which they prove deficient along any one of the A-L-C dimensions of stateness when compared with other nations. In addition to stateness, the FI incorporates six performance indicators clustered under governance (G), economics (M), security and crime (S), human development (H), demography (D), and environment (E). Countries are considered to be performing well, moderately, or poorly if their FI values are <3.5, between 3.5 and 6.5, and >6.5, respectively.
PITF (Hewitt, Wilkenfeld, and Gurr 2008) identified seven significant variables for forecasting state failure two years into the future. They are regime type (specifically whether autocratic or partially democratic) and consistency (whereby anocracies are deemed unstable), infant mortality, economic openness, militarization, and neighborhood war (whereby proximity to another nation’s conflict is deemed destabilizing). These data are open-sourced (PITF 2009) and available for most of the world’s nations going back as far as 1950. The resultant logit value of the risk of future PI was deemed suitable as the second candidate index of state structural status.
Events Data
Events data are challenging to acquire and to analyze. Schrodt (2006) described the evolution of automated coding of events and suggested that it has approached near equivalency to human coding. However, auto-coding of events is useful if sufficient data exist. Unless a weak country is on a watch-list, events reporting can be sporadic (Russell and Clark 2009), whereby only major items with potential global security implications tend to be noticed. Assessment must be unique and context-sensitive. Multiple reports of a single event can lead to inflammatory evaluations while similar events in different countries can have markedly different outcomes (Barton et al. 2008; Goldstone 2008). This study examined two different approaches for the acquisition and analysis of events data, one based on auto-coding and the other on human-coding.
Auto-coded events data via computer algorithm extraction were made available for 150 countries from 1990 to 2005 inclusive through VRA (via contractual arrangement). Three different event indices from these data were deemed suitable for modeling purposes: (1) Country Stability, (2) Hostility, and (3) the Goldstein conflict-cooperation scale. Country Stability is a modified conflict carrying capacity measure that encompasses the proportions of government and civil direct actions, and all forceful and direct actions (Bond et al. 2003). Events are scored if the action involved threat, demonstration, sanction, expulsion, seizure, or force using the World Events Interaction Survey (WEIS; McClelland 1978) format. Hostility involves the actions stated above except threat. The Goldstein (1992) score ranges from extreme conflict to extreme cooperation and involves all the WEIS-categorized events (Yield, Comment, Consult, Endorse, Promise, Grant, Reward, Agree, Request, Propose, Reject, Accuse, Complain, Deny, Demand, Warn, Threaten, Demonstrate, Sanction, Expel, Seize, and Force). All indices were reported in monthly intervals.
Human-coding of events data was conducted using six subject-matter experts (SMEs) trained by CIFP that were given separate country cases to assess. An intraclass correlation coefficient was also determined (using Statistical Package for the Social Sciences) to check the interrater reliability of events scoring, which was accomplished by choosing eighteen widely ranging events from conflict to cooperation from various cases among the twenty-five countries examined. The SMEs were given sufficient context on these “test” cases to assess the events, similar to the procedure when they assessed their separately assigned cases. These insights led our team to draw on a broad range of information sources that also created opportunities for language parsing beyond English (Arabic, Chinese, Spanish, and French are just some of the languages that have been interpreted by the SME event coders).
News wire reports, as available through LexisNexis, were used to randomly extract approximately twenty-plus events for each calendar month in the years that a country was examined. These events ranged from cooperation to conflict, similar to the entirety of WEIS-categorized events. Each event analyzed by CIFP (Carment, Samy, and Prest 2009) has a composite indicator statistic, which measures each event’s impact on state stability or fragility. Its score is based on four contextual dimensions beginning with whether the event is stabilizing or destabilizing, assigned as positive or negative, respectively. Causality (CA), Centrality (CE), and Escalation (ES) are the other three dimensions each scored from 1 to 3.
Causality accounts for an event’s relevance to state stability or fragility, whereby a score of 1 indicates no clearly delineable causal linkage, and scores of 2 and 3 indicate indirect and direct linkage, respectively. Causal linkage is in some ways the most critical and perhaps the most obvious, as some events are more clearly related to instability than others. Certain events may be relevant but not conceptually linked to stabilization/destabilization in a direct and clearly delineable fashion. For example, the introduction of a new aid project or the expulsion of a small international nongovernmental organization (NGO) are assigned CA values of 1. A delineable, but indirect link such as the commencement of peace talks that reduces risk of instability due to confidence building is assessed a CA value of 2. Finally, an event that is clearly and directly related to the risk of instability, such as a ceasefire or the assassination of a government minister, is assigned a CA value of 3.
Centrality reflects the proportion of political stakeholders that are affected; scores of 1, 2, and 3 indicate <25 percent, 25 to 75 percent, and >75 percent coverage, respectively. Stakeholders are those individuals or groups that possess a discernible and politically oriented agenda, are affected by events within a country, and often have an organizational structure and sufficient resources to affect state fragility. They range from the national leadership of the country, ethnic, and religious groups, domestic and international humanitarian NGOs, and hostile nonstate actors such as rebel militias.
Escalation is scored 1 if the event is comparable to others experienced in the state in the previous six months, 2 if more intense, and 3 if more intense than others in the previous five years. 5 Scoring recognizes that events occur within the context of immediate history and that the escalation of events can affect the risk of future instability. For example, a car bombing would not be considered an escalation of risk in a region that experiences such bombings on a regular basis. However, a similar bombing would constitute a significant escalation of events if it occurred in a region that previously only experienced nonviolent protest.
Similarly, scoring on the other two dimensions ensures that country contexts are taken into consideration, and that similar events can have very different magnitudes due to regional realities. For instance, a ceasefire arrangement may have a lower causality rating in a country that has experienced multiple failed ceasefires compared to a region that is experiencing its first ceasefire arrangement. Also, assigning a centrality measurement to the disarmament of one paramilitary group depends on whether that group is the only paramilitary organization or whether there are many such groups.
Finally, since an event is defined as being conceptually related to and a potentially modifying influence on structural factors, it is also coded under one of the three CIFP dimensions of stateness (A, L, C) and under one of the six CIFP performance clusters (G, M, S, H, D, E). In summary, stabilizing or destabilizing events were, respectively, scored positive and negative resulting in a composite score (CA + CE + ES) that ranged from −9 to +9 (excluding −2 to +2, which do not occur in this construct) related to the magnitude of instability/stability. This enables researchers to assess event trend lines within the context of individual states while also comparing event trends across states.
Country Case Selection
Given the limitations of detailed data availability, cases were not sought prior to 1990. Countries were selected on the basis of location (balanced global sampling), high fragility (FI) values, high volatility in FI values, and/or high dispersion among A-L-C values. Two 2-year periods were selected for each country designated as early and later periods based simply on chronology with no fixed separation between the two periods. This allowed a comparison of the incidence and nature of conflictual and cooperative events between periods that were either similar or disparate in their FI values. The selected countries are displayed in Figure 1, and the early and later years are additionally listed in Table 1.
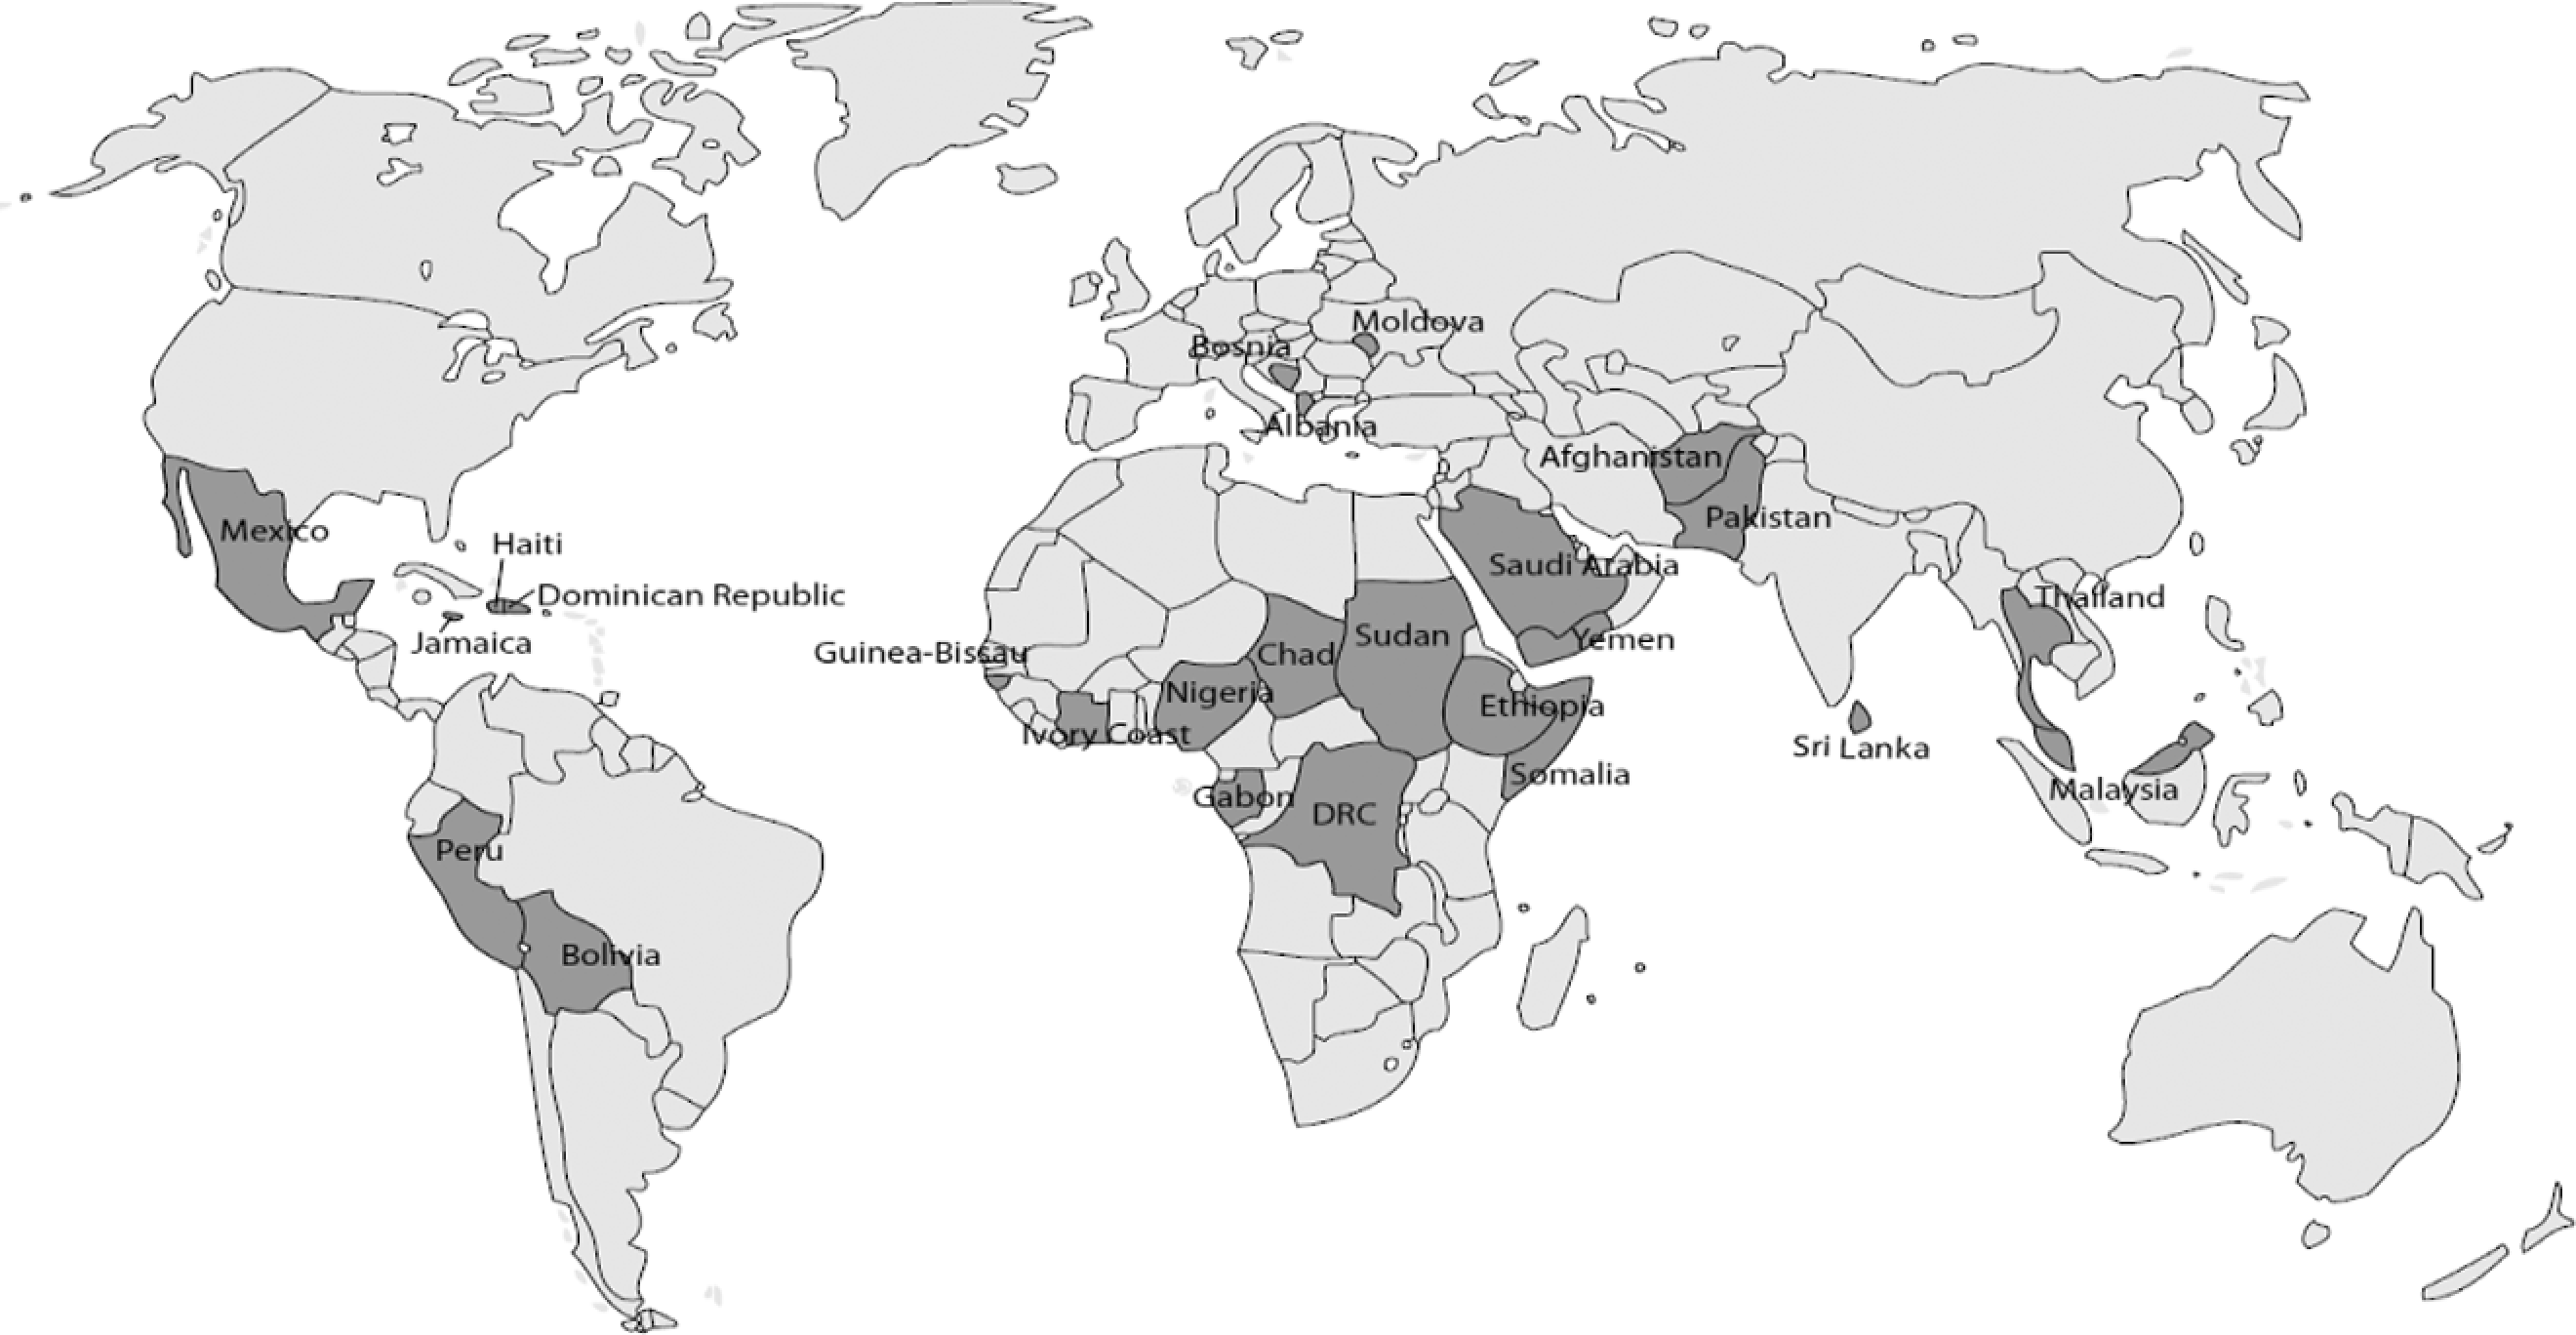
Countries selected for analysis.
List of Selected States Examined.
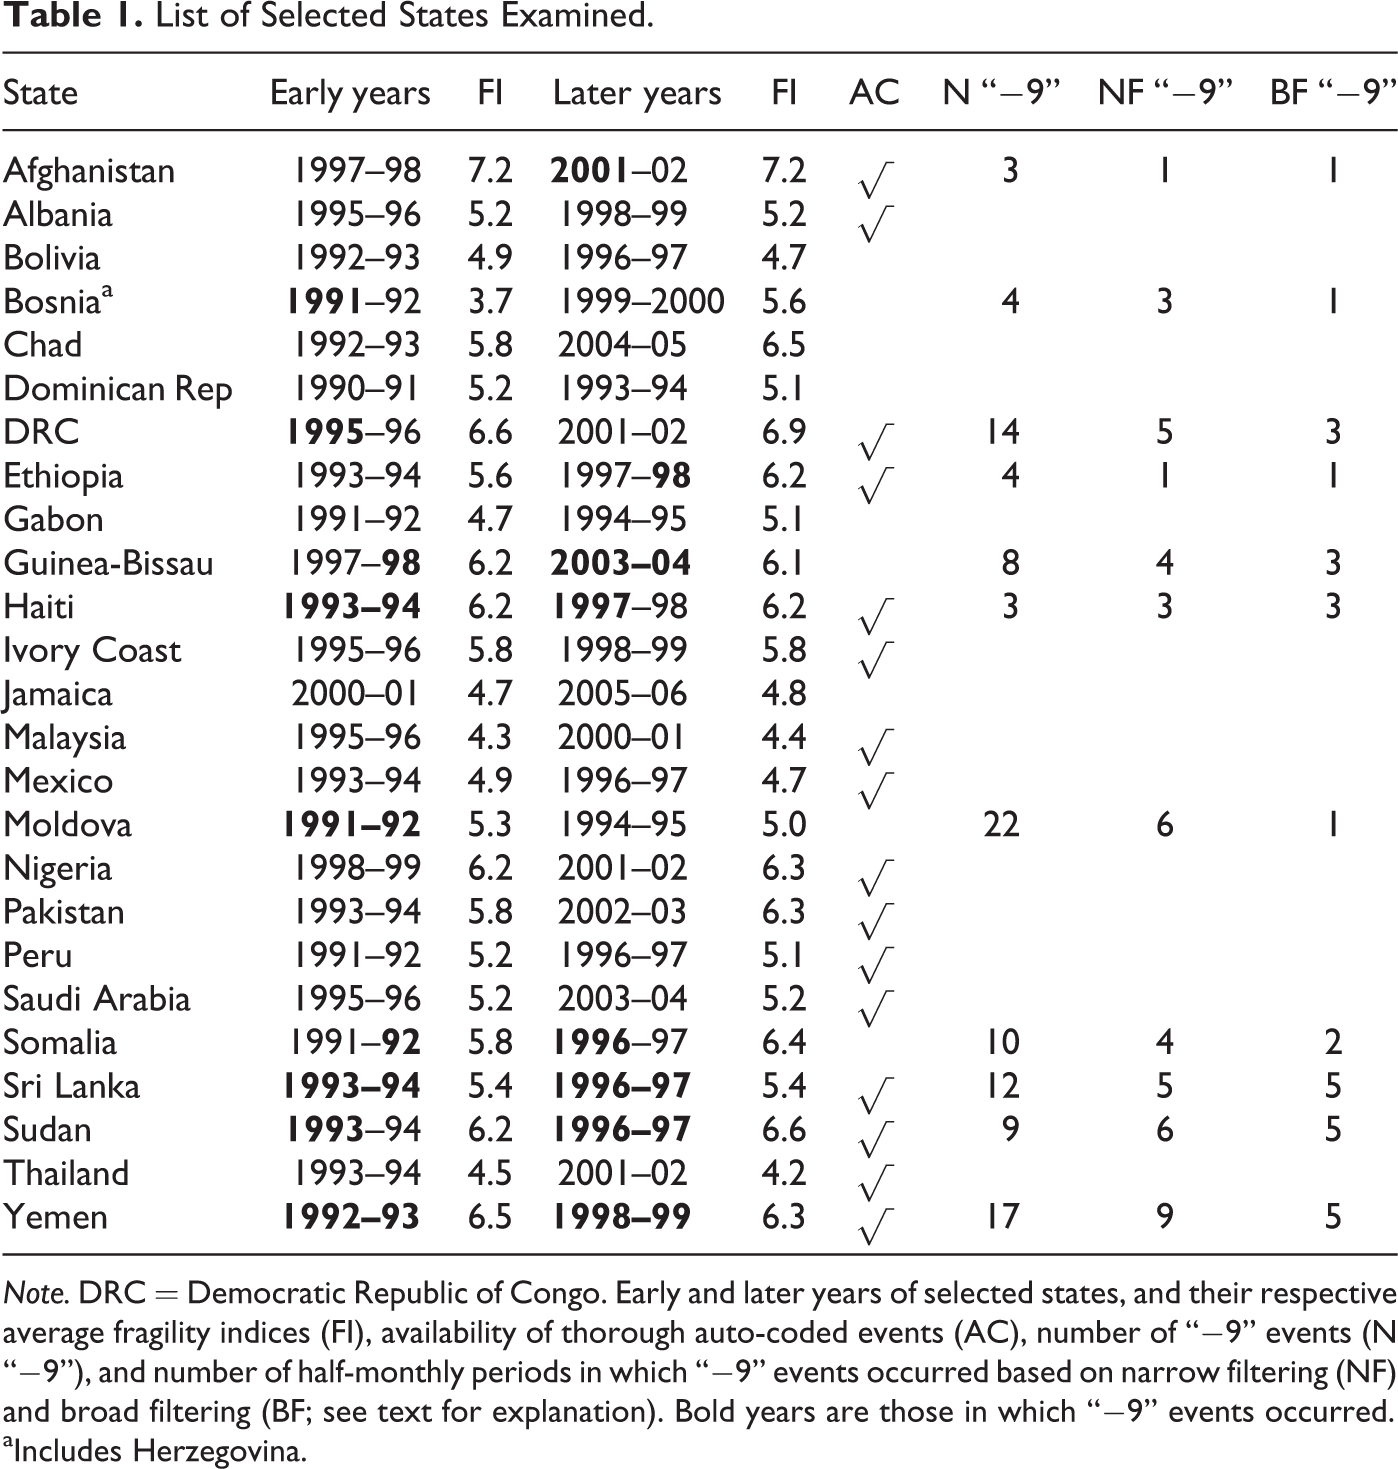
Note. DRC = Democratic Republic of Congo. Early and later years of selected states, and their respective average fragility indices (FI), availability of thorough auto-coded events (AC), number of “−9” events (N “−9”), and number of half-monthly periods in which “−9” events occurred based on narrow filtering (NF) and broad filtering (BF; see text for explanation). Bold years are those in which “−9” events occurred.
aIncludes Herzegovina.
Model Development and Data Analysis
Model Development
The overall objective was to predict the occurrence of a COI using structural factors and events data preceding a COI. For our purposes, a COI reflects a fundamental and significant challenge to stateness, that is, state authority, capacity, and/or legitimacy. This will occur most commonly when there is a preexisting level of tension in the state and usually takes the form of armed conflict and PI, but it might also appear in the form of tests of governance and economic performance. The dependent variable for this project is the country-half month, and when a country-half month contains a COI, the value of the dependent variable is 1, else 0. The criteria for identifying an event as a candidate COI are a change in actors—an increase in the number of actors and/or change in the kinds of actors engaged in or affected by the crisis (e.g., targeting of civilians which previously were not part of the crisis and possibly leading to reciprocal and escalatory behavior, emergence of paramilitary forces, a coup leading to military dictatorship, intervention by a military force, the destruction of an ethnic group). a change in issues—a change or broadening of the issues of interest which were the original basis for interactions between actors. These can be understood as economic, political, social, military-security (e.g., an economic grievance leads to political challenges from a particular group or a social issue—is redefined as a security threat). a change in rules—a change in the procedures, rules, and norms (explicit or implicit) that guide and inform interactions between actors. These may be either informal or formal procedures, rules and/or norms (e.g., severe human rights violations or severe curtailment of movement such as martial law or curfew), a suspension in the rights of opposition leaders, collapse of peace talks, collapse of a parliamentary system, declarations of secession, etc.). a change in structure—a change in the relative distribution of capabilities and/or capacities among actors (defined broadly as power but understood as having economic, political, military-security, and social components). Capability can be viewed as a state of development (knowledge, skills), whereas “Capacity” can be viewed as a “reserve” for countering shocks and deploying capability. Both define structure.
Hence, a COI is identified as a specific event within a half-month period that embodies the qualitative changes in most, if not all, criteria described previously.
Logistic regression was applied as the statistical model for the prediction of a COI since it is well suited for binary outcomes such as the occurrence or nonoccurrence of a COI. A COI is assumed to be increasingly likely to occur as state tension increases. State tension is conceptualized as an integration of long term and immediate contributors to state stability/instability (see Conceptual Model in Appendix A). Long-term contributors comprise the baseline conditions of a state, represented by the structural factors in this study. Immediate contributors arise from daily events, which are herein assessed on their causality, centrality, and escalation toward state stability/instability. A weighted sum of these contributions becomes the summary numerical representation of the level of state tension (see Logistic Regression Model in Appendix A).
A distinction was made between past and last events to separate near events from the more immediate events preceding a COI. This is because it is envisioned that for real-time events assessment, the duration of Elast (history of last events; Appendix A) should be sufficiently small so that it can be frequently refreshed. Thus, a “live” version of the model can then be calibrated with events data of the past and of the most recent period preceding a COI. Further, any difference in the weight (importance) of “last” events compared to “past” events is determined by the regression analysis. All analyses were conducted using the rare events correction advanced by King and Zeng (2001; Imai, King, and Lau 2008, 2009).
These data were arranged in half-monthly periods that comprised events either during the first fifteen days of a month or during the balance of the month. The rationale for binning the data in half-monthly periods was to maximize the overall number of data points while maintaining a sufficiently high number of events within each period to be statistically meaningful. Half-monthly periods generated ninety-six potential data points per country for the four years of events analyzed.
A three-month period was chosen to characterize the recent history of events prior to a COI. The duration of this period was deemed sufficiently broad to capture the state tension created by destabilizing events, yet, sufficiently narrow to differentiate significant changes (see Cyclical Nature of Events’ Scores in Appendix A for rationale and justification). This period was separated into the half-month period (last) immediately preceding the half-month in which a COI occurred, and a two and a half month period (past) preceding the “last” period following the rationale described above. This approach is consistent with the methodology proposed by Lundin (2004) who distinguished “accelerators” of conflict from “triggers” of conflict. Accelerators are conditions that worsen state tension in the weeks or months before conflict occurs, whereas triggers are events that escalate state tension to conflict outbreak (Harff 1998; Hales and Miller 2008). This distinction is effectively captured by the “past” and “last” periods of events analyses, respectively.
Events Data Analysis and Filtering
Indices of Country Stability, Hostility, and the Goldstein conflict-cooperation scale, all based on auto-coded events (Bond et al. 2003), were applied without modification in this study, except that the last and past periods were, respectively, based on the last month and the two previous to that prior to the occurrence of a COI. With regard to human-coded events, a comprehensive analysis was undertaken for each half-monthly period. First, the overall average (O_AVG) and standard deviation (O_SD) of the events’ composite CA + CE + ES scores were determined. AVG indicates whether events were mostly stabilizing (if positive) or destabilizing (if negative), and the standard deviation (SD) provides an indication of the volatility of events, which can be an indication of instability (Carment et al. 2006). The overall number of the highest destabilizing “−9”’ events (O_−9) was then recorded followed by the percentages of overall events that scored less than zero (O_%<0) and less than −5 (O_%<−5). These latter measures indicated the proportion of events that were considered destabilizing and highly destabilizing, respectively.
The preceding measures were then replicated for each dimension of the A-L-C construct and for each performance cluster (G, M, S, H, D, and E) using a similar format (e.g., A_AVG represents the average events’ score of all events within a half-month period that were deemed a challenge to the government’s authority). All event measures (total of either eighty derived from human-coding or six from auto-coding) were candidate regressors for representing Epast and Elast in the statistical model (see Appendix A). Table 2 summarizes all the variables for modeling purposes. Hereafter, only event descriptors will be used in the text for readability and their acronyms, including the relevant subscripted period (last and past), will be applied in tables and figures.
Summary of all Candidate Variables (Dependent and Independent) for Logistic Regression.a
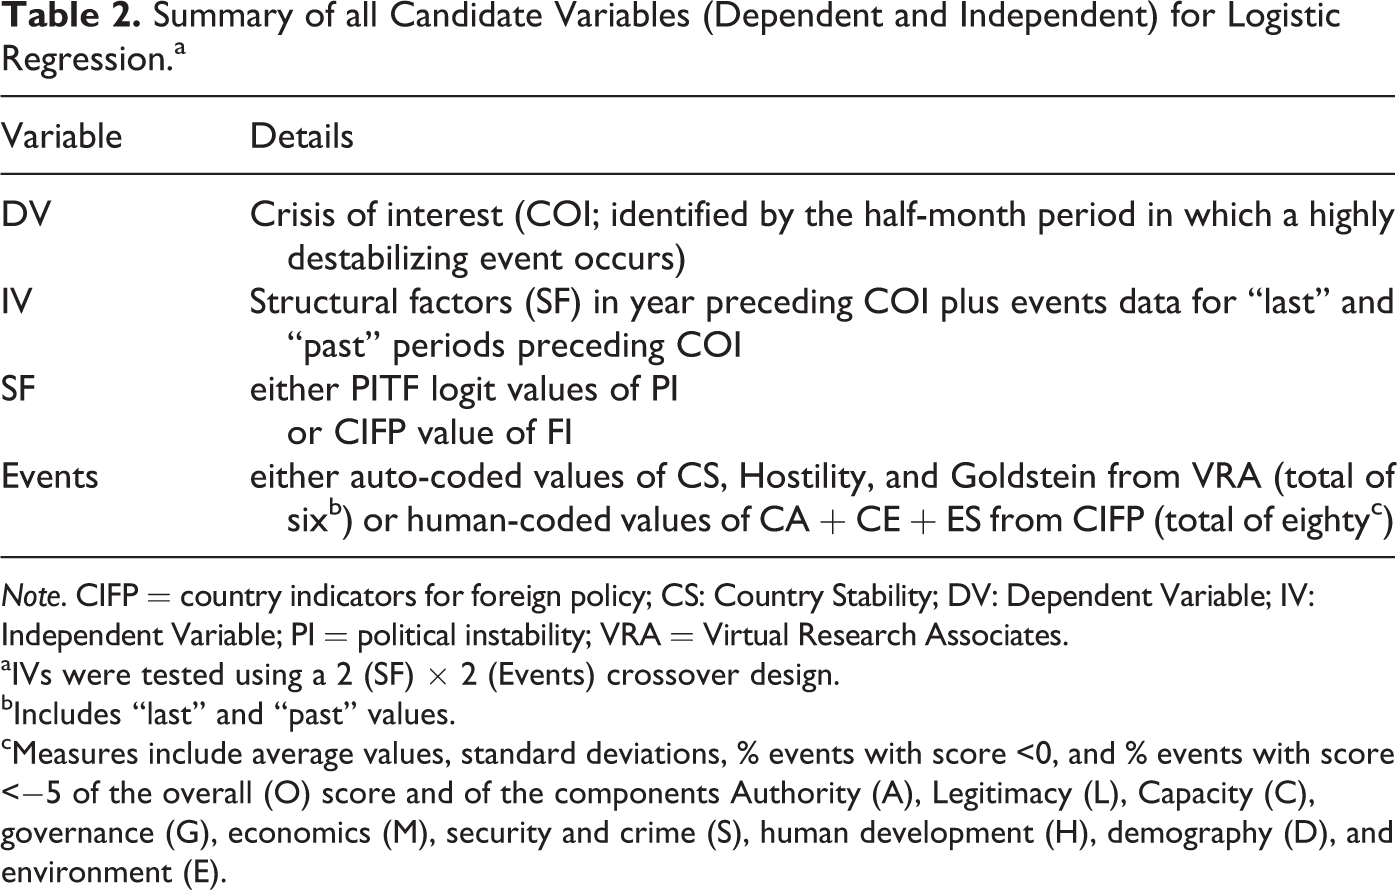
Note. CIFP = country indicators for foreign policy; CS: Country Stability; DV: Dependent Variable; IV: Independent Variable; PI = political instability; VRA = Virtual Research Associates.
aIVs were tested using a 2 (SF) × 2 (Events) crossover design.
bIncludes “last” and “past” values.
cMeasures include average values, standard deviations, % events with score <0, and % events with score <−5 of the overall (O) score and of the components Authority (A), Legitimacy (L), Capacity (C), governance (G), economics (M), security and crime (S), human development (H), demography (D), and environment (E).
COIs selected for developing the statistical model were based on the metrics described above. However, given that the level of collective political violence can vary considerably among countries to create the same destabilizing effect, the criteria for COI selection must be tailored specifically to the country analyzed. Hence, COIs were identified under one of the two constraints, “Stringent” and “Relaxed.” Essentially, the former involves the highest level of destabilizing events and the latter involves lower levels. Events that scored the highest possible negative value of CA + CE + ES (i.e., −9) were deemed COIs under the Stringent constraint. A COI was declared under the Relaxed constraint if the overall percentage of negative events exceeded a specific threshold.
Half-monthly periods in which a COI occurred following a half-monthly period with a COI occurrence were eliminated from the analysis since the indicators of an occurrence of a COI were sought that would not be biased by COI occurrences in the immediate preceding half-monthly period. This filtering was designated “NF” (narrow filtering). A more conservative filter was also separately applied that eliminated three months of events data following any half-monthly period in which a COI occurred. This filtering was designated “BF” (broad filtering). An example of these filtering procedures is demonstrated in Figure A3 of Appendix A.
Candidate event measures for regression were identified by a t test (using Statistica) comparing their last and past values preceding the half-monthly periods in which a COI occurred against their values during other periods in which a COI did not occur. If significant (p < .05), then an additional criterion for acceptance testing was imposed such that the former values must have indicated a higher level of conflict than the latter values (i.e., mean of a last or past variable must be numerically lower than its average during periods excluding last or past, respectively, to be considered a candidate regressor). Candidate measures, including those derived from auto-coded events, were then entered as independent regression variables in the statistical model (see Appendix A). Statistically significant measures were determined by log-likelihood criterion (via logistic regression using Statistica). Goodness of fit is reported for several measures of performance (MOP) based on true/false positives (correct/incorrect predictions of COIs) and true/false negatives (correct/incorrect predictions of non-COIs). These include Accuracy (correctly predicted COIs and non-COIs), Recall (correctly predicted COIs against all observed COIs), Precision (correctly predicted COIs against all predicted COIs), and others, which are all fully defined in Appendix B.
Each of the MOPs emphasizes different aspects of the model fit. An example of this is demonstrated in Appendix B where the MOPs are plotted (Figure B1) against the conditional probability (Pr). Not obvious, however, is the appropriate MOP for judging the best fit. Kalil and Waghorn (2008) applied two metrics, one that maximized Accuracy and the other that resulted in equal values of Precision and Recall. Neither metric was deemed superior but acknowledged to be dependent on user requirements, as also reported by others (Russell and Clark 2009; O’Brien 2010). While maximum accuracy is ostensibly desired, it can be misleading when predicting rare events since the vast contribution to Accuracy is the number of correct predictions of non-COIs. Alternatively, high values of d' and Odds Ratio reflect high true positives and low false negatives. Also, Precision closely, but not exactly, parallels the change in Odds Ratio. In the example shown in Appendix B, these MOPs in addition to d’ are maximal when Pr is .36. Although Recall is rather poor in this case, greater value is placed on Precision owing to the pragmatic consideration of minimizing false positives. That is, it is reasoned that user confidence in the prediction of COI will be higher if such predictions are maximally correct even if they are few in number and Recall is low. That is, with high Precision (say, >80 percent), predictions of COI occurrences would be rarer than actual occurrences; however, they would be more certain to occur. High Recall might be more valued when forecasting crises further into the future (say greater than one year) since it would lessen the possibility of surprise and foster broader contingency planning, but in this instance, certainty of prediction is deemed more valuable on a much shorter time frame. Hence, the Pr chosen for predictive purposes in this study was the lowest value that maximized Precision, although findings are also discussed where Recall was maximized for comparative purposes.
In summary, the objective of this article was to identify COIs among all the events data and to determine whether the structural factors (either FI or PI in the year preceding a COI) coupled with the events leading up to a COI (both past and last) were sufficiently unique for predictive utility. All event measures analyzed in half-monthly periods, as described earlier, of the events preceding a COI were then t-tested against all other events for significant differences. Measures that were found different, in addition to the structural factors, were subsequently tested as potential regressors in the statistical model. Following model calibration that identified significant predictive measures of a COI, a split sample of the data purposely not applied for calibration was used to conduct a validation test.
Results
A total of 26,277 randomly selected events (averaging about twenty-two per month) reported across twenty-five countries over 2 × 2 consecutive years each (see Table 1) were analyzed in various measures and summarized in half-monthly periods, as described above. Interrater reliability of human-coded events was deemed excellent, given that the single-measures intraclass correlation coefficient for CA + CE + ES among the six human coders of the eighteen commonly assessed test events data was 0.806 (95 percent confidence interval of 0.675 to 0.909). On the other hand, auto-coded events data were incomplete for nine countries (Bolivia, Bosnia, Chad, Dominica Republic, Gabon, Guinea-Bissau, Jamaica, Moldova, and Somalia).
Of all events, 46.2 percent were conflictual (i.e., negative) and COIs of −9 events occurred in eleven countries in both early and later years (Table 1). The mean FI value of all states in which −9 events occurred was significantly higher (t-test p < .01) than in the other states (6.0 vs. 5.2, respectively), thus confirming the assumption that states with increased fragility experience an increased level of politically violent events. Except for Afghanistan (in 2001) and Bosnia (in 1991), the FI values of the states with −9 events ranged between 5 and 7. Logistic regression of the data began by fitting all events in all countries followed by fittings of special cases, either individual countries or combined.
All Cases
The calibration data set comprised all countries listed in Table 1 except Bolivia, Guinea-Bissau, Pakistan, and Sri Lanka. These exclusions were chosen to represent two countries that had −9 events and two that did not to be used as the validation data set. The stringent condition (i.e., COIs based on the occurrence of −9 events in a half-month period) and NF were applied to the data. No structural factor (neither FI nor PI) was found to be significant in those years prior to the occurrence of COIs compared to those years when COIs did not occur. This result was consistently found for this and all subsequent tests conducted in this study (whether grouped or individual states) and will not be restated hereafter. The remaining test variables were the event measures, of which some were found to be significant except for those that were auto-coded (also a consistent finding in all subsequent tests). Hence, the original 2 × 2 crossover design for comparative testing was necessarily reduced to testing only the human-coded events data for its potential to predict a COI.
In the present analysis of all cases, the significant event variables in the half-month preceding the half-month period comprising a COI were the average events’ scores identified as challenges to a state’s authority and capacity. These same event variables were also significant in the two and a half month period proceeding the last half-month period. Table 3 presents the logistic regression results of entering all four of these human-coded event variables as candidate regressors for the prediction of a COI.
Model Calibration of Twenty-One States and Individual Validation Tests of Four States.
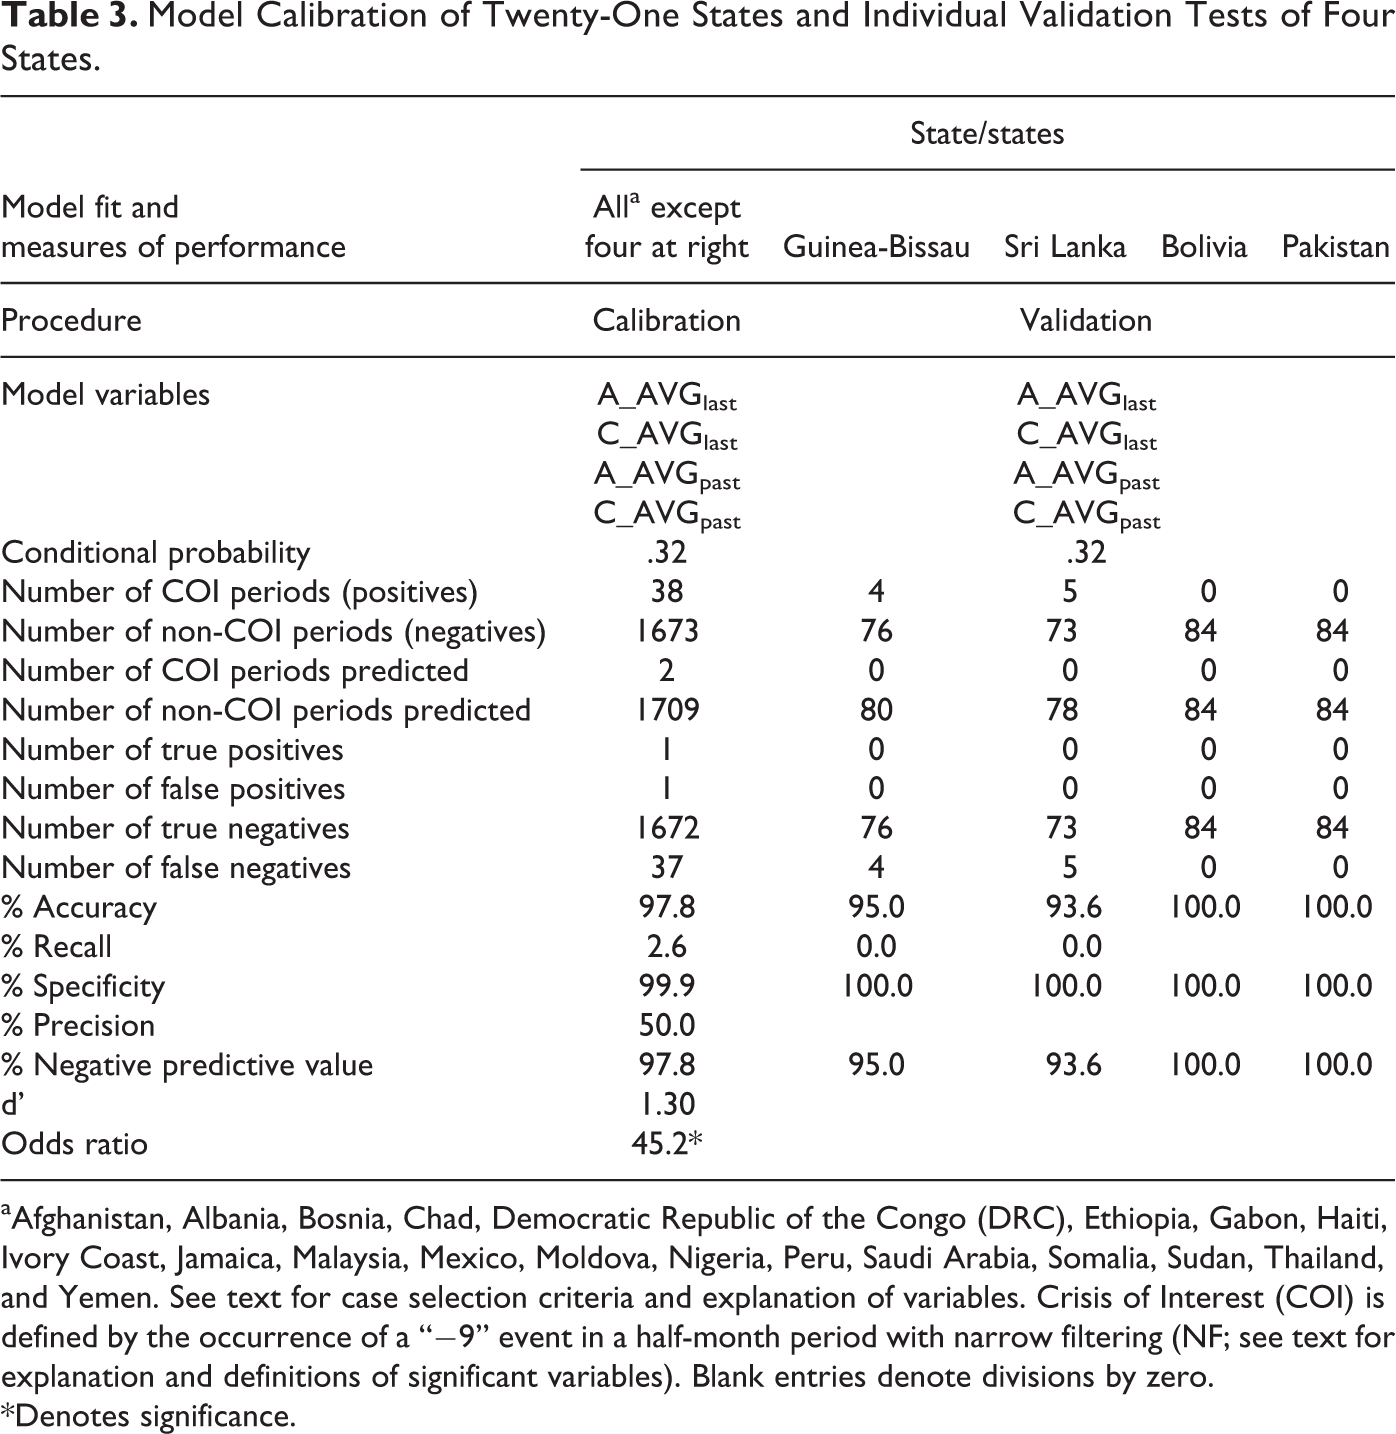
aAfghanistan, Albania, Bosnia, Chad, Democratic Republic of the Congo (DRC), Ethiopia, Gabon, Haiti, Ivory Coast, Jamaica, Malaysia, Mexico, Moldova, Nigeria, Peru, Saudi Arabia, Somalia, Sudan, Thailand, and Yemen. See text for case selection criteria and explanation of variables. Crisis of Interest (COI) is defined by the occurrence of a “−9” event in a half-month period with narrow filtering (NF; see text for explanation and definitions of significant variables). Blank entries denote divisions by zero.
*Denotes significance.
A total of 38 half-month periods (of the 1,711 or 2.2 percent) contained COIs of −9 events among the twenty-one countries in the calibration data set. The Pr of .32 was found to yield the highest Precision (i.e., one correct of the two [50 percent] postdictive predictions of a COI). While Accuracy, Specificity, Negative Predictive Value, and Odds Ratio (see Appendix B for detailed descriptions) were high owing to the vast number of non-COIs correctly predicted, Recall was exceptionally low.
When the model was applied to the four validation cases using the Pr of .32, no COI occurrences were predicted for Guinea-Bissau and Sri Lanka resulting in zero Precision. Nor were any COIs predicted for Bolivia and Pakistan, which yielded no false positives and 100 percent Accuracy. While an improvement in postdictive prediction of the calibration data can be made by adding “state” as a categorical factor, this does not facilitate the prediction of the validation cases (specifically Guinea-Bissau and Sri Lanka) since their state parameters are not known a priori. The next investigation involved the calibration and validation of individual state cases in an attempt to improve predictions by calibrating within state and thus avoiding the influence of other states.
Individual Cases
Four states were selected for this portion of the investigation, based on the occurrence of COIs defined by −9 events during the three earliest years and in the last year of the four years of events analysis. This would accommodate the calibration of data involving COIs and subsequent validation testing of COI predictions. The states selected (Guinea-Bissau, Sri Lanka, Sudan, and Yemen) had average half-monthly COI occurrences of 8.3 and 7.0 percent during the calibration and validation years, respectively (see Table 4). Only one significant event variable was found for Guinea-Bissau, which was the percentage of highly destabilizing events identified as challenges to the state’s legitimacy. Three half-month periods contained −9 events and the model yielded postdictive Precision of 50.0 percent and a significant Odds Ratio among other reasonably high MOPs using a Pr of .14 (see Table 4). Yet, when applied to the validation year, no COIs were predicted when one had actually occurred.
Model Calibration and Validation Testing of Four States.
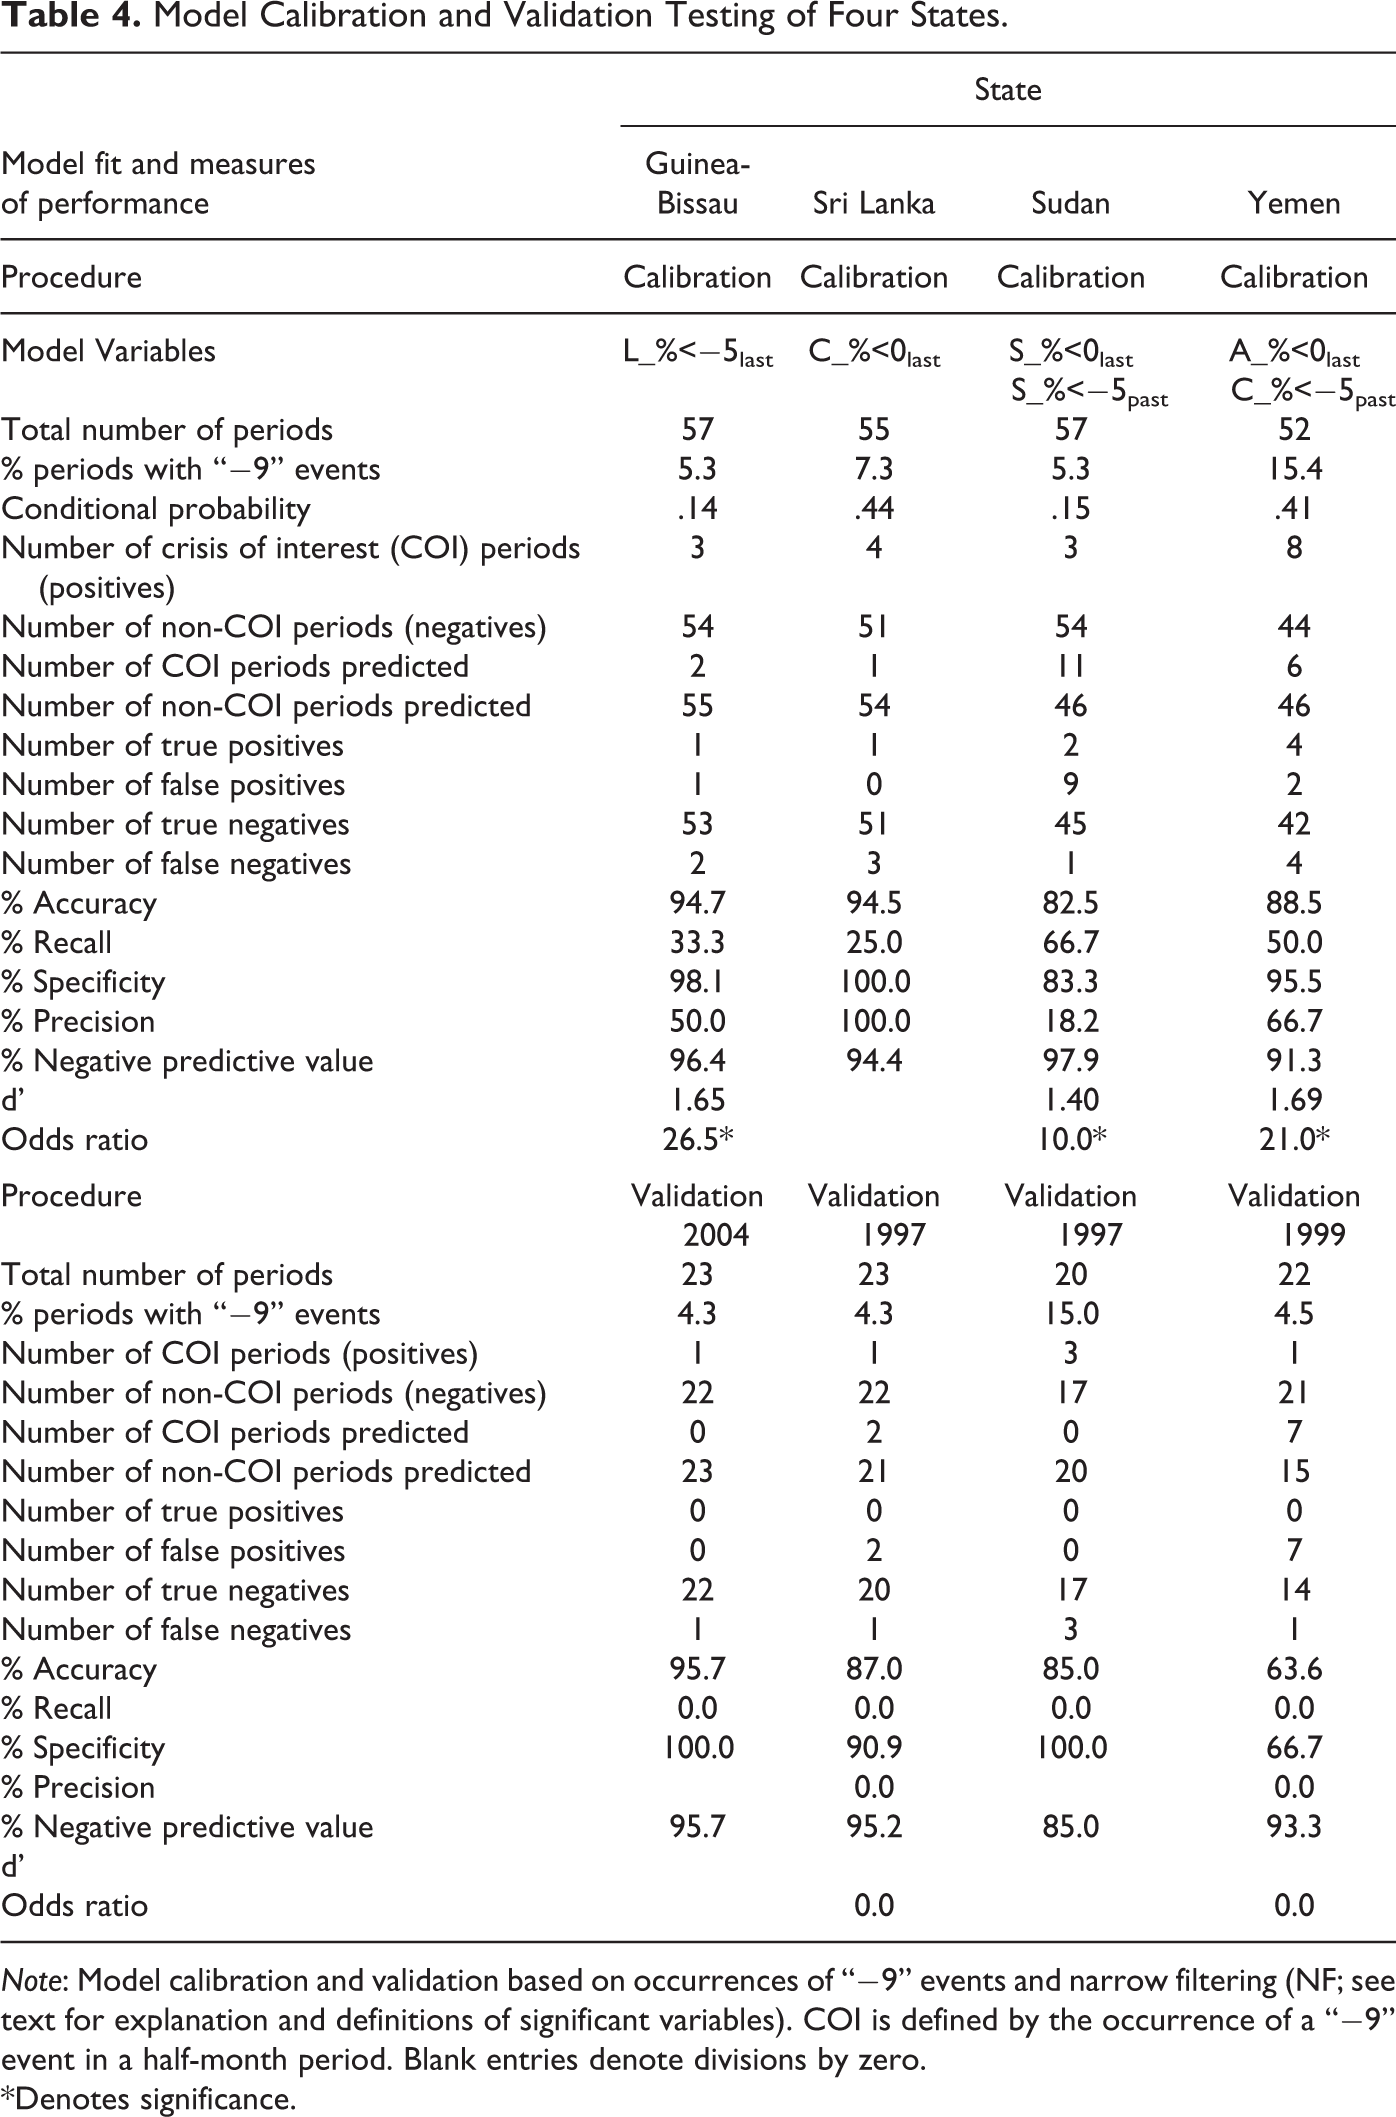
Note: Model calibration and validation based on occurrences of “−9” events and narrow filtering (NF; see text for explanation and definitions of significant variables). COI is defined by the occurrence of a “−9” event in a half-month period. Blank entries denote divisions by zero.
*Denotes significance.
Findings for Sri Lanka were similar to Guinea-Bissau, whereby only one event variable was found significant, in this case, the percentage of negative events identified as challenges to the state’s capacity. Subsequent regression yielded postdictive Precision of 100 percent using a Pr of .44. Although the model predicted COI occurrences in two half-month periods during the validation year, neither concurred with the actual occurrence, which led to zero Precision. Two event variables were found significant for Sudan (both destabilizing and highly destabilizing events involving security and crime) and Yemen (destabilizing and highly destabilizing events involving challenges to the state’s authority and capacity, respectively; see Table 4). Respective postdictive performances of Precision were 18.2 percent and 66.7 percent. In the case of Sudan, no COIs were predicted during the validation year, although they occurred in three different half-month periods. In contrast, COIs were incorrectly predicted in seven half-month periods during the validation year for Yemen, missing the half-month in which a COI actually did occur.
Overall, the model calibrated reasonably well but validated poorly for these four individual state cases. The final investigation was an attempt to improve prediction performance by combining states with similar thresholds for COI occurrences using both narrow and broad events data filtering (i.e., exclusion of COIs within a half month and three months following a COI). All events data were used for calibration, and if successful, then the model would be recalibrated and tested with split-sample cases.
Grouped Cases
NF events data
Of the eleven states that experienced −9 events, two of these (Afghanistan and Ethiopia) had occurrences in a single half-month period (or 1.2 percent of all periods during the four years examined). For the others (Bosnia, Democratic Republic of the Congo [DRC]), Guinea-Bissau, Haiti, Moldova, Somalia, Sri Lanka, Sudan, and Yemen), the number of half-month periods with −9 events ranged from three to nine under NF (see Table 1), which averaged to a 6.5 percent occurrence. These latter states formed the first group for model regression using all events data. The overall events’ score and challenges to the state’s capacity were significant event variables yielding postdictive Precision of 50.0 percent with a significant Odds Ratio (see Table 5).
The next test group was chosen by lowering the threshold for a COI (i.e., applying the Relaxed constraint), which was necessary since fourteen states did not have a −9 event in any of the four years examined. By accepting states in which the number of negative event scores exceeded 75 percent, but excluding those already modeled earlier, four states emerged (Dominican Republic, Ivory Coast, Mexico, and Peru) with an average half-monthly COI occurrence of 5.4 percent. Economic performance and challenges to the state’s authority were significant event variables yielding postdictive Precision of only 20.0 percent (Table 5). Lowering the COI threshold even lower to those states in which the number of −ve event scores exceeded 70 percent led to the identification of three states (Malaysia, Nigeria, and Pakistan) with an average half-monthly COI occurrence of 5.1 percent. Challenges to the state’s authority and legitimacy were significant event variables in this case yielding postdictive Precision of 100 percent (Table 5).
Model Calibration of Four Data Sets Based on Different Definitions of a Crisis of Interest (COI).
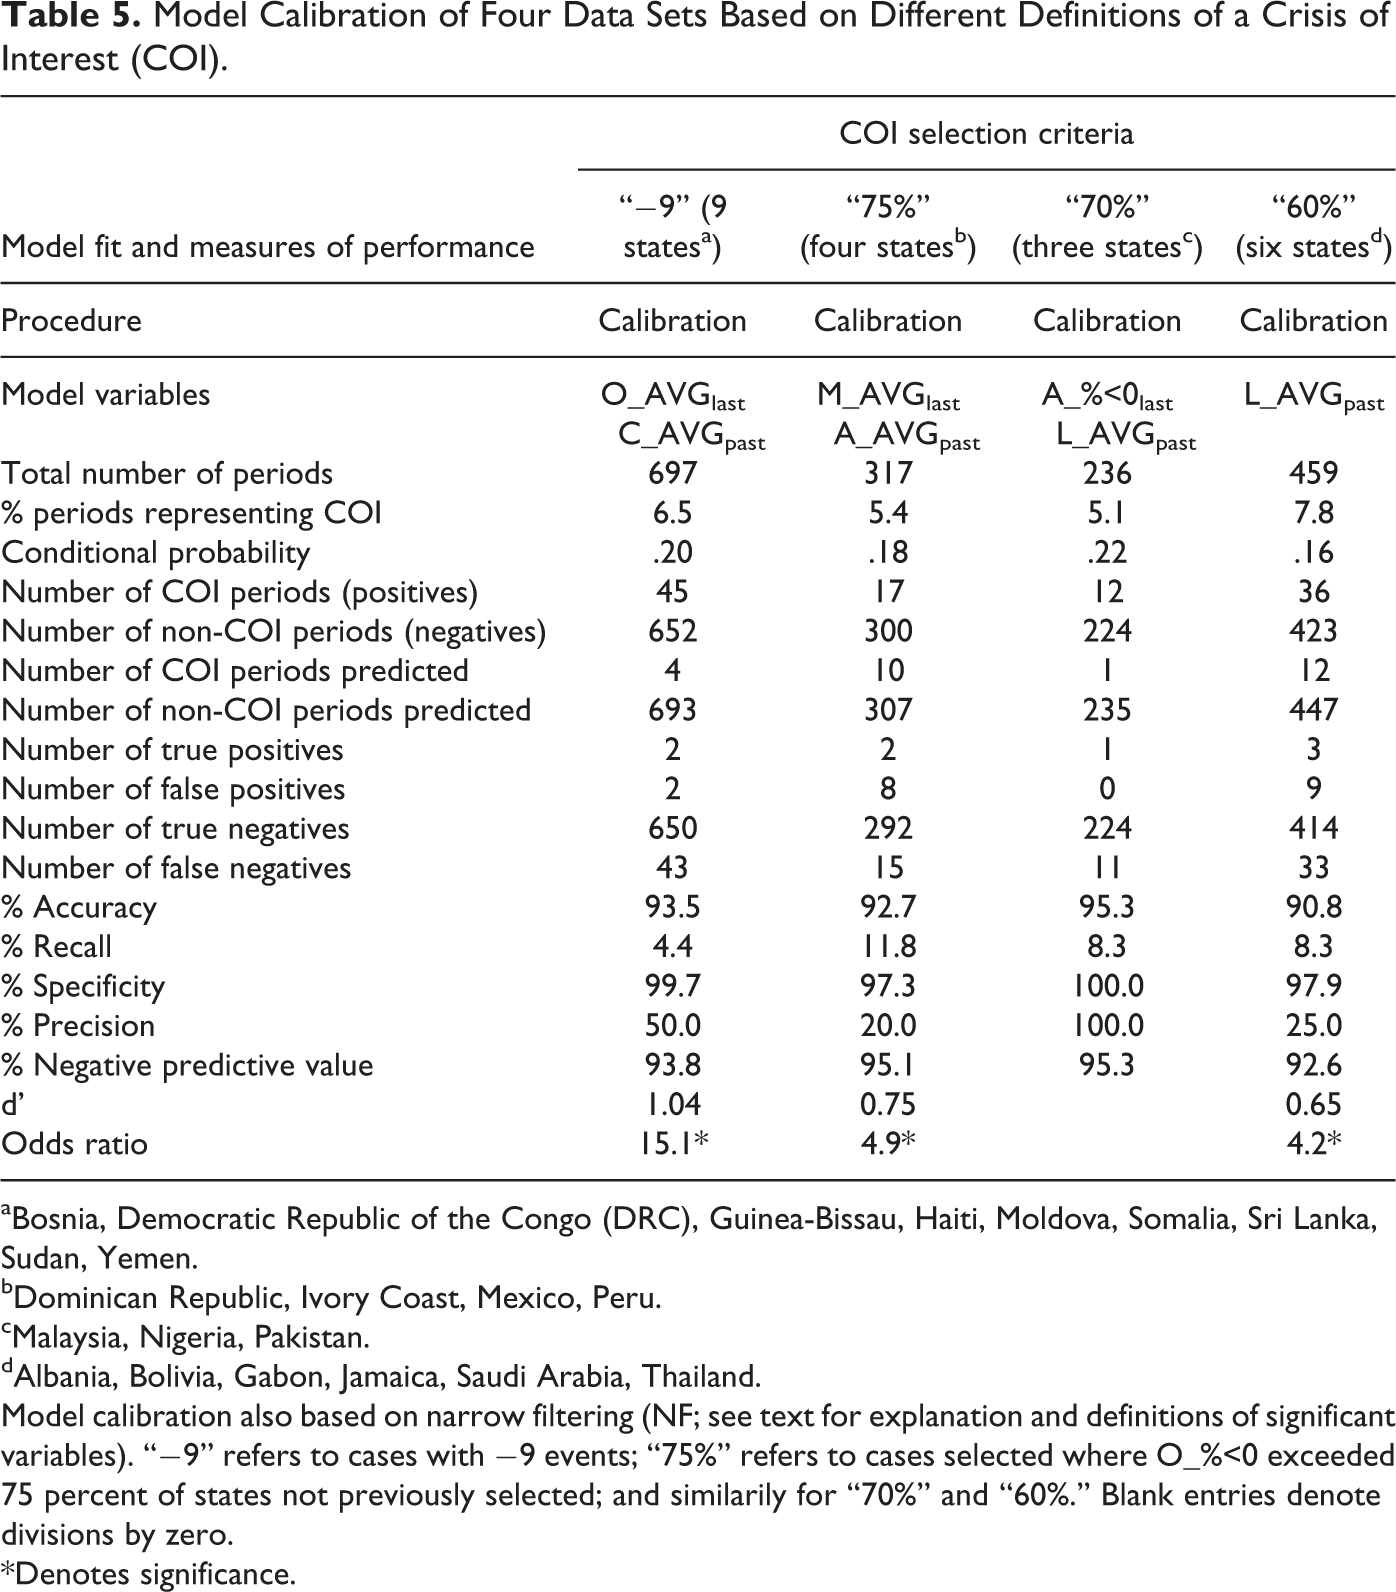
aBosnia, Democratic Republic of the Congo (DRC), Guinea-Bissau, Haiti, Moldova, Somalia, Sri Lanka, Sudan, Yemen.
bDominican Republic, Ivory Coast, Mexico, Peru.
cMalaysia, Nigeria, Pakistan.
dAlbania, Bolivia, Gabon, Jamaica, Saudi Arabia, Thailand.
Model calibration also based on narrow filtering (NF; see text for explanation and definitions of significant variables). “−9” refers to cases with −9 events; “75%” refers to cases selected where O_%<0 exceeded 75 percent of states not previously selected; and similarily for “70%” and “60%.” Blank entries denote divisions by zero.
*Denotes significance.
Lowering the COI threshold even further to those states in which the number of −ve event scores exceeded 60 percent led to the identification of six states (Albania, Bolivia, Gabon, Jamaica, Saudi Arabia, and Thailand) with an average half-monthly COI occurrence of 7.8 percent. Challenges to the state’s legitimacy was the only significant event variable yielding postdictive Precision of only 25.0 percent (Table 5). Recall in all four cases did not exceed 12 percent. Collectively, these cases did not warrant validation testing.
BF events data
The last investigation essentially repeated the above procedure except that BF was applied to the events data (i.e., exclusion of three months of events data analysis following a COI), which lowered the number of events analyzed. In this case, six states (DRC, Guinea-Bissau, Haiti, Sri Lanka, Sudan, and Yemen) had −9 events occurring in more than one half-month period over the four years of events data analyzed (see Table 1). Only challenges to the state’s legitimacy was a significant event variable yielding postdictive Precision of 37.5 percent (see Table 6). Repeating the model calibration for three other groups of states based on increasingly lowered COI thresholds yielded similar results (Table 6) to the analysis with narrow-filtered events data (Table 5), including very low Recall. Again, these cases did not warrant validation testing.
Model Calibration of Four Data Sets Based on Different Definitions of a Crisis of Interest (COI).
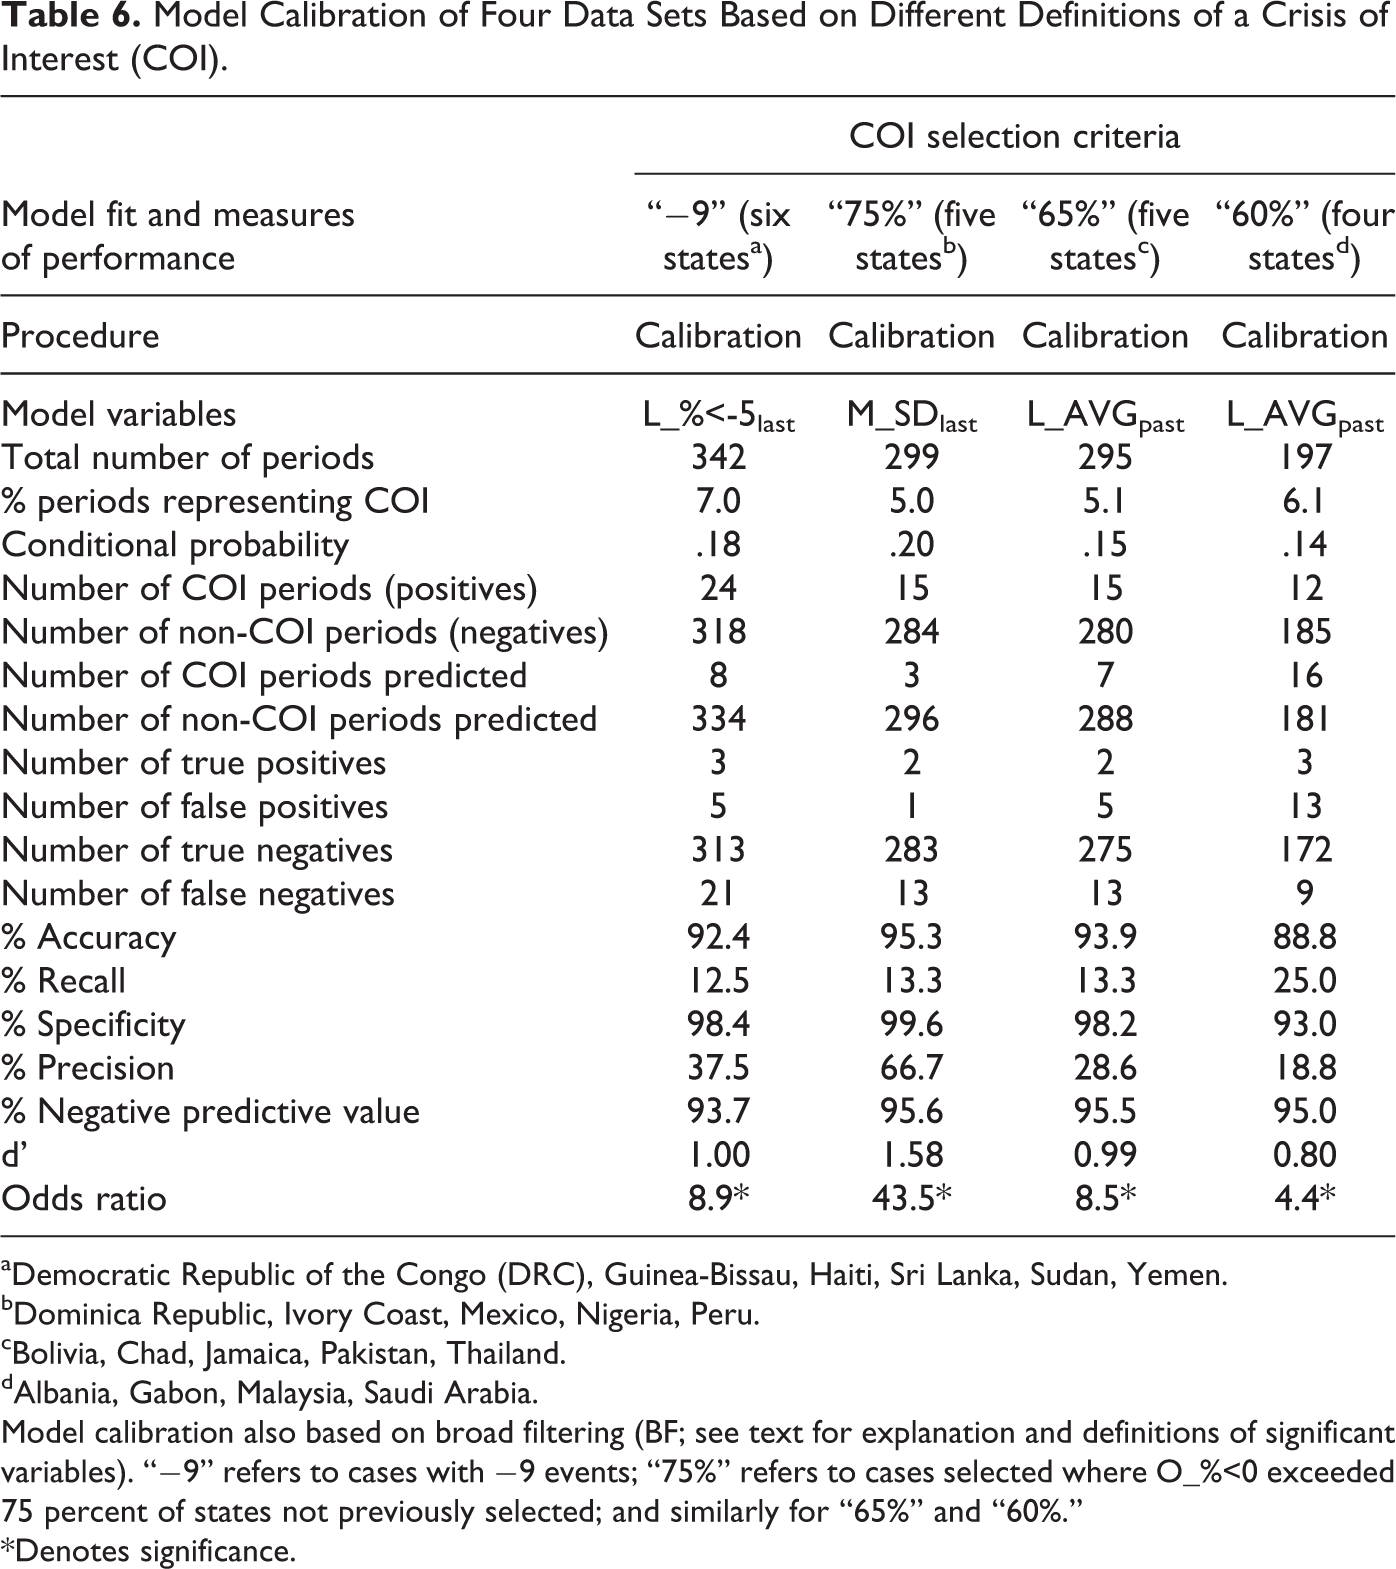
aDemocratic Republic of the Congo (DRC), Guinea-Bissau, Haiti, Sri Lanka, Sudan, Yemen.
bDominica Republic, Ivory Coast, Mexico, Nigeria, Peru.
cBolivia, Chad, Jamaica, Pakistan, Thailand.
dAlbania, Gabon, Malaysia, Saudi Arabia.
Model calibration also based on broad filtering (BF; see text for explanation and definitions of significant variables). “−9” refers to cases with −9 events; “75%” refers to cases selected where O_%<0 exceeded 75 percent of states not previously selected; and similarly for “65%” and “60%.”
*Denotes significance.
Conclusion
Despite various attempts to fit structural factors and events data for the prediction of a COI, whether using data of individual or grouped countries, high Precision (correct number of COIs over total predicted) was obtained in only a couple of cases. High values of Accuracy, Specificity, and Negative Predictive Value were generally achieved, but these can be misleading since their values are largely governed by the prediction of non-COIs, which represented the vast majority of events. The high prediction of non-COIs was driven by the constraint to maximize Precision, which tended to raise the Pr to values that lowered both false negatives and false positives.
Structural factors for the years that COIs occurred were not significantly different from years in which they did not occur. Nor did auto-coded events data prove significantly different for half-monthly periods that preceded a COI from those that did not. Auto-coded events data were incomplete for several countries, and the indices of Country Stability, Hostility, and the Goldstein conflict-cooperation scale were insignificant indicators for other cases. That the structural factors (both FI and PI) were unimportant can be explained by noting that COIs occurred in nearly as many early as later years (Table 1). It is additionally noteworthy that although the assumption that states with increased fragility will experience an increased level of politically violent events was confirmed, the FI values (mostly between 5 and 7) do not suggest that these states were necessarily the poorest performers (Carment, Samy, and Prest 2009).
To help explain why human-coded events data also failed to provide strong model predictions of COIs, an example of the findings is displayed in Figure A4 of Appendix A. In this case, the logistic regression of the calibration events data for Yemen (Table 4) resulted in two significant regressors involving challenges to the state’s authority and capacity, which yielded a prediction of seven COIs in the validation year, but none matched the actual single occurrence. Although these variables had nonzero values prior to the observed COI, they were insufficient to have predicted the COI. Indeed, there are numerous examples of similar mismatches suggesting that such variability in the data is commonplace, making it extremely difficult to identify trends for predictive purposes. Even the postdictive performance of the calibration data was unimpressive. Changing the criterion for best fit by choosing, for example, either maximum Accuracy or when Precision and Recall are equal and at maximal value does not alter the main conclusion. Therefore, the hypothesis that randomly selected events preceding a COI are sufficiently distinct to serve as predictors of an imminent COI is not supported by this study.
This result is not entirely surprising, given the experience and difficulty that others have reported for similar investigations. For example, Goldstone (2008) suggests that “if the actual occurrence of violent conflict depends on a combination of a country’s inherent instability level, plus the presence of a precipitating event of sufficient magnitude whose occurrence is unpredictable, errors in forecasting are inevitable.” O’Brien (2010) reported that domestic political crises based on significant opposition to a state’s governance, but not to the level of armed rebellion or ethnic/religious violence, might be difficult to predict because they are less violent. In our analysis, COIs involved a mixture of destabilizing events; although mostly violent, they included the “domestic political” variety defined by O’Brien. Barton et al. (2008) concluded that “models have difficulties distinguishing a real signal from noise (i.e., identifying and disaggregating unambiguous indicators of conflict and instability from other events in volatile countries).” They went on further to suggest that “even a well-designed model is only as good as the indicators it relies on” While this might help explain the challenge of fitting auto-coded events data due to coverage gaps (Russell and Clark 2009), any explanation regarding human-coded events must go beyond the rigor of the analyses applied in the present study.
Although it is possible that the indicators used to score the events (i.e., state authority, legitimacy, and capacity, and performance clusters of governance, economics, security and crime, human development, demography, and environment) were inadequate and/or incomplete (i.e., indicator selection problem), it is difficult to ascertain where such deficiencies lie, given the comprehensiveness of the indicators examined. The other possibility is that events preceding a COI are inherently highly variable (e.g., the calm before the storm vs. runaway escalation of violent upheaval), defying any reasonable attempt to identify telltale indicators of an imminent COI.
The counsel by Ward, Greenhill, and Blakke (2010) that “[S]tatistically significant variables may actually degrade the predictive accuracy of a model” cautions against removing potential causal factors that are misidentified due to a lack of understanding that a more structured theoretical approach might bring to the analysis. In their analysis, the lack of predictive power is attributed to factors such as misspecified models and aggregation of explanatory factors at too high a level with over emphasis on finding statistically significant relationships and insufficient attention paid to out-of-sample heuristics. We concede that empirical modeling, as conducted herein, is susceptible to these concerns, but we also believe that the thoroughness and rigor of the current study is consistent with their main recommendations using a combination of structural and events data, and then validating the outcomes using split-sample cases.
If COIs are violent events stemming from challenges to a state’s authority, as discovered in this study (described in the following), then perhaps structural factors pertaining to authority should be examined more closely and weighed more heavily than other structural factors. This would be analogous to the weighting schema introduced by Shellman (2004) for politically conflictual and cooperative events assessment. Using only structural data for the period 1980–2006, Carment and Samy (2010) have also recently reported challenges to state authority as extremely significant in explaining state failure onsets. Their finding using large sample analysis confirms the case study evidence that they report for extremely fragile countries. Of the one hundred and nine −9 events analyzed herein, ninety-three were categorized under the combination challenges to the state’s authority and its performance on security and crime. An additional three fell under state legitimacy and governance, and the remaining thirteen were unique mixtures of various event measures.
It appears that a close association exists between structural factors and events, given that the majority of COIs was categorized under challenges to a state’s authority and state performance on security and crime. However, that this association was not borne out of the regression model suggests that such correspondence is incomplete for predictive purposes. Perhaps, the present definition of a COI is too broad to adequately capture intrastate conflict since it allows any type of conflict based on the occurrence of a highly destabilizing event. There is the possibility that specific combinations of indicators, yet to be explored, or the indicators identified herein coupled with other types of observations might yield more promising regressors for early warning of intrastate conflict using a revised definition of a COI. For example, the inclusion of proximate factors (i.e., indicators of change in state tension that fall in between slowly changing structural factors and events reported on a daily basis) is an interesting possibility. Such factors could include refugee flow, arms movement, chronic environmental disturbance, rise in sectarian/ethnic tension, neighbourhood (adjacent state) tension, leadership statements, and so on. The challenge is to quantify what is largely a qualitative feature.
A particularly appealing proximate candidate is the analysis of leadership statements, as endorsed by others implicitly or explicitly. Barton et al. (2008) suggested that prediction algorithms could be improved by accounting for political will, while others specifically recommended the inclusion of leadership analysis in early crisis warning (Clark 2009; Rohloff et al. 2009). Suedfeld and Tetlock (1977), and Suedfeld and Bluck (1988) have demonstrated the possibility of predicting the onset and escalation of interstate conflict through the analysis of leadership statements using integrative complexity theory. This could be expanded further by linking the identities of the event target/targets to the statements of the event’s instigator/perpetrator, whether a state or nonstate actor. By adding this and/or other proximate factors to the combination of structural and events data, model predictions of state instability/conflict might lay quiet current criticisms as voiced by Barton (2008) that “[P]roponents of early warning models claim a success rate in predicting conflict or instability of between 75 and 90 percent. Yet . . . such models have minimal value beyond confirming what is commonly known.”
There is now an emerging literature (see Orrell and McSharry 2009) that argues that predicting the future is a very difficult task because complex systems such as examined in the current study cannot be reduced to mathematical laws and simple models. Complex systems are even hard to define in a wider environment, may never reach equilibrium, and are composed of heterogeneous agents and objects (Batty and Torrens 2005). They are characterized by emergent properties that cannot be predicted by looking at the components of these systems alone, and models tend to be highly sensitive to parameterization. Since complex systems are always evolving, it is very unlikely that the future will resemble the past and hence the inability of “rigid” models to deliver credible forecasts. Orrell and McSharry (2009) recommend that economic models (and by extension socioeconomic–political models) embrace developments in other areas such as network theory and nonlinear dynamics to achieve a class of models that can then be adapted to evolving situations (e.g., agent-based modeling to examine complex systems with emergent behavior). These insights help explain the nonsignificance of the results obtained in this current study and the need to consider alternative methodologies in future research.
In closing, the emergence of intrastate conflict cannot be reliably predicted using randomly sampled recent events and state structural factors via logistic regression. Although methodologically a negative result, thematically this study contributes to our appreciation for the need of a deeper understanding of other indicators that can provide causal linkages to conflicts of interest. While prediction modeling of what is essentially the behavior of humans in violent political conflict is a daunting endeavor, the prospects of success far outweigh the costs in achieving that success. This is especially true if such conflicts can be reliably forecasted in sufficient time for a corrective/mitigating response.
Footnotes
Appendix A
Appendix B
Acknowledgments
The authors thank Quan Lam and Phil Terhaar of DRDC Toronto, Doug Hales, Liz St. Jean, and Jordan Miller of CAE, and Erin Bresnahan, Milana Nikolko, Simon Langlois-Bertrand, and Priyanka Debnath of Carleton Univeristy for their assistance with this research. The authors also thank the reviewers of this article and Christian Davenport for their many constructive suggestions. This work was funded by a Department of National Defence (Canada) Technology Investment Fund Project 15dz01 under the authority of Dr. David Mandel.
Authors’ Note
Note on data availability: All data involving events descriptions and scoring of events are available on http://jcr.sagepub.com. Methodological details are described in the text. Inquiries should be directed to the authors.
Declaration of Conflicting Interests
The authors declared no potential conflicts of interest with respect to the research, authorship, and/or publication of this article.
Funding
The authors disclosed receipt of the following financial support for the research, authorship, and/or publication of this article: This work was funded by a Department of National Defence (Canada) Technology Investment Fund Project 15dz01 under the authority of Dr David Mandel.
Notes
References
Supplementary Material
Please find the following supplemental material available below.
For Open Access articles published under a Creative Commons License, all supplemental material carries the same license as the article it is associated with.
For non-Open Access articles published, all supplemental material carries a non-exclusive license, and permission requests for re-use of supplemental material or any part of supplemental material shall be sent directly to the copyright owner as specified in the copyright notice associated with the article.