




Abstract
A number of recent studies argue that there is decline in armed conflict within and between nations. Gohdes and Price run against the grain in arguing that there is no evidence for a decrease in battle deaths in armed conflicts after World War II and that the trend reported in our earlier articles is spurious. However, they do not plausibly justify this thesis. We reexamine the argument for a decline, exploring nonlinearities in the data and potential biases due to measurement error. We find that very strong assumptions must hold in order for measurement errors to explain the trend in battle deaths.
Several high-profile books have recently argued that both civil and interstate conflicts are in decline (Goldstein 2011; HSRP 2011; Pinker 2011). 1 Such trends in conflict are of much wider interest than an esoteric academic dispute about data. Thus, it is important, for both theory and policy, that flawed analysis not be allowed to obscure the very strong evidence that deadly violence in the world has been declining.
Gohdes and Price argue that the PRIO Battle Deaths Dataset does not provide convincing evidence of a decline in per capita battle deaths since 1946. However, there are a number of missteps in their analysis. In this article, we improve on their critique by laying out the strongest possible case for a spurious negative trend in battle deaths. We conclude that it is unlikely that model specification or measurement error explains the decline.
Our reply has four sections. The first deals briefly with some of the issues of data quality raised by Gohdes and Price (2012). The second addresses their discussion of the nonlinearity of the trend in battle deaths since 1945. Nonparametric tests show that the negative trend is not dependent on the assumption of linearity. Finally, we improve on Gohdes and Price’s investigation of the uncertainty in the data. There are more sound and straightforward means of investigating measurement error than the simulation Gohdes and Price ran. We complete such an analysis and find that, in order for the negative trend to be an artifact of measurement error, multiple extreme assumptions must hold.
Issues of Data Quality
Gohdes and Price offer a valuable opportunity to discuss the role of data quality in the study of conflict. Their article also gives us a chance to revisit the trend in battle deaths documented in Lacina and Gleditsch (2005) and Lacina, Gleditsch, and Russett (2006), focusing on the robustness of that trend to model specification and measurement error. Before turning to such an analysis, we briefly discuss the sections of Gohdes and Price’s article that deal with data quality. They make a few points with which we fundamentally disagree and one mistake that we wish to rectify.
First, Gohdes and Price have misread the data set’s codebook in their analysis of missing best estimates. The data set is organized by conflict-year (e.g., Korean War 1950; Korean War 1951; Malaysian Emergency 1950). They correctly note that there are 771 conflict-years (40 percent) for which no best estimate is available, only a low and high estimate of deaths. They wrongly equate the lack of a best estimate to a reliance on the range of battle deaths reported in Uppsala Conflict Data Program (UCDP)/PRIO’s Armed Conflict Dataset (Gleditsch et al., 2002), which is the list of conflicts upon which the PRIO Battle Deaths Dataset is based. When UCDP/PRIO’s range of deaths is the only available information, the Battle Deaths Dataset records the bottom and top of that range as low and high estimates. The best estimate is missing. 2 But there are just 286 conflict-years coded in this manner. In the remaining 485 cases of a missing best estimate there is more detailed, conflict-specific information available for creating low and high estimates. However, there is insufficient information available for adjudicating between these values in order to choose a best estimate. Gohdes and Price’s misunderstanding of the absent best estimates implies that there is less information in the data set than there in fact is.
On a more general point, Gohdes and Price argue that the absence of year-specific figures for a number of conflicts makes the PRIO Battle Deaths Dataset unsuitable for analysis of trends. 3 This is an extreme conclusion. Even when the only available information is the total number of deaths in a conflict, the conflict itself is assigned to a specific interval of years. These intervals tend to be short. There are 57 multiyear conflict periods in the PRIO data for which only a total estimate of battle deaths is available. The median number of years in such a period is four. Conflicts for which no annual information is available also tend to be low intensity wars, such as the Cypriot war of independence or the Tripuri insurgency in India. The conflict periods of five or more years that lack trend information have a median high estimate of 28,000 total battle deaths, about 1.4 percent of the average five-year global toll in battle deaths. Such relatively low-intensity wars are unlikely to have much influence on global trend estimates regardless of which years in these conflicts were the most deadly.
Third, and most importantly, Gohdes and Price offer a confused discussion of the strengths of different sources of fatality estimates. They distinguish between methods that “offer statistically reproducible measures of uncertainty” (000) and data that “are not statistical estimates” (000). They correctly point out that one of the virtues of statistical sampling is that sampling-related uncertainty can be quantified. They contrast this advantage to data that are not based on random sampling, for which “no quantification of (possible) errors exists” (000). Such data are therefore “unrepresentative in an unknown way” (000). 4
Uncertainty and unrepresentativeness (bias) are not the same, however. Sampling-based surveys, multiple-system estimation (MSE), and convenience data all have in common the problem that their biases are hard to quantify or even sign. A MSE fatality estimate, for example, comes with confidence intervals that capture uncertainty due to sampling. Yet, the bias in the estimate may be such that the true figure is much higher or lower than those confidence intervals imply. For example, bias may be due to a problem Gohdes and Price point to in their critique of convenience data: not all fatalities are equally likely to be detected by all compilers of information (Jewell, Spagat, and Jewell 2011).
Giving pride of place to statistical methods also leads Gohdes and Price to omit an entire category of high-quality fatality data, that collected through vital registration or enumeration. Militaries in particular tend to be enthusiastic enumerators. Thus, the US Department of Defense’s tally of soldiers killed in action does not come with estimates of uncertainty nor is it obtained through randomization. It nonetheless provides very credible data. To be sure, the availability of reliable count data is the exception rather than the rule in war. However, when such information is available it is often preferable to the data that could be obtained by statistical sampling. For instance, after the fall of the USSR, declassification provided researchers with the Soviet military’s estimates of rebels and soldiers killed during nationalist insurgencies in the Baltics between 1945 and the early 1950s (Anušaukas, 2000). A survey probably could not improve on these figures. A survey’s recall period would be at least 62 years, there would be strong social-desirability bias in favor of reporting involvement on the rebel side, and the local pro-Soviet population has presumably had high rates of out-migration. Any survey-obtained estimate of deaths would probably be of lower-quality than the archival figures.
We have touched on the most serious problems in Gohdes and Price’s reflections on data quality. Ultimately, much of that discussion is irrelevant to whether the Battle Deaths Dataset can be used to study trends. Gohdes and Price need to establish the possibility of a temporally varying bias in the data set. We propose and investigate such an argument in later sections of this article. First, however, we discuss the nonlinearity in the downward trend in battle deaths.
The Uneven Decline in Battle Deaths
Gohdes and Price’s statistical analysis begins by highlighting the nonmonotonicity of the trend in battle deaths. By adding a dummy variable for the period 1946–1950, fitting a cubic model to the data, and by excluding the earliest years of the time series from their simulation, they demonstrate the presence of nonlinearity and highlight the role of outliers.
Indeed, when plotted over time, battle deaths are a series of spikes and valleys. Figure 1 plots the low and high estimate of battle deaths per 100,000 people from 1946 to 2008.
5
Lacina and Gleditsch (2005) point out that the data are dominated by several peaks, each somewhat lower than the last:
Low and high estimates of deaths in battle per 100,000 people. Calculated from the PRIO Battle Deaths Datatset, v 3.0. although there have been multiple major international security crises their military scale has progressively diminished. . . . The very large conflicts that these peaks represent almost overwhelm the rest of the curve (p. 155). [the] “flat-line” finding [reported by Sarkees, Wayman, and Singer (2003)] is driven primarily by the massive spikes in the middle of [the] timeline representing the two World Wars. These wars were several orders of magnitude more deadly than any conflicts before or since, and their presence in the regression line obscures other trends.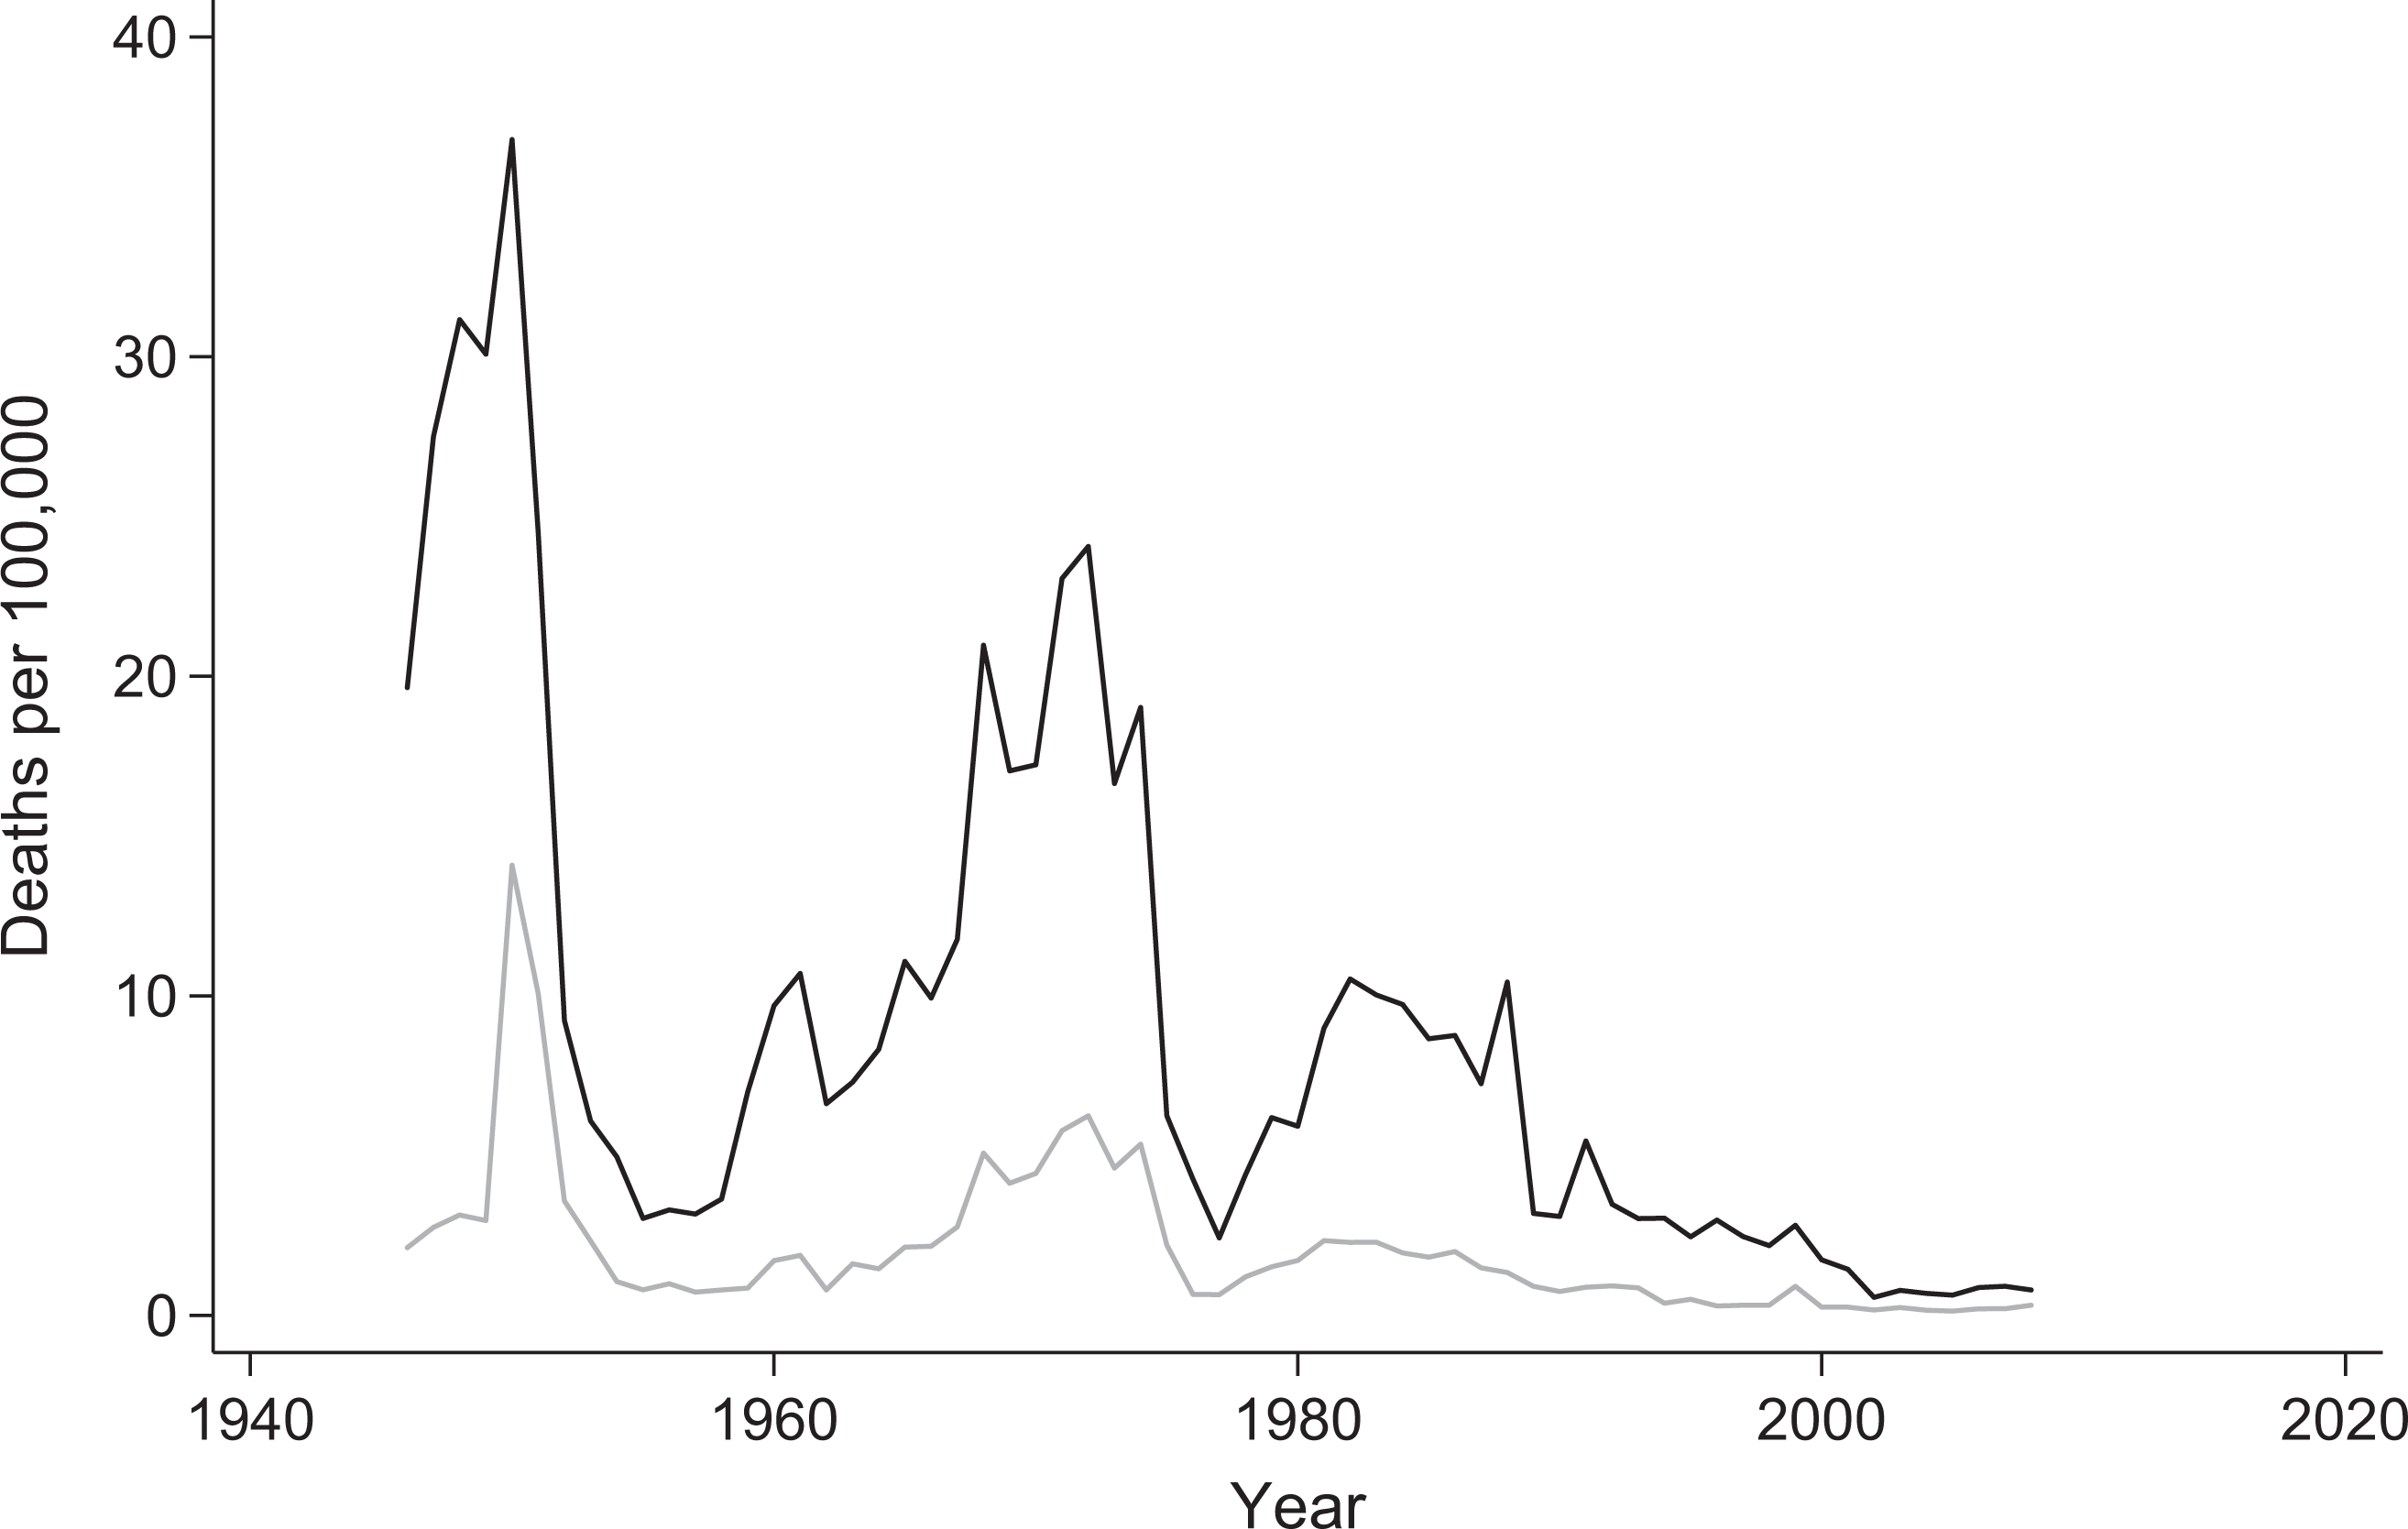
One implication of the spikiness of battle deaths over time is that a polynomial will be able to fit the data more exactly than a line. It should also be obvious just by looking at Figure 1 that a flatter ordinary least squares (OLS) line will be produced by truncating the series at 1950 or allowing the observations for 1946–1950 to have a unique intercept. In either case, the fitted line will start and end in “valley” years and be rather flat.
However, there are more systematic means of dealing with nonlinearities in data than fitting an arbitrary polynomial or dropping outliers. For example, we can apply a smoothing function to the time series of battle deaths. By considering a moving window of data, a smoothing function also helps to address Gohdes and Price’s concern that the data for some conflicts cannot be trended by year. Figure 2 plots locally weighted linear regressions of the low and high estimates of worldwide battle deaths normalized by population. 6 The resulting functions are not monotonically decreasing. However, they certainly preserve the appearance of an overall downward trend.
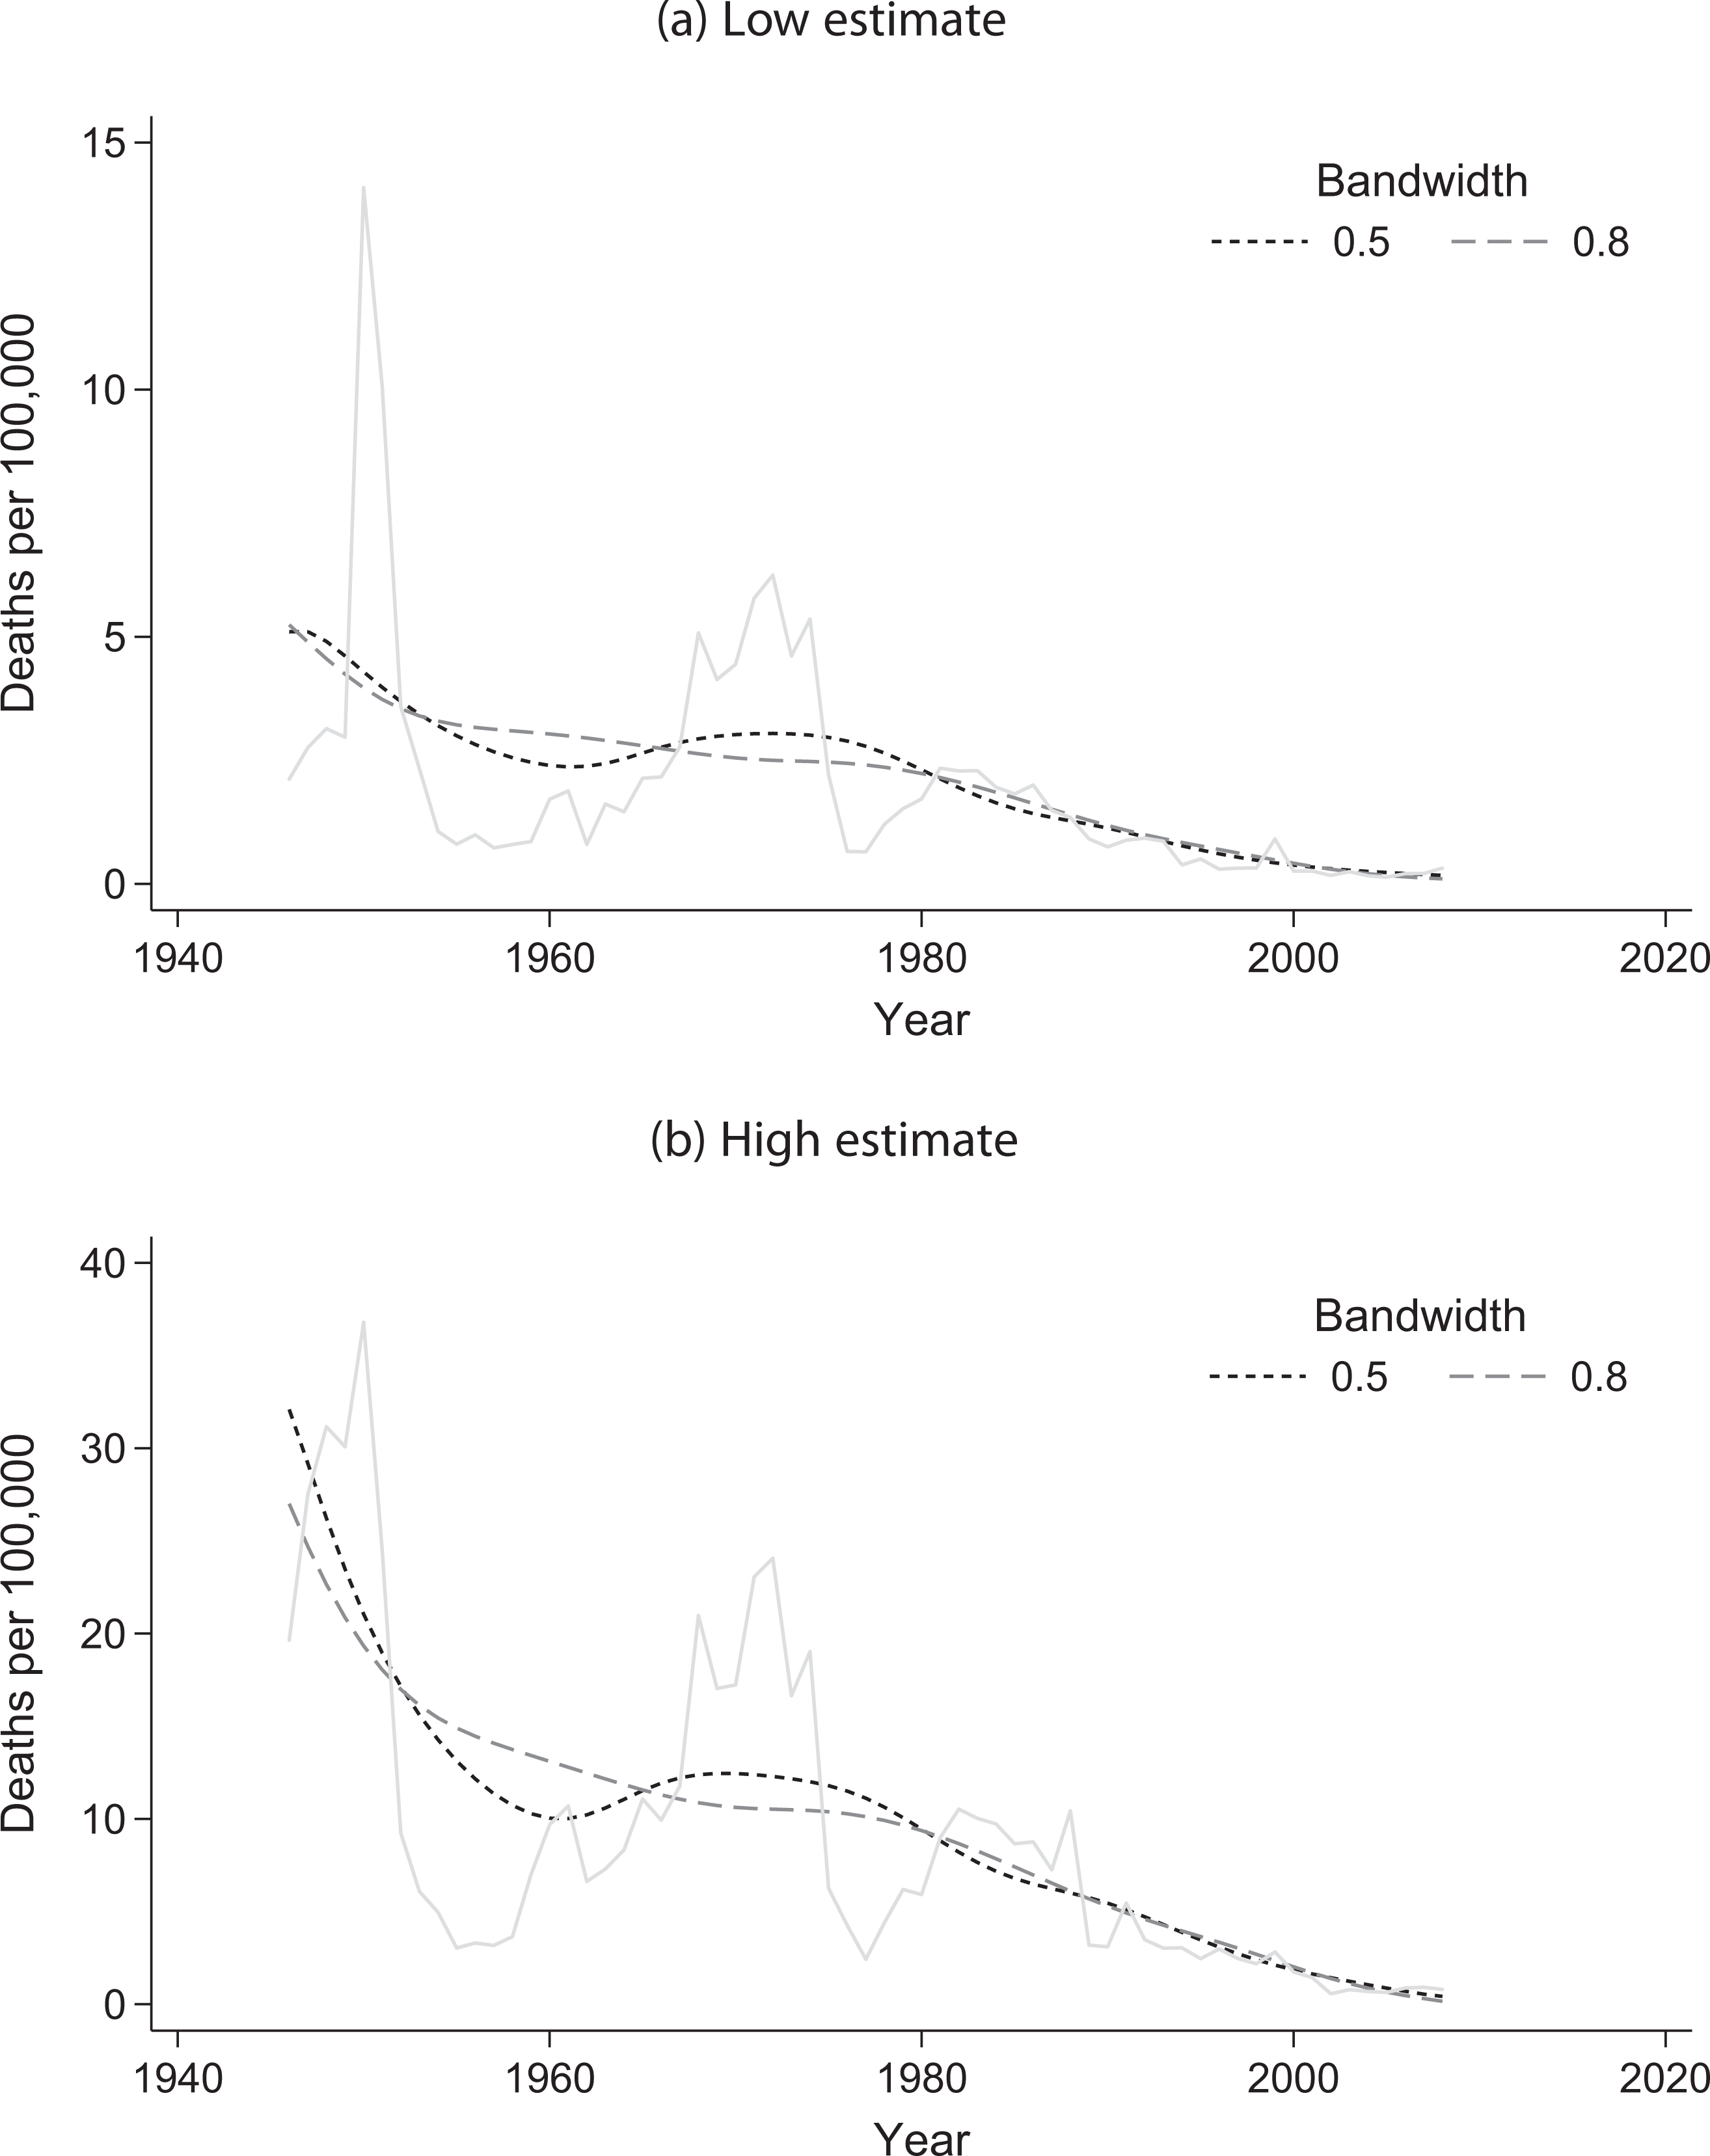
Locally weighted regressions of time versus low and high estimates of global battle deaths per 100,000 people.
The smoothing functions do not produce test statistics. For hypothesis evaluation, we need a nonparametric test for a trend. We have chosen Kendall’s

Under the null hypothesis of no trend in the data, the expected value of
For both the low and high series of estimates, we find a negative and statistically significant
The OLS Regressions and Kendall’s Rank Tests for a Trend in Battle Deaths Divided by Global Population, 1946–2008.
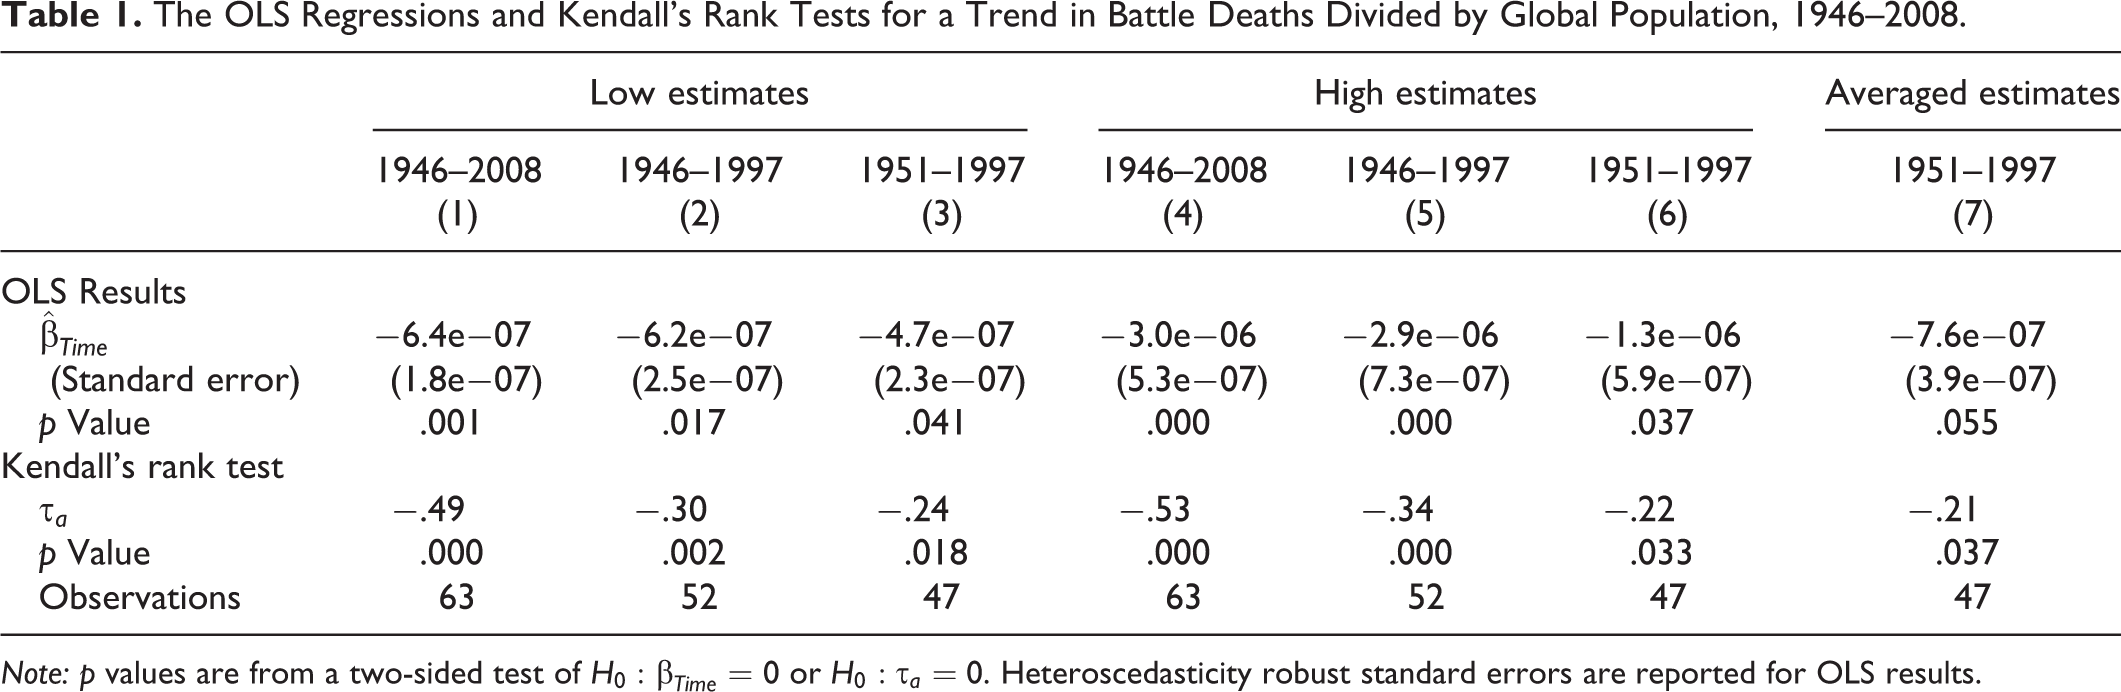
Note: p values are from a two-sided test of
Estimating Uncertainty
The second task Gohdes and Price set to themselves is to model the uncertainty in the trend in battle deaths due to measurement error. To do so, they construct 1,000 time series by randomly choosing one of the available estimates (low, high, or best) for each conflict-year. They sum these conflict-year figures into annual global totals and normalize by population. Then, they calculate OLS regressions for each of the resulting time series. They report the average
The expected value of battle deaths under this sampling procedure is the mean of the available estimates for each conflict-year. The simulation therefore recovers the same
Gohdes and Price do not provide a full-fledged justification for truncating the time series or for randomizing the selection of estimates instead of, for example, estimating a regression using all the high estimates or all the low estimates. Their procedure should not be confused with bootstrapping, which draws random samples of a data set and repeatedly estimates a statistic. Bootstrapping the estimates in Table 1 would involve drawing random samples of years.
A potential rationale for Gohdes and Price’s procedure is to recover the range of
Since the assumption of the equal probability of each possible draw of the low, high, and best conflict-year figures is not tenable, averaging the values of
Measurement Error and Reanalyzing the Trend in Battle Deaths
Gohdes and Price lack a coherent explanation of how uncertainty in the battle deaths data would translate into a spurious trend and their simulation does not properly investigate this possibility. In this section, we explore the most plausible reasons that measurement error might produce a negative trend in battle deaths.
The argument that Gohdes and Price need to make is that the uncertainty in the battle deaths data is neither random nor merely changing in variance over time. Rather, they should argue that the measurement errors have a directional bias that varies with time. The worst case scenario for our hypothesis would be if the early estimates are systematically inflated by measurement error and the later estimates systematically deflated by measurement error. More plausibly, measurement error may run in a single direction but be more severe in some periods than in others. For example, perhaps lower in quality data are systematically inflated. The downward trend might then be an artifact of increased accuracy. A spurious trend could also be generated by relatively accurate early data combined with later data that have systematic negative errors, although this scenario seems unlikely, given that indicators of data quality, such as presence of a best estimate and availability of trend information, increase over time.
Underestimates or Overestimates?
To make a well-supported argument about how measurement error might create a spurious trend in battle deaths, we need to consult the literature on probable biases in the various sources in the PRIO data set.
First, there is near consensus that compiling incidents from media sources leads to underestimates of deaths (Spagat et al. 2009, fn12). Davenport and Ball (2002) and Restrepo, Spagat, and Vargas (2006) have argued that media sources underreported deaths in conflicts in Guatemala and Colombia. Earl et al. (2004) find underreporting of protests even in the media-saturated United States. The downward bias of media-based data may influence the PRIO Battle Deaths Dataset, given that one of its sources is UCDP’s fatalities data set (UCDP 2011b) available for 1989 through 2011. The UCDP data are based primarily on media report coding and therefore are a potential source of underestimation in the PRIO data. 10 However, we doubt that the use of UCDP’s figures represents a major confound. In the post-1989 period, there are usually alternative estimates available to weigh against UCDP’s figures. As a result, estimates in the PRIO data set are almost always higher than those in UCDP’s data.
The PRIO data set rarely has relevant surveys or MSEs from which to draw information. Those that are available tend to be for more recent conflicts. Both under- and overestimation of mortality are possible when these methods go awry. However, as Gohdes and Price point out, the intense scrutiny that studies of this kind frequently receive helps to pinpoint errors in particular cases. Thus, we doubt that these sources create a systematic bias in the PRIO battle deaths data.
Official death statistics, generally compiled by enumeration, are another major category of battle deaths’ data. Such information may be released immediately; revealed through declassification (e.g., Ryan, Finkelstein, and McDevitt, 2003); or collected in connection with legal proceedings (e.g., Tabeau and Bijak 2005). Some states do not have the capacity to collect this kind of information and available figures may be suspect because of the agenda of the government releasing the data. We do not know of research that has established whether governments, on average, have an incentive to exaggerate or minimize their loses. There may, however, be some systematic bias in government-released enumerations toward underestimation, because in any enumeration-based procedure some deaths can be missed entirely.
Finally, the PRIO Battle Deaths Dataset draws heavily on expert assessments, a potential source of overestimation. Expert estimates of deaths might be influenced by the ease with which people remember events over nonevents. This availability bias can lead to “disproportionate risk assessment . . . due to the exposure to negative outcomes even if the event is itself rare” (Kynn 2008, 244). Another possible source of upward biases in expert estimates is the blurring between expertise and advocacy. Experts may overestimate deaths because they seek to draw attention to ongoing conflicts or to underline the importance of the conflict on which they specialize (Cohen and Green 2012).
Given that the biases in PRIO’s sources run in different directions, can we say anything about how measurement error has evolved over time? PRIO’s estimates for more recent conflicts tend to draw on a larger number of sources than those for earlier conflicts. Incident-based analyses, MSE, and surveys are particularly rare in the early parts of the data; official figures and expert assessments are more important. We have suggested these two sources have countervailing biases, the former toward underestimation and the latter toward overestimation. The relative magnitude of these biases is not known. However, the most plausible case for measurement error creating a spurious trend would argue that errors in official sources are relatively unimportant, perhaps because these errors are random or small, while expert assessments create systematic overestimation. Higher quality recent data do not have these errors. The negative trend in the data is thus a product of increased accuracy. The next section evaluates how likely it is that changes in measurement error over time account for the trend in battle deaths.
The Potential Effects of Measurement Error
As already noted, the worst-case scenario for our claim of a decline in battle deaths is the case in which the low estimates of battle deaths are correct in early years in the data set and the high estimates are correct in later years. In order to explore this scenario, we can regress battle deaths on time or perform a rank test using data series of battle deaths composed of only low estimates prior to a certain year and only high estimates thereafter. This procedure can also be used to find the upper bound on
To begin our analysis, we construct time series with low estimates before a cutoff year and high estimates after that year. We create 63 such series, using every year from 1946 to 2008 as the cutoff between low and high estimates. Then, we estimate an OLS regression and find Kendall’s
Figure 3 plots the values of

The black line in Figure 4A plots the p values from a two-tailed test of the null hypothesis that the OLS coefficient on time is zero. The black line in Figure 4B does the same for Kendall’s rank test (

Statistical significance tests from OLS regressions of battle deaths on time and of Kendall’s
However, relaxing the extreme assumptions used to build these data series quickly produces more robust trend estimates. Consider what happens if we modify the time series just described by using the best estimates for conflict-years where they are available. If there is no best estimate, we record the low estimate of deaths in a conflict-year before a cutoff year and the high estimates after that cutoff year. We then sum to obtain the global annual battle deaths. This procedure admits the possibility of inflation in earlier estimates and deflation in later estimates for conflict-years where little information is available. However, where best estimates are available, they are presumed to be the most likely values. The p values from statistical tests using these time series are plotted as gray lines in Figure 4A and B. Now we obtain a statistically significant trend estimate regardless of the year at which the low estimates give way to high estimates.
Thus far, we have entertained the possibility that the average measurement error in the data runs in opposite directions in different eras. However, we can think of no plausible reason why average measurement error would have flipped direction. Instead, we believe the most plausible argument for a spurious trend is that heavier reliance on expert assessments in earlier conflicts means that the data have an upward bias that diminishes over time. A negative trend is generated by increasing accuracy of the data. To explore this possibility, we construct another set of 63 series based on using low estimates before a cutoff year and best estimates thereafter. 13
It is also possible that the early data are roughly correct but the later data are systematically biased downward. Such errors would also produce a spurious negative trend. Our fourth set of sixty-three data series uses best estimates before a cutoff year and high estimates thereafter. 14
The p values from OLS regressions and rank tests using the two sets of data just described are plotted in Figure 5. The test statistics are all statistically significant at the 90 percent confidence level and generally at 95 percent, in both the OLS and rank test results. Thus, the trend appears robust to the possibility of unidirectional measurement errors that vary in severity over time.
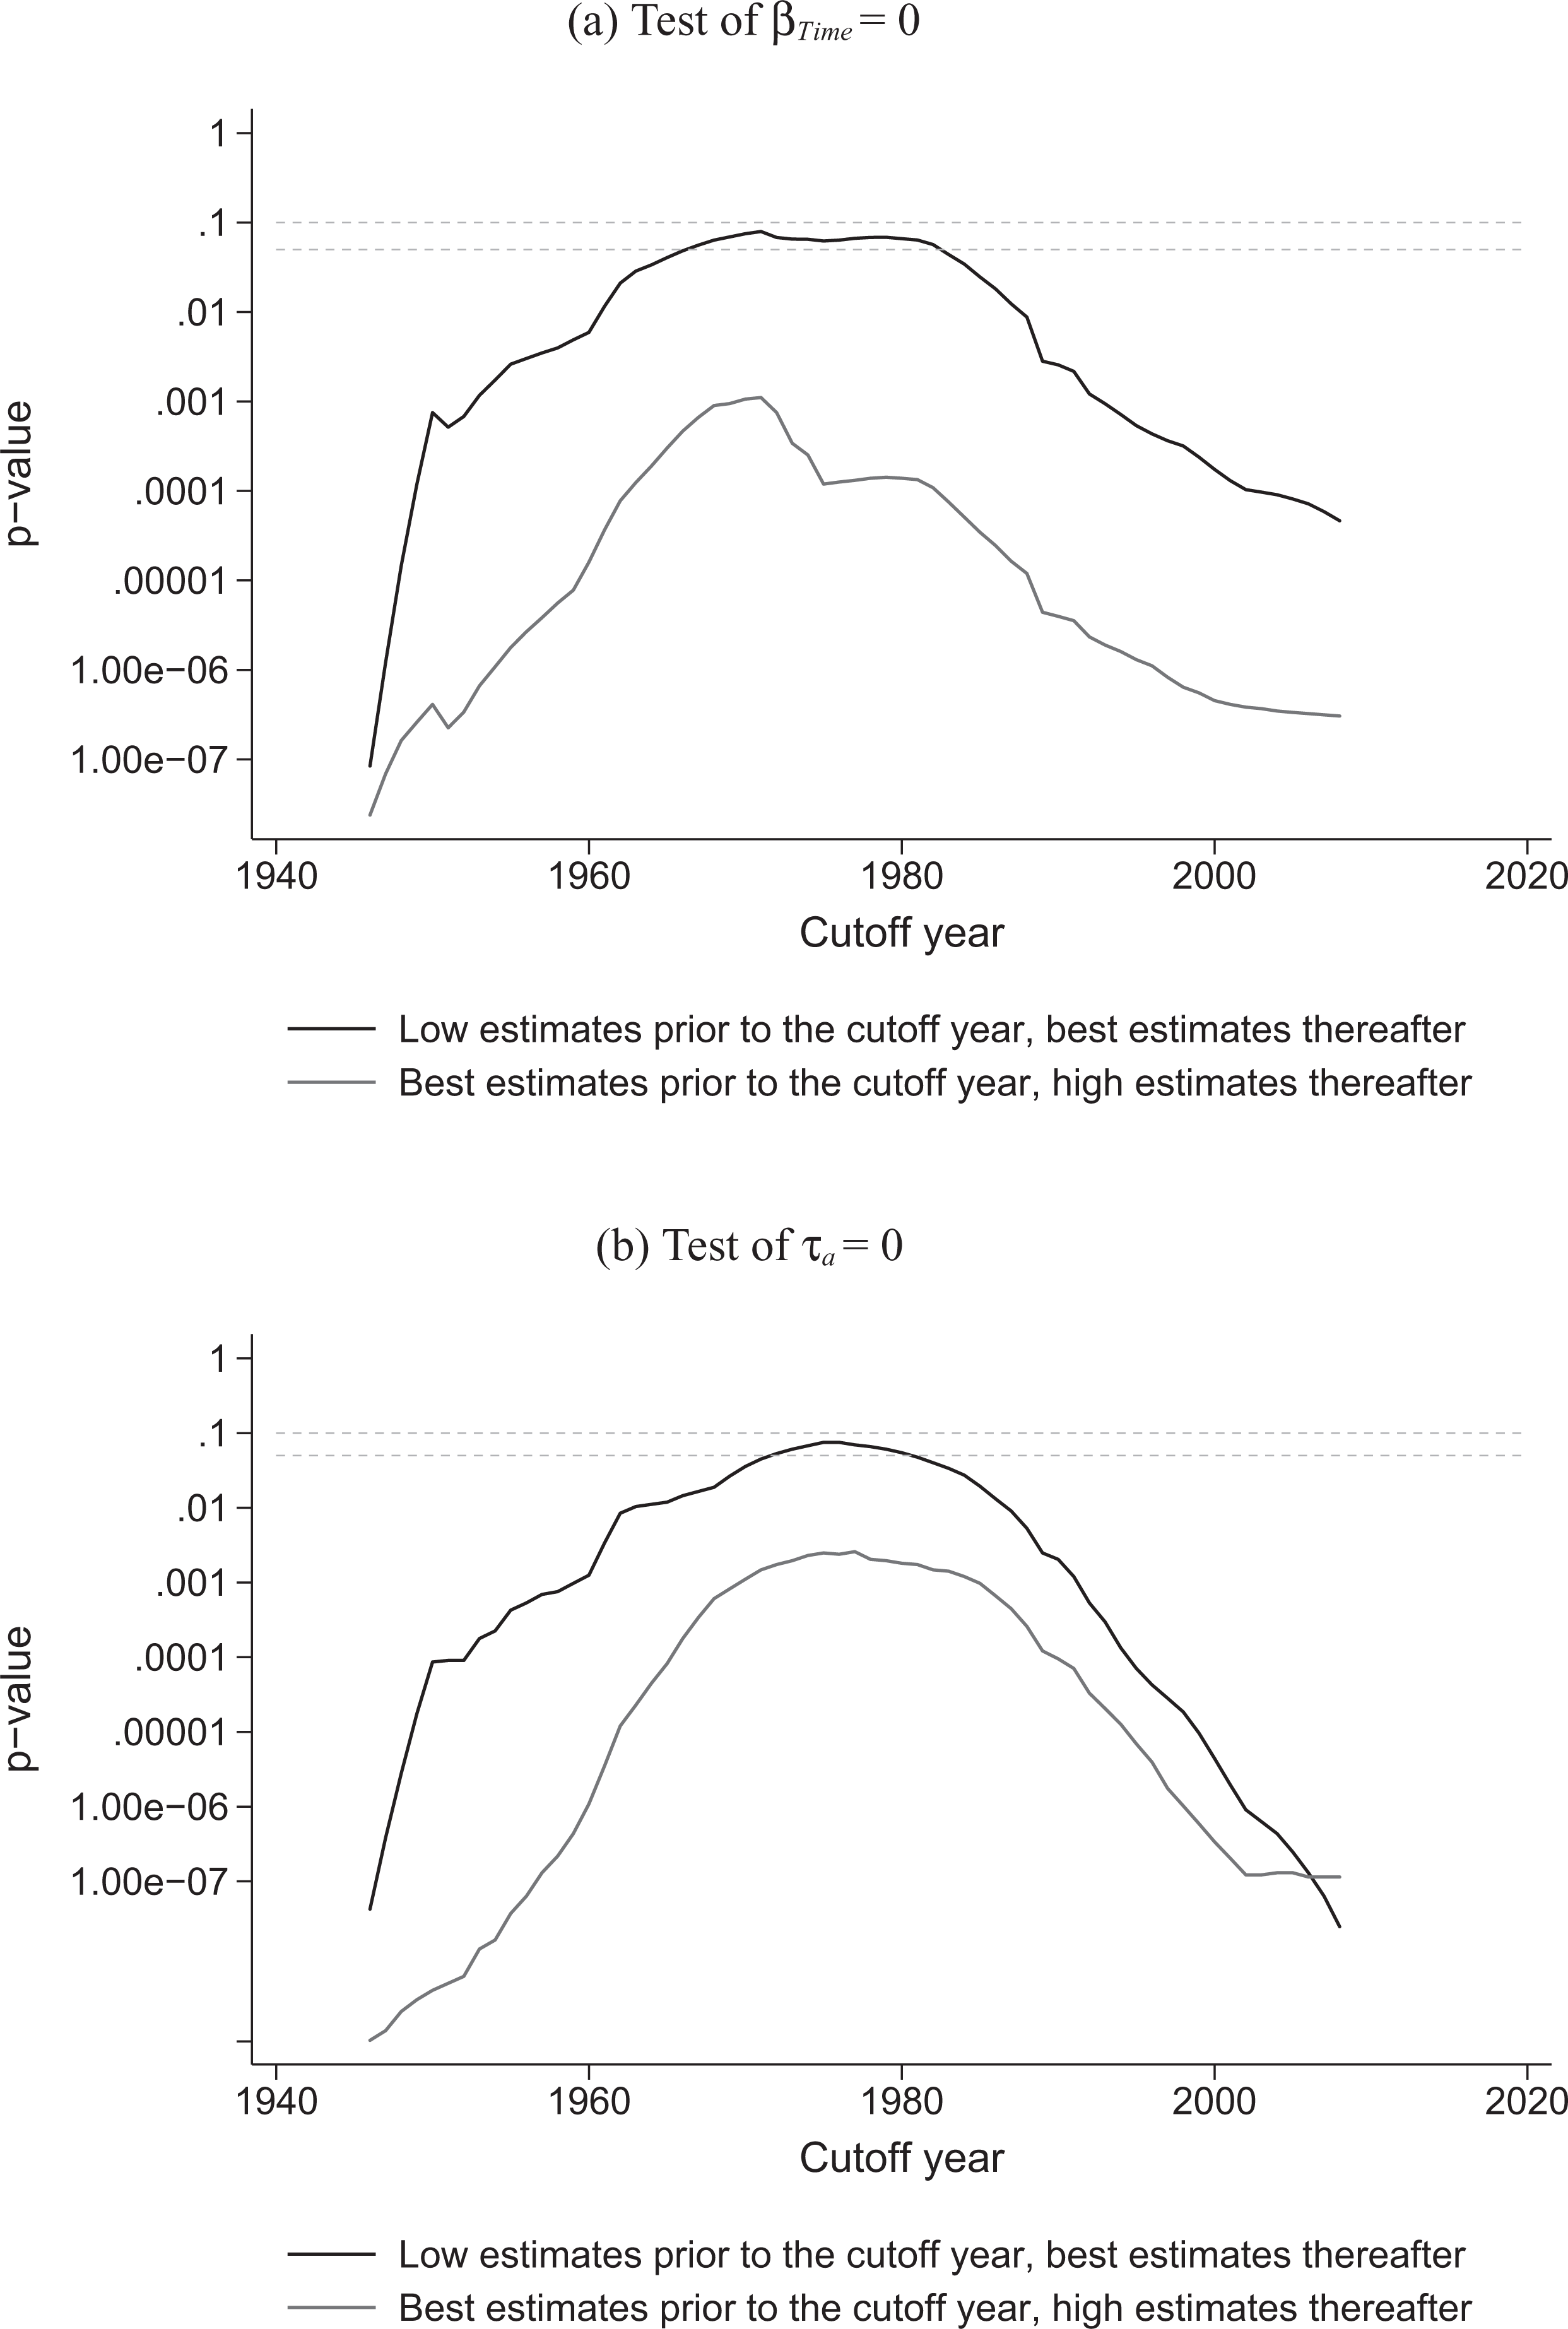
Statistical significance tests from OLS regressions of battle deaths on time and of Kendall’s
The preceding analysis shows what needs to hold in order for the negative trend in battle deaths between 1945 and 2008 to be the result of measurement error. Such error must have produced systematically inflated estimates in early data and systematically deflated estimates in later data. If the bias in the data runs in only one direction but varies in magnitude over time, the estimate of a negative trend is robust (cf. Figure 4 and Figure 5). After reviewing the potential biases in our sources, we do not believe that it is plausible that measurement error flips in this way. Even if it does, when the best estimates of battle deaths are used where they are available, a statistically significant negative trend obtains even under the extreme assumption of errors that reverse direction over time (cf. estimates in Figure 4). Thus, in order for measurement error to explain the observed trend, we have to assume that the best estimates contain very little information about the most likely values in the data and that the direction of the bias in the data is changing over time.
Conclusion
Gohdes and Price recognize that the PRIO data are the most comprehensive information available on battle deaths after World War II. They are not optimistic that new investigations of long-past conflicts could substantially improve on the data set. Thus, researchers interested in trends in conflict must decide whether the data constitute a preponderance of evidence or whether there is too much uncertainty to warrant a conclusion. Our investigations suggest overwhelming evidence for a negative trend in battle deaths between 1946 and 2008. Nonparametric modeling shows that the trend is not an artifact of a linearity assumption. It is also very unlikely that the trend is the result of measurement error. In sum, Gohdes and Price’s conclusion that the available evidence of a trend is insufficient requires an extraordinary tolerance for Type II error—the error of seeing nothing when we have an opportunity to learn about the world.
Footnotes
Appendix
Consider two parallel series of data for the years
The equation to be estimated by OLS is
Consider an arbitrary sequence of
The OLS estimator of
By substituting
By equation (A2),
Similar reasoning can show that
Applying the analysis above to the entire time series,
Acknowledgments
We would like to thank Bruce Russett for advice and input throughout the writing of this paper. Thanks are also due to Kevin Clarke, Kristian Skrede Gleditsch, Joshua Goldstein, Håvard Hegre, Gary King, Joakim Kreutz, Andy Mack, Håvard Nygård, Steven Pinker, Mike Spagat, and Gerdis Wischnath. Gleditsch acknowledges funding from the Research Council of Norway. The PRIO Battle Deaths Dataset can be downloaded from www.prio.no/cscw/cross/battledeaths. Replication data for this article are available at jcr.sagepub.com and  .
.
Declaration of Conflicting Interests
The authors declared no potential conflicts of interest with respect to the research, authorship, and/or publication of this article.
Funding
The authors disclosed receipt of the following financial support for the research, authorship, and/or publication of this article: Nils Petter Gleditsch would like to acknowledge the financial support of the Research Council of Norway.
Notes
References
Supplementary Material
Please find the following supplemental material available below.
For Open Access articles published under a Creative Commons License, all supplemental material carries the same license as the article it is associated with.
For non-Open Access articles published, all supplemental material carries a non-exclusive license, and permission requests for re-use of supplemental material or any part of supplemental material shall be sent directly to the copyright owner as specified in the copyright notice associated with the article.
