



Abstract
There has been much disagreement about the relationship between civil wars and state economic performance. While civil war is often associated with poor economic performance, some states have managed robust growth despite periods of domestic armed conflict. We find this disagreement results from not accounting for the spatial distribution of conflict within a country. A robust literature in economics stresses the role major cities play in economic growth. We hypothesize that the economic impact of civil conflict is contingent on the conflict’s location relative to major urban centers within a state. We use subnational data on the location of conflict relative to urban areas to test the impact of domestic conflict on annual gross domestic product growth. In doing so, we bridge the economic development literature on the importance of cities with extant literature on the effect of armed conflict to provide a novel explanation for the paradox of high macroeconomic growth in conflict-ridden countries.
Introduction
Understanding the effects of civil conflict has become an integral component of the study of economic development (Serneels and Verpoorten 2015). From a theoretical perspective, there is little consensus about the impact that conflict has on economic performance. While neoclassical models predict that recovery from conflict should be relatively quick, others such as Barro and Sala-i-Martin (2004) and Sachs (2006) argue that recovery will be extremely slow or even trapped in a low-level equilibrium. Empirical analyses have borne no clear answers either, as results on the economic ramifications of civil war vary depending on the cases and time periods included (Kang and Meernik 2005).
Further, few in the literature have sought to explain puzzling cases of domestic armed conflicts that have little impact on macroeconomic growth. Nigeria and Cameroon, for instance, have both been engaged in violent conflict with Boko Haram, a group of militants determined to establish an Islamic state in West Africa. In Nigeria, the death toll has steadily risen since 2011; the Council on Foreign Relations estimates that the conflict had resulted in over 40,000 casualties by mid-2015 (CFR 2015). However, Boko Haram primarily operates in the rural and relatively less populated northeastern regions of Nigeria and Cameroon. During this conflict, both countries have enjoyed steady economic growth. When Nigeria rebased its economy in 2014, it overtook South Africa as the continent’s largest economy.
Mexico has been engaged in a drug war since December 2006, and the number of deaths stemming from this civil conflict has only increased since that time. Yet, even as fatalities due to the drug war reached new peaks in 2012, Vikram Pandit of Citigroup cited Mexico as being extremely well poised for growth and projected that its economy may surpass that of its much larger regional rival, Brazil, within a decade (Vardi 2012). In that same year, Barron’s ran a headline titled, “Is Mexico the New China?” (Kapadia 2012). This contrasts greatly with the economic fortunes of other countries in the midst of civil war where economies have plummeted. Collier et al. (2003), for instance, describe civil war as “development in reverse.” “The overall economic and political legacy from civil war,” they write, “is thus sufficiently adverse that rapid recovery is unlikely” (p. 23).
Explaining variation in macroeconomic outcomes for countries enmeshed in internal conflict requires a better understanding of not only the spatial mechanisms through which conflict can affect growth but also the process of economic growth. Much of the economic development literature in the past few decades has stressed the importance of cities and towns as drivers of economic growth and development (Hanson 2005). Venables (2005) notes that the process of development and urbanization exists in virtually all countries and especially in the case of modern developing countries. Henderson (2000) finds that even a simple correlation across countries between the level of urbanization and gross domestic product (GDP) per capita is greater than .8. The key theme in this literature is that the spatial positioning of production is a central process through which economic prosperity is created (Krugman 1991a).
What happens when cities themselves are threatened? In this article, we bridge the economic development literature on the importance of cities with extant literature on the effect of armed conflict to provide a novel explanation for the paradox of high macroeconomic growth in conflict-ridden countries. Specifically, we argue that to explain variation in economic performance between countries in the midst of civil war, it is necessary to account for the spatial location of the conflict relative to major urban centers. Much of the extant literature has focused on examining the effect of conflict on economic growth at the national level. The implicit assumption of these approaches is that all civil wars are alike, whether they occur right outside the capital or on the fringes of the country. We argue that the location of conflicts relative to major cities and capitals will determine the effect of civil conflict on economic performance and that conflicts only significantly dampen economic performance if they are proximate to urban centers.
The rest of the article proceeds as follows. We begin with a review of the literature on the relationship between economic growth and civil war. In the third section, we explain the mechanisms of our hypothesis through a number of descriptive cases. In the fourth section, we describe how we construct our measures capturing distance of conflicts between major economic and population centers and lay out our estimation approach. Finally, we discuss the findings of our analysis and end with next steps.
Literature on Conflict and Growth
Civil War → Economic Performance
Collier (1999) identifies five avenues through which civil conflict can impede economic performance: through the destruction of resources, through disruption of social and economic activity, through diversion of resources to the war effort, through dissaving, and through portfolio substitution or divestment. Of course, these mechanisms are related to one another; portfolio substitution may be exacerbated by the destruction of resources or the disruption of socioeconomic activity. Overall, finds that civil wars correspond to a 2.2 percent decrease in annual economic growth. While he suspects that the impact will differ across economic sectors, reliable and disaggregated data were not available to test this hypothesis thoroughly. However, preliminary evidence for this is found in their analysis of the National Accounts data of Uganda before, during, and after its civil war.
Instead of disaggregating economic outcomes, Imai and Weinstein (2000) disaggregate conflict itself. They distinguish between those conflicts that cover larger or smaller geographic areas and hypothesize that larger conflicts (in terms of geographical spread) will result in worse economic performance. Using a variety of regression techniques, they find that there is a negative correlation between the geographical spread of conflict and the decade average of economic growth for each country. Widespread conflicts, they argue, are more likely to result in damage to infrastructure, divestment from normal state spending, and capital flight. Their results suggest that widespread civil wars are five times more costly than those fought over a narrower geographic area and can reduce GDP growth by 1.25 percent annually.
That civil wars negatively impact economic performance, while in line with the “war ruin” hypothesis, runs counter to the “war renewal” hypothesis. Some scholars have argued that wars, international wars in particular, can spur economic development (for a review of this discussion, see Rasler and Thompson 1985). The prevailing wisdom with regard to civil war, however, is that outcomes of this nature are the exception rather than the rule. In a test of economic and social determinants of postconflict recovery in the context of civil war, Kang and Meernik (2005) find that these conflicts can lead, under different conditions, to either rapid or stagnant economic recovery. They conclude that the long-term economic impacts of civil war are largely dependent on postwar governance and foreign assistance. They also find that aggregate estimates of conflict destructiveness are negatively correlated with long-term growth.
Not only do several studies link civil war to domestic economic performance, there is also evidence that civil wars have regional economic consequences. Murdoch and Sandler (2002b) find evidence that states neighboring civil war states are more likely to experience poor short-term economic performance. They attribute this effect to the disruption of trade and uncertainty about the potential for conflict to spread across the border. In a follow-up study, Murdoch and Sandler (2002a) suggest that the spatial dispersion of economic effects from civil conflict differ from region to region.
Economic Performance →Civil War
Much work has been done on the causal effects of economic performance on civil war. Indeed, there is likely an endogenous relationship between economic performance and civil war. While our work here sidesteps this argument by focusing exclusively on instances of civil war, we will briefly review the relevant literature. In a report for the World Bank by Collier et al. (2005), the authors describe what they term the conflict trap. States that find themselves in the conflict trap are those that have experienced civil war, are subsequently affected by its economic and social consequences, and are therefore more likely to experience further civil conflict. During civil wars, resources are diverted from productive economic activity to destructive activity. These diverted resources act to stall progress during the conflict and are often used to destroy the infrastructure necessary for growth afterward. These changes to economic performance, as well as structural changes to the economy itself, make the resurgence of war more likely.
In accordance with this theory, Fearon and Laitin (2003) argue that poor economic growth is the primary condition conducive for civil war. More specifically, they believe that strong economic growth proxies for robust governance and that states with low GDP growth likely have infrastructures that are unable to implement counterinsurgent policies. In an effort to parse out the causal effect of economic shocks on civil war, Miguel, Satyanath, and Sergenti (2004) instrument income growth with rainfall. They find that rainfall is strongly correlated with income in sub-Saharan Africa, a region also prone to civil conflict in recent decades. Using a two-stage estimation approach, they conclude that income is correlated with the likelihood of civil war.
Disaggregating Civil Wars
Recently, scholars have begun to spatially disaggregate civil conflicts. New data allow researchers to focus on how the geography of internal conflict varies. Pierskalla and Hollenbach (2013) use subnational data on African states to assess the role cell phone coverage plays in facilitating violent conflict. They theorize that cell phone coverage will enhance the collective action capabilities of rebel groups by improving coordination, communication, and in-group monitoring. A series of empirical tests confirm this hypothesis and indicate that cell phone coverage corresponds to a 50 percent to 300 percent increase in conflict likelihood for a given area (depending on the estimation strategy used).
Berman and Couttenier (2015) explore another substate determinant of civil conflict. Recognizing that economic shocks are associated with changes to the probability of civil conflict (for more, see Miguel, Satyanath, and Sergenti 2004; Vargas and Dube 2013), they seek to determine where conflict will emerge when these shocks occur. Given an external economic shock in a trading partner, Berman and Couttenier expect that states should be at an increased risk of experiencing conflict. However, not all locations within a state will feel the effects equally. Those areas most directly connected to the trading partner will be more likely to experience violent conflict than those areas that are less dependent on the trading partner. They operationalize this measure of dependence, or “remoteness,” as distance from a seaport. Indeed, they find that conflicts are more likely to arise near seaports following an economic shock than they are further away.
Buhaug (2010) argues that the geography of conflict is a function of rebel strength. In particular, strong rebel groups are able to conduct military operations near capital cities while weak ones are not. These weaker groups are only able to survive in areas more distant from capitals. In our analysis, we control for the intensity and duration of conflict to account for this potential confound.
Spatial Distribution of Cities and Violence
The extant literature has made important strides in explaining the relationship between economic growth and civil conflict. Yet, none to our knowledge have explored the effects of subnational overlaps in the spatial distribution of cities and conflicts. We argue that this overlap is key to explaining variation in macroeconomic performance during civil conflict.
Our argument on the proximity of conflict to cities should not be confused with arguments focusing on simply the area covered by a conflict. Our argument explicitly differs in the hypothesized mechanism through which conflict affects economic performance. We do not disagree that the spread of a conflict could impact state economic prospects, but we argue that a large conflict area is not a necessary condition for poor economic performance. Conflict area is only one possible proxy for overall destructiveness. However, conflicts with smaller spatial areas can be similarly disruptive if they are centered near urban centers. In fact, we anticipate measures of conflict proximity relative to cities rather than spread to be more appropriate to test the macroeconomic effects of conflict.
Cities and Economic Growth
That cities are central to national economic performance is well supported in the relevant literature. Myrdal and Sitohang (1957) were among the first to argue that once cities reach a certain size through the process of urbanization, they tend to become self-reinforcing growth centers through a process Myrdal termed as “cumulative causation.” Chenery and Syrquin (1975) provided support for this idea by showing that sharp declines in fertility and substantial increases in growth per capita typically follow cases of urbanization. Jane Jacobs, a progenitor of the move toward focusing on urban centers, went farther than most in her time by arguing that cities are the primary motivators of state economies and should be given primacy over the nation state in economic analysis (1969, 1984).
In the past three decades, as the pace of urbanization has accelerated, economists have devoted even more energy to investigating the role of city-level economic drivers (Lucas 1988; Ciccone and Hall 1996; Begg 1999; Henderson and Wang 2007). Most notably, Krugman (1991b), in his seminal 1991 article “Increasing Returns and Economic Geography,” convincingly showed the importance of studying economic outcomes within a spatial context. A key finding of Krugman’s work on economic geography has been the importance of agglomeration effects, the idea that activities tend to cluster where markets are large and markets become larger where activities cluster (1997). Henderson (2000) provides empirical evidence for why these agglomeration effects would manifest by showing that spatial clustering promotes economic efficiency in a variety of ways from simply enabling savings in transport costs to producing more efficiently functioning labor markets.
In addition to agglomeration effects, there is an even simpler story, which can be traced back to A. Marshall (1920), that states geographic clustering of firms promotes valuable learning and exchange between actors. Lucas (1988) provides a formal treatment of this argument and shows that the accumulation of human capital generates positive spillovers, where if even one worker acquires a new skill then spatially proximate workers would all become more productive. Empirical estimates of agglomeration effects indicate that a doubling of employment density corresponds to a 5 percent increase in labor productivity (Ciccone and Hall 1996; Ciccone 2002). Glaeser et al. (1992) examine this problem empirically and show that cities are important for economic growth precisely because they lead to the knowledge spillovers that are important for innovation. Similar empirical results have been found by many others and have led to a growing consensus that cities can serve as important knowledge hubs for national economies (Jaffe, Trajtenberg, and Henderson 1993; Glaeser 1994; Firestone 2010).
Cities and Conflict
The econometric evidence on the importance of cities has crucial implications for our understanding of the spatial structure of subnational economies. Specifically, at the subnational level, the economy can be thought of as consisting of “lumps” of productivity and swaths of areas that contribute little to macroeconomic growth (Venables 2005). This implies that subnational conflicts will have heterogeneous effects on economic growth, given their spatial proximity to economically relevant centers such as cities.
Glaeser and Shapiro (2002) discuss the historic role of cities in warfare and their current role with respect to terrorism. Cities, they argue, once provided safe haven in the midst of conflict; defense of a concentrated population is easier than defense of a dispersed population. However, as the tactics of warfare have shifted over the centuries, the relationship between violent conflict and cities has become more complex. Dense populations also tempt belligerents and maximize the impact to cost ratio of a given violent action.
Additionally, warfare destroys transportation infrastructure, which can interfere both with commerce and with rebuilding during a conflict. In particular, conflict affects a citizen’s ability and willingness to participate in commerce. When major population centers are threatened by violence, residents will be less likely to engage in economically productive activities. Violence near major population centers not only threatens residents directly but impedes business by threatening trade between the population center and other cities or rural areas.
We extend this line of research by conceptualizing civil war not as a homogeneous national phenomenon but as a diverse class of violent conflict with properties that distinguish the effects of one conflict from another. Since urban economies are responsible for a disproportionate share of national economic performance, civil conflicts in or near these engines of commerce should likewise exert a disproportionate influence on state performance.
Descriptive Cases
This hypothesis does not seem unknown to armed actors. The guerilla group Fuerzas Armadas Revolucionarios de Colombia (FARC) appears to have internalized these mechanisms. In 1998 and 1999, the organization moved its violent operations from mostly rural areas of Colombia into major cities and near to the capital (Petras and Brescia 2000). This coincided with economic strain caused by the implementation of an International Monetary Fund/World Bank structural readjustment program. However, the timing was likely not coincidental.
Forbes magazine, reporting on peace talks between FARC guerillas and the Colombian government in 2012, wrote: FARC’s strategy and [beliefs have] always been to make economic pressure on both multinational companies and the Colombian government. This has been done by attacking oil and natural gas infrastructure affecting companies such as Pacific Rubiales Energy, Oxy and Ecopetrol. For non-fuel related international companies with subsidiaries in Colombia, such as Goodyear, Nestle, Microsoft, Toyota, among others, FARCs modus operandi was mainly racketeering, kidnappings and extortion. (Flannery 2012)
More recently, economic productivity in Syria has ground to a halt due to its ongoing civil war. Fighting in Syria has been widespread with particularly bloody battles of attrition fought over some of the country’s largest cities. Both Aleppo and Damascus have been divided neighborhood-by-neighborhood by the Assad regime and various armed groups vying for control of the cities. Simultaneously, Syria’s economy has shrunk dramatically. While FARC and insurgent groups in Syria seem to exploit their ability to target areas of economic importance including cities, other insurgencies tend to be more peripheral. India, for instance, has faced challenges by armed groups in its northeast for half a century. However, this area of India is remote, primarily agrarian, and relatively less populous than other parts of India. Indeed, for much of this period, India has experienced relatively robust economic growth. 1
Nigeria and Cameroon have battled Boko Haram in a bloody conflict in their rural northern regions for half a decade. For the period between 2009 and 2013, the National Consortium for the Study of Terrorism and Responses to Terrorism described Boko Haram as “among the deadliest [terrorist groups] in the world” (Pate et al. 2014). The group’s tactics range from car and suicide bombings to direct assaults to mass kidnappings. Nonetheless, Nigeria and Cameroon have both maintained strong economic growth during this period. The African Development Bank Group (AFDB) described Nigeria’s economic growth from 2004 to 2014 as “robust” and projected “moderate” growth of 5 percent for 2015 (AFDB 2015b). On Cameroon, the AFDB said, “despite the security and humanitarian crisis in the region, Cameroonian growth remains strong at above 5%” (AFDB 2015a, http://www.africaneconomicoutlook.org/en/country-notes/central-africa/cameroon/).
It is important to note that Mexico does not appear in the civil war data set chosen for this study. The Uppsala Conflict Data Program definition of civil war requires that the conflict be fought over an “incompatibility that concerns government and/or territory,” a criteria not strictly met by the organized crime violence experienced by the country (Themnér 2014, 1). Nonetheless, we want to reiterate that this instance of armed conflict, of the magnitude typically associated with civil war, conforms to the expectations of our theory. Mexico, now nearly a decade into a violent and complicated conflict between several organized criminal enterprises and the federal government, has maintained healthy economic performance. For much of this time, the cartel violence generally occurred in rural areas along drug trafficking routes and not within major cities. Beittel (2011) writes that “drug trafficking-related killings remain concentrated in a relatively few cities” (p. 15). Meanwhile, several major cities including the capital, Mexico City, have experienced relatively low levels of cartel violence.
The examples cited here seemingly break from the mold by prospering economically while facing high levels of internal violence. A common characteristic of these cases is the geographic distribution of conflict; violent armed groups operate primarily in rural areas away from major cities.
Data and Sample
Measuring Spatial Proximity
Our theoretical framework centers on the argument that variation in macroeconomic growth among countries in the midst of civil war can be explained by the spatial proximity between civil conflicts and urban centers. In constructing our data set, we thus restrict the cases we include to only those country-years in which there was an internal armed conflict. Additionally, the unit of observation for this analysis is the conflict-country-year. This enables us to directly explore whether variation in growth among countries experiencing internal conflict can be explained by the proximity of conflict to cities.
To measure macroeconomic performance, we focus on annual percentage change in GDP from the World Development Indicators. We adopt this parameterization of our dependent variable because we expect that conflicts proximate to urban centers will generate abrupt changes in macroeconomic growth. Much of the extant literature linking internal armed conflict and economic growth has approached this instead of using five- or ten-year averages of GDP growth. However, averaging over an arbitrary set of years may obfuscate meaningful variation in GDP growth over short temporal spans.
We collect information on the location of conflicts from the Peace Research Institute Oslo (PRIO) Conflict Site Dataset (Hallberg 2012). This data set contains information on the geographical centers of armed conflict events and the area covered by each conflict at a yearly level from 1989 to 2008. In recent years, other geo-referenced data sets have been developed that go beyond just providing information on conflict centroids and area to providing an actual spatial grid structure representing high-resolution spatial distributions of conflict (Tollefsen, Strand, and Buhaug 2012). However, these data are not available globally and would therefore unnecessarily limit the external validity of the current analysis. 2 Other machine-coded event data sets, while providing detailed coverage of events on a global scale, often approximate event locations based on descriptors in the source material or by the location of the reporting news agency itself. Because the location of conflict is critical for this analysis, the urban bias of disaggregated event data is unacceptable.
To construct a time-series cross-sectional database of urban centers, we turn to yearly editions of The World Alamanac. More refined subnational data listing urban centers by their contribution to economic output would be the most direct way to test our hypothesis; however, cross-national data such as this over the time period of our analysis, especially for developing countries, are simply not available. The World Alamanac lists the major cities in a country by population, thus providing us with a second best approximation of the urban centers that are most relevant for a particular national economy. Typically, the Almanacs list at least three major cities, including the capital, for each country and year from 1989 to 2008. Because the Almanacs are not perfectly consistent from year to year, we opted to code cities with a five-year rolling window. That is, cities listed in the 1995 Almanac are also included in our data set for years 1993 to 1997. In doing so, we hope to minimize the effect of coding inconsistencies on the part of The World Almanac. Also, as a more conservative test of our hypothesis, we replicate our models using the distance of conflict from each capital city rather than our preferred measure of minimum distance to a major urban center. While our hypothesis is most accurately represented by distance from any major urban centers, distance from capital cities provides an appealing and consistent alternative measure. Every country has a capital city in our sample, so using this alternative measure does not rely on differing population or density thresholds across countries that must be used in coding major cities.
In Figure 1, we show the geographic distribution of conflicts and cities. The centroid locations of conflicts are shown by red dots. Not surprisingly, in many cases, conflict locations are clustered within specific parts of a country. In most cases, this clustering is indicative of the same conflict moving within the geographic boundaries of a country over time. The blue diamonds in Figure 1 denote the locations of major cities from 1989 to 2008. Countries shaded in gray are those for which no armed conflict took place in this period according to the PRIO data set.
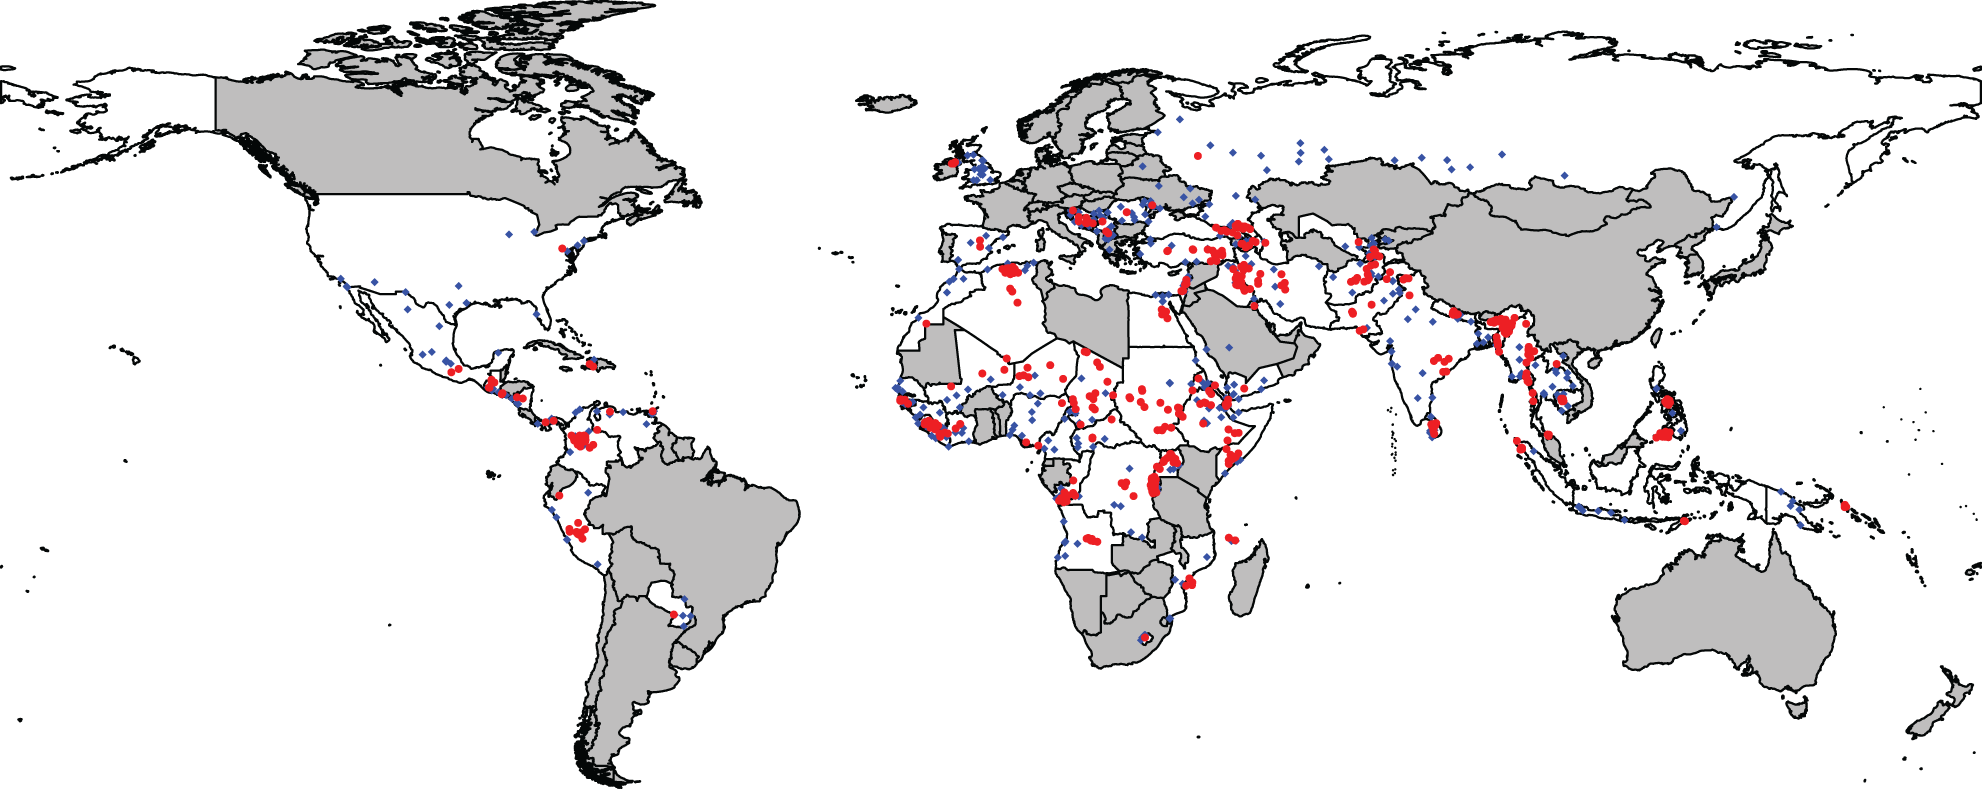
This map illustrates the geographic distribution of all internal armed conflicts and major cities from 1989 to 2008. Countries for which no armed conflicts are recorded are shaded in gray.
Using our geo-referenced conflict and urban center data, we proceed to compute the proximity of every domestic armed conflict in a country-year to every urban center listed in that year. 3 Since our unit of analysis is the country-year, we aggregate the distance between conflicts and major cities by calculating the minimum logged distance any conflict is from a major city. For example, if a country faces four conflicts in a year, the datapoint for that country-year would be the minimum distance any conflict centroid is from any city centroid. In addition to identifying the minimum distance a conflict is from any city, we create a variable that measures minimum distance of any conflict from the capital of the country. Given the importance of cities as drivers of macroeconomic growth, the proximity of conflict to even one city should have at least a noticeable short-term impact on growth. Thus, this choice of aggregation conforms closest to our theoretical claims about how macroeconomic growth can be severely disrupted in cases where conflicts are proximate to major cities. 4
Figure 2 provides a cursory illustration of the relationship between GDP growth and our spatial proximity variables. Each bar on the left-most panel represents the average GDP growth rate across country-years for which the minimum distance between the centroid of the conflict and capital city fell within a certain quartile range across our full sample. Clearly, as the minimum distance from a conflict to capital city declines, there is a sharp decline in average growth rates for the following year. On the right-most panel of this figure, the same relationship holds when we test the effect of the minimum distance of conflict from any major urban center.

Average percentage change in gross domestic product growth at time t by distance from conflict to capital city on right-most panel at time t − 1 and from conflict to any city on the left most. The error bars represent the 95 percent confidence interval around the mean.
Empirical Model
Next, we move beyond this cursory illustration and explicate our full modeling strategy. Given how we constructed our spatial proximity of conflict variables, it would make little sense to include both capital distance and city distance within one model. The obvious problem we would run into is that there would be cases for which the minimum distance of a conflict to any city would be the same as the minimum distance to the capital. Thus, we estimate two separate models, one where we include the minimum distance from a conflict to the capital and the other where we include the minimum distance to any urban center. In addition to the inclusion of our spatial proximity covariates, we include a number of control measures to account for extant explanations of how civil war dynamics affect GDP growth and to mitigate omitted variable bias.
From the PRIO Armed Conflict data set, we bring in additional information about the conflict intensity, duration, the area covered by the conflict, and the number of conflicts (Themnér and Wallensteen 2014). Conflict intensity is a binary that distinguishes between minor armed conflicts (between 25 and 999 annual battle deaths) and wars (at least 1,000 annual battle deaths), and we set this equal to 1 if any of the conflicts in a country-year were classified as a war and 0 if not. 5 In aggregating conflict duration to the country-year level, we bring in the duration (measured in years) of the longest lasting conflict by a certain country-year. Conflict area measures the conflict zone in square kilometers. To include this in our conflict–country–year model, we sum up the area covered by each conflict being fought and divide by the total land area of the country. Finally, the number of conflicts is simply a count of the number of ongoing internal armed conflicts in a country-year according to the PRIO data set.
Aggregating each of the PRIO conflict descriptive measures in this way is to help account for those countries in which conflicts are especially intense, cover large areas, have been long-lasting, or are one of many ongoing conflicts. Given the findings in the extant literature, our expectation is that each of these measures should have a negative effect on economic growth. Although we also expect that the substantive implications of any one of these measures will matter less than the adverse effect to economic growth accounted for by the spatial proximity of conflict to urban centers.
We also include a number of variables that help capture structural and institutional aspects of the country itself. First, we include binary indicators for whether the country is classified as upper income by the World Bank and for the level of inflation in the country. Second, we control for the level of democracy in the country using the polity index (M. G. Marshall, Gurr, and Jaggers 2014). We also control for the proportion of a country’s GDP that is made up of natural resource rents. This is a particularly important variable to control for, as countries that draw a large share of their GDP from natural resource rents likely rely less on urban centers to serve as drivers of growth. Finally, given that the time frame of our sample overlaps with the occurrence of two major global economic crises, the 1997 Asian financial crisis and the 2008 financial crisis, we add a control for the average GDP growth across all countries in the world.
To estimate variation in growth rates, we use a random effects model clustered on countries. To ensure that it is statistically justifiable to make this choice, we run a Hausman specification test (Greene 2008). 6 For both the minimum conflict distance to any and to capital city specifications, we fail to reject the null hypothesis at both the 90 percent and 95 percent confidence intervals, which provides at least some initial evidence that we are justified in our choice. However, as Clark and Linzer (2015) note, the Hausman test should not be the sole determinant for choosing between fixed or random effects. We utilize their more nuanced typology for further arbitrating between fixed and random effects, and again we find that random effects are preferred in this case. 7
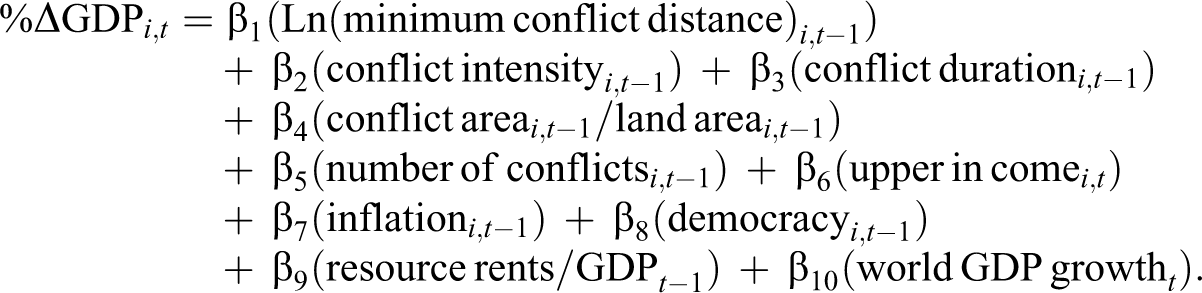
For this analysis, we have 505 country-year cases of civil war from sixty-eight different countries during the period between 1989 and 2008. The model formula (omitting error terms) is shown below, where Ln(minimum conflict distance) i ,t−1 is a placeholder for Ln(minimum capital distance) i ,t−1 and Ln(minimum city distance) i ,t−1:
Baseline Effect of Civil Conflict on Growth
Before we move to discussing the results of the model specification that we have described above, we estimate a simple baseline model to assess the effect of any civil conflict on growth. For this model, we use a specification as similar as possible to the one we explicated in the previous section, with the key difference being that this baseline model is estimated using a full country-year panel with fixed effects. 8 The dependent variable is again the annual percentage change in GDP from the World Development Indicators, and the key independent variable here is whether or not the country was engaged in a civil war in the previous year according to the PRIO Armed Conflict data set. Since we are using a full country-year panel, we have to omit the PRIO conflict-specific variables (e.g., conflict intensity and conflict duration), as they are undefined for country-year observations in which no conflict was taking place. The rest of the independent variables are similar to the model specified in the previous section. Specifically, we include whether or not the country is classified as upper income, the lagged version of inflation, the lagged version of polity, the lagged version of resource rents as a proportion of GDP, and the average GDP growth across all countries in the world. 9
We will eschew discussing the controls since the primary purpose of this analysis is to determine a baseline effect for civil war. Additionally, for the sake of space, we do not show the full results from this regression, but they are available in the first section of the Appendix. The key result pertains to the civil war variable for which we estimate a regression coefficient of approximately −2.568 with a standard error of 0.502. 10
To assess the substantive significance of this variable, we turn to a simulation-based analysis. We simulate two scenarios, one in which a civil war occurred and another in which there is no civil war. All of the other parameters are set to their median value. Next, we conduct 1,000 random draws from a multivariate normal distribution to obtain a distribution of point estimates for each regression coefficient. Last, we simply matrix multiply the draws from the multivariate normal with the transposed scenario matrix to obtain expected values of GDP growth given for the two scenarios. The resulting distributions are shown in Figure 3.
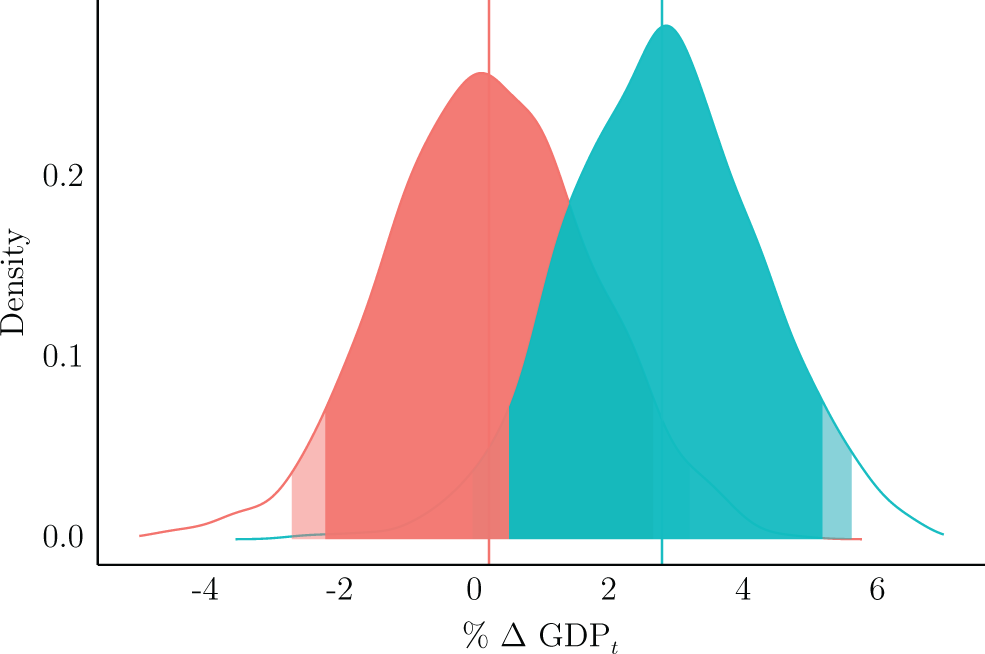
Distributions of expected values for gross domestic product growth based on whether or not a country experienced a civil war in the previous year. The distribution in red designates the scenarios for which a civil war occurred and in blue if a civil war did not occur. The 90 percent interval of each distribution is shaded in a dark blue or red color and the 95 percent in a lighter color.
The analysis here highlights that, while there is a noticeable substantive difference in the expected GDP growth of civil war and noncivil war countries, there is also a large amount of inferential uncertainty in these estimates. We argue that this is because the effect of civil conflict on economic growth becomes particularly relevant when that conflict is proximate to economic points of interest such as capital cities and major urban centers. In other words, the heterogeneity of civil war leads to a diversity of economic outcomes for affected states.
Results
We depict the results of our conflict distance models in Figure 4a and b. 11 The results across the two models are broadly consistent, so we will discuss them in tandem. Surprisingly, conflict duration and the number of conflicts a country is facing do not relate to GDP growth in the direction that we expected. 12 The intensity of a conflict aligns in the direction that we would expect though its effect is marginal. Additionally, the effect of having a high proportion of a country’s land area immersed in conflict is sharply negative and aligns with the findings in the extant literature. As expected, inflation has a sharp negative effect on GDP growth. Countries deriving greater shares of their GDP from natural resource rents see slightly higher levels of growth, and, not surprisingly, the average of world GDP growth is positively related to our dependent variable.

(a) Regression results using conflict distance from capital city and (b) shows regression results using minimum conflict distance from any major city. Darker colors indicate that the coefficient estimate is significantly different from 0 at a 95 percent confidence interval (CI), while lighter color indicates the same for a 90 percent CI. Gray color indicates that the estimate is not significantly different from 0 at either of those intervals.
Turning to our hypothesis, we find strong support for the argument that spatial proximity of conflict to either a capital city or any major urban center is associated with lower levels of GDP growth. The positive coefficient on the logged minimum conflict distance variables indicates that conflicts closer to major cities have an adverse effect on economic growth.
To assess the substantive effect of these results, we conduct a number of simulations. We set up scenarios where we hold all variables to their medians except for logged minimum conflict distance, which we range from its minimum to maximum value. Next, we conduct 1,000 random draws from a multivariate normal to obtain distributions for the point estimates of each of the regression coefficients. After obtaining these distributions, we calculate the predicted value of GDP growth based on the conditions set by the scenarios. We plot the results of this analysis in Figure 5a and b.
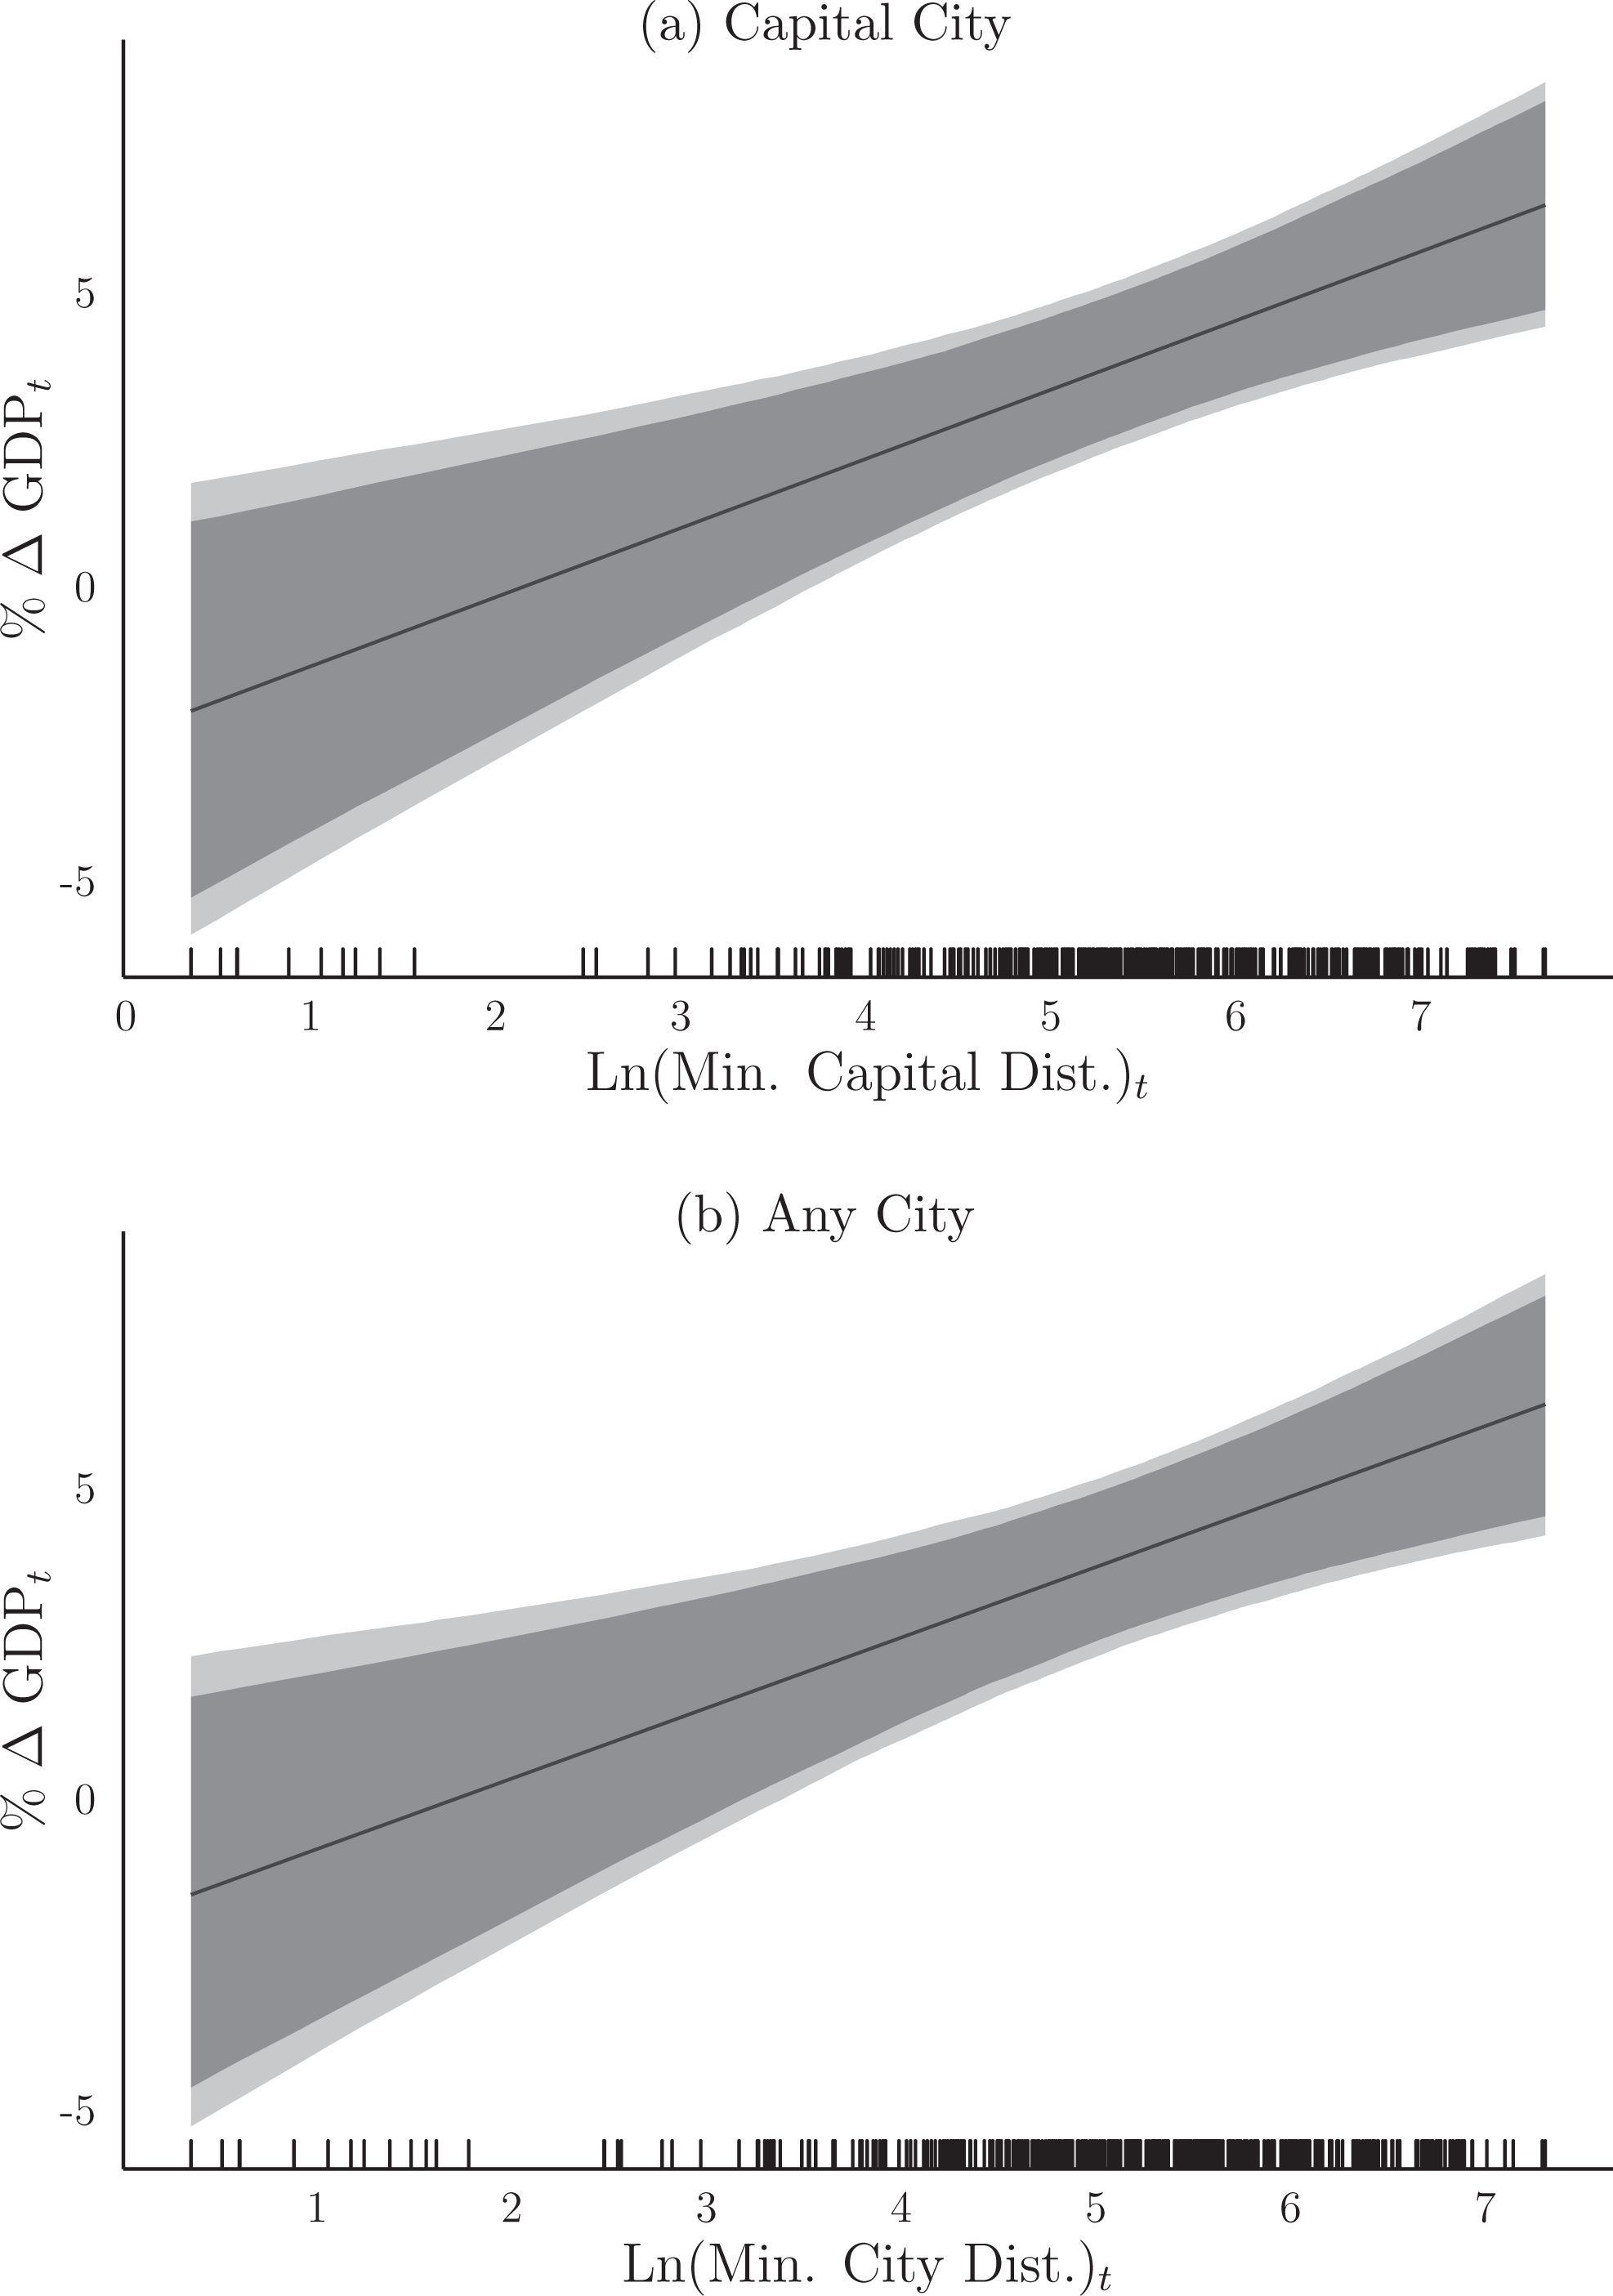
Expected values for gross domestic product growth based on scenarios where all variables are held to their constants but Ln(Min. Conflict Dist.) varies from its minimum to maximum. The 90 percent interval of each distribution is shaded in dark gray and the 95 percent in a lighter gray color.
The simulation results for both Ln(minimum capital distance) i ,t−1 and Ln(minimum city distance) i ,t−1 are quite similar. In both cases, conflicts located farther away from major cities have almost no adverse impact on economic growth, and, in fact, are likely to still see positive growth. As the proximity of conflicts to urban centers increases, however, we can clearly see substantive declines in growth rates. Thus, through utilizing these spatial proximity measures, we can begin to explain why there is such meaningful variation in economic performance among countries facing internal armed conflict.
Conclusion
This piece of research has sought to explain observed discrepancies in the economic impact of civil conflict. Violent intrastate conflicts have occurred in one-third of countries in just the past several decades. While civil wars seem to primarily afflict developing states, their actual economic impacts are still subject to debate. Some states weather civil conflict for years or even decades while simultaneously prospering economically. Other states see their economies stall and suffer substantial declines in growth. Despite this heterogeneity observed among civil war states, the individual characteristics of civil conflict that lead to disparate outcomes have only recently been subject to academic scrutiny. In this first step of a larger project to distinguish the geography of civil conflict, we have contributed to our understanding of why some civil conflicts impact economic performance more severely than others. To do this, we have used a novel approach in the study of civil conflict to distinguish between spatially dissimilar events and shown that this new measure of interest, the minimum distance between conflict epicenters and major population centers, is a substantive determinant of economic growth. While the proximity of conflict to major cities helps us to better understand how domestic armed conflict produces disparate economic outcomes across countries, one can imagine a number of other hypotheses that derive from this research.
Population centers are critical to economic performance but still tell only a part of the story. States rely on various natural resources as well as critical infrastructure to prosper. Trade depends on safe and reliable access to ports, airports, and railways. Businesses rely on safe and reliable access to natural resources. Foreign direct investment relies on the investor’s perception of state stability. While there is a large literature on natural resources and conflict at the state level, little work has disaggregated these data and explored the microrelationship between conflict and resources. Future work in this line of inquiry will explore each of these hypotheses using geospatial data on the economic assets of interest. One additional question that springs from our work here is whether only certain rebel groups are able to initiate conflicts near urban centers. Specifically, it could be the case that only the strongest, richest rebel groups are able to survive and initiate conflicts proximate to the capital or other major cities. In future research, it would certainly be interesting and valuable to determine whether there are certain rebel group characteristics that relate to the geolocation of conflicts relative to points of economic interest.
Looking beyond aggregate measures of state economic performance, we hope to further explore how the geography of conflict impacts the surrounding region. A growing body of work suggests that civil conflict is, in and of itself, contagious. However, the precise mechanisms that determine contagion risk are still unclear. We propose that looking at the location of conflict within a state will shed light on how conflicts and their economic effects spread across borders. The same logic that applies to the hypotheses presented in this article applies to neighboring states as well. Resources and population centers that are near the border between a peaceful state and a civil war state may be impacted in the same way that resources and cities within the conflict state are. This may help to explain the disparate regional economic effects of civil war observed by Murdoch and Sandler (2002a).
Footnotes
Appendix

Declaration of Conflicting Interests
The authors declared no potential conflicts of interest with respect to the research, authorship, and/or publication of this article.
Funding
The authors received no financial support for the research, authorship, and/or publication of this article.
Supplementary Material
Supplementary material for this article is available online.
Notes
References
Supplementary Material
Please find the following supplemental material available below.
For Open Access articles published under a Creative Commons License, all supplemental material carries the same license as the article it is associated with.
For non-Open Access articles published, all supplemental material carries a non-exclusive license, and permission requests for re-use of supplemental material or any part of supplemental material shall be sent directly to the copyright owner as specified in the copyright notice associated with the article.
