
Abstract
We address two questions on the effects of climate change for social instability. First, do droughts and their associated environmental impacts affect support for the use of violence? Second, do local-level formal and informal institutions moderate support for violence when and where droughts worsen? To answer these questions, we conducted a national survey of 1,400 Kenyans in 2014. Respondents were asked about patterns of rainfall and the presence of rules regulating natural resource use and access. Survey data are joined to spatially disaggregated observed rainfall trends. The survey uses endorsement experiments to elicit honest responses about support for using violence. There is some evidence of a direct, though limited, link between observed drought and violent attitudes. Certain local-level natural resource use rules have moderating effects on support for violence where drought is reported and precipitation is less frequent. This conditional and contextual effect is an important modification of overly simplistic narratives of universal climate change effects.
Much of the research investigating climate change impacts on violent conflict has been carried out using coarse geographical resolutions, such as countries or large regions, long temporal periods (often yearlong), and crude weather variability and conflict measures. Burke et al. (2009), for example, use the occurrence of civil war (yes/no) in a year for every African country as their outcome variable for violence and average temperature changes across entire countries as their key predictor that captures climate change. In countries as large as Sudan or Democratic Republic of Congo, the assumption that either of these measurements captures the localized nuances of environmental variability and conflict dynamics is deeply problematic (for similar country-level analyses, see Hsiang, Meng, and Cane 2011; Smith 2014; Landis 2014; Saleyhan and Hendrix 2014; van Weezel 2016; Schleussner et al. 2016).
Lively debate continues about the modeling of climate–violent conflict relationships and the assumptions underlying authors’ data and methods (O’Loughlin, Linke, and Witmer 2014a; Hsiang and Meng 2014; Raleigh, Linke, and O’Loughlin 2014; Livingstone 2015; Buhaug et al. 2014). Most importantly, the limitations of many studies on this topic are conceptual and not just technical in character. Hsiang, Burke, and Miguel (2013) combine interpersonal violence, civil war, and civilizational collapse on dramatically different time scales into a single measure of “human conflict” in their meta-analysis of dozens of research articles, but the work is not designed to explain why observed associations are found. Ideally, such a causative explanation is the gold standard of social science research and increasingly those who study the impacts of climate change are accordingly directing their efforts (Buhaug 2015). Building new and better data sets using novel research designs and methodological techniques that focus on the possible explanatory linkages is the most productive path forward in the study of climate–conflict effects. By following such an analytical framework, our Kenyan study makes a substantial contribution to the existing literature on this important topic.
Scholarly efforts to substantially incorporate explanatory mechanisms for relationships between environmental change and violent conflict are increasingly common; we review key examples of this research below. The conceptual framework for many of these studies is closely in line with the methodological and epistemological preferences of human geographers and anthropologists, where the nuances of local-level power dynamics and social structures are considered to be central to thorough understandings of the social processes underlying violence (McCabe 2004; Bollig 1993; Turner 2004). Our article is structured as follows. We outline pertinent research in the following section. Sections three through seven describe our theory and specific propositions, data, methods, results, and conclusions, respectively.
Existing Literature on Climate Change and Conflict
Contemporary studies of environmental change and conflict strive for detailed understandings of multiple forms of violence as well as the spatial and temporal scales at which any associations emerge. Some effects of an environmental crisis are manifested immediately, while others may not be felt for a year or more. Similarly, not all violence is identical; cattle-raiding violence in pastoral communities varies fundamentally in aims and scope from the attacks of rebel organizations against government forces that are designed to take over a country’s capital and government. The temporal variation in types of fighting, motivating influences for actors, and expected outcomes vary based on the cause of grievances and motivations. Therefore, distinctions among forms of violence can reveal important information about underlying drivers. Raleigh and Kniveton (2012) present evidence that rainier periods are more likely to experience intercommunal violence and that drought might relate more closely to rebel group attacks. In a similar fashion, O’Loughlin, Linke, and Witmer (2014b) separate a continent-wide sub-Saharan Africa analysis of drought, temperature, and violence by types of conflict incidents; violence against civilians, battles between two armed groups, and riots are not similarly influenced by climate variability. Maystadt, Calderone, and You (2015) find that high-temperature extremes are associated with local conflict in North and South Sudan but indicate that a single type of conflict—competition over water—dominates the general relationships.
Parsing temporal and spatial units moves research beyond contemporaneous overlap of climate-related disasters and conflict at large scales. Using a fine geographical scale of analysis, von Uexkull et al. (2016) find that a local drought increases the likelihood of violence specifically for agriculturally dependent and politically excluded groups in very poor countries of Asia and sub-Saharan Africa. De Juan (2015) blends attention to spatial and temporal resolutions in his study of Sudan’s civil war and where migration in response to ecological change is a key element of a causal chain that raises the risk of violence; resource scarcity and interethnic tensions in migrants’ arrival areas have the strongest effects on the likelihood of conflict. Similar spatial disaggregation is found in Ide et al. (2014), who use a 0.5° grid cell resolution to study climate change vulnerability and conflict in Uganda and Kenya (see also recent work by O’Loughlin et al. 2012; Fjelde and von Uexkull 2012; Yeeles 2015; Detges 2014).
Our intention in this study is to understand which conditional social contexts may shape attitudes toward violence under drought conditions. In this effort to identify moderating mechanisms in violent conflict analysis, we are not alone. Wischnath and Buhaug (2014) find that harvest loss in India raises the level of year-on-year political violence. In India, Fetzer (2014) finds that insurance providing farmers with employment opportunities during periods of drought mediates and reduces the risk of social strife. Food prices are similarly identified as a possible explanatory mechanism linking environmental change and conflict by Smith (2014) and van Weezel (2016). Investigating civil war in Somalia, Maystadt and Ecker (2014) show that livestock markets are the primary channel for a relationship between droughts and violent conflict. At the onset of drought, herders sell off livestock (usually the weakest first) to avoid incurring costs of a severe slow onset disaster that kills a high proportion of the herd. This practice floods the market and results in reduced incomes from livestock, thus dramatically affecting purchasing power (Food Security and Nutrition Analysis Unit [FSNAU], 2011). These lower incomes raise the risk of violence because individuals seek an alternative, which may be participating in violence for profit. By distinguishing between demand- and supply-side theoretical explanations for why water shortages lead to violent conflict, Böhmelt et al. (2014) also undermine the thrust of simplistic scarcity narratives of violence onset. While it is not modeled as a mediating variable in panel time-series analysis, Ide et al. (2014) consider climate change vulnerability to be a set of multiple social conditions that amplify the chances of conflict during times of environmental stress. Vulnerable conditions build on one another so that low education rates, poor health, high population density, and existing soil degradation characterize the level of instability. Communities exposed to rainfall shortages and extreme temperatures are more likely to experience violence when the index defining vulnerability is high than when vulnerability is low. Conflict forecasting research using country-level (Hegre et al. 2016) and subnational data for sub-Saharan Africa (Witmer et al. 2017) has illustrated how policies aimed at improving political rights and good governance can reduce projected conflict risks.
Other nonmonetary social forces have been shown to condition the effects of environmental change in sub-Saharan Africa. Fieldwork in Ethiopia by Kassahun, Snyman, and Smit (2008) shows that failing traditional coping mechanisms for drought management have had harmful effects on physical security. Where cultural institutions in the Somali region of eastern Ethiopia previously managed inter- and intragroup relations during periods of scarcity, these forums for risk mitigation are disappearing and survey respondents reported greater levels of conflict as a result of this unfortunate development. This finding is closely in line with that of Bogale and Korf (2008), who also found that traditional practices of sharing among households (e.g., access to pasture or water) contributed substantially to peace during times of drought. Interethnic community dialogue in Uasin Gishu, Nakuru, and Vihiga counties of Kenya has also been found to condition any link between changes in drought recurrence and support for the use of violence (Linke et al. 2015). The particular format or design of other social forums and practices may vary by region or country but all of them are part of the broadly defined cooperative coping mechanisms whose scope and effects are important to understand.
Our research design is guided by fundamental tenets of the disciplines of human geography, political ecology, political science, and anthropology. We bridge the divisions between these disciplines in several ways that result in a more contextualized understanding of Kenyan conflicts. By honing in on the specifics of an individual case (Kenya), our work represents a departure from cross-national studies on the topic cited above. Despite the limitations associated with focusing on a single country, there are several reasons that Kenya represents an ideal case for generalization to other regions of sub-Saharan Africa. First, Kenya has an ethnically diverse population, which facilitates comparison to African countries that are also demographically heterogeneous. Second, from the arid north to the rainy west and to the tropical coast, Kenya has a diverse set of climatic and environmental conditions. Third, Kenya is not a site of a total breakdown of social institutions or outright civil war, as is the case in Somalia and South Sudan. Generalizing conclusions from research carried out in such settings to other regions of Africa is difficult. Fourth, Kenya has democratic though flawed institutions and is fundamentally an open regime rather than a total autocracy, as is the case in countries such as Zimbabwe. In this sense, it is similar to many partly democratic African countries.
Theory and Specific Propositions
We examine the influences of official (governmental) and also unofficial (traditional or customary) rules dealing with the use and governance of natural resources. Both are likely to be influential, but they matter to different degrees across Kenya’s varied regions. Formal institutional management or regulation of natural resources has a moderating influence on the potential relationship between water availability and conflict between countries (Dinar et al. 2015; Tir and Stinnett 2011; Tir and Ackerman 2009). Within countries, there is also evidence that such a relationship holds. Lecoutere, D’Exelle, and Van Campenhout (2010) use a Tanzanian lab-in-the-field experimental game and find inclusive and representative institutions do not result in conflict when resources are scarce; exclusionary institutions do have this effect. Natural resource use regulations are, of course, not only governmental and official. In rural areas of many sub-Saharan African countries, the formal rule of law is weak relative to the customary practices that guide inter- and intracommunity politics. In Ethiopia, pasture sharing contributes to peace during times of scarcity, but sharing is not solely an extension of formal written law (Bogale and Korf 2008). In Kenya, nearly all ethnic communities have a tradition of negotiating access to resources with nearby groups (even if the agreements sometimes fail; see McCabe 1990). For example, in the boundaries between Borana and Somali communities in the north, the traditional Dedha structure for negotiating pasture access contributed to peace when the 2015 long rains ended early. “Embedded in Dedha are rules related to use and access of pastures, water and other resources and that elders are always on standby to arbitrate in case of simmering conflict” (Mbaria 2015). As an example of the kind of social forces that we test in our study, Daudi Tari, who directs the Resource Advocacy Program, explained Dedha in clear terms: “although each of the 25 wells have ‘owners’ who organize other community members to dig them, no pastoralist is ever denied access” (quoted in Mbaria 2015). Adherence to these informal institutions of dialogue does not exist because of governmental enforcement of official law and must be considered as distinct and critical nonofficial rules in Kenyan society.
The elements of our conceptual framework are presented and connected in Figure 1. The scarcity of water represents a condition that individuals and communities must manage. The responses for managing any changes in a baseline condition may be determined by the characteristics of any individual (e.g., age, wealth, community membership, or social status) but are additionally shaped by the social setting. Following political geography research that focuses on the politics of place (Agnew 1987), we understand that interactions between individuals develop within sets of cultural norms, institutional traditions, and economic realities. Given some change in baseline environmental conditions, the possibilities that exist for managing scarcity occur within and through the formal and informal social structures present in any area. Some of those social structures may be conducive to peace, but others may constrain the options for nonviolent resolution of disputes. A cultural tradition of sharing pasture and access to water, as is the case in areas where the Kenyan Dedha system dominates, is one example; rather than treating water and pasture access as a zero-sum game, cooperation among communities faced with scarcity is also a realistic expectation.
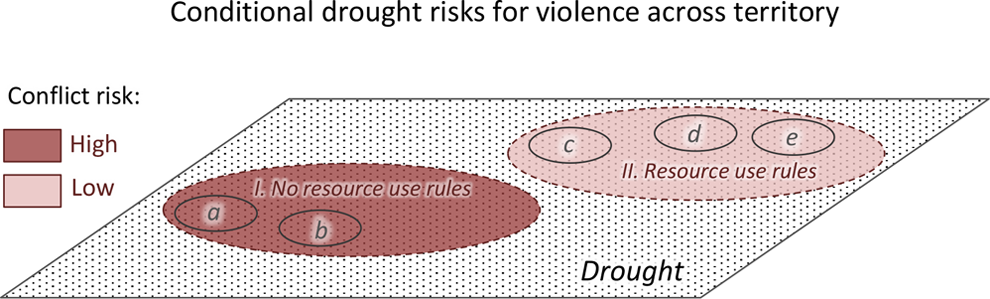
Conceptual framework for the propositions tested in this analysis. Locations a, b, c, d, and e experience drought commonly. Social contexts I and II condition the likelihood of observing conflict given the underlying stress.
An individual-level analysis is more than a methodological or technical shift in the study of violent conflict. First, in conflict research, a turn toward the individual scale of analysis is fundamentally about the scale where social processes develop. We study not only context-level influences upon violence but also the role of individual attitudes within a variety of these social settings. Much of the research in this area relies on large representative population surveys, including articles covering sub-Saharan Africa (Linke, Schutte, and Buhaug 2015), Pakistan and Afghanistan (Blair et al. 2013; Blair, Imai, and Lyall 2014), and other regions. The social–psychological mechanisms leading toward violence are often missing in traditional quantitative conflict research; events data are typically used in aggregate, including country-level analysis cited above. In contrast, for those individuals navigating social and economic stresses associated with natural resources scarcity, any conflict outcome is most likely where the barriers to a person’s participation in violence are the lowest. We measure these sentiments related to participation in our survey instrument. If a person envisions an alternative scenario for his or her livelihood with an abundance of water or healthy pasture, frustration might translate into conflict or violence where a person has at least some latent support for violence. Although each person who supports violence may not act upon his or her beliefs, it is very likely that a person who participates in violence already supports such behavior.
Norms for governing collective access to natural resources by nonstate actors as well as official governance were underlined by Ostrom (1990), and it is precisely the effect of these social settings that we strive to measure using original surveys. Agreements for sharing or procedures for proportional use of land or water would be qualities of place and context. Cooperation represents an intervening dynamic in potentially violent contentious politics. Political institutions allow cooperation for environmental regulation during hydrological disputes in the water management and environmental science community (Wolf 2007). Ngaruiya and Scheffran (2016) outline the way in which conflict resolution networks across localities in Kenya facilitate negotiation, cooperation, dialogue, and in some cases, peaceful resolution to contentious politics that arise during conflicts over scarce resources at subnational scales. While dispute resolution is the focus of their work, institutional forums are “aided by the presence of holistic resource management policies” (p. 441). Dell, Jones, and Olken (2014) also specifically refer to political institutions and legislation as possible sources of adaptation, and we expect that these will allow for communities to avoid conflict when scarcity occurs.
Based on the literature, we expect that any link between drought and support for the use of violence should be moderated according to the relationship shown in Figure 1. The setting with regulatory mechanisms, following this framework, should inhibit the risk of violence associated with water shortages and scarcity compared to the context where no accepted rules exist. Consider that villages a and b in Figure 1 would be more likely to experience violent conflict under circumstances of drought becoming worse than towns c, d, or e, where rules for sharing and resource management exist. Even where communities are geographically mobile, as in a pastoralist setting, the broader social influences of regional context may conceivably define violent conflict risk within some limited range of mobility.
Guided by Figure 1, we test four specific propositions. We expect that the following social conditions (e.g., context I with rules and norms versus context II with none) will have moderating effects on support for the use of violence when drought becomes worse: First, the presence of local official government rules regulating natural resources; Second, the presence of informal nongovernmental traditional rules regulating natural resources; Third, a greater number of local official government rules regulating natural resources than there were in the past; Fourth, a greater number of informal nongovernmental traditional rules regulating natural resources than there were in the past.
To test these expectations in regression analyses using our survey data, we use interaction terms combining two dichotomous variables measuring the characteristics of rules (where they exist and where they do not, as explained below) and the presence of drought conditions (present or absent). Support for the use of violence by a survey respondent is the main outcome of interest. By reporting the estimates of these interaction terms—one for each of the four propositions separately—we capture the influences of different social circumstances that translate into support for violence, given the effects of drought for society. Details of the methodology are described below.
Some scholars are concerned about spurious results for conflict outcomes due to endogeneity. The regulation of natural resource use, for example, may be more likely to emerge in peaceful areas that allow for collective dialogue and initiatives designed for the nonviolent settlement of disputes. In contrast to the possibility that peace leads to institutional strength, conflict may also increase certain forms of social capital (e.g., Bellows and Miguel 2009; Voors et al. 2012). Voors and Bulte (2014) illustrate how violence can influence institutions in Burundi—either by facilitating their development or inhibiting it—depending on the specific form of institution. In order to derive unbiased estimates of drought effects for violence and the conditional role of regulations, we control for the number of violent events near each survey enumeration area (EA). A comprehensive analysis of the impact that conflict has on institutions is beyond the scope of this article.
Our individual scale analysis has an obvious corollary. When there is increased support for participating in violence within a society, do those individuals who support violence then carry out violent acts? In other words, does support for conflict lead to actual violence? We join spatially disaggregated violent event data from the Armed Conflict and Location Event Data (ACLED) project (Raleigh et al. 2010) to our survey EAs for a pre- (see endogeneity concerns above) and also, separately, postenumeration violent event count. Because the spatial and temporal dimensions of aggregation boundaries for violent events to survey data can influence conflict analyses (e.g., Linke and O’Loughlin 2015), we aggregate violence within 25 and also 50 kilometers of each EA and present the results of varying spatial ranges in our Supporting Information results (see Tables SI14 and SI15).
Data
We examine four different data sets to test the relationships elaborated above: (1) our original population-based survey of individual attitudes and experiences, (2) remotely collected data in the form of satellite images (local vegetation conditions), (3) gridded precipitation data based on spatially interpolated rainfall station information, and (4) disaggregated and georeferenced violent events data from media sources. The following subsections describe each in turn. Descriptive statistics for all of our data are presented in Supporting Information Table SI1. Our survey data measure enumerator and respondent ethnicity and in our analysis, we control for problematic interviewer coethnicity bias identified by Adida et al. (2016).
Surveys—Precipitation Change
Our survey data were collected between June 6 and July 5, 2014. The distribution of sampling EAs is countrywide (as seen in Figure 2; Supporting Information Figure SI1 and Figure SI3). We trained a team of forty Kenyan enumerators in Nairobi for one week before they were deployed to conduct the personal interviews. The survey instrument was tested during training in Nairobi to gauge the average length of the interviews and to familiarize the enumerators with the order, meaning, and structure of the questions. We based these surveys on a large (N = 504) field pilot of the instrument in Nakuru, Uasin Gishu, and Vihiga counties in late 2013. Respondents could answer the question in whichever language they felt most comfortable using (English, Swahili, or any of the common vernacular languages).
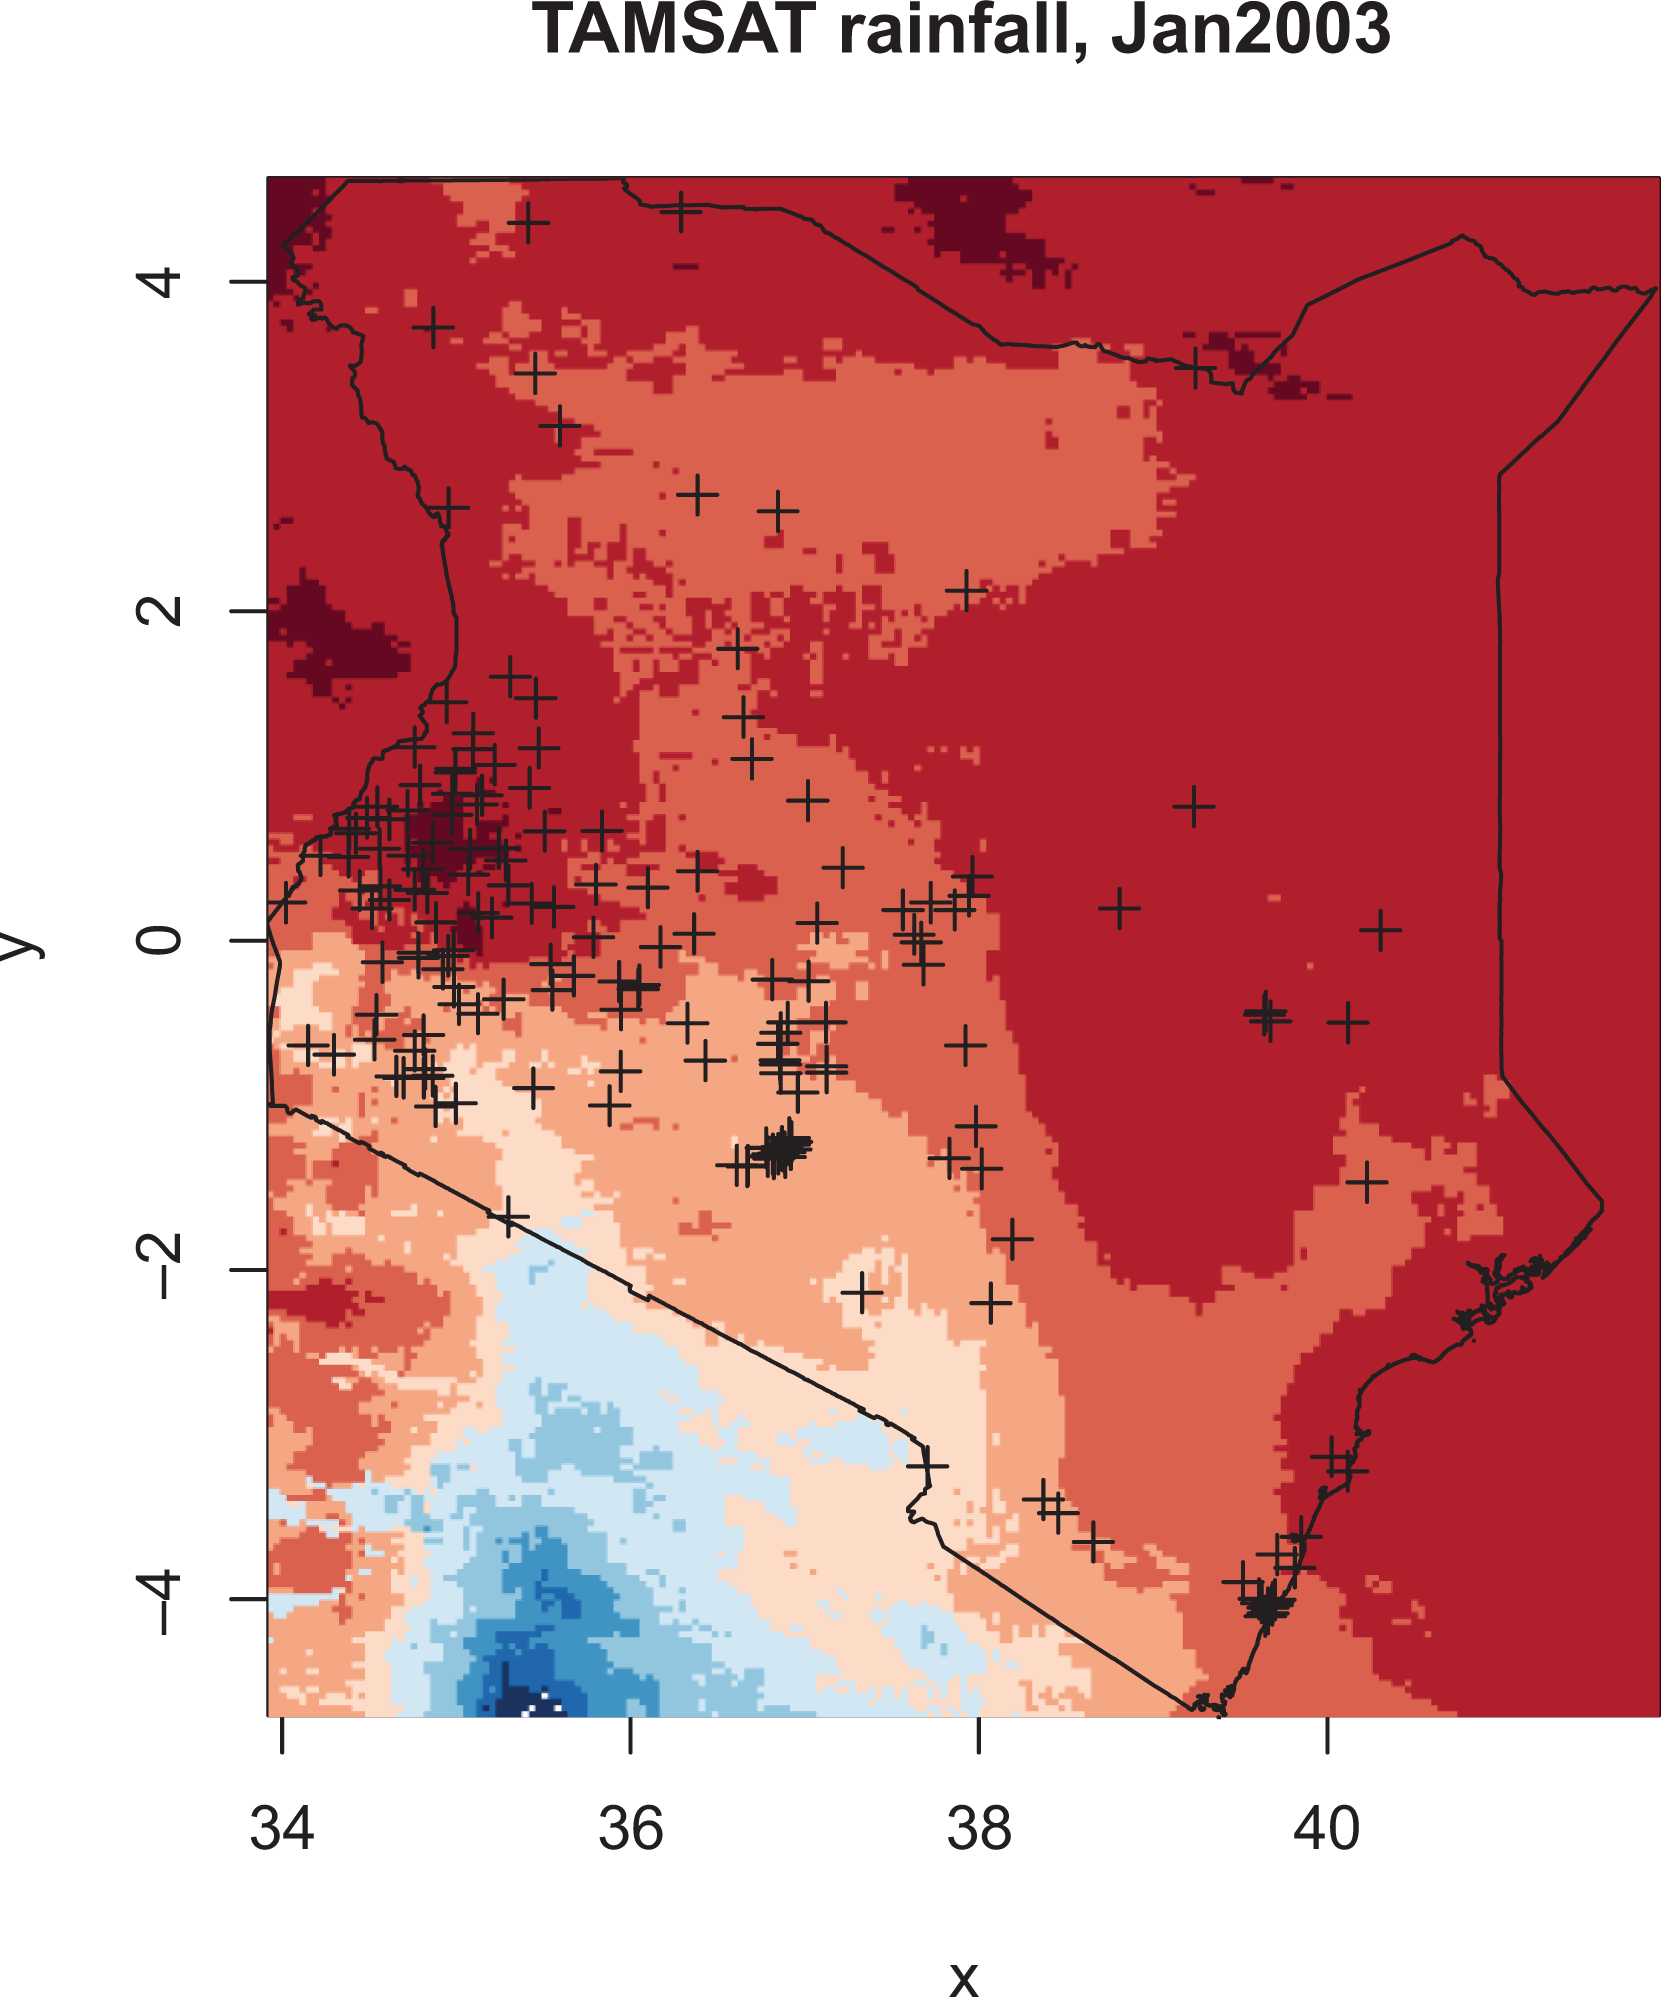
Rainfall estimates at approximately 4 km resolution across Kenya. Survey enumeration area locations are shown in black crosses. During January 2003, red areas were drier than the long-term average and blue areas were comparatively wetter.
The strategy for respondent sampling was a standard stratified probability sample for EAs within counties. The EA maps are the same as those used by the Kenyan National Bureau of Statistics for their census data collection. Across survey EAs (N = 175), members of our five person teams identified the predetermined survey sampling point (SSP) and began a random walk pattern directed in four separate directions (north, south, east, and west). From the SSP, enumerators selected individual respondents of voting age from within the fifth and tenth houses. The final sample population size is 1,400 respondents and is nationally representative. The response rate was 75.5 percent. A potential concern is related to the fact that respondents affected by climate change have migrated. Unless an individual has left Kenya, our sample still includes people who have moved. If a respondent had moved to the EA location within ten years, he or she would have reported moving too recently to accurately recall the changes in precipitation and was dropped from the analysis (see survey question wording in our Supporting Information).
Our key drought predictor variable is the perceived change in precipitation over time as viewed by each survey respondent. We also use the changes in station-observed precipitation (see below). Similar survey questions have been asked to understand the social implications of changing environmental and ecological conditions (Solomon, Snyman, and Smit 2006; Abule, Snyman, and Smit 2007; Kaimba, Njehia, and Guliye 2011). Changes in environmental conditions and incidents of violence, which include cattle raiding activity and land seizures, in Ethiopia were the focus of study from Kassahun, Snyman, and Smit (2008). We selected survey respondents who are eighteen years old or older but also control for the age of respondents in our modeling, which reduces bias from inaccurate recollections of drought by younger respondents.
We asked respondents about both the frequency and the duration of droughts since we wanted to capture multiple dimensions of temporal change in rainfall scarcity. Specifically, we asked respondents whether “droughts are more frequent than they were approximately ten years ago (they happen more often).” Respondents who replied, “yes, droughts are more frequent than they were in the past” were coded as reporting more frequent drought. We also posed the following question to each participant in the project: “are droughts more severe than they were approximately ten years ago (when they happen did they last longer)?” Those who claimed that, “droughts are more severe than they were in the past” are coded as reporting more severe drought. In Figure 3 (panel A), we map the distribution of respondents who reported drought becoming worse (either more severe or more frequent than it was in the past). Another reason for combining drought frequency and severity measures is also to accommodate the differences in ways that respondents may remember the changes in drought conditions compared with ten years ago. 1
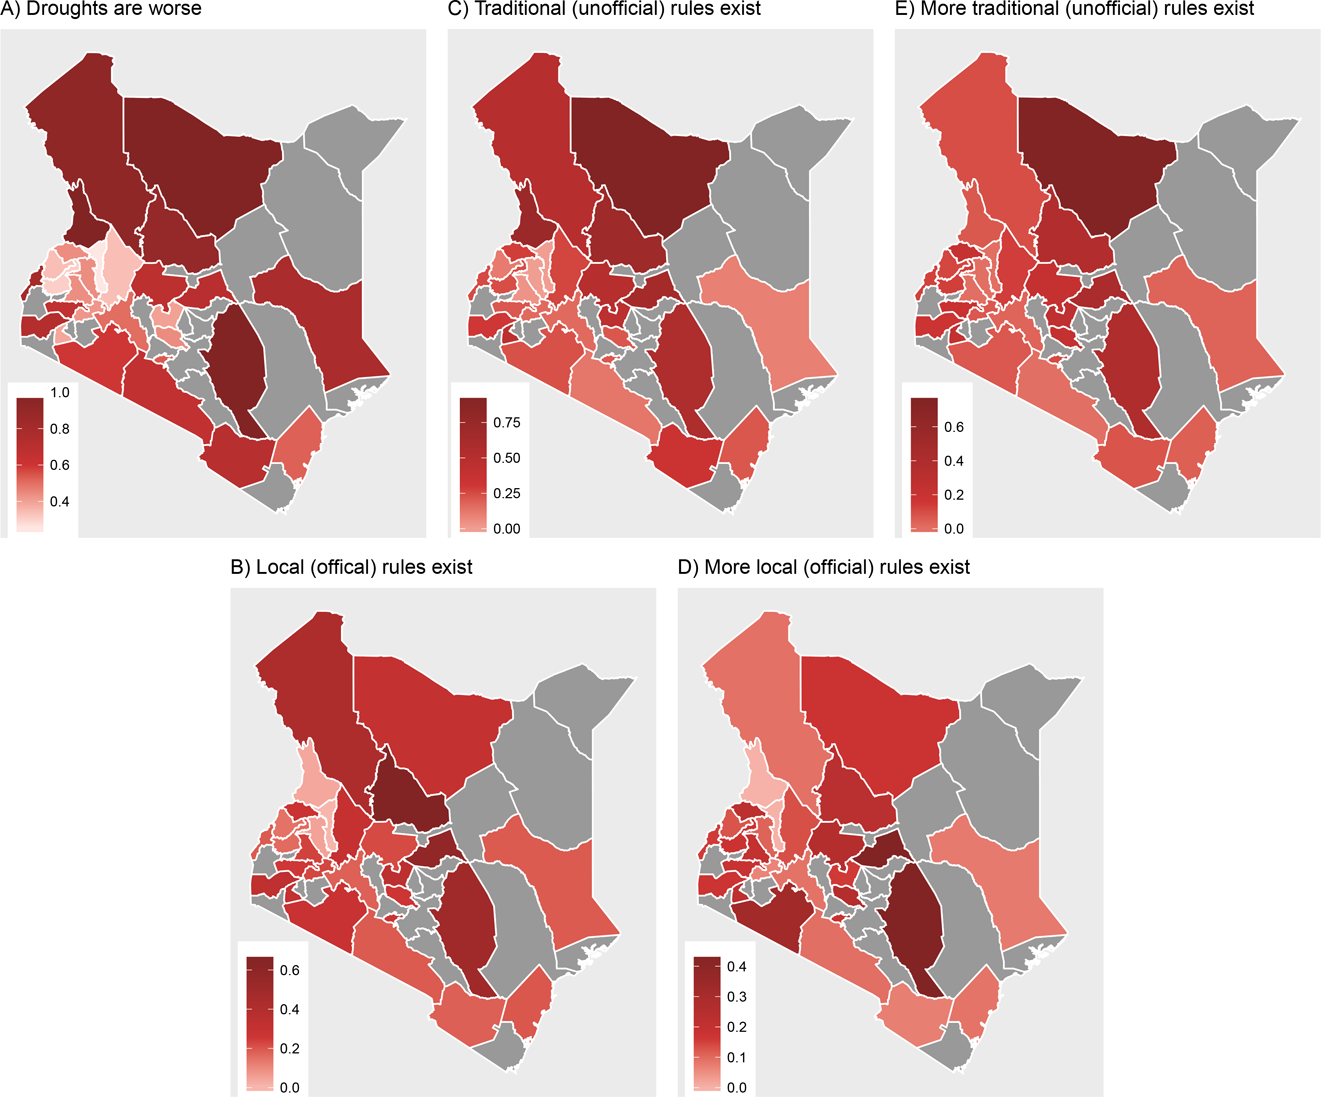
Panels A–E show the proportion of survey respondents in each Kenyan county who reported that drought conditions have worsened, local rules exist, traditional rules exist, more local rules exist than in the past, and more traditional rules exist than in the past. Dark shading represents a high ratio of respondents who answered affirmatively. Gray counties were not sampled.
Surveys—Violence
Asking survey respondents about personal experiences with violence and/or indirect exposure to violence in their area is not uncommon (for Kenya, see Finkel, Horowitz, and Rojo-Mendoza 2012). Asking directly about attitudinal support for the use of violence is less common because it may be difficult (including putting enumerators at risk) and less reliable (responses may not be honest due to fear of prosecution or retribution). Despite these concerns, Oyefusi (2008) asked Nigerians about support for the MEND rebel group in the Niger delta region of southern Nigeria. In Kenya, Schilling, Opiyo, and Scheffran (2012) asked respondents about participation in cattle-raiding activities. Much of the large-N survey research asking about support for the use of violence is found in the study of insurgency. In Pakistan, Blair et al. (2013) asked survey respondents about support for militancy and used endorsement experiments, which we also use, to elicit accurate levels of support for groups such as the Taliban. The survey experiment method is an improvement on direct questioning of attitudes about violence and has been used successfully in many politically volatile and dangerous field research settings (e.g., Lyall, Blair, and Imai 2013; Blair, Imai, and Lyall 2014).
Endorsement experiments rely on a policy cue. In Pakistan, one of the Blair et al.’s (2013) policy cues concerned secondary education curriculum to reduce sectarian discord and another concerned World Health Organization efforts to implement polio vaccines. Our endorsement experiments are based on three policy cues: budgetary spending, the locations of police force deployments, and language policies in schools. Levels of support for the cues are averaged across the whole set. In a treatment version of the question, a group is said to also support the policy listed in the question, and this group is one that is known to be violent. Identifying an endorsing party suitable for Kenya (and for our research question) is difficult because of the great number of ethnic communities in the country (over 40). In order for the endorsing party to be relevant to a respondent’s experiences, there should be agreement between his/her ethnic community and the group named in the survey experiment. With such a diversity of ethnic communities in Kenya, randomization of treatment versions of questions across the sample to ensure that appropriate versions are sent to ethnically homogenous areas would be prohibitively difficult.
Instead of referring to a specific ethnic community in the endorsement of a policy, we rely on a generic reference to ethnic community militias (violent youths within the group). In Kenya, violence is typically perpetrated by the members of an ethnic community against the members of a historically rival community. The reasons for the grievances are variable and the temporal dimension can change dramatically, such as from historical injustices committed against one community by another since independence (e.g., narratives of disenfranchised Kalenjin by Jomo Kenyatta, the Kikuyu first president of Kenya) or dynamics of reprisal attacks between pastoralists (e.g., Pokot and Turkana cyclical raiding intended for the theft of livestock). We ask a control version of a question where we present respondents with the following statement: “It has been proposed that young school children learn only in their home (vernacular/tribal) language,” to which respondents state whether they “strongly agree,” “agree,” “disagree,” “strongly disagree,” or “don’t know.” In the treatment version of this policy cue question (which is randomized throughout the sample), we ask participants how much they support the same policy with an additional clause. The text of the treatment version reads, “in the past and generally speaking, violent youth from your ethnic/tribal community have expressed support for this policy.” After seventy-five pilot tests of the survey instrument in and near Nairobi, the team decided that the refined references included in the description of endorsing parties were suitable. After averaging policy support across the three separate cues, our outcome of interest is a single variable that is scaled 0–1. When treatment status is used as an indicator in a regression model testing respondent-level variables that predict support for the policy, the estimate of the binary treatment assignment predictor indicates the level of support for policies given the endorsement of a violent actor. Technical details of the methodology are explained in the methods section.
Surveys—Rules of Resource Use
We measure the presence of rules governing natural resource use at subnational levels using several survey questions. Baybeck and McClurg (2005) similarly used subjective perceptions for measuring social context. Although data reliably characterizing such rules at local levels are rare, we believe that we have a valuable measurement of the contexts that could moderate links between drought and support for violence. However, no publicly available comprehensive and comparative data set of regulations for these settings exists for Kenya. Furthermore, by relying on individuals’ familiarity with rules, we are capturing the extent to which the rules would be expected to influence Kenyans’ lives; if Kenyans in an area are not aware of rules, they are unlikely to be effective. We probe the quality of local governance in a manner similar to Kassahun, Snyman, and Smit (2008, 1267) who asked Ethiopian respondents a series of questions about “the indigenous management practices in rangeland and water resources in terms of coping mechanism.”
Our questions about resource management rules are multifaceted, capturing each of the four theoretical expectations that we have listed above. First, we ask respondents whether traditional nongovernmental rules exist in their area for the management of natural resources, including the use of water and access to land. The specific wording of the question is presented in the Supporting Information. We also ask whether or not there are more of these rules than there were approximately ten years ago (matching the drought question in temporal reference). Respondents are provided the option of saying that they don’t know (whether because they just moved into the area, because they are uninformed, or because they were reluctant to answer). As a corollary to these questions, we ask respondents whether or not there are governmental/official rules for managing resources in their area.
There is great variation in the distribution of survey responses within Kenya (see Figure 3, panels B–E). Some areas have a great number of traditional rules (Pokot and Marsabit) and in others, they are relatively rare (Uasin Gishu and Trans Nzoia). Substantial variation in the type or form of the rules also exists and this variation may reveal telling patterns of conflict risks during times of droughts. Pokot County, for example—which lies just south of Turkana along the northwestern border of Kenya with Uganda—has very few local official rules for resource management (Figure 3, panel B). By contrast, Pokot has many traditional nongovernmental rules (Figure 3, panel C). In Meru, Kitui, and Marsabit, we find the greatest reported change in the presence of customary nongovernmental rules from ten years earlier.
Vegetation Condition Index (VCI)
We use changes in vegetation health as an important control for potential bias in the reporting of drought; our analysis of observed drought effects on attitudes excludes these VCI data. Our concern is whether or not a survey respondent accurately remembers changes in his or her area. If a respondent recollects a time ten years prior when a lush field existed immediately across the fence from her property and a large farm operated across the dirt road, she may be disappointed with the conditions today even if the changes had nothing to do with rainfall. For example, perhaps the road in front of this respondent’s house now has tarmac and the farm across the street became a two-story apartment complex with twenty families living inside. Imagine that the road is busy now and a dusty and a hectic matatu stage (public transportation van stop) lies at the edge of her property. In responding to our survey, it may be difficult for the respondent to separate a memory of drought and farming (or livestock) activities from the current, comparatively poor, conditions. East African research has shown that “drying precipitation patterns only partially statistically explain the vegetation browning trends, indicating that other factors such as population pressures and land use change might be responsible for the observed declining vegetation condition” (Pricope et al. 2013, 1525). We believe that controlling for vegetation browning trends in our analysis should eliminate a chief potential source of bias in drought perceptions that could be based on population movement, infrastructure development, or changes in forestry practices (clearing land) that are not a result of precipitation alone.
To control for browning trends that could bias respondent answers, we use a VCI based on the National Oceanic and Atmospheric Administration’s Advanced Very High Resolution Radiometer sensor. Our data were processed at a sixteen kilometer grid cell resolution and are mapped along with survey sample EAs in Figure SI1. We merge the time-series VCI data to survey sampling locations and compute a two-year average value for the period ten years ago (2003–2004) and calculate the change to the period 2013–2014, when the survey was completed. The resulting value measures whether the vegetation health is better or worse than it was a decade earlier.
Standard Precipitation Index (SPI; Three Month)
To compare our results using reported drought to the measured precipitation changes in each EA, we join survey locations to an SPI based on the Tropical Applications of Meteorology using SATellite and ground-based observations (TAMSAT) ∼4 km high-resolution data (Maidment et al. 2014). These data are derived from archived Meteosat infrared imagery calibrated with historical rain gauge data from numerous international and African agencies. Figure 2 shows our survey EAs mapped above the raw rainfall estimate image for an example month (January 2003). The three-month average SPI (SPI3) compares rainfall in a given month and the two preceding it to the long-term average of the same months since the start of the data record. In other words, September, August, and July 2006 are compared to all previous Septembers, Augusts, and Julys. The three-month average is better at capturing precipitation variability in areas with high seasonality than longer averages such as six- or nine-month periods, where the seasons of long and short rains might be averaged into a longer period resulting in a single SPI deviation value that eclipses dynamic monthly variability. We control for the precipitation during the year prior to the survey to account for the possibility that substantial recent rainfall (or, alternatively, severe deficits) may bias respondents’ reporting of drought trends. Finally, the normal variability of rainfall in an area could influence perceptions of drought (Dell, Jones, and Olken 2014), and we control for this possibility with an indicator of variance of SPI3 throughout the long-term average; the calculation captures how typical unusual weather is at each EA.
The temporal trend in annual SPI3 values for each EA is shown in Figure SI2. Dramatic subnational variation exists in the line graphs, even though there is greater precipitation overall during this period than during the long term (mean SPI3 is .204). Differences in rainfall such as these are completely lost in aggregated national statistics, illustrating the value of the geographically localized lens that we adopt. To make our SPI3 results comparable with reported drought, we create a dichotomous indicator of whether or not an EA average SPI3 value is drier than 90 percent of the other EAs. This represents substantial precipitation deficits and very dry conditions. We also test a more moderate version of this binary indicator capturing whether or not an EA is drier than 75 percent of EAs (see Tables SI7 and SI8).
Observed Violence (Media-based Metric)
Violent events reported in the media are helpful for checking whether attitudes about the use of violence are acted upon. We can also join these violent events data to survey EA locations to ease concerns that our findings are dominated by endogenous links between prior violence in a region and reported or observed conflict during 2014. For our control variable measuring presurvey conflict, we map the locations of all ACLED violence during the five-year period preceding our surveys and aggregate the events that fall within fifty kilometers of the EA. For our analysis of violence taking place after our survey, we use a one-year temporal window and both a twenty-five kilometer and fifty kilometer spatial boundary (see Tables SI14 and SI15 for results using the larger radius). A control variable for a smaller area is intuitive as a generalized surrogate for insecurity whereas measuring the outcome variable in a large region risks missing any connection between the drought and conditional institutional effects of violence. There are two reasons for using a one-year window after the survey. First, these violent event data were only available through the end of 2015 at the time of writing. Second, beyond one year after the survey, it is possible that rules changed in some way that influenced conflict but that is not measured in our survey. If a county enacted new rules in June 2015, for example, these may cause a spike in violence during 2016.
Analytical Method
We follow the conventional approach for the analysis of endorsement experiments in survey research (see Blair et al. 2013). With the continuous measure of support for the policy cues averaged, we use an ordinary least squares (OLS) estimation of variables for each survey respondent. For each survey respondent, i, policy support (Pi) is modeled as a function of variation across binary treatment (Ti) group status in:

where individual level characteristics and other environmental indicators are a matrix of control variables Xi and corresponding support for the policy is vector of coefficients η. Variation in treatment effects (of support for the use of violence) by respondent characteristics such as drought, the existence of local rules, or the moderating effect of the latter upon drought impacts is captured in the estimated value of γ for interaction term TiZi. Random error is represented by ε i . We report γ in our results section tables with standard errors and also as a treatment effect in percentages with the associated standard error.
Due to the possibility that observed weather patterns are clustered in space (Auffhammer et al. 2015), we use Conley (1999) standard errors that correct for such spatial dependencies (see also Hsiang 2010). We designate fifty kilometers as the threshold for a spatial kernel between EAs but test the effects using 100 km as well (see Tables SI9–SI12). In various models, we also test the effects of dropping individual-level demographic controls (see Tables SI3–SI6). Following Blair et al. (2013), we use Stata’s “lincom” command (linear combination of parameters) to derive the estimates of changes in support for the use of violence measured as a percentage ranging from 0–100. We opt for this method instead of manually adding coefficient estimates, which would have no standard error for significance tests of combined effects.
For binary survey response models of natural resource regulation presence, we account for spatial dependencies among units of observation using a spatial smoothing term in a generalized additive model (GAM). This smoothing parameter is similar to a spatially lagged dependent variable estimate and approximates the influence of location upon the outcome of interest (see Wood 2004, 684). GAM spatial smoothing terms have been used in existing spatial analysis of geographically disaggregated violent events data (e.g., Linke et al. 2017).
Results
Before assessing our specific propositions about natural resource use rules and violence, Tables 1 and 2 show the tests of a baseline link between precipitation shortages and support for the use of violence. This is an intuitive first step in our analysis even when the final objective is testing conditional effects interaction terms. We present the policy cue interaction term in our tables but the estimate of interest is labeled with “lincom.” Table 1 shows that a respondent who reported more frequent or more severe droughts in his or her region is no more likely to support the use of violence than those who did not report rainfall deficits. This finding holds for models with and without controls as models 1–3 show.
Effects of Reported Drought on Support for the Use of Violence.
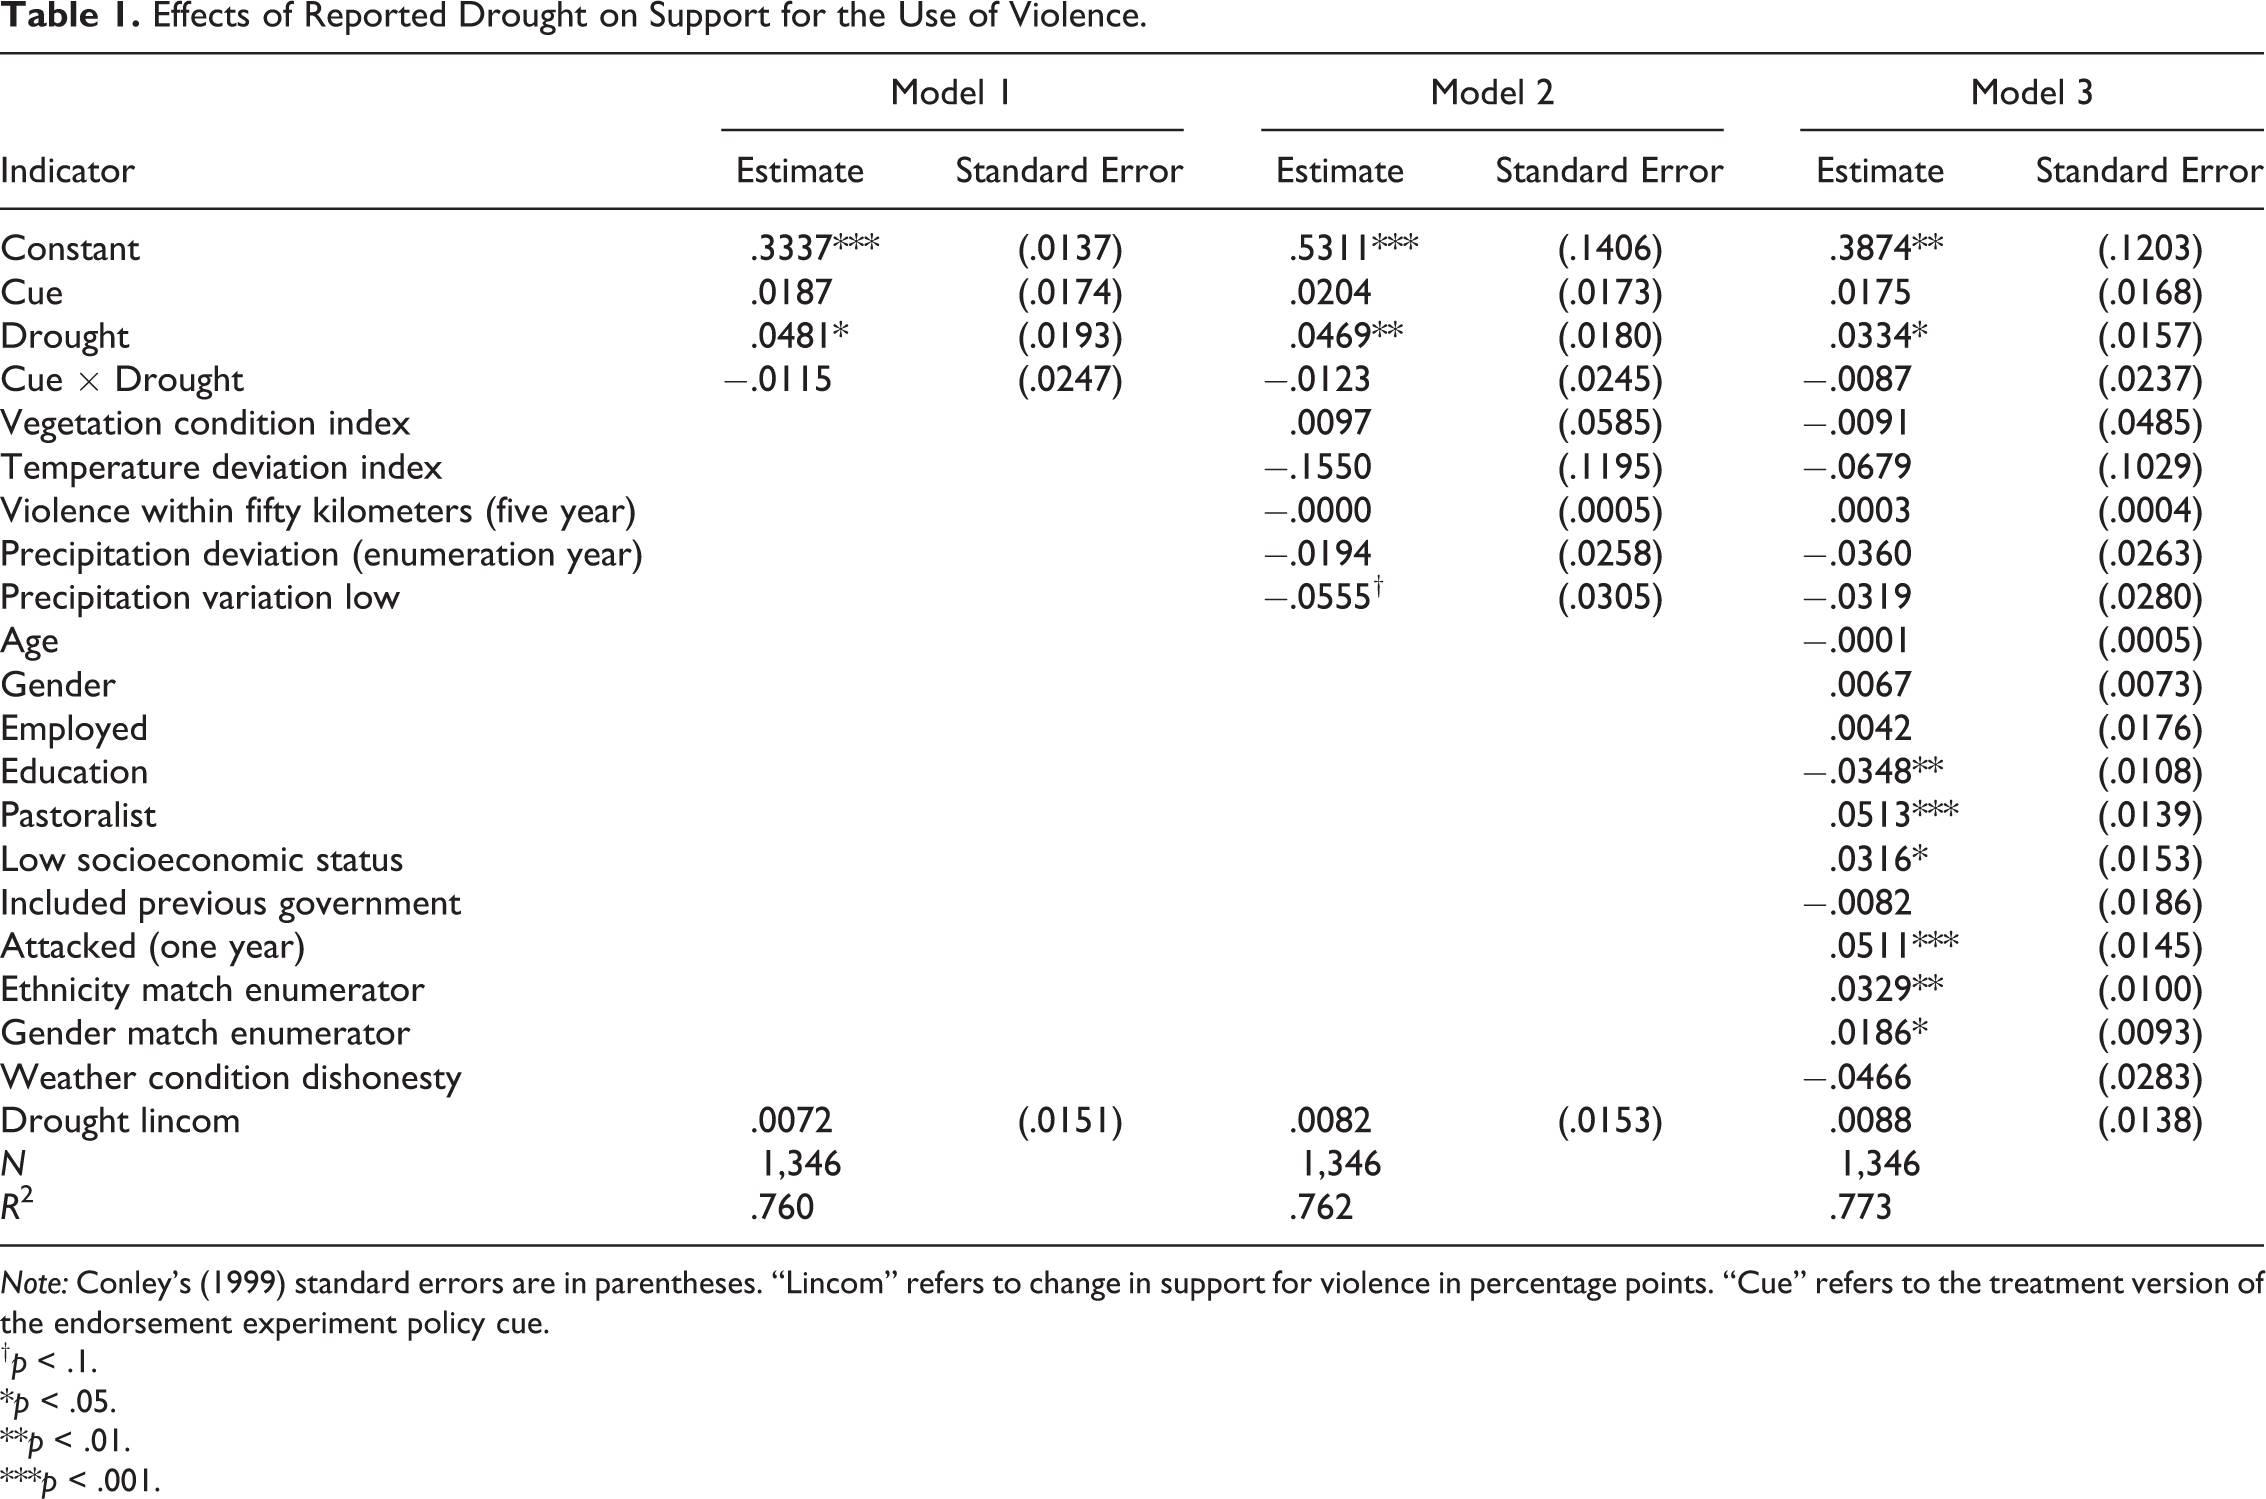
Note: Conley’s (1999) standard errors are in parentheses. “Lincom” refers to change in support for violence in percentage points. “Cue” refers to the treatment version of the endorsement experiment policy cue.
† p < .1.
*p < .05.
**p < .01.
***p < .001.
Effects of Observed Drought (TAMSAT Precipitation) on Support for the Use of Violence.

Note: Conley’s (1999) standard errors are in parentheses. “Lincom” refers to change in support for violence in percentage points. “Cue” in the table refers to the treatment version of the endorsement experiment policy cue. TAMSAT = Tropical Applications of Meteorology using SATellite and ground-based observations.
† p < .1.
*p < .05.
**p < .01.
***p < .001.
In Table 2, we show the tests of whether observed precipitation deficits are correlated with support for the use of violence. Across Kenya, people living in those EAs with the most pronounced rainfall shortages are in fact more likely to support the use of violence than their peers living in wetter areas. This effect of observed precipitation is consistent for several estimates, as models 1–3 illustrate. In our preferred model 3 with all controls, respondents in areas that have become substantially drier over time (drier than the trend for 90 percent of EAs) are slightly (3.52 percent) more likely to support the use of violence. While the drought–violence relationship does not hold for reported dry conditions (Table 1), the effects in Table 2 are strong justification for extending our analysis to the social contexts where such a relationship exists.
Our principal goal is to test the conditional effects of drought for violent attitudes in the presence of natural resource use and access rules. A concern in such a research design is an endogenous relationship for violence. Conflict could alter the viability or salience of institutions and regulations for violence. Because of these dynamics, isolating the true effect of such institutions can be difficult. To test for endogeneity, we measure the impact of violent events preceding our survey upon the reporting of natural resource use rules. In a spatial model, violent events within fifty kilometers of an EA during the preceding five years have no statistically significant effect on whether natural resource rules are reported by respondents (see Table SI2). Violent events have no measurable impact on whether or not the number of official or unofficial rules has increased within a respondents’ area. In a model with no spatial effects, there are select effects of violence for inhibiting institutions’ development. Nevertheless, all of our models include violence within fifty kilometers of an EA for the five years preceding the survey to ease endogeneity concerns.
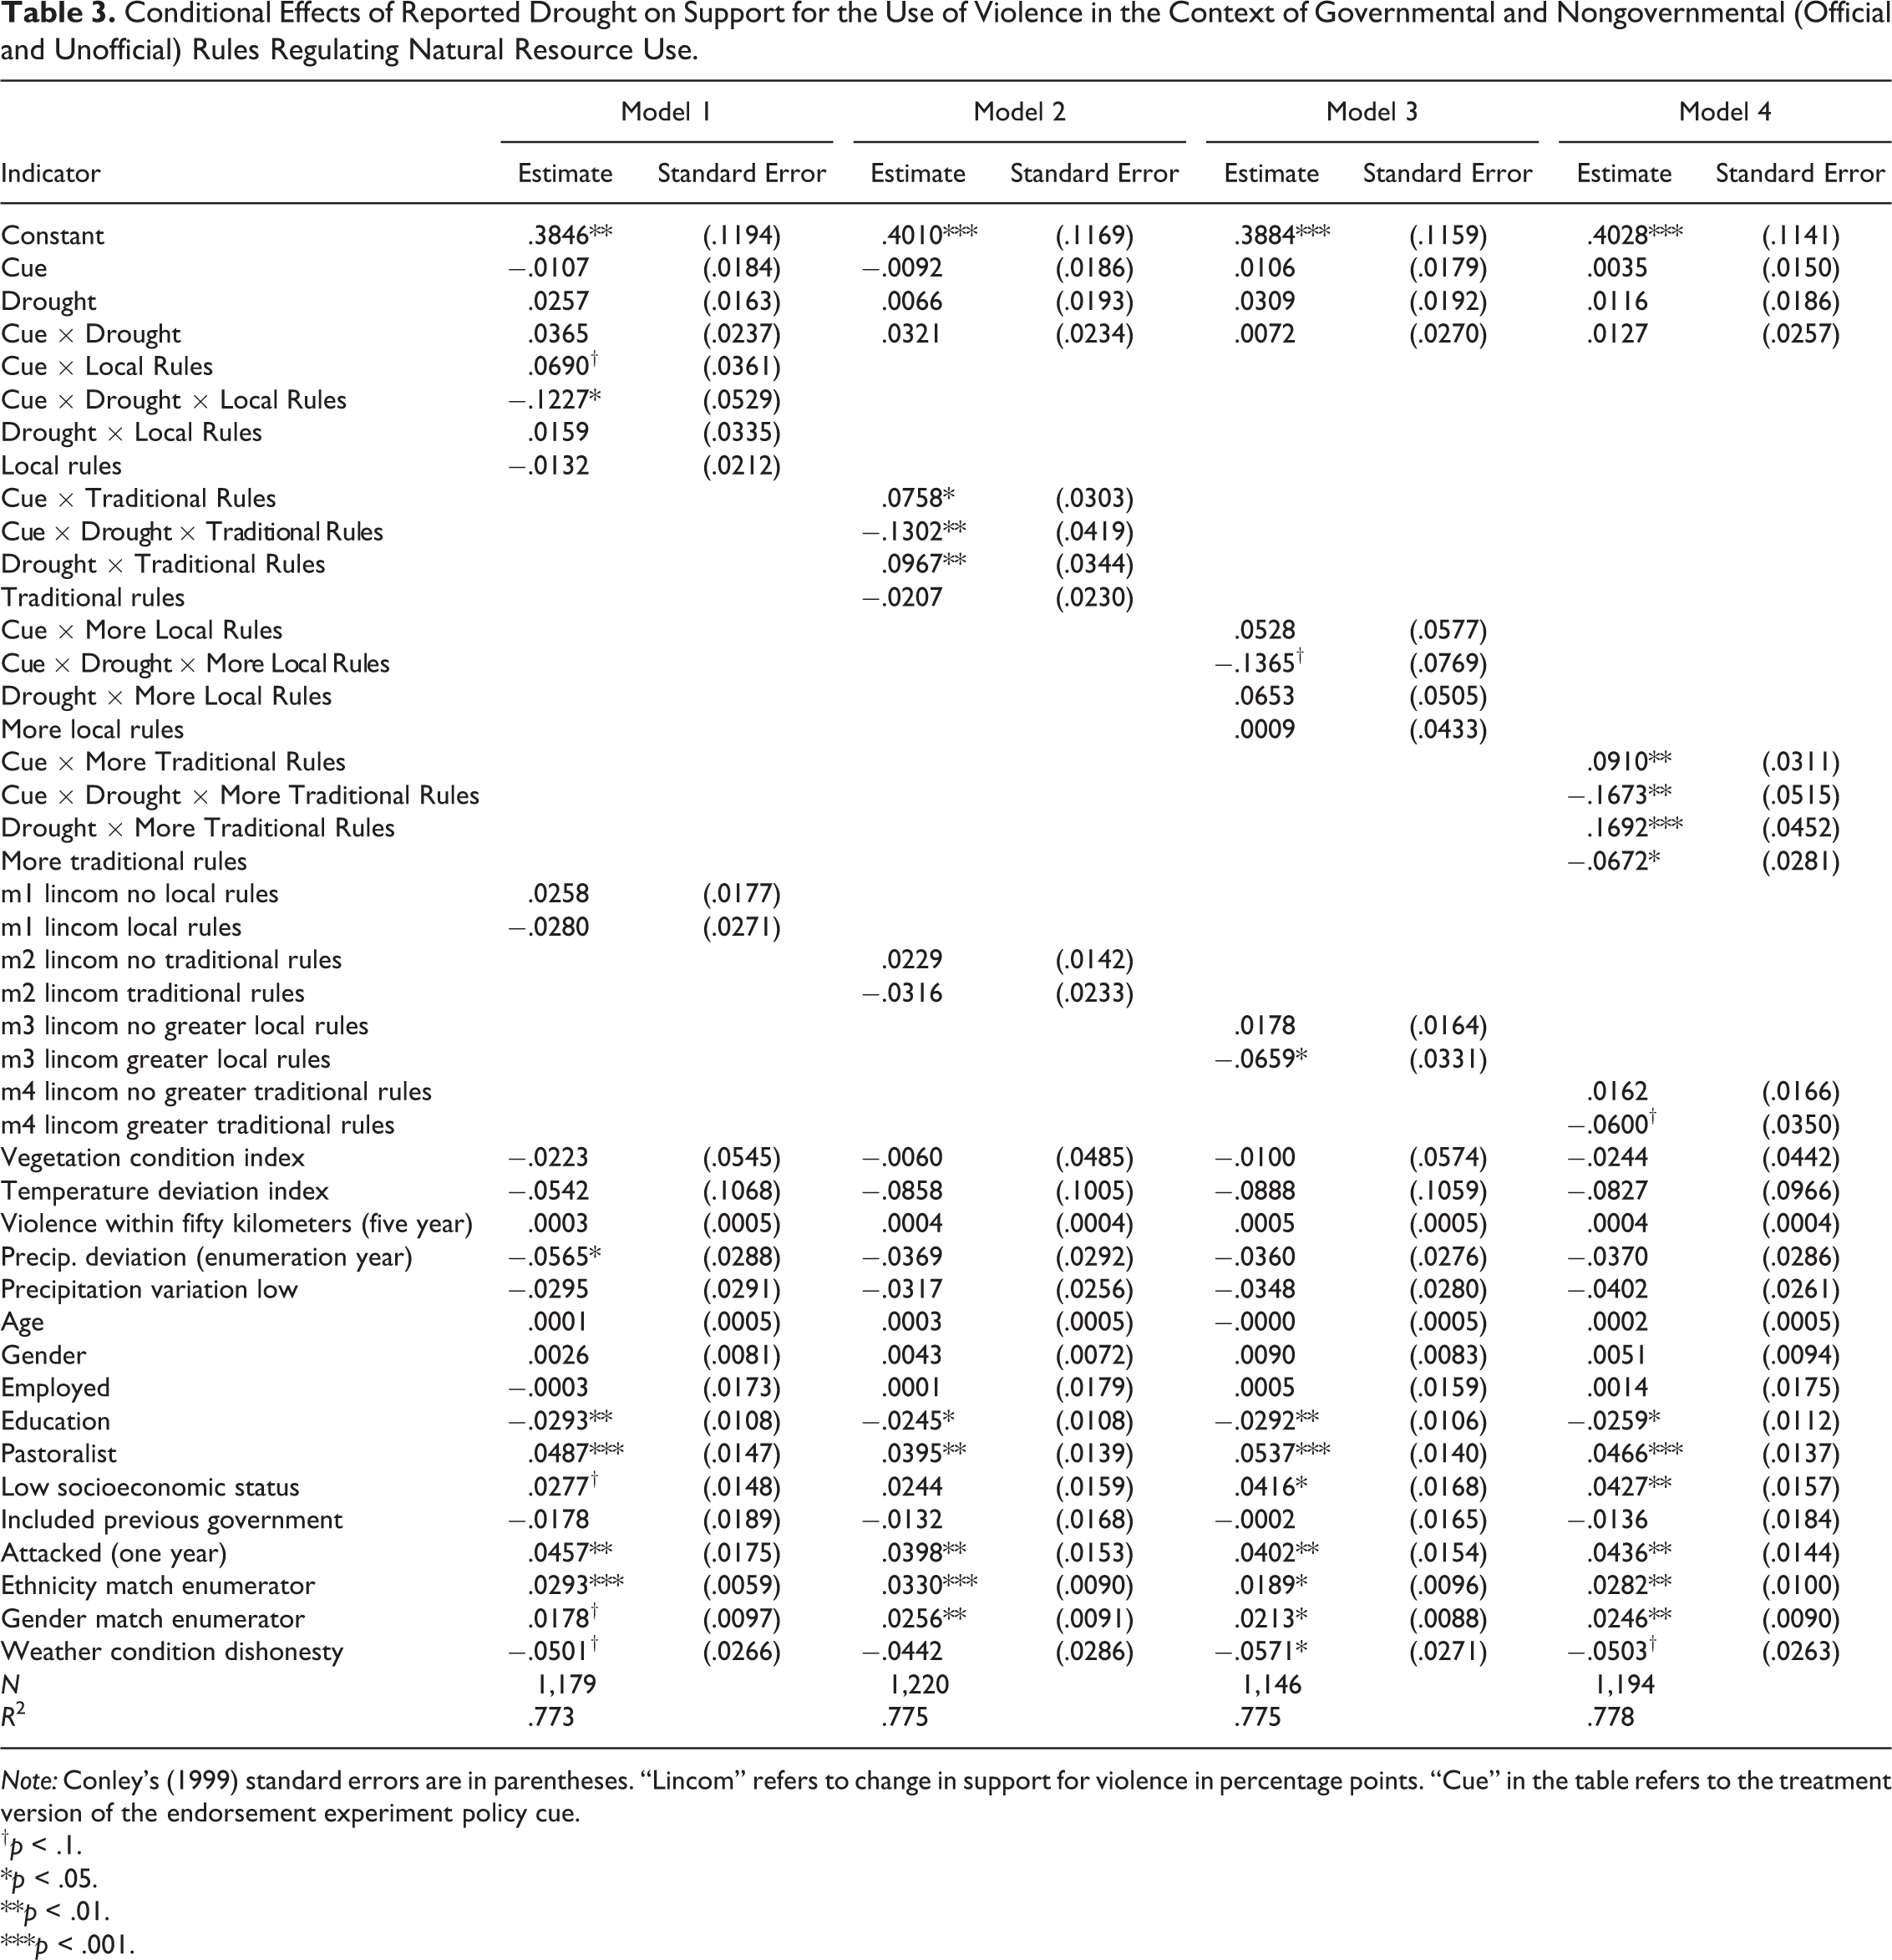
Table 3 presents our main reported drought effects and the conditional influences of contextual-level natural resource rules upon support for the use of violence. Table 4 below replicates these models with observed precipitation. Replications of both Table 3 and Table 4 analyses without controls are presented in Tables SI3 and SI4. Tables SI7, SI8, and SI13 present the results of using a different binary threshold for observed drought (≤75 percent of EAs) and alternative precipitation data with different spatial and temporal resolutions (from the University of Anglia Climate Research Unit), respectively. Models 1–4 in each results table beginning with Table 3 correspond directly to our stated propositions. Key estimates of interest are labeled with “lincom” and represent the percent change in support for the use of violence. The test of each proposition compares the linear combination of drought effects in areas without rules against the similar effect in areas with rules. As reflected in each table, the analysis N changes for each model according to the exclusion of “don’t know” responses for the pertinent survey question.
Conditional Effects of Reported Drought on Support for the Use of Violence in the Context of Governmental and Nongovernmental (Official and Unofficial) Rules Regulating Natural Resource Use.
Note: Conley’s (1999) standard errors are in parentheses. “Lincom” refers to change in support for violence in percentage points. “Cue” in the table refers to the treatment version of the endorsement experiment policy cue.
† p < .1.
*p < .05.
**p < .01.
***p < .001.
Conditional Effects of Observed Drought (TAMSAT Precipitation) on Support for the Use of Violence in the Context of Governmental and Nongovernmental (Official and Unofficial) Rules Regulating Natural Resource Use.

Note: Conley’s (1999) standard errors are in parentheses. “Lincom” refers to change in support for violence in percentage points. “Cue” in the table refers to the treatment version of the endorsement experiment policy cue. TAMSAT = Tropical Applications of Meteorology using SATellite and ground-based observations.
† p < .1.
*p < .05.
**p < .01.
***p < .001.
Regarding proposition one, we find no statistically significant evidence that the presence of local official (governmental) rules has an effect on the level of support for the use of violence. In model 3, we find support for our proposition that a greater number of official governmental rules within an area will be associated with reduced support for violence. A rise in the number of local governmental institutions over time is associated with a modest (6.59 percent) reduction in support for violence. A similar measure capturing any rise in the number of traditional resource management rules has only marginally significant effects that would support proposition four (p ≤ .1). Dropping controls from our models (see Table SI3) has no effect on our main conclusions. Table SI9 also shows that using an alternative spatial threshold for the Conley (1999) errors estimation gives similar statistical significance levels.
In Table 4, we repeat the analysis of Table 3 with observed TAMSAT precipitation records instead of self-reporting from survey participants. Interestingly, the conditional effect comparisons—of drought effects in areas without rules to drought effects in areas with rules—do not directly match our expectations. Nevertheless, there is some support for every proposition about social context and the influence of regulations; violence support is 4.24 percent, 2.49 percent, 5.21 percent, and 3.17 percent higher in the absence of these rules when droughts are present and each of these positive significant effects disappears when natural resource rules exist or have increased in number during the last decade. This finding suggests that as institutional regulations become more common, they moderate the potentially harmful effects of drought upon support for the use of violence. These effects are observed after controlling for individual level exposure to violence (within the previous year) and legacies of local conflict up to five years preceding survey data collection. Dropping control variables from our estimates eliminates the effect of official rules’ presence but results in no change for the other rules’ moderating effects (see Table SI4). Using a more moderate threshold, drought in the absence of a greater number of regulations is associated with 3.61 percent and 3.35 percent increase each for official and unofficial rules, respectively (see Table SI7, models 3 and 4). As with our other analyses above, the rules indicators do not have a direct conditional dampening effect but the harmful effects of drought without rules disappear. With a larger 100 km distance boundary for Conley (1999) standard error estimation, we find that there is some support for proposition three: a greater number of official rules reduces the harmful effects of droughts that is observed in their absence (see model 3 of Table SI10). At higher levels of statistical uncertainty (p ≤ .1), there is tentative agreement with earlier models that use a smaller distance range. Using alternative Climate Research Unit precipitation data (see Figure SI3) at a coarse fifty-five kilometer spatial resolution, we find strong evidence that an increase in the number of local unofficial rules is associated with reduced support for violence where dry conditions are increasingly common (see Table SI13).
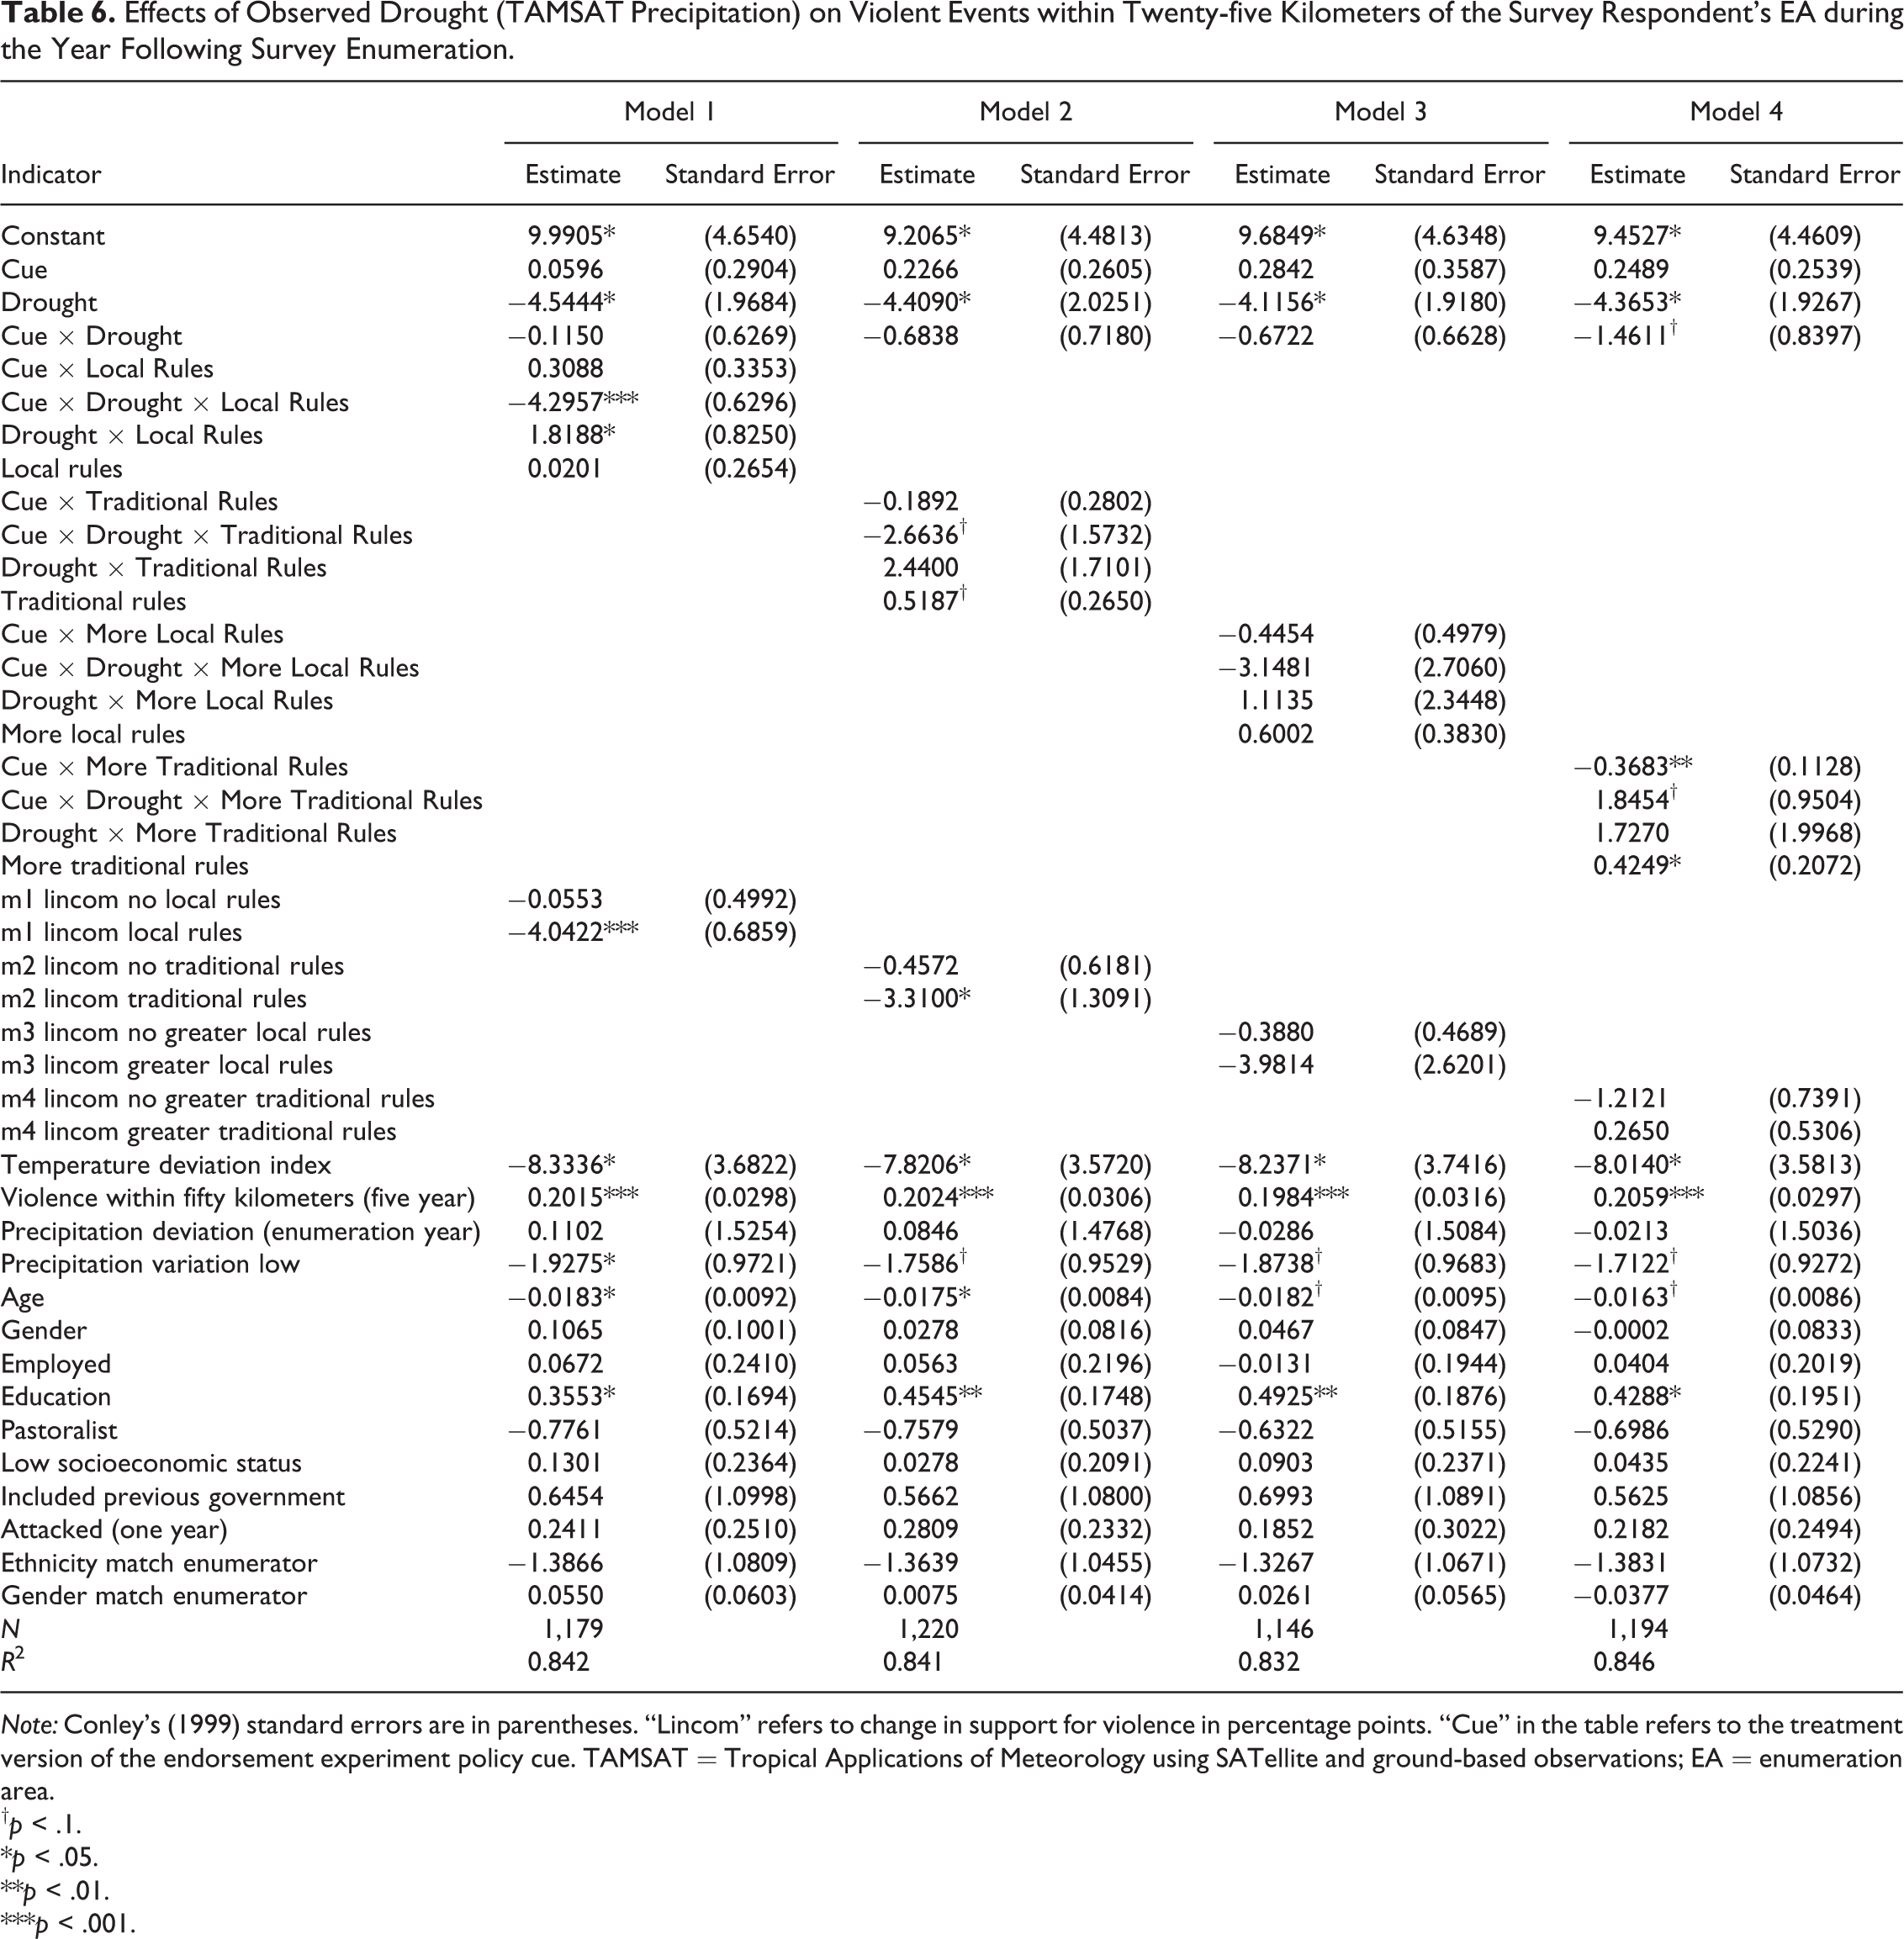
Does support for the use of violence translate into violent action and conflict events? It is of course almost impossible to know whether the same individuals who supported violence in our surveys went on to perpetrate violent acts. We present ancillary tests of each proposition above using violent events data recorded by Kenyan media in the year following survey enumeration. Tables 5 and 6 present the effects of reported and observed drought, respectively, upon the frequency of violence within twenty-five kilometers of EAs as the outcome. We use a negative binomial generalized linear model in these estimates instead of an OLS functional form, as is used for violence support analyses above. For reported drought, we find that drought in the absence of traditional rules is associated with .563 more violent events but that the effect disappears where unofficial regulations are reported. As a percentage of the mean event count of 4.12, this is a substantial increase of 13.6 percent. Similar effects are found with lower statistical significance for the other proposition (p ≤ .1). Changing the Conley (1999) standard error estimate distance threshold to 100 km (see Table SI11) does not change our results and using an alternative measurement of violence within fifty kilometers of EAs yields estimates that are not statistically significant (see Table SI14).
Effects of Reported Drought on Violent Events within Twenty-five Kilometers of the Survey Respondent’s EA during the Year Following Survey Enumeration.

Note: Conley’s (1999) standard errors are in parentheses. “Lincom” refers to change in support for violence in percentage points. “Cue” in the table refers to the treatment version of the endorsement experiment policy cue. EA = enumeration area.
† p < .1.
*p < .05.
**p < .01.
***p < .001.
Effects of Observed Drought (TAMSAT Precipitation) on Violent Events within Twenty-five Kilometers of the Survey Respondent’s EA during the Year Following Survey Enumeration.
Note: Conley’s (1999) standard errors are in parentheses. “Lincom” refers to change in support for violence in percentage points. “Cue” in the table refers to the treatment version of the endorsement experiment policy cue. TAMSAT = Tropical Applications of Meteorology using SATellite and ground-based observations; EA = enumeration area.
† p < .1.
*p < .05.
**p < .01.
***p < .001.
Interestingly, the effects of observed drought lend support to our expectations that official and unofficial natural resource use and access rules would dampen the effects of drought upon the incidence of violence. Model 1 of Table 6 predicts 4.04 fewer violent events in areas with drought and governmental natural resource rules than in dry areas that do not have such rules in place. The same is true for nongovernmental traditional regulations, where the negative conditional effect on violence is 3.31 fewer violent events (see model 2). Dropping control variables (see Table SI6) and changing the spatial boundary for the estimation of Conley’s (1999) standard errors (see Table SI12) have no effect on this conclusion. Table SI15 shows that using a fifty kilometer distance threshold for aggregating postsurvey violent events renders this finding null. The dynamic captured by these indicators is therefore highly localized or spatially limited in character. If we use a more moderate threshold for drought indicator based on TAMSAT SPI3, the moderating effect also disappears (see Table SI8), suggesting that the weather influences on support of violence may only exist at extremes.
Conclusion
We set out to understand how drought might lead to support for the use of violence. Our operating assumption, based on research in the field of armed conflict studies, is that conflict will be most likely when a large segment of a population believes that violence is a legitimate expression of redress of grievances. As a significant contribution to the literature on the topic of climate change impacts, we have tested several specific theoretical expectations of the role that conflict-mitigating social forces play within Kenya. While many researchers claim that environmental changes translate into violent conflict as a result of some social and economic perturbations to usual conditions (or “shocks” to the status quo), such mechanisms are rarely tested in empirical analysis. We remedy this gap in the literature by proposing that support for the use of violence would be lower where official and unofficial rules for the use and distribution of natural resources exist.
In our models, we find some evidence that drought modestly increases the level of support for violence among Kenyans. Some models also indicate that areas with drought are more likely to experience violent events during the year after our survey data were collected. Local official and unofficial rules, as well as an increasing number of such rules during the last decade, eliminate these harmful effects in our preferred models and in many extended analyses. In some estimates with observed precipitation deficits the moderating effect of local rules is to reduce violence directly. Our broadest conclusion is that while environmental change and shortages of rainfall represent a stress for many households’ livelihoods, certain regulations may ameliorate these difficulties. Research on this important relationship should be designed to understand the varying local contextual conditions that explain any association between our changing climate and violence.
There are two caveats to our study that will guide our ongoing research. First, our results for observed and reported drought are not always consistent. While drought is arguably an objective condition when it is measured by millimeters of rainfall and evapotranspiration, we have found that perceptions of changing drought patterns relate to violence in different ways. It is important to note that this distinction exists after controlling for a suite of individual level variables such as age, education, and socioeconomic status. A pastoralist is more likely to remember the conditions of drought than someone employed in nonagricultural sectors, for example. Compared to an older farmworker, a younger Kenyan may have a poorer recollection of drought conditions ten years prior. Even after controlling for perceived relative deprivation vis-à-vis other ethnic communities, age, and other likely influences, this difference in Kenya between reported and observed drought effects remains.
Second, another goal of our ongoing Kenyan fieldwork will be to identify why the trend in certain towns and counties deviates from the overall national patterns. While traditional or customary rules may moderate conflict risk in some contexts, we know that this is not true in all places. We hope to understand why some customary practices are influential at some locations and not at others; such information will complement the nationally representative and generalizable findings of this article. Further analysis of our survey data can direct us toward a multifaceted understanding of conditions that moderate conflict risk at multiple geographical scales.
Supplemental Material
Supplemental Material, Replication_files_Linke - Drought, Local Institutional Contexts, and Support for Violence in Kenya
Supplemental Material, Replication_files_Linke for Drought, Local Institutional Contexts, and Support for Violence in Kenya by Andrew M. Linke, Frank D. W. Witmer, John O’Loughlin, J. Terrence McCabe, and Jaroslav Tir in Journal of Conflict Resolution
Footnotes
Acknowledgment
We thank Abel Oyuke (Institute of Development Studies, University of Nairobi) for assisting in the supervision of our Kenyan survey enumeration.
Declaration of Conflicting Interests
The author(s) declared no potential conflicts of interest with respect to the research, authorship, and/or publication of this article.
Funding
The author(s) disclosed receipt of the following financial support for the research, authorship, and/or publication of this article: This research is financially supported by a National Science Foundation Interdisciplinary and Behavioral Social Sciences Award Number 1329125.
Supplemental Material
Supplementary material for this article is available online.
Notes
References
Supplementary Material
Please find the following supplemental material available below.
For Open Access articles published under a Creative Commons License, all supplemental material carries the same license as the article it is associated with.
For non-Open Access articles published, all supplemental material carries a non-exclusive license, and permission requests for re-use of supplemental material or any part of supplemental material shall be sent directly to the copyright owner as specified in the copyright notice associated with the article.