
Abstract
The article introduces the All Minorities at Risk (AMAR) data, a sample of socially recognized and salient ethnic groups. Fully coded for the forty core Minorities at Risk variables, this AMAR sample provides researchers with data for empirical analysis free from the selection issues known in the study of ethnic politics to date. We describe the distinct selection issues motivating the coding of the data with an emphasis on underexplored selection issues arising with truncation of ethnic group data, especially when moving between levels of data. We then describe our sampling technique and the resulting coded data. Next, we suggest some directions for the future study of ethnicity and conflict using our bias-corrected data. Our preliminary correlations suggest selection bias may have distorted our understanding about both group and country correlates of ethnic violence.
Selection issues continue to bedevil empirical studies of the correlates of ethnic identity. Building on the All Minorities at Risk (AMAR) population sampling frame of socially recognized and salient ethnic majorities and minorities (Birnir et al. 2015)—a comprehensive list of 1,202 ethnic groups, 911 more than the standard Minorities at Risk (MAR) data set—this article introduces the AMAR sample data. Fully coded for the forty core MAR variables, this sample allows researchers to address a disturbing but ubiquitous form of selection bias.
In this article, we first review common selection concerns in the study of ethnic conflict. We then describe an underexplored selection issue that arises with the truncation of data and presents special problems when moving between group- and country-level variables. We suggest that truncation is likely a common form of selection issue across current collections of data on ethnic groups. Next, we describe our sampling solution to selection issues in ethnic data and the resulting AMAR sample data, Phase I. To illustrate problems resulting from selection bias and to propose new directions for the future study of ethnicity using our bias-corrected data, we provide descriptive statistics relying on the newly coded sample. This will allow us to better estimate overall group propensity for ethnic violence and some of its commonly cited correlates including political, economic, and cultural grievances and group concentration. Finally, we address the problem of truncation in correlations between group conflict and country-level indicators including wealth and ethnolinguistic fractionalization (ELF). Our first-cut correlations suggest that there is ample reason for researchers to reexamine the purported correlates of ethnic conflict using our bias-corrected data.
Empirical Obstacles to Examining the Route to Ethnic War
In the study of ethnic conflict, selection issues are a recurring concern because the principal data used for empirical analysis, thus far, are based on the selection of groups that have already engaged with the state, as in the MAR data 1 and more recently, groups that are politically relevant, as in the ethnic power relations (EPRs) 2 data (Wimmer, Cederman, and Min 2009). Both data sets have been used to reveal patterns of conflict. But researchers need to be concerned about their sampling criterion and the conditions under which those patterns hold. Both sets of data can be used to examine trajectories of groups that fit their respective selection criteria. However, selection issues become problematic when we ask questions about what makes an ethnic group prone to violent conflict since both samples are selected on criteria that are likely to be correlated with a propensity for conflict. In such cases, selection bias likely presents a fundamental problem for drawing either descriptive or causal inferences from the data (Geddes 2003; Hug 2010; Shively, 2006; Weidman, 2016).
Established Selection Issues
There are many different types of selection biases and they cause distinct problems. One problem is that independent of concerns about estimating relationships between variables, much interest often centers on simple descriptive statistics about base rates in a population, which obviously cannot be estimated from a biased sample. It is likely, therefore, that we know less than we think about the prevalence of outcomes such as ethnic conflict.
A second selection concern focuses on detecting relationships between variables. As discussed extensively in the literature, when unrelated to the explanatory variable(s), selection on the dependent variable, possibly obscures a statistical effect where there really is one (Geddes 2003; Hug 2013; Shively 2006).
A third selection concern is related to reporting bias. In many cases, random reporting errors are merely noise. However, if some outcomes are systematically more likely to be reported erroneously, it becomes a selection issue. This type of reporting bias may affect both the magnitude and direction of a correlation between an independent and a dependent variable (Hug 2010; Weidman 2016).
Truncation of Group Data
A special class of selection concerns is the problem of data that is truncated by the units of analysis. In a systematically truncated data set, cases are dropped when their value on the dependent variable is correlated with their value on the hypothesized independent variable. Unlike instances of selection on the dependent variable, values in truncated data are included both where the outcome of interest occurs and does not occur but for a biased set of units. Furthermore, the dependent variable is not erroneously coded for some cases as in cases of reporting bias.
What is especially worrisome with ethnic data is that lacking a coherent sample frame (Birnir et al. 2015), data collection projects could be systematically truncating the data by being more attuned to more obscure ethnic groups in one country but less so in another. Indeed, researchers have limited their selection of group-level data by circumscribing the types of groups that are included, for example, by groups that are politically mobilized, discriminated against, or politically relevant, without estimating the implications of these selection criteria limitations for their statistical estimations.
For instance, if truncating ethnic data biases collections in favor of violent groups because violent groups are more likely mobilized, one effect is likely akin to a selection on the dependent variable, where we cannot get confident estimates of the causes of violence. Indeed, Hug (2013) makes the case that contrary to the null finding of Gurr and Moore (1997), grievances likely do affect group propensity for rebellion but this correlation is obscured in the data because of selection issues.
The effects of data truncation are of special interest in this article because in data on ethnic groups, this is likely a bigger problem than is reporting bias. Indeed, exploring group violence, Fearon (2003) found little evidence of reporting bias in the MAR data at least with respect to violent outcomes. Specifically, among the 539 groups not in MAR added by Fearon (2003), there were only eleven instances of rebellion between 1945 and 1998. 3 We are, therefore, confident that MAR captured nearly all groups that were at risk. However, as shown in Figure 1, when comparing MAR with the AMAR sample frame where groups were selected irrespective of any political criteria (Birnir et al. 2015), a high percentage of socially relevant AMAR groups is missing from the original MAR data, especially in some of the most heterogeneous countries in the world.

By country: Proportion of socially relevant groups in the All Minorities at Risk sample frame but missing from the Minorities at Risk data.
Truncation and estimates of average propensities
One of the potential problems resulting from truncation of group data (possibly also a problem in data suffering from reporting bias) that has not been widely explored in the literature is error in inference when moving between levels of data. Despite receiving little attention, this type of error is possibly a serious problem in the literature because many studies use biased (by way of truncation) aggregated group-level statistics to show correlations with a number of aggregate causal variables that do not vary within a country.
Specifically, the problem is that because of truncation (which limits the number of observations in the denominator), MAR and other data sets that select groups on some limited criteria provide an incorrect estimate of average group propensity to engage in outcomes such as violence, at levels more aggregated than the group, such as the country. If this limited ethnic group information is then regressed on measures that do not vary within the country but only between countries, the resulting association is not necessarily an accurate indicator of ethnic group propensity of engaging in the outcome of interest in a given country when compared to other countries. Instead, in many cases (at least where the total number of groups engaging in violence is high, but the true group proportion engaging in this activity is low), we will see positive correlations at the country level that henceforth have often been mistaken as indicators of group-level propensity to engage in violence in any country.
This problem is best demonstrated with an example, as illustrated in Table 1. Suppose that in two countries X and Y, there live 10 and 100 groups, respectively. Hypothetical-biased group-level data including information on all violent groups and some peaceful groups contains information on eight groups from country X, two of which are violent and information about twenty groups from country Y, ten of which are violent. The aggregate country-level measure of group violence in countries X and Y would then show that 25 percent and 50 percent of groups engage in violence, respectively.
Example: Truncation and Hidden Group Propensity for Violence.
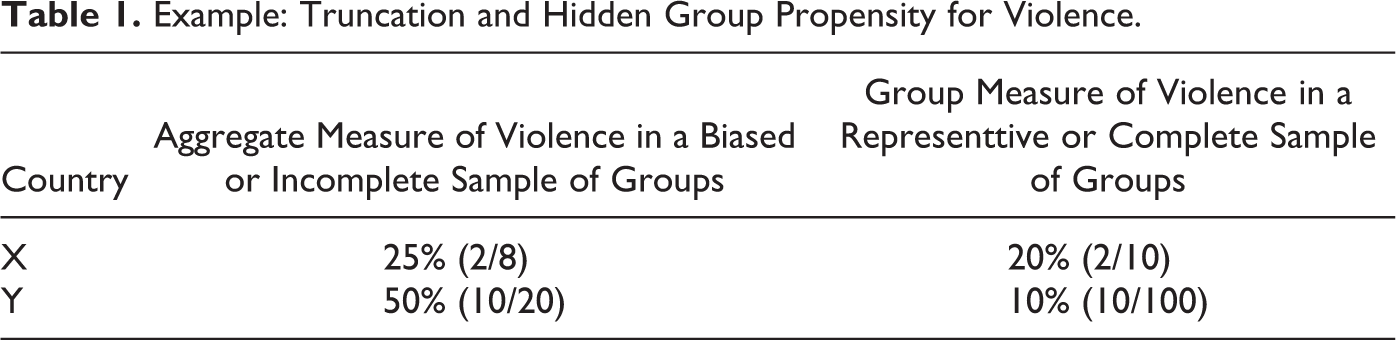
Suppose now that we were to collect information on the remaining two groups in country X and the remaining eighty groups in country Y and find that the remaining groups in both countries are peaceful. Calculating the proportion of violent groups in each country, we now find that 20 percent of all groups in country X engage in violence while only 10 percent of all groups in country Y ever engage in any violence. Consequently, while it is still true that country Y experiences greater levels of violence than country X, it is also true that any one group in country Y is less likely to engage in violence than is any one group in country X.
The problem of incorrect average propensities is not commonly discussed in the literature on ethnic conflict even though biased group data are often used to make inferences about group propensities. Consider examples of country-level measures that in the literature have been associated with group propensity to engage in violence. These include ethnic fractionalization measures (Reagan and Norton 2005; Olzak 2006; Taydas and Peksen 2013), measures of political institutions (Saideman et al. 2002; Alonso and Ruiz-Rufino 2007), and measures of country-level development (Cetinyan 2002; Walter 2006). While inferences have been made from these measures for group-level measures of violence, in all likelihood these studies are really measuring country-level probabilities of outcomes.
Truncation and group-level correlates
The above example suggests that truncation of group data may render estimates of average group-level propensities in association with country-level variables suspect. Furthermore, Figure 1 suggests the truncation of the MAR data is systematic with respect to at least group size and region. To better understand how systematic truncation affects correlations between explanatory and outcome variables measured at the group-level and especially whether the results of systematic truncation resemble results of systematic reporting bias, we constructed a generic simulation. The simulation systematically truncates data to drop more observations where the outcome did not occur in ways that are also related to the explanatory variable.
First, we create a data set with 1,000 observations. This data set has two variables, Conflict and Risk. Conflict is a binary variable with half of the cases coded as 0 and half as 1 (a mean of .5). Risk is normally distributed with a mean of 0 and a variance of 1. The two variables are not correlated. 4 In other words, both values of conflict are equally distributed across values of the risk variable, and the regression coefficient associated with the true value of the relationship between the two variables is approximately 0.
Next, we introduce systematic truncation that (a) increases in probability as the value of Risk increases (or decreases depending on the simulation) and (b) increases in probability when Conflict equals 0 versus when Conflict equals 1. For instance, when we focus on truncation for positive values of Risk, the sampling algorithm will drop more cases from the right tail of the Risk distribution when Conflict equals 0. In that scenario, we see the distribution of Risk scores for Conflict = 0 shifting slightly left, and the distribution of Risk scores for Conflict = 1 shifting slightly right. (For graphs of the shifting distribution of Conflict values, see Online Appendix.) Among the surviving cases, this induces a spurious positive relationship between Risk and Conflict. The same effect happens in reverse when focusing on systematic truncation for negative values of Risk.
Figure 2 demonstrates the shift in correlation coefficients between Risk and Conflict from the true coefficient of 0 (center line) for 1,000 simulations each, where the truncation systematically increased as values of Risk increased (right distribution) and where Risk decreased (left distribution) or occurred evenly across values of Risk (middle distribution).
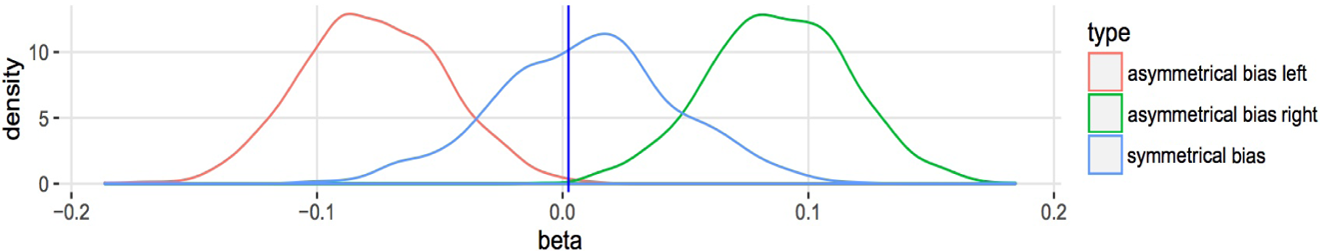
Shifts in coefficients from the true coefficient of 0 (center line) for systematic symmetrical and asymmetrical truncation.
In sum, our simulation suggests that estimates in systematically truncated data likely suffer from problems in estimating associations akin to problems in data with systematic reporting errors. Judging by the simulation, truncation of data is, therefore, a significant threat to the accuracy of inference using uncorrected data on ethnic groups.
The AMAR Data Sample
The primary objective of this article is to introduce our solution to the above problem of truncation in available data on ethnic groups. This solution is the unbiased AMAR sample data that researchers can use to estimate the effect of ethnic group attributes and activities on outcomes. To construct this new data sample, we build on the population of socially relevant ethnic groups that Birnir et al. (2015) outlined in their AMAR population sample frame. Importantly, while Birnir et al. (2015) supply the list of the population of groups 5 necessary to draw our unbiased sample, they do not draw a sample or code any variables for analysis. In this article, we introduce the coded sample variables along with the weights that researchers can use in their analysis of group correlates.
Before discussing the construction of the sample, it is important to clarify some terms:
AMAR sample frame refers to the population of 1,202 socially relevant ethnic majority and minority groups enumerated in Birnir et al. (2015).
6
For sampling purposes, this sample frame is akin to a census of socially relevant groups but does not contain any coded variables.
7
AMAR sample is the new bias-corrected data sample fully coded for all core MAR variables that we introduce in this article. This AMAR sample combines the two sample segments of 291 MAR groups, and 74 selection bias groups drawn from the NEW (not in MAR) part of the AMAR sample frame.
MAR data refer to the 288 original MAR groups (counted as 291 groups in the AMAR sample frame). In this article, MAR groups constitute sample segment I of the new AMAR sample data introduced in this article. The original MAR data were coded in four distinct phases. Researchers working with the data at any given time are likely to use the current cases only. Therefore, we also focus here on the core of cases that are current.
NEW refers to the 911 ethnic groups not coded in MAR (sample frame 1,202 − 291 MAR = 911 NEW) but accounted for in the Birnir et al.’s (2015) AMAR sample frame.
Selection bias groups constitute AMAR sample segment II and are comprised of seventy-four groups drawn from NEW and coded for all core MAR variables for the project presented in this article. So as not to replicate in the selection bias sample segment the known regional and population biases in MAR (see Figure 1), we used a three-tiered population strata of small, medium, and large groups in each region to stratify NEW.
8
Using this stratification, we then randomly drew a number of selection bias sample groups from each stratum in concordance with the proportion of groups in that stratum in NEW, for a total of 100 groups. Funding constraints limited the coding of the total number of groups to 74. When compared to the known proportions of groups across regions in NEW, the coded numbers of groups are high from Asian and low from Europe. This known under- and overregional sampling is corrected by weighting as explained in the following section on sample correction. (For tables showing the full distribution of cases at each stage of sampling, see Online Appendix.)
Figure 3 illustrates inter alia where MAR and our seventy-four new selection bias groups (together constituting the AMAR sample) fit into the AMAR sample frame (Birnir et al. 2015), 9 which in turn, is a subset of ethnic structure (Chandra and Wilkinson 2008). 10

The All Minorities at Risk data sample.
Sample Correction
When two sample segments are analyzed together to produce descriptive or inferential statistics for the population parameter of interest, each sample segment (here MAR and selection bias, alternatively males and females or any other category) can be assigned weights according to their relative importance in the population, when a pertinent sample frame is available. Weighting is common in survey analysis, where sample segments often over- or underrepresent particular population segments (Kalton 1983; Kalton and Flores-Cervantes 2003; American National Election Studies 2017; Chromy and Abeyasekera 2005; Stoop et al. 2010). We follow the common strategy of defining weights as the inversed sampling probability of an individual observation
Furthermore, because individual observations in each sample segment (MAR or selection bias) and within each stratum in the selection bias segment (population and region) have unequal probabilities of being selected into the sample, our weights account separately for the probability of individual selection in each sample segment and when relevant in each stratum. In sum, therefore, the weight for each observation is defined as the inverse sampling probability of an individual observation
The obvious question is how well the weighted sample captures reality, assuming the sample frame is reasonably accurate. To explore this issue, we collected every group’s numerical proportion (gpro) of the population for the entire AMAR sample frame (i.e., the entire set of 1,202 groups). Thus, we can calculate the true average group proportion in the sample frame. For example, in the following analysis, we focus on political minorities, excluding politically dominant groups 11 where there is a single dominant group in a country. Excluding sole politically dominant groups (which leaves 1,085 groups), the average population proportion of socially relevant groups is 6.70 percent. In the MAR data, the average group proportion of the population excluding dominant groups in countries where there is a single dominant group is 11.2 percent. In contrast, the weighted estimate of minority group proportion in the AMAR sample is 7.6 percent, which approximates the full set of cases. 12
The Data
In sum, the new data presented in this article consists of three parts, the first two comprise the AMAR sample data, sample segments I and II. The first of these, sample segment I, is the integrated and cleaned classic MAR data. Sample segment II is the seventy-four selection bias groups randomly selected in a stratified sample from the NEW part of the AMAR sample frame. These are fully coded for all current MAR variables and integrated with the original MAR data along with inverse probability weights for each sample segment. The third part of the data is the coding of classificatory and analytical variables for the entire AMAR sample frame to facilitate further examination of selection issues and to allow researchers to move between data sets. We discuss each in turn below.
Original MAR Integration
In 2006, after a review of the approximately 400 variables that had been part of the various phases of the MAR project since its inception in the 1980s, a total of 71 variables were selected as being core variables for Phase V of the MAR data collection. Of the core variables, some were then reformulated to facilitate either collection or statistical analysis of the data. While this review and reformulation brought the data in line with current research interests in the field, the variables that were reformulated for Phase V data were not reconciled with earlier phases. Consequently, for the reformulated variables, the two parts of the data (before and after 2004) could not be used together. As a part of the AMAR project, we reconciled most of the reformulated variables from the various phases of the MAR data collection into one data-set, creating variables that are continuously coded across the distinct phases of the MAR project.
In addition, as a part of AMAR Phase I, we systematized and integrated extant community input into the MAR data that was accumulated over the past two decades. The community input we incorporated is of two kinds. The first consists of recode requests documented over many years, and the second are discrete variables that were coded and/or updated by scholars who were intimately familiar with the project and undertook independent data collections in line with MAR protocols. All of this work is detailed in the new codebook accompanying the data, including also the code for reconciliation of the various MAR Phases.
The Seventy-four Selection Bias Groups Coded for All Core MAR Variables
As noted, 74 groups out of the over 900 NEW AMAR groups not in MAR were randomly selected and coded annually from 1980 to 2006 for 40 of the most commonly used variables in the MAR data. For a list of the groups, see Online Appendix Table A6.
The coded variables are of four types and fully described in the AMAR Phase I codebook. The first category is a suite of group characteristics including group identity and group concentration. The second category is a group status suite including variables accounting for autonomy and group grievances. The third suite of variables accounts for external support by state and nonstate actors. The fourth suite accounts for group conflict behavior and state repression. For a brief description of the variables, see Online Appendix Table A6. Detailed information is also included in the new AMAR Phase I codebook.
AMAR Sample Frame Variables Coded
The final data contribution of this project consists of new AMAR variables that we coded for the entire AMAR sample frame of 1,202 groups. These are of three kinds. The first set identifies the group and consists of variables already present in the MAR data that were expanded to account for all AMAR groups, such as group proportion of the population. The second set of variables is classificatory, including group identifiers. The third set of AMAR variables is functional and is intended to facilitate further analysis of the sample in relation to the sample frame and to encourage analysis using data across data sets. Specifically, to this end, we have included variables that link the AMAR data with the EPR (Wimmer et al. 2009) and earlier data collections by Fearon (2003) and Alesina et al. (2003). For a brief description of these variables, see Online Appendix Table A8.
Future Directions for Research: Frequency and Causes of Ethnic Rebellion
Until now, we have not had a good idea of either the frequency of ethnic violence against the state or its reported causes because we lacked a representative sample of ethnic groups to study. Having such a coded sample, we are now able to demonstrate descriptively that previous answers have been systematically biased. Indeed, the problem of truncation hiding true group propensity by systematically reducing the number of certain groups in the denominator and the sensitivity of coefficients and standard errors in the simulation using truncated data both indicate there is good reason to revisit purported correlates of ethnic politics. Here we suggest some directions forward that can hopefully motivate future research.
Frequency of Ethnic Rebellion
Table 2 compares the frequency of ethnic minority violence as recorded in the uncorrected MAR sample segment (first column) to (second column) the corrected weighted AMAR sample data (including the weighted MAR and selection bias segments). The variables listed are any rebellion 13 against the state (coded as 1 if the group has engaged in any rebellion against the state since 1945 or 1980 and 0 otherwise), high levels of rebellion against the state (coded as 1 if the group has engaged in small scale guerrilla activity with a coding of 4 or greater for level of rebellion since 1945 or 1980 and 0 otherwise), the average level of group violence since 1945 or since 1980, and the highest level of ethnic violence by the group since 1945 or since 1980.
Comparing the Share of Groups That Have Engaged in Violence Against the State, MAR, and the Weighted AMAR Sample (MAR + Selection Bias Weighted).
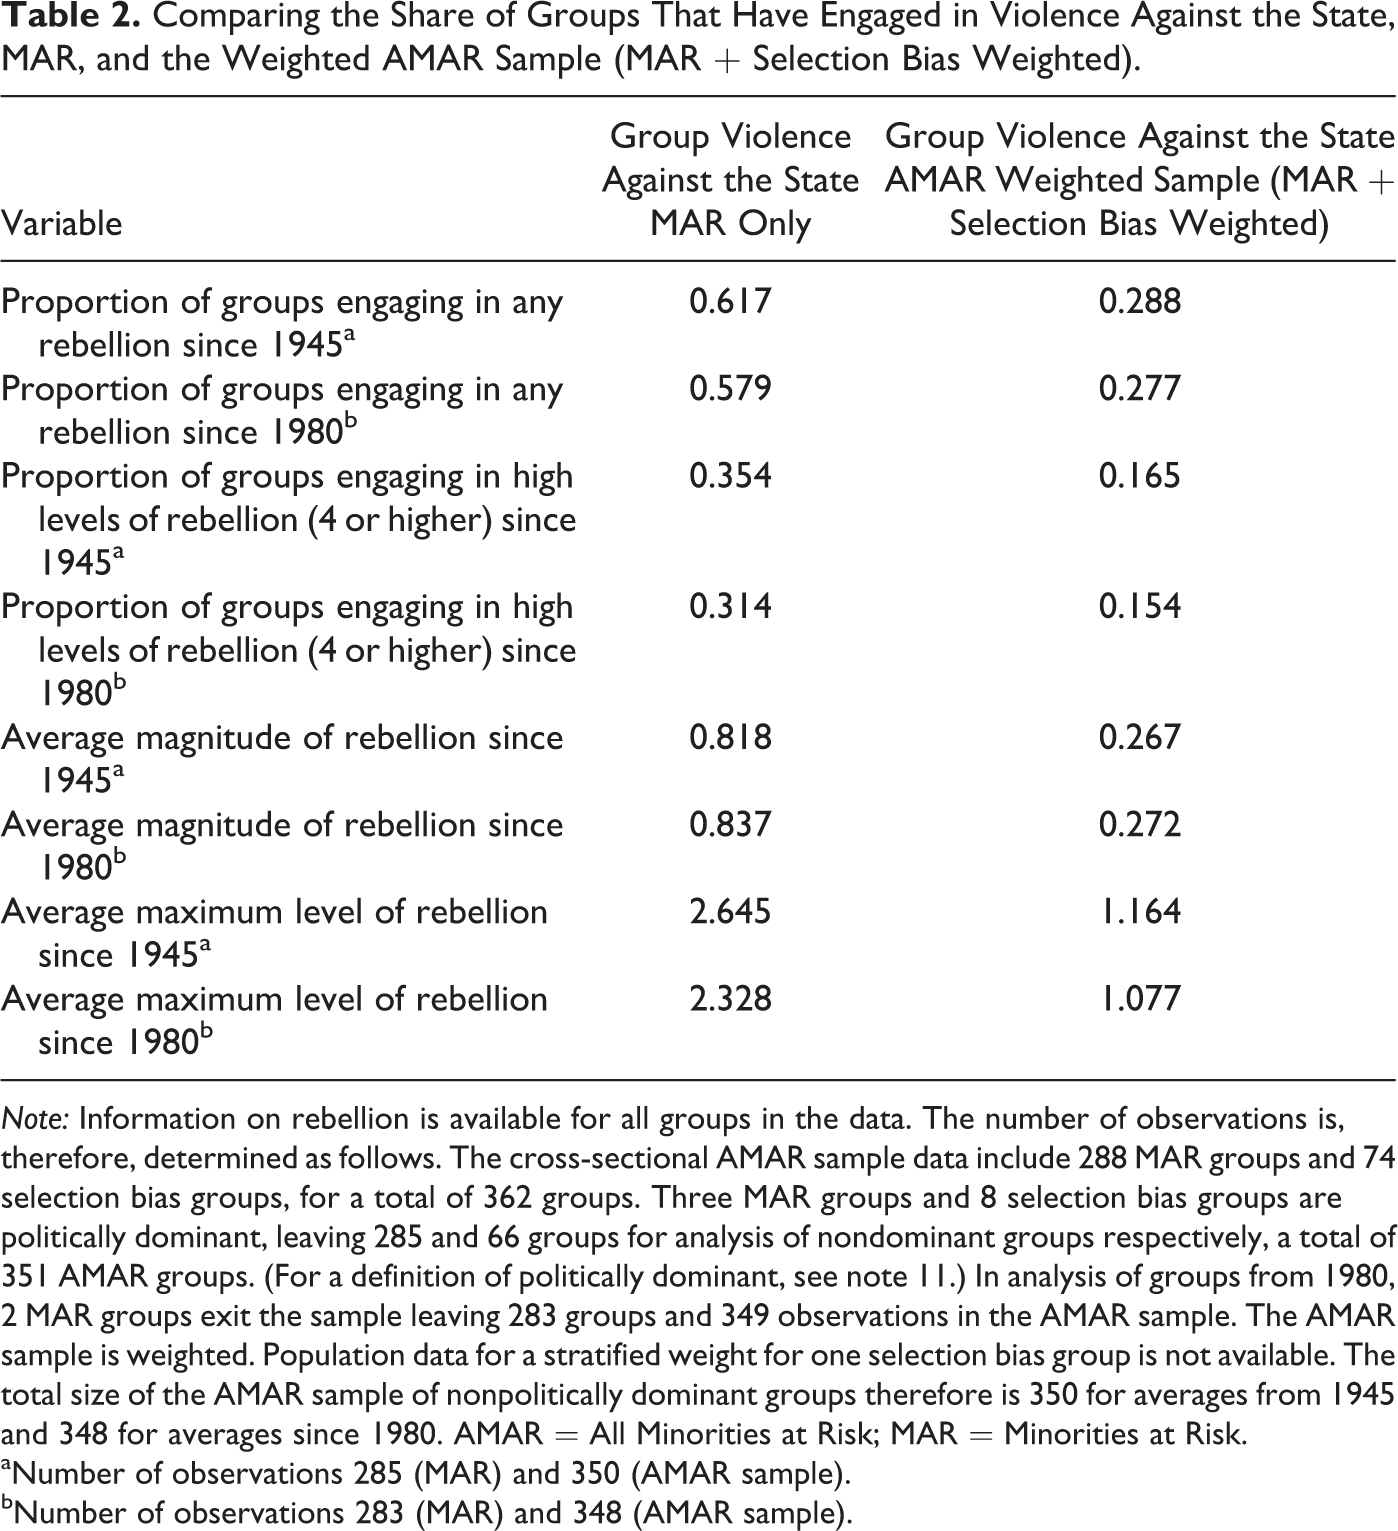
Note: Information on rebellion is available for all groups in the data. The number of observations is, therefore, determined as follows. The cross-sectional AMAR sample data include 288 MAR groups and 74 selection bias groups, for a total of 362 groups. Three MAR groups and 8 selection bias groups are politically dominant, leaving 285 and 66 groups for analysis of nondominant groups respectively, a total of 351 AMAR groups. (For a definition of politically dominant, see note 11.) In analysis of groups from 1980, 2 MAR groups exit the sample leaving 283 groups and 349 observations in the AMAR sample. The AMAR sample is weighted. Population data for a stratified weight for one selection bias group is not available. The total size of the AMAR sample of nonpolitically dominant groups therefore is 350 for averages from 1945 and 348 for averages since 1980. AMAR = All Minorities at Risk; MAR = Minorities at Risk.
aNumber of observations 285 (MAR) and 350 (AMAR sample).
bNumber of observations 283 (MAR) and 348 (AMAR sample).
The more representative AMAR sample (excluding dominant ethnic groups that control the government and are considered to be the state from calculations of minority rebellion against the state) shows that ethnic group rebellion against the state is far rarer than what one would infer from the truncated MAR data. Specifically, when coded as a binary variable to account for any instances of rebellion (including all types of rebellion from the lowest level to ethnic war), the MAR data suggest that two-thirds of all minority groups have at some point since 1945 engaged in violence against the state. In contrast, the weighted average rebellion in the AMAR sample suggests that this number is far lower, at 29 percent of all widely recognized groups having ever engaged in rebellion against the state. The MAR data suggest that well over a third of all ethnic groups have engaged in high levels of ethnic rebellion whereas the corrected AMAR data suggest that number is below 17 percent. The MAR data suggest that the average magnitude of rebellion is low, with the vast majority of groups that do engage in rebellion only perpetrating very low levels of violence. The AMAR sample suggests that the average magnitude of rebellion is lower still. The same is true for average group maximum levels of rebellion: the AMAR sample averages are less than half of MAR averages.
Ethnic contentious outcomes are only a few of the variables coded in the AMAR sample. The core MAR variables thought to influence ethnic behavior are also coded. In the literature, some of the more prominent purported causes of ethnic mobilization include ethnic group geographic concentration and grievances. Table 3 compares the average level of political, economic, and cultural grievances (Polgr, Ecgr, and Culgr) expressed by an ethnic group as recorded in MAR and in the weighted AMAR sample, respectively, in addition to group geographic concentration (Groupcon). The variables range from 0 constituting no grievance expressed and groups that are widely dispersed to 2 or 3, denoting the most concentrated groups and highest level of grievances expressed by the group. 14 The table clearly shows that when comparing MAR to the AMAR weighted sample (MAR + selection bias, weighted), the average level of grievances expressed is substantially lower than previously thought across all grievance types, but groups tend to be more concentrated than previously thought.
Comparing the Average Grievances and Group Concentration of Groups in MAR and the Weighted AMAR Sample (MAR + Selection Bias).

Note: Information on grievances is coded for 283 nonpolitically dominant MAR groups decreasing the total number of observations to 283 and 348 for MAR and the AMAR sample, respectively. Group concentration measures are missing for seven selection bias groups decreasing the number of observations for the AMAR sample from 350 to 343. AMAR = All Minorities at Risk; MAR = Minorities at Risk.
aNumber of observations 283 (MAR) and 348 (AMAR).
bNumber of observations 285 (MAR) and 343 (AMAR).
In sum, our comparisons suggest that both the frequency of the combativeness of ethnic groups and at least some of the causes thought to induce conflict are exaggerated in the literature to date as a result of selection issues—notably, the previously underexplored issue of truncation—in the uncorrected data set. While many scholars assumed this to be the case, our AMAR sample data (MAR + selection bias, weighted) allow us to estimate the degree of bias in past reckonings and to better estimate correct levels of conflict outcomes and their purported causes.
Correlates of Group-level Data
The simulation showed that systematic truncation of data renders estimates of coefficient and standard errors unreliable in ways that resemble problems demonstrably associated with systematic errors in reporting and/or coding of the dependent variable. Specifically, if units with certain values on the outcome variable are systematically excluded (truncated) in relation to the explanatory variable, this would render suspect the purported relationships between any independent and dependent variables in our data. To examine this problem with real data, Table 4 compares simple correlations between the biased MAR group-level data and the corrected weighted AMAR sample (MAR + selection bias, weighted) for some commonly hypothesized group-level correlates of ethnic minority rebellion. Specifically, we ran bivariate regressions on cross-sectional group-level data, with standard errors clustered at the country level. The regressions correlate political, economic, and cultural grievances and a measure of group concentration to various measures of violence. Table 4 substantiates the concern that researchers have incorrectly estimated relationships. Nearly all of the associations show a substantial difference in the magnitudes of the effects estimated with the biased MAR sample as compared with the weighted AMAR sample when group concentration, political, economic, and cultural grievances are correlated with a set of rebellion measures. Furthermore, in most of the MAR sample, neither economic grievances nor cultural grievances are significantly correlated with outcomes whereas the corrected AMAR sample demonstrates a significant correlation with both economic and cultural grievances for all the rebellion measures. Group concentration, in turn, is not as clearly a substantial driver of high-level conflict in the corrected sample as the original MAR data would suggest. While the robustness of these suggested new relationships need to be tested much more rigorously, the concern about truncation distorting relationships as suggested by the simulation is well founded.
Reestimating Group-level Correlates of Conflict Onsets. Bivariate Regressions, Standard Errors Clustered on Country.
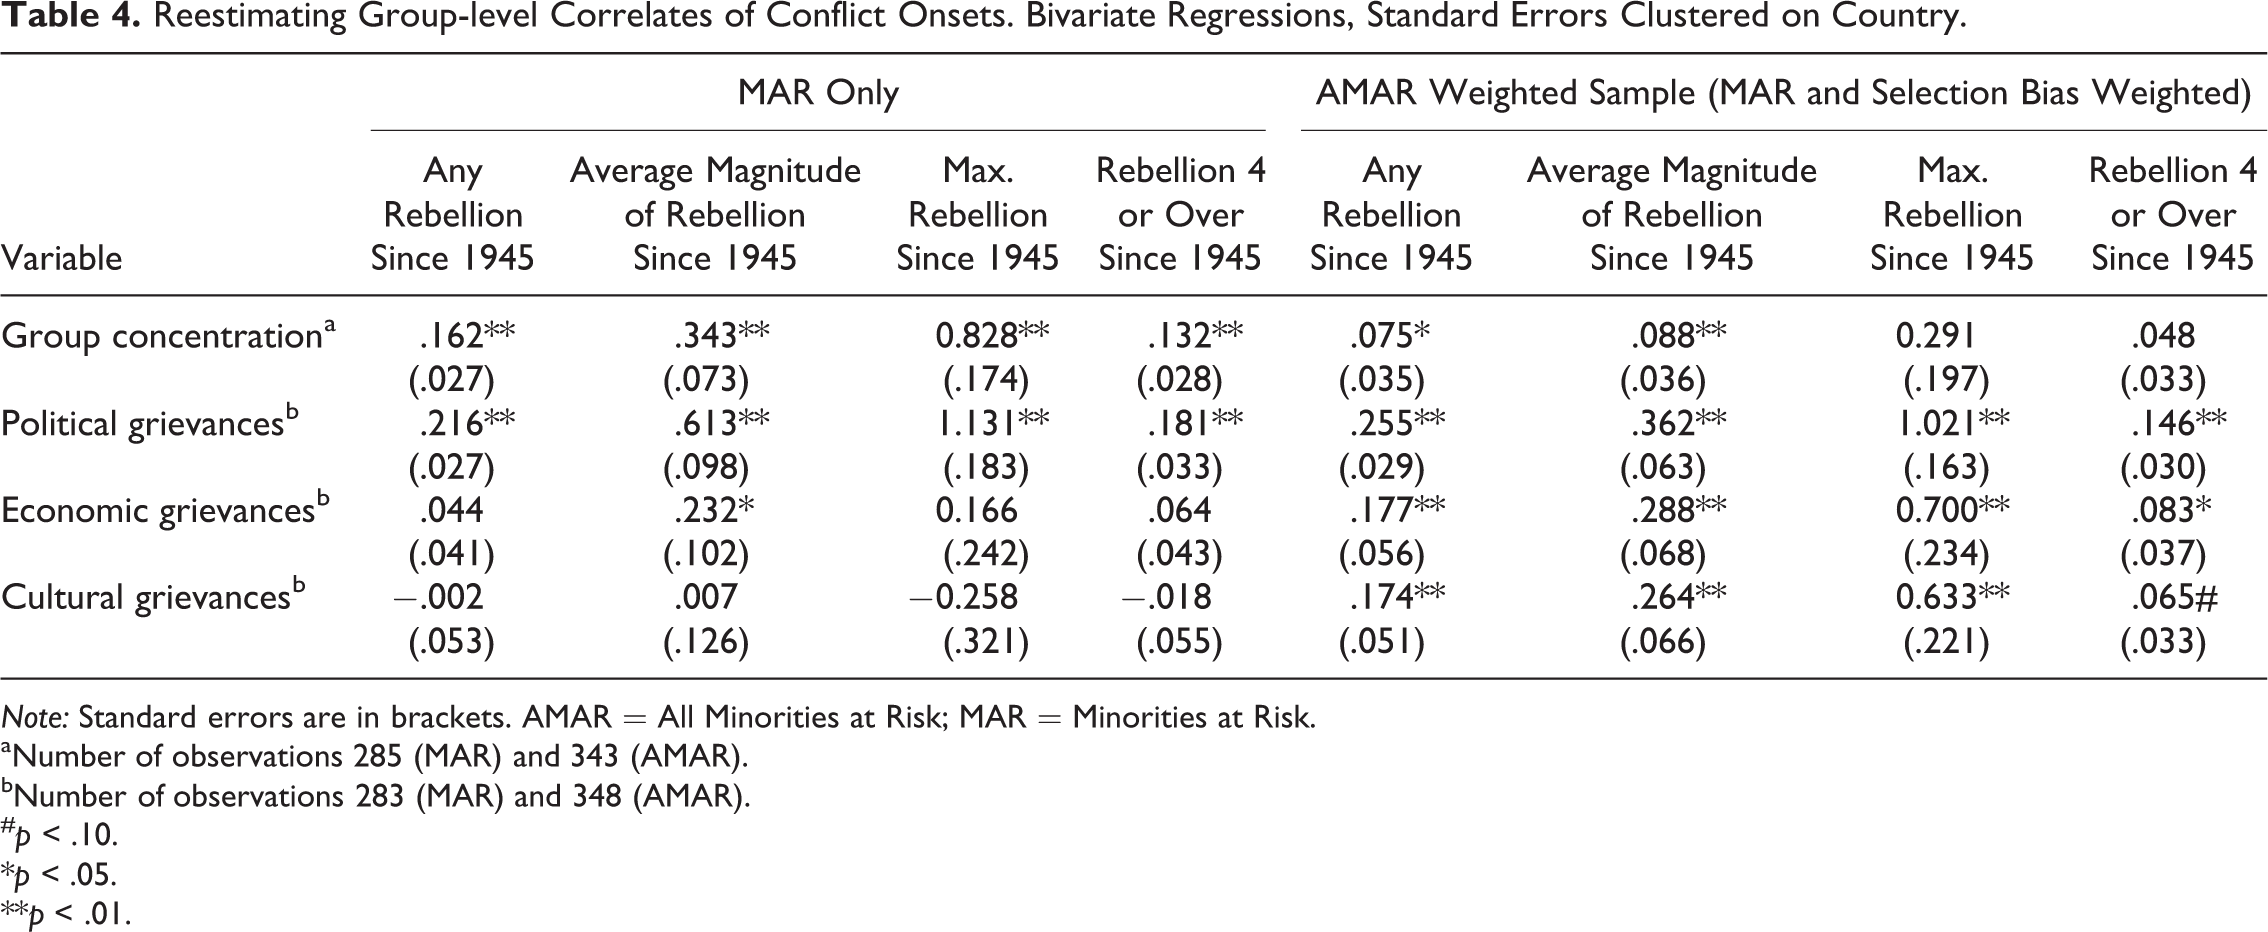
Note: Standard errors are in brackets. AMAR = All Minorities at Risk; MAR = Minorities at Risk.
aNumber of observations 285 (MAR) and 343 (AMAR).
bNumber of observations 283 (MAR) and 348 (AMAR).
# p < .10.
*p < .05.
**p < .01.
Correlating Group- and Country-level Data
The simulation suggested that systematic truncation of data renders estimates of relationships between suggested causal and outcome variables at the group level unreliable. The above associations that juxtapose correlations between variables in MAR group-level data with correlations in the corrected AMAR sample suggest this is possibly a problem in extant analysis.
A separate problem resulting from truncation surfaces in analysis that combines data at different levels where average propensities of disaggregated but truncated data are correlated with aggregate-level data. In sum, truncation possibly hides true average group propensities because it decreases the true number of groups in the denominator. The concern raised in this article, therefore, is that of erroneous inferences from country-level data correlated with truncated group-level data that is assumed to correctly represent country group average propensities. One such debated relationship is the correlation between ethnic heterogeneity and minority rebellion against the state. Ethnic diversity is often considered a country-level attribute associated with violence and state deterioration (Chandra 2012). Following Fearon and Latin’s (2003) suggestion that ethnic fractionalization is not a reliable predictor of ethnic conflict, the measure is often included as a control variable in studies of conflict. However, the effect is sometimes shown to be positively and significantly related to conflict onset (Taydas and Peksen 2013; Gates et al. 2016). Others suggest a positive association between a fractionalization measure of politically relevant groups and civil conflict in oil abundant countries (Wegenast and Basedau 2013).
In Table 5, we look at the simple bivariate regressions, with standard errors clustered on country, between the measure of ELF (ELF is static at the country level) and rebellion for MAR groups only. It is easy to see why the literature thus far often associates ethnic heterogeneity with violence. The first column of Table 5 accounts for the substantial and significant association in the MAR data between ELF and every indicator of rebellion. In contrast, the second column correlates minority violence against the state with ELF in the weighted AMAR sample (MAR + selection bias, weighted). The magnitudes of every coefficient are drastically reduced and none are significant.
Comparing the Bivariate Association between Ethnic Fractionalization (ELF) and Violence in MAR and the Weighted AMAR Sample.

Note: Standard errors are in brackets. ELF = Ethnolinguistic Fractionalization; AMAR = All Minorities at Risk; MAR = Minorities at Risk.
Number of observations 285 (MAR) and 350 (AMAR sample).
#p < .10.
*p < .05.
**p < .01.
Assertions about the detrimental effect of ethnic heterogeneity on group propensity to commit violence are, if these relationships hold up to econometric scrutiny, substantially exaggerated. The reason for the difference between the results obtained with the unweighted MAR data and the weighted AMAR sample is likely that the truncation of the MAR data (or any other truncated group level data) is systematically related to heterogeneity. Where there are more groups, more are on average missed, especially if they are peaceful. Hence, the positive correlation between heterogeneity and conflict is likely correct at the country level. 15 Countries with more groups may see violence more often. At the group level, however, violence is not more likely because the high likelihood of violence in the country is not a good predictor of any particular group involvement in violence, especially when there are many groups.
Another way to think about this is that because rebellious groups (that tend to come from heterogeneous countries) are overrepresented in MAR, the first set of correlations estimates the likelihood of rebellion occurring in a given country rather than the association between heterogeneity and the likelihood of any group engaging in rebellion. But now we add in the selection bias sample segment (in which there are more peaceful groups often in high conflict heterogeneous countries) to the MAR sample segment for the full AMAR sample. We then weight the groups in proportion to their weight in the AMAR sample frame. And as we suspected, the correlation between ethnic fragmentation, rebellion onset, and average rebellion that appears present in MAR vanishes for all of our indicators.
Another well-known conundrum in the literature is the apparent relationship between development and violence. Because rebellion is relatively more common in the developing world, some hold that poverty causes rebellion. A common retort is that groups need resources to rebel; thus, poor groups should be less likely to engage in violence. We suspect that both perspectives are right. Poverty is likely a grievance, but one that only a few groups can act upon. Thus, developing countries should experience greater levels of violence overall (if only due to state weakness in deterring rebellion), but fewer groups in any given developing country should have the resources to rebel.
Consequently, we would expect a country-level association between poverty and aggregate measures of rebellion. However, when accounting for the probability that any particular group will rebel, we would expect this association to be reduced. To examine this expectation, Table 6 shows Penn World Table’s measures of logged gross domestic product per capita correlated (through bivariate regressions clustered on country) with a number of measures of rebellion: whether a group has ever engaged in rebellion, average levels of rebellion, maximum levels of group rebellion, and rebellion by groups engaged in high-level conflict only.
Comparing the Bivariate Associations between the Log of GDP Per Capita and Violence in MAR and the Weighted AMAR Sample.
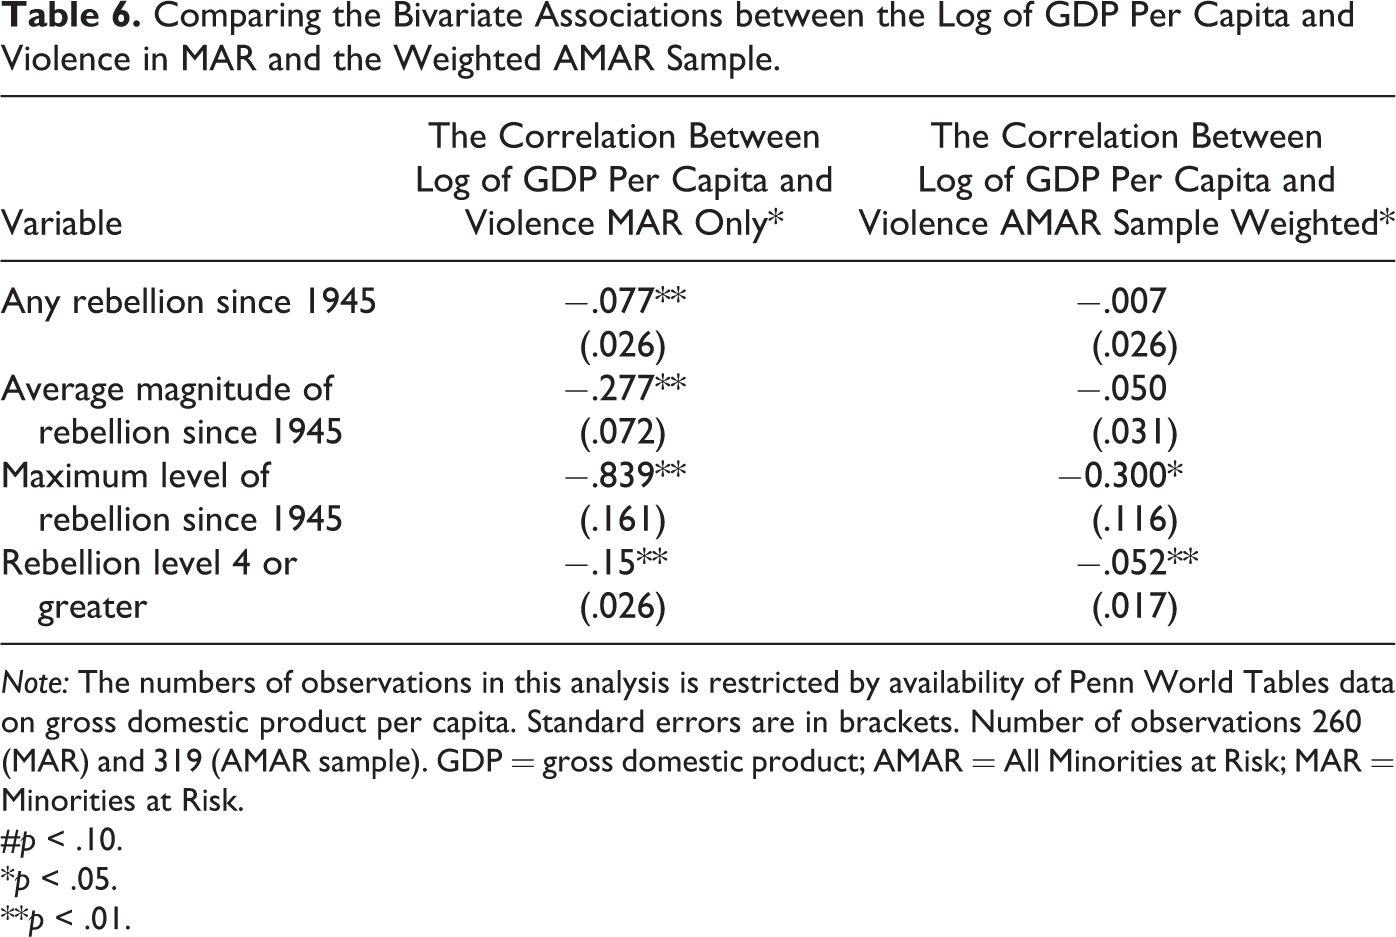
Note: The numbers of observations in this analysis is restricted by availability of Penn World Tables data on gross domestic product per capita. Standard errors are in brackets. Number of observations 260 (MAR) and 319 (AMAR sample). GDP = gross domestic product; AMAR = All Minorities at Risk; MAR = Minorities at Risk.
#p < .10.
*p < .05.
**p < .01.
From these data, we see that the more limited MAR data account for something akin to country-level characteristics of how often violence has occurred. This is opposed to group-level propensities for groups engaging in violence. This suggests that the occurrence of ethnic rebellion, average ethnic rebellion, and maximum levels of violence are all negatively related to a country’s wealth. Overall, poorer countries are more likely to experience rebellion. In contrast, the group-level AMAR data, accurately accounting for group propensity to engage in violence, suggest that very few poor groups have the opportunity to act upon their grievances. Thus, poorer groups seem no more likely to be embroiled in a rebellion than are their counterparts in wealthier countries. However, the correlations also suggest that when groups in poor countries engage in violence, this violence is more likely to spiral into an all-out war, possibly because once the resource costs of starting a rebellion have been overcome, the opportunity costs associated with an all-out war are likely lower in a poor country than in one that is rich. While the robustness of these correlations needs to be subjected to further analysis, the reliance on country level analysis to estimate group-level effects is clearly problematic with truncated data.
Discussion and Conclusions
This article introduces the AMAR sample data of socially recognized and salient ethnic groups, fully coded for the forty most commonly used MAR variables. This sample provides researchers with bias-corrected data for empirical analysis of the correlates of ethnic politics. The data accompanying this article include the weights to be used in the analysis and supporting materials that allow researchers to examine for themselves the validity of the sample.
Our work to produce these data is motivated by ongoing concerns about selection issues in the study of ethnic conflict. In particular, we highlight some underexplored selection issues that arise with truncation of ethnic group data, especially when moving between country- and group-level variables. The article described our sampling solution that resulted in the AMAR sample data Phase I.
With the new weighted sample, we provided illustrative correlations between group violence and some prominent group-level and country-level variables that have been proposed as causes of ethnic violence, including political, economic, and cultural grievances, group concentration, wealth, and ELF. The first-cut results suggest that selection bias may have distorted our estimates of the correlates of ethnic violence.
All of the above are only preliminary cross-sectional correlations that need to be examined further and in longitudinal analysis. However, our probing of the data suggests that when examining the group-level correlates of ethnic conflict and especially when combining country- and group-level data, researchers would do well to work with an unbiased group-level sample to accurately reflect average group-level propensities. Furthermore, because cross-level interactions may result in divergent outcomes for different groups (as suggested by the debate in the literature on the relationship between wealth and rebellion), multilevel regression models might be a more appropriate tool for analysis of multilevel relationships. Space constraints do not permit us to pursue that type of analysis here, but we suggest that this is a fruitful venue for further study.
For sampling purposes and with respect to answering questions about the causes of political mobilization and violence, we contend that the AMAR framework is a substantial improvement over both MAR proper and other more recent collections. For example, while EPR improves upon the original MAR, it is subject to the same criticism regarding the limitations of the types of groups that are included. Thus, while the EPR framework can be used to test theories about the trajectories of ethnic groups that already are mobilized (or politically relevant), like MAR it cannot be reliably used to identify the conditions under which groups become politically relevant or targeted ab initio. The AMAR sample frame does not include any politically relevant criteria for inclusion of an ethnic group in the data. Consequently, some of the ethnic groups in the AMAR sample data will be politically relevant and some will not. This is especially important when attempting to sort out the effects of variables related to the selection criteria of either MAR or EPR.
In conclusion, ethnic violence has and continues to cause a great deal of pain and suffering; this much is true. The idea, however, that ethnic groups are inherently violent and that ethnic heterogeneity is necessarily problematic for national peace is not substantiated. There are many more peaceful ethnic groups in the world than there are violent ones, and ethnic heterogeneity is not as clearly a factor in raising the propensity for a minority group to rebel against its state as has been previously estimated. We suggest in this article that one reason for misperceptions is the lack of a representative sample of ethnic groups. In particular, we highlight problems in inference when truncated group data are erroneously used to generalize about probable group behavior. With the AMAR sample data correction, the research community can now, with less worry about selection bias, set about to identify the causes of ethnic violence, a phenomenon less ubiquitous than previously thought but no less terrifying.
Footnotes
Authors’ Note
Parts of this work have been presented at the UCLA Workshop on Ethnicity Data Sets, the Stanford IR Workshop, the Maryland Comparative Workshop, the Uppsala Workshop on Ethnic Conflict Data, the Folke Bernadotte and Penn State University Conflict Data Workshops, and the Ethnicity and Diversity workshop at the Carlos III-Juan March Institute.
Acknowledgments
We thank workshop participants for helpful comments and suggestions. We are especially grateful for James D. Fearon’s extensive input and the helpful comments of two anonymous reviewers. We also thank Dawn Brancati and Steve M. Saideman for helpful input throughout the duration of the project.
Declaration of Conflicting Interests
The author(s) declared no potential conflicts of interest with respect to the research, authorship, and/or publication of this article.
Funding
The author(s) disclosed receipt of the following financial support for the research, authorship, and/or publication of this article: The research for this article was funded by NSF, Grant No. SES0718957 Minorities at Risk: Addressing Selection Bias Issues and Group Inclusion Criteria for Ethno-Political Research.
Supplemental Material
Supplementary material is available for this article online.
Notes
References
Supplementary Material
Please find the following supplemental material available below.
For Open Access articles published under a Creative Commons License, all supplemental material carries the same license as the article it is associated with.
For non-Open Access articles published, all supplemental material carries a non-exclusive license, and permission requests for re-use of supplemental material or any part of supplemental material shall be sent directly to the copyright owner as specified in the copyright notice associated with the article.