
Abstract
Some theories predict that profits facilitate peace in illegal markets, while others predict that profits fuel violence. I provide empirical evidence from drug trafficking in Venezuela. Using original data, I compare lethal violence trends in municipalities near a major trafficking route to trends elsewhere, both before and after counternarcotics policy in neighboring Colombia increased the use of Venezuelan transport routes. For thirty years prior to this policy change, lethal violence trends were similar; afterward, outcomes diverged: violence increased more along the trafficking route than elsewhere. Together with qualitative accounts, these findings illuminate the conditions under which profits fuel violence in illegal markets.
Introduction
Life without property rights seldom devolves into war of all against all. In medieval England, for example, rural landholders often farmed in peace, without centralized enforcement of land claims (Bates et al. 2002, 601–02). In one swath of Sri Lankan rice fields in the early 1980s, farmers co-managed an irrigation system with minimal violent conflict (Ostrom 1990, 170). In colonial South America, smugglers rarely killed each other, although they could not appeal disputes to the Crown (Grahn 1997).
Even in today’s notoriously violent illegal drug markets—the subject of this article—traffickers sometimes find nonviolent ways to do business, notwithstanding the fact that they cannot take each other to court (e.g., Duran-Martinez 2015b, 1378). Researchers have studied this variation, asking why violence in illegal markets is common but inconstant. Part of the answer is well understood. Violence generally rises with the number of competing traffickers (Castillo and Kronick Forthcoming; Calderón et al. 2015, 1472–74) and with unconditional government crackdowns (Lessing 2018).
But one key determinant of conflict—the magnitude of the contested profits—is the subject of debate. Some theories predict that booms in illegal markets facilitate peace, while others predict that booms fuel violence. There is qualitative evidence on both sides (e.g., Duran-Martinez 2015a, 123; 2015b, 1393–96). As Lessing (2018) summarized, on the one hand, “the larger the pie, the more there is to fight over;” on the other, “lower profits make for more vicious competition and less pacting among [drug] cartels” (p. 23). How violence responds to profits in illegal markets thus remains an empirical question.
In this article, I find that the growth of illegal drug trafficking increased lethal violence in Venezuela. Using an original data set constructed from Ministry of Health records, I compare lethal violence trends in Venezuelan municipalities near a major trafficking route, the Panamerican Highway, to trends in other municipalities, both before and after 1989, when counternarcotics operations in neighboring Colombia increased the use of Venezuelan transport routes.
I find that, for thirty years prior to 1989, violent death rates and trends were nearly identical in these two groups of municipalities. After 1989, the trends and rates diverged: violence increased more in municipalities along the Panamerican Highway (
Together with qualitative accounts, I interpret this result as evidence that the trafficking boom—rather than some other concurrent event—drove the divergence in violent death rates. Shifts in the age distribution of victims and placebo tests are consistent with this interpretation. For example, I find no difference-in-differences in infant death rates, an outcome unlikely to have been affected by trafficking-related violence but plausibly affected by economic conditions that, had they changed differentially across groups, might account for the divergence in violent death rates. Moreover, as I discuss below, trafficking along the Panamericana predated 1989; what changed was not the presence of traffickers but rather their profits.
While trafficking profits are unobservable, I draw on newspaper articles, Venezuelan sociological literature, and interviews with government officials to describe two links between the trafficking boom and trafficking profits. First, because Colombia’s crackdown increased demand for Venezuelan trafficking routes, it raised the fees paid by international drug cartels to locals who controlled those routes; the Context and Discussion sections present examples of the associated violent conflict. Second, these fees were sometimes paid in kind—that is, in illicit drugs—and then sold to consumers within Venezuela; the consequent “increase in microtrafficking has been a major contributor to homicide rates” (International Crisis Group [ICG] 2011).
These sources also suggest why the Venezuelan case appears more consistent with models in which trafficking profits fuel violence than with models in which profits facilitate peace. Uncertainty about Colombian policy or Venezuelan government responses might have led traffickers to expect that the boom would be short-lived. And relative to, say, the Mexican trafficking industry in the 1990s, the Venezuelan business was much more fragmented; fragmentation generally hampers peaceful pacts among traffickers (Castillo and Kronick Forthcoming). I consider these and other potential mechanisms in the Discussion section.
These findings contribute to the empirical literature on violence in illegal markets (e.g., Dube et al. 2016; Dell 2015; Chimeli and Soares 2017; Mejia and Restrepo 2011; Owens 2014; Adda et al. 2014). The Venezuelan setting provides a number of inferential advantages. First, conflict did not predate the growth of the trafficking market (as it did in, e.g., Colombia); lethal violence was no more prevalent in Venezuela than in the United States in the 1980s. This makes the Venezuelan case more relevant for the many countries without recent epidemics of lethal violence. Second, the growth in trafficking in Venezuela did not coincide with major, unobserved shifts in domestic security policy (as it did in Mexico). 1 Moreover, relative to these cases (Colombia, Mexico) and others (such as Brazil), violence in Venezuela is poorly understood. To the best of my knowledge, this is the first empirical study of Venezuelan violence to exploit a long panel of municipal-level data.
The results also speak to research on the determinants of violence in Latin America. The Venezuelan case provides little support for the notion that demographic trends (De Mello and Schneider 2010) or inequality (Soares and Naritomi 2010) explain shifts in homicide rates; however, it is consistent with recent evidence that counternarcotics operations in one country can dramatically affect homicide rates along supply routes in other countries (Yashar 2018; Castillo et al. Forthcoming). And within the qualitative literature, whether drug trafficking fuels violence in Venezuela remains an open question (compare, e.g., ICG 2011; Antillano 2009). The results presented here suggest that it does.
Context: Trafficking and Violence in Venezuela
Drug Trafficking Moves into Venezuela
In the early 1990s, government officials and journalists sounded alarms about a surge in drug trafficking through Venezuela. A US drug official announced that Venezuela had become the second-biggest transshipment point (after Colombia; Brooke 1992). The Venezuelan president called trafficking “a cancer sapping the body of the nation” (Andrés Pérez 1993). A reporter summarized the change by recalling that, as recently as 1989, no one had thought about inviting Venezuela to the antidrug summit in Cartagena—but that by 1992, “few anti-narcotics experts [were] overlooking [the country],” which had become “a major operations center for the cocaine trade” and a participant in that year’s antidrug summit (Yarbro 1992).
While there are no direct measures of illegal drug shipments, the US government does estimate the volume of cocaine moving through each major trafficking country. These figures are consistent with the accounts quoted above: the estimates document a substantial increase in cocaine trafficking through Venezuela in the early 1990s (see Online Appendix C.1 for data and discussion). Drug-related arrests in Venezuela increased, too (Pérez Perdomo et al. 1997, p. 23; Online Appendix C.1). And prosecutors convicted numerous Venezuelan and Colombian traffickers for moving large shipments of cocaine through Venezuela during this period. 2
Contemporary observers proposed two explanations for the new use of Venezuelan trafficking routes: increased pressure on traffickers within Colombia, and bilateral trade liberalization between Colombia and Venezuela.
In 1989, the Colombian government intensified counternarcotics operations, enabled in part by counternarcotics assistance from George H. W. Bush’s Andean Initiative, enacted that year (Online Appendix C.1; Serafino 2003, 1). In addition to the pursuit of high-profile traffickers such as Pablo Escobar, the campaign involved the interdiction of large quantities of cocaine, the destruction of cocaine laboratories, the seizure of small aircraft, and the arrest of thousands of traffickers, among other activities that “[threw into disarray] the operations of the country’s cocaine mafias” (US Department of State 1990, 123). The International Narcotics Control Strategy Report identified 1989 as “by far the best year ever for Colombia’s anti-drug effort” (US Department of State 1990, 125).
Politicians on both sides of the border cited this campaign as one of the factors pushing drug trafficking through Venezuela. Carlos Andrés Perez, then the president of Venezuela, told The New York Times that “the intensified struggle against drug trafficking in Colombia undoubtedly means the threat of an increase in Venezuela;” the interview appeared under the headline “Colombian Drug Cartels Push into Venezuela” (Brooke 1991). In Colombia, an advisor to the Foreign Affairs committee (Comisión Segunda) of the House of Representatives said that “they did not anticipate how traffickers, persecuted in Colombia, would look for an exit. That exit was Venezuela” (El Tiempo 1991).
The second proposed explanation for the surge in trafficking through Venezuela was bilateral trade opening with Colombia. Liberalizing reforms in 1990 and 1991 preceded a 1992 customs union, all of which increased (legal) trade flows (Gutiérrez 2002, 49). Government officials and journalists claimed that illegal flows rose, too, arguing that more and bigger trucks crossing the border made it harder for customs agents to catch drug shipments, “showing free trade’s underside” (Brooke 1992; El Tiempo 1991).
By a similar logic, the implementation of Plan Colombia and President Álvaro Uribe’s Democratic Security policy in the early and mid-2000s likely contributed to a second jump in the volume of cocaine transiting Venezuela (Online Appendix Figure C.3a). Consider, for example, the August 2003 implementation of an aggressive campaign targeting suspicious aircraft in Colombian airspace. 3 According to radar data, traffickers responded by shifting to airstrips on the Venezuelan side of the border (Government Accountability Office [GAO] 2009, 10; Online Appendix Figure C.4).
Domestic (Venezuelan) policy certainly also affected trafficking, but academic reviews do not identify clear and coincident shifts in local counternarcotics enforcement. 4 In my view, the policies summarized here constitute the most plausible explanations for changes in trafficking flows through Venezuela in the early 1990s and the early 2000s (Online Appendix Figure C.3a).
A Connection between Trafficking and Violence?
As drug trafficking through Venezuela increased, the violent death rate rose from approximately 12 per 100,000 in the mid-1980s to 30 per 100,000 in the mid-1990s, 60 per 100,000 in the mid-2000s, and then 69 per 100,000 in 2012. Online Appendix Figure C.1 compares this trend both to the homicide wave in the United States in the 1970s and 1980s and to the Mexican drug war that began in late 2006. 5
Journalists, historians, and government officials have suggested two general mechanisms linking drug trafficking to trafficking profits and to violence in Venezuela. 6
First, observers such as Mildred Camero, the former head of Venezuela’s antidrug agency, have linked the increase in trafficking to fighting over trafficking routes, and also to violent tumbes, or attempts to seize rival traffickers’ drug shipments (Landaeta 2014, 20–21).
Second, international trafficking may have fueled the growth of local retail drug markets. The International Crisis Group reported in 2011 that, “As the flow of drugs in transit has increased, more drugs have also entered the domestic market, leading to a significant increase in microtrafficking, which has been a major contributor to the homicide rates in poor urban neighbourhoods” (ICG 2011, 8; Camero 2017, 48). 7
Qualitative research also provides evidence of the growth of microtrafficking—and associated violence—in the 1990s. For example, a study of one Caracas neighborhood found that retail drug sales became more prevalent in the 1990s (Grajales Pineda and González Plessmann 2014, 16). A neighborhood resident recalled, “There were many more points of distribution of drugs. Honorable families from the neighborhood were now selling…before, people around here were cautious around dealers, you greeted them, but warily, but then the wariness became camaraderie…we’ve become a whole society of accomplices in dealing and that’s what’s supported the violence” (p. 17).
One explanation for the link between drug transshipment and the growth of local retail markets is that international drug trafficking organizations sometimes pay local affiliates in kind. 8 In an interview conducted for this study, former Drug Enforcement Administration Chief of Operations Mike Braun explained, “In Venezuela, security forces that are paid in-kind for their part in supporting the trade are selling drugs to street gangs. And it’s the drug trafficking activity at a local level that is fueling much of the explosive violence in Venezuela.”
This pattern recalls descriptions of the connection between transshipment and microtrafficking in other Latin American countries. For example, Rodgers (2006) traces the birth of microtrafficking in a poor neighborhood of Managua, Nicaragua, to the growth of cocaine transshipment through the country: “Those conveying the drugs take a cut to distribute it locally” (p. 279). Dowdney (2002) describes a similar process in Rio de Janeiro, where microtrafficking followed the arrival of international cocaine transshipment (p. 22). As in the Venezuelan case, trafficking in Rio (e.g., in marijuana) predated the cocaine boom (pp. 22–23); what mattered was not the presence of traffickers but their profits: “the profitability of cocaine resulted in the excessive militarization of armed groups in order to control and defend” territory for drug sales (p. 23).
Government officials and journalists in Venezuela have suggested that drug trafficking revenues amount at least to hundreds of millions of dollars. For example, the former president of the congressional Commission against the Drug Trafficking and Drug Use, Vladimir Gessen, stated in 1993 that traffickers in Venezuela earned about 1.4 billion US dollars (Azocar Alcala 1994). Mayorca (2015) estimated that Venezuelan dealers’ revenue from microtrafficking alone amounted to 1.3 billion US dollars at the official exchange rate (288 million at the black market exchange rate) in 2013 (p. 41). 9
In the accounts summarized above, drug trafficking through Venezuela created two types of revenue: fees paid by international trafficking organizations to Venezuelan couriers, and sales in local retail drug markets. Control of territory close to international trafficking routes likely determined access to both types of income—in the former case because facilitating transshipment depends on controlling trafficking routes; in the latter case because, given the cost of transporting illegal goods, nearby markets may well have been the most profitable. 10 If municipalities close to transshipment routes were differentially exposed to drug trafficking, they were also differentially exposed to trafficking profits. Some models would then predict that the trafficking boom would increase violence in these municipalities, while other models would predict the opposite.
Empirical Analysis
To evaluate these predictions, I investigate whether the Venezuelan cities and towns closest to international trafficking routes experienced differential changes in violent death rates in the post-1989 period.
This analysis requires identifying trafficking routes. Unfortunately for this purpose, drug-seizure data at the local level—or other law-enforcement data that would map trafficking flows—are not available (Camero 2015). Instead, I rely on journalistic accounts and government reports that identify the Panamericana highway—which leads from San Cristobal, Táchira, near the Colombian border, to Caracas and then through eastern Venezuela—as an important conduit for cocaine (e.g., Miroff 2014; Mayorca 2014; Wells 2013; GAO 2009, 7–11). While drug shipments do leave Venezuela on small aircraft flights from rural areas near the Colombian border, these accounts indicate that large quantities move through the country on the Panamericana and then exit at Maiquetía, the port outside Caracas (the capital); Puerto Cabello, a major port in the neighboring state of Carabobo; and Puerto La Cruz, further east, largely destined for markets in Europe.
I therefore compare violent death rates in municipalities adjacent to the Panamericana (
Graphical Analysis
Figure 1A plots the average violent death rate in municipalities on and off the Panamericana, both before and after 1989. Before 1989, average violent death rates in these two groups were similar, and the violent death trends were largely parallel. After 1989, both the levels and the trends diverged, with violent death rates in municipalities along the Panamericana rising faster than rates in municipalities elsewhere.
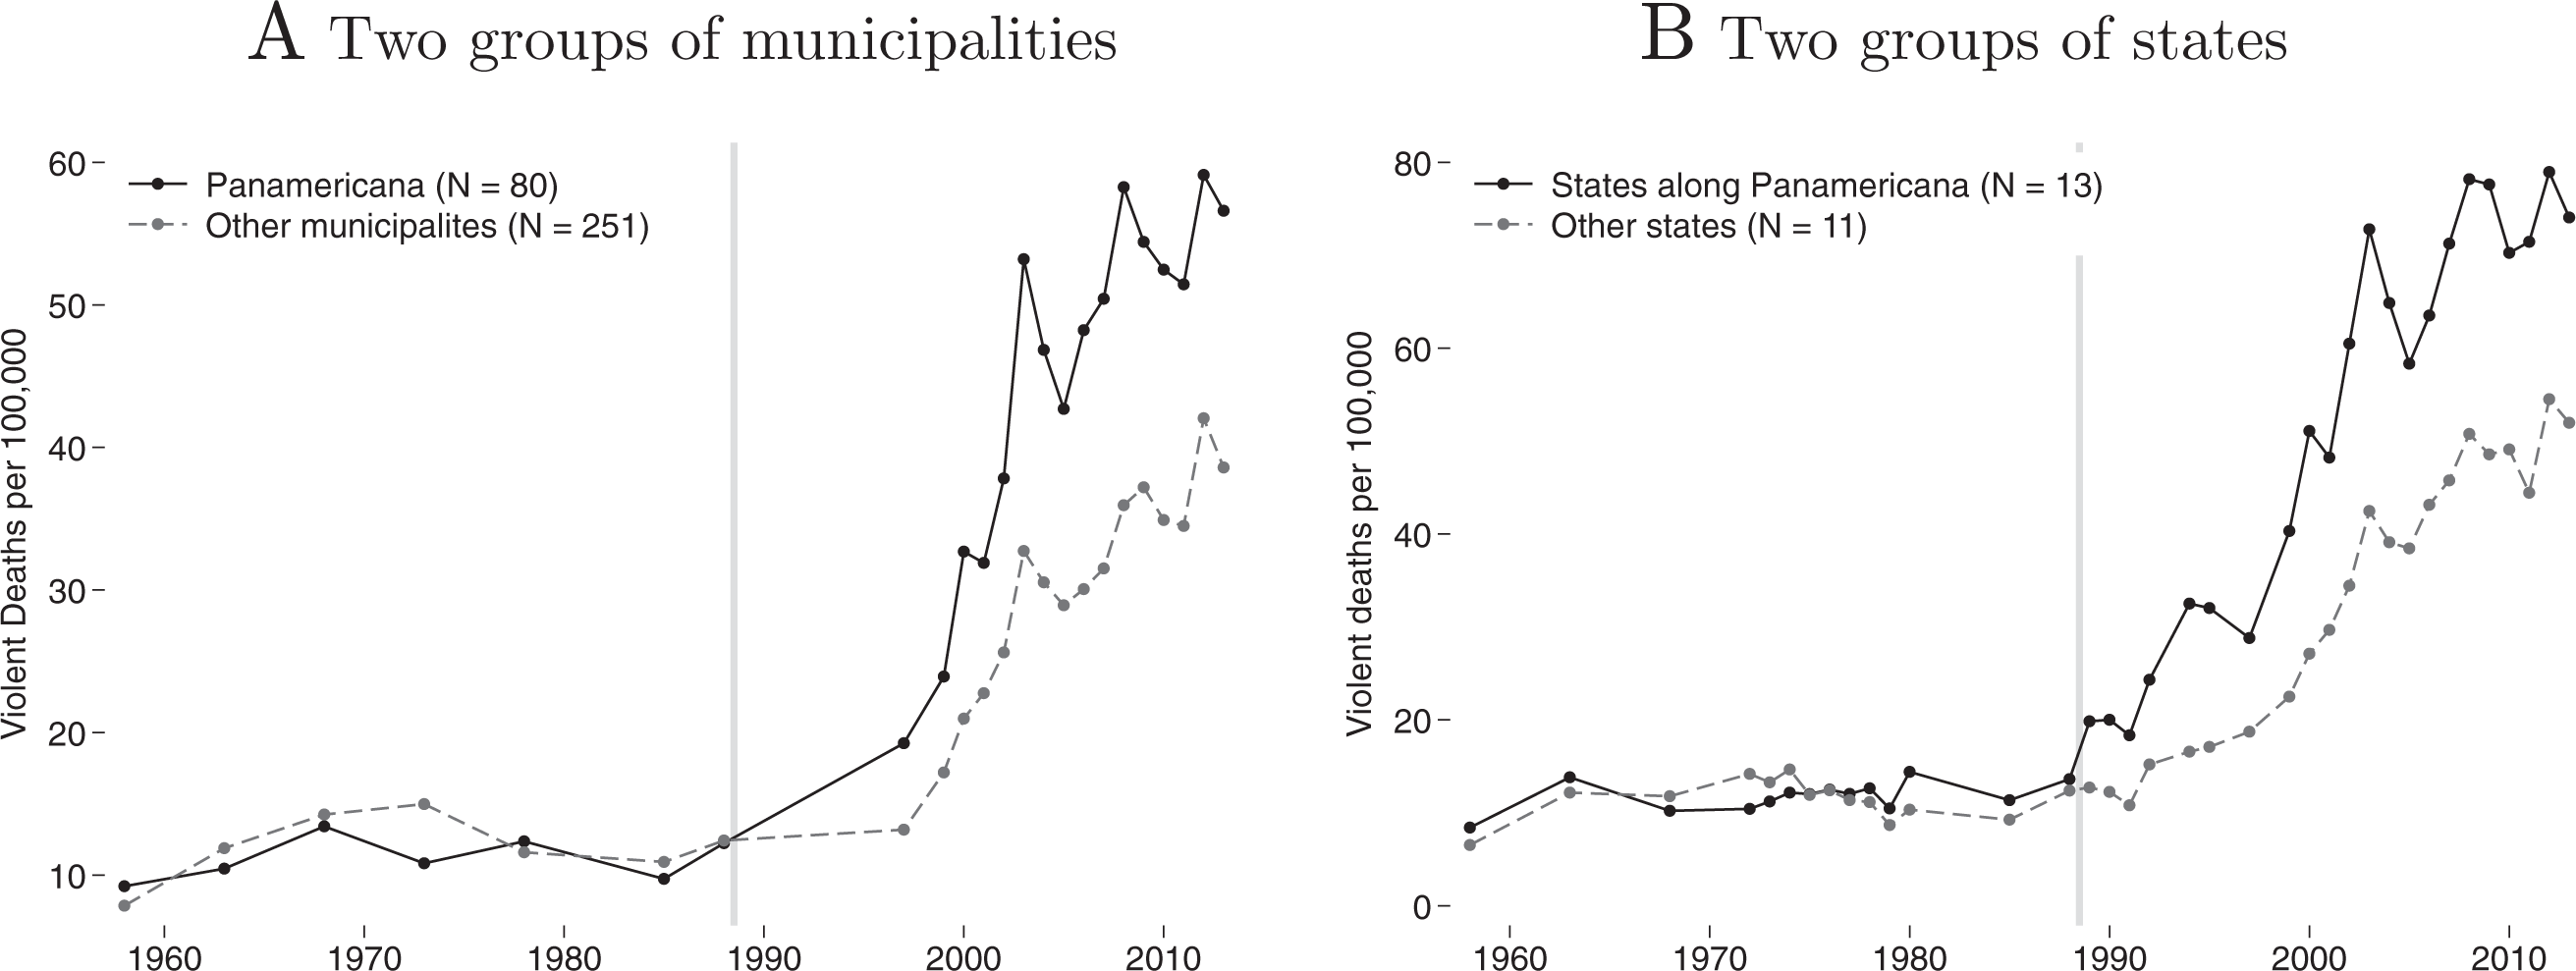
Divergence in violence trends post-1989. Figure (A) plots mean violent death rates in municipalities along the Panamericana highway and municipalities elsewhere, both before and after 1989 to 1990. For population-weighted means, see Online Appendix Figure D.8. Because municipality-level data are not available for 1989 to 1996, Figure (B) plots mean violent death rates in two groups of states.
Municipality-level violent death data are not available for the years 1989 to 1996, hence the gap in the time series in Figure 1A (see Online Appendix A). Therefore, panel 1B presents an analogous comparison at the state level, for which data are available in many more years. 12 This comparison indicates that the divergence between treatment and control areas indeed began in the years immediately following 1989. Online Appendix Figure F.2j provides additional evidence; it plots violent death rates in two municipalities along the Panamericana that also constitute states in and of themselves (and therefore appear in the state-level data). In these two municipalities, violence increased sharply in the early 1990s.
Three regional trends underlie the divergence in Figure 1A, as well as the nationwide increase in violence: Between 1988 and 1998, the increase in violence was almost entirely confined to the capital region of the country (Pérez Perdomo et al. 1997; Briceño-León and Pérez Perdomo 2000); violence rose in nearly all municipalities in that region, and especially in the municipalities along the Panamericana. Online Appendix Figure F.1 graphs violence trends by region, on and off the Panamericana. In 1999, violence jumped nationwide; this global increase—in both groups of municipalities—is visible in Figure 1A, and Kronick and Hausman (2019) attribute this in part to a rewriting of the national criminal procedure code. Beginning in 2004, municipalities along the Panamericana again grew violent faster than municipalities elsewhere. This time, the divergence was driven not only by the capital region but also by municipalities elsewhere along the Panamericana (Online Appendix Figure F.1).
Some of the jump in the violent death rate in 1989—and some of the divergence observed in Figure 1—derives not from trafficking-related violence but from the Caracazo: five days of protest and looting in 1989 during which the police and the military killed hundreds of civilians in Caracas (Coronil and Skurski 1991, 291; Velasco 2015, Ch. 7). Political unrest continued after the Caracazo, but protests produced fatalities only “on occasion” (López-Maya 2002, 208), and even two coup attempts accounted for no more than (approximately) 5 percent of all violent deaths in 1992. 13 Discussing the surge in violence in Venezuela’s capital region in the early 1990s, Briceño-León and Pérez Perdomo (2000) focus not on political turmoil but rather on “expressive violence” and “instrumental violence” associated with illegal markets (pp. 285–86).
To provide a visual check that the post-1989 divergence in Figure 1 is not driven by one or a few municipalities in either group, Figure 2 plots the full distribution of municipality-level changes in violent death rates. For each municipality, I calculate the pre-post change as: (mean violent death rate, years post-1989) − (mean violent death rate, years pre-1989); Figure 2A reveals that, in municipalities away from the Panamericana, the distribution is more concentrated around values close to zero. Similarly, Figure 2B plots the post-1989 mean violent death rate in each municipality against the pre-1989 violent death rate in each municipality. Here, too, the divergence between municipalities on and off the Panamericana does not appear driven by a small subset of municipalities.
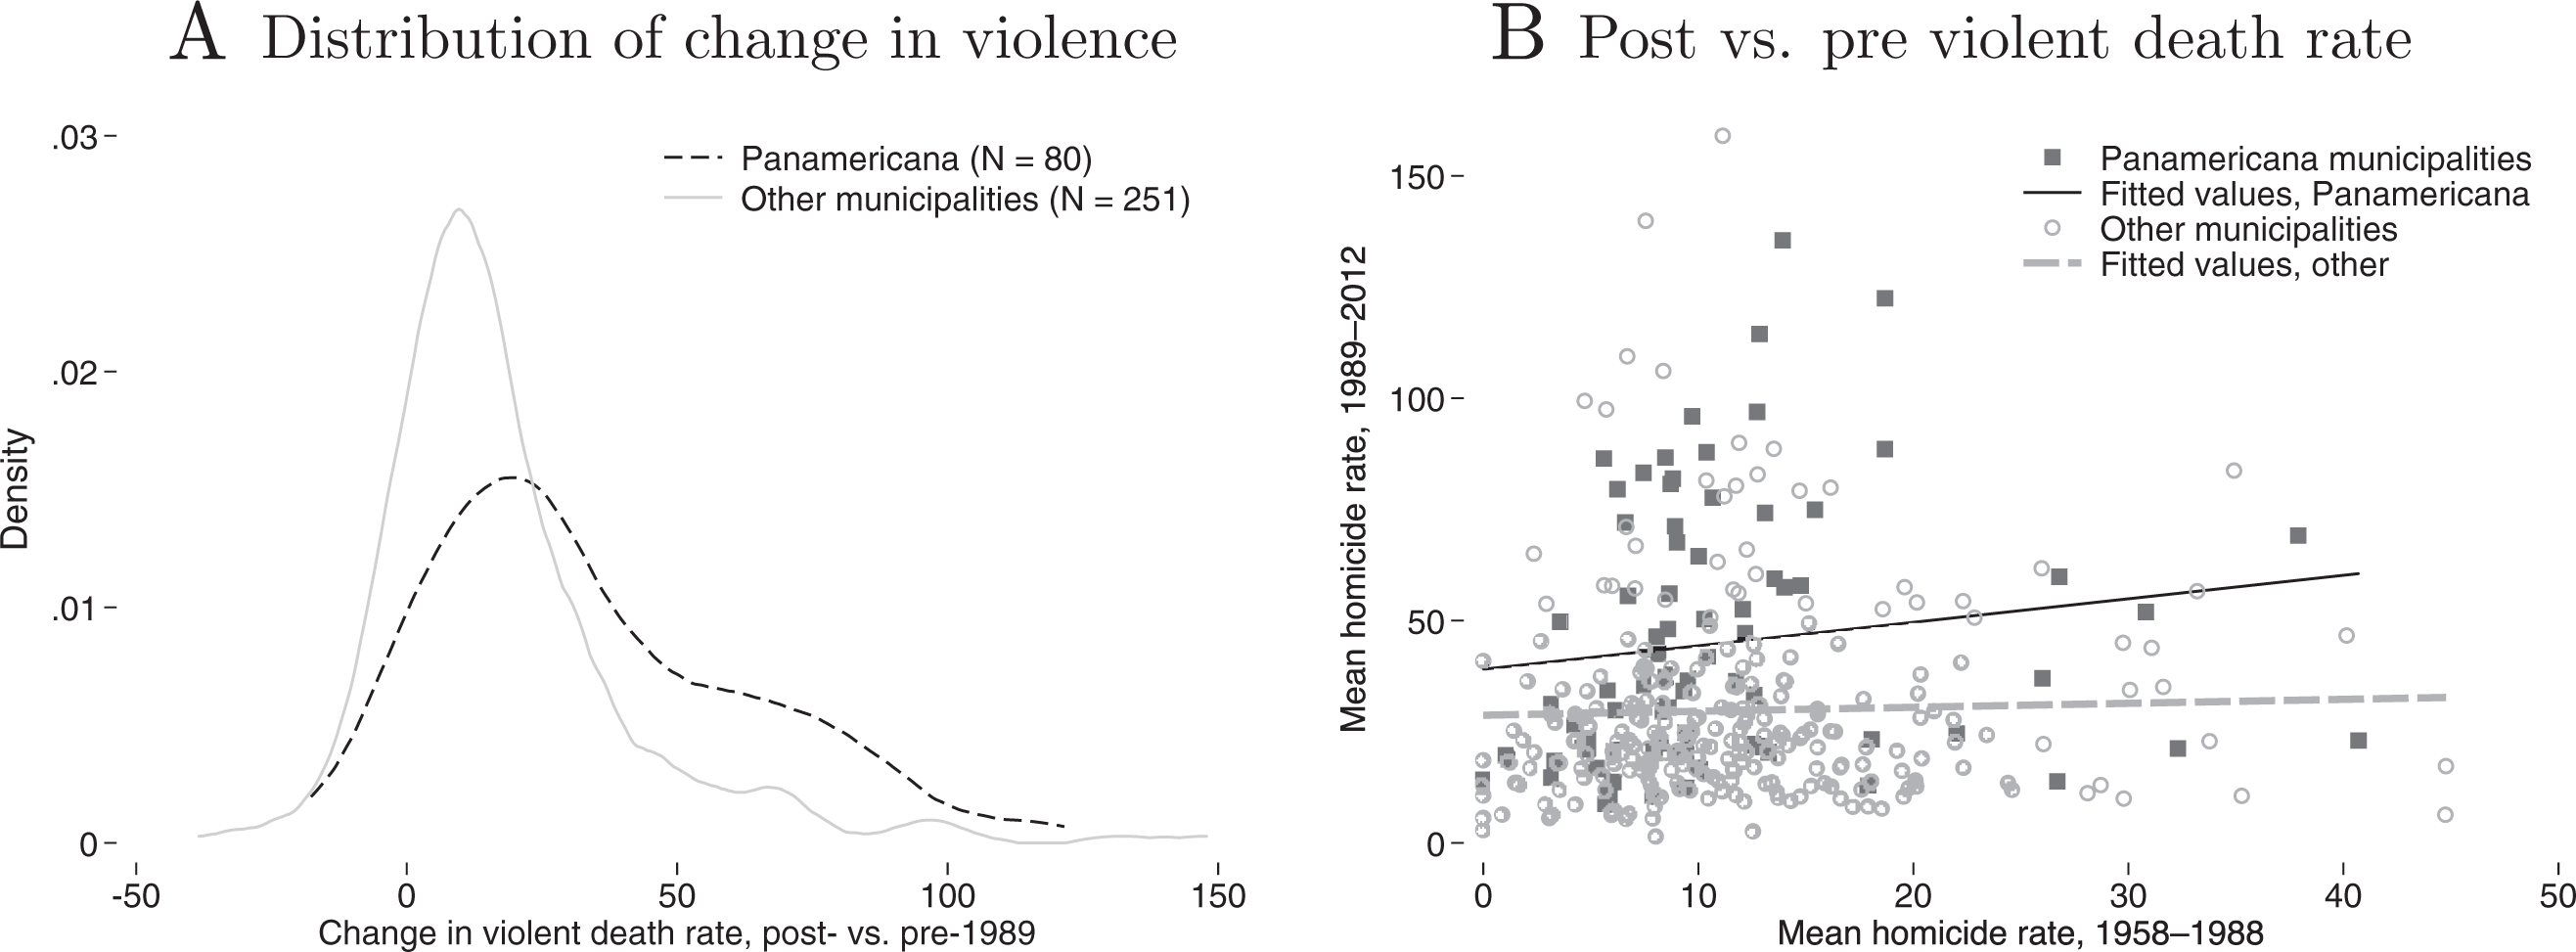
Full distribution of pre-post changes in each group. Figure (A) plots the distribution (across municipalities) of the pre-post change in violent death rates: (mean violent death rate, 1989–2012)
Estimating the Difference-in-differences
To test the null hypothesis of no divergence between municipalities on and off the Panamericana, I estimate:

where
Because the municipalities along the Panamericana share an important geographic feature, the
Table 1 presents estimates of Equation 1. Column (1) records the results of predicting the violent death rate only on municipality fixed effects, year fixed effects, and the treatment indicator (
Differential Increase in Violence along the Panamericana (Estimates of Equation 1).
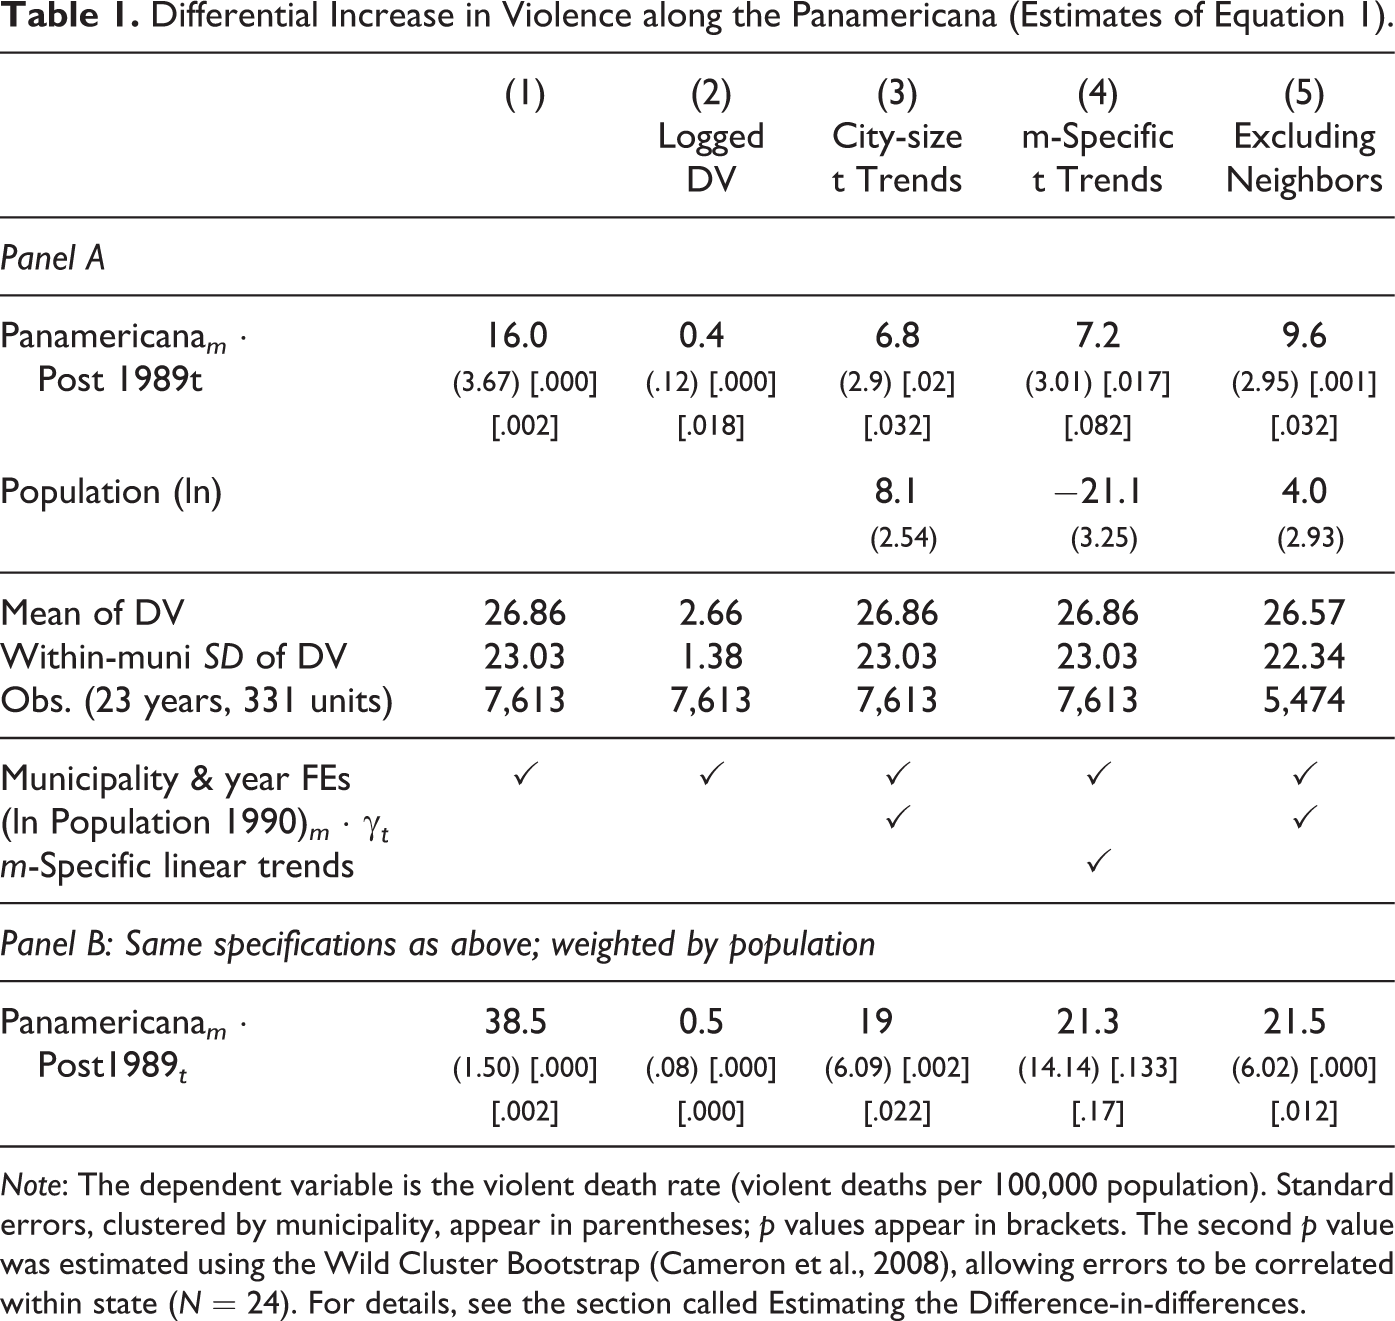
Note: The dependent variable is the violent death rate (violent deaths per 100,000 population). Standard errors, clustered by municipality, appear in parentheses; p values appear in brackets. The second p value was estimated using the Wild Cluster Bootstrap (Cameron et al., 2008), allowing errors to be correlated within state (N = 24). For details, see the section called Estimating the Difference-in-differences.
Column (3) adds two time-varying controls, the first of which is log municipal population. The literature provides a number of reasons to expect a correlation between population growth and crime, quite apart from any connection between population growth and the illegal drug market (e.g., Glaeser and Sacerdote 1999, 243).
The second additional control in Column (2) is a set of interactions between year indicators and log 1990 municipal population. These interaction terms allow time trends to vary by 1990 population, and they accomplish a different goal than including log population as a regressor. While including log population allows crime to increase with population growth, interacting year fixed effects with 1990 population essentially allows large cities to follow a different violence trend than towns or smaller cities, regardless of local population changes.
It is the inclusion of these trend terms, rather than controlling for log population, that reduces the magnitude of the estimated difference-in-differences from 16 deaths per 100,000 in Column (1) to 6.8 per 100,000 in Column (3): overall, violence increased more in big cities than in smaller cities and towns, and places along the Panamericana tend to be more populous. 14 One interpretation of this result is that cities became (relatively) more violent for reasons unrelated to drug markets; another interpretation is that proximity to the Panamericana was not the only determinant of growth in trafficking-related violence. If cities provided the most profitable local retail markets for dealers, for example, growth in trafficking could account for larger increases in violence in cities (see Online Appendix D.8 for additional analysis and discussion).
In any case, the result in Column (3) of Table 1 establishes that differences in city size do not fully account for the divergence in violent death rates between cities adjacent to and away from the trafficking route. To further substantiate this point, consider Figure 3, which plots the pre-post change in violent death rate against (log) municipal population in 1990. 15 This figure makes clear that municipalities on the Panamericana generally have higher populations, that there is a clear positive relationship between city size and growth in violence—and also that, conditional on city size, “treated” municipalities generally experience larger increases in violence.
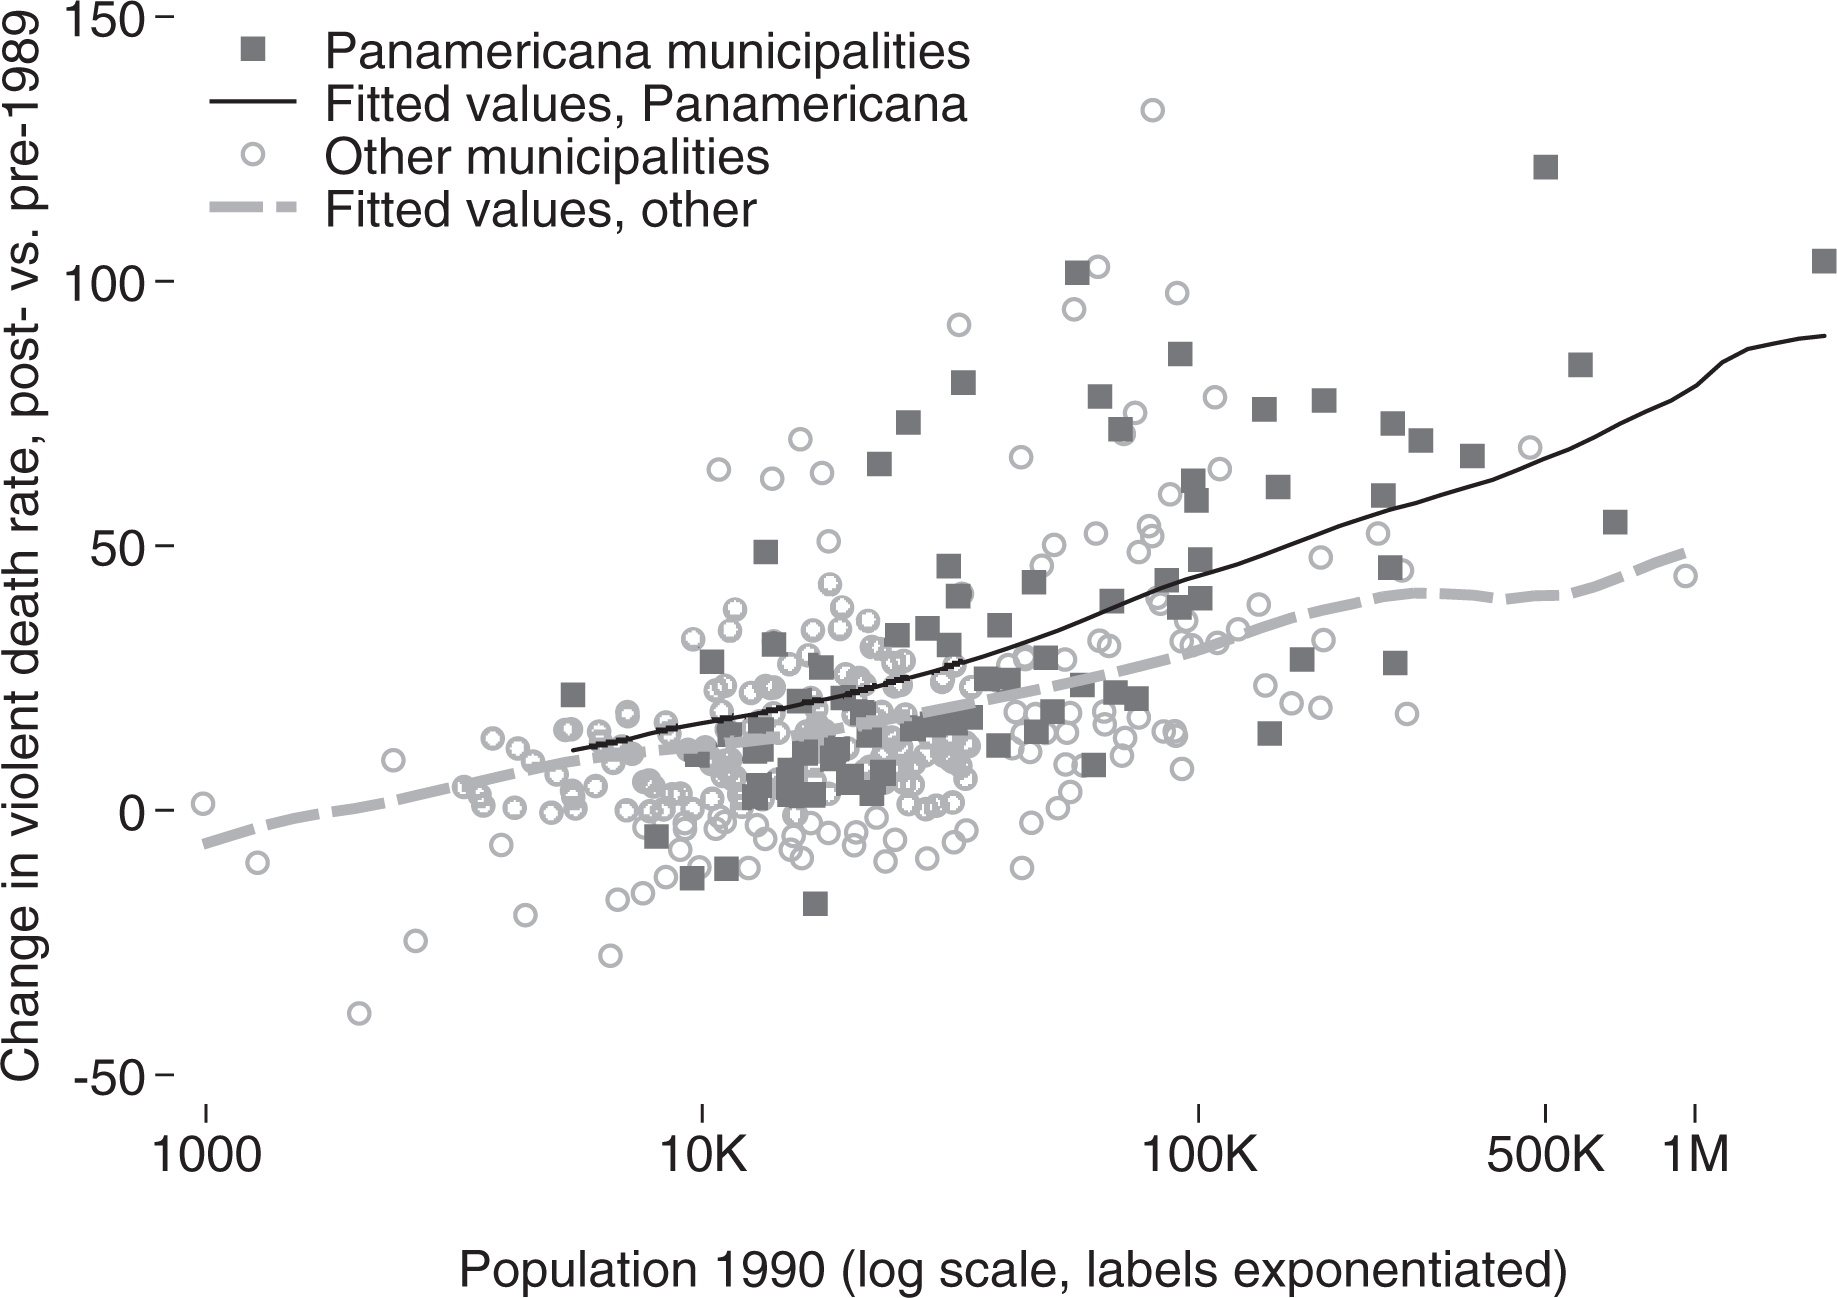
City size and growth in violence.
Column (4) of Table 1 includes municipality-specific linear time trends, which produces an estimate similar to that obtained by allowing trends to vary by city size (Column 3). In recognition of potential spillovers across municipal boundaries, Column (5) excludes ninety-three municipalities adjacent to the municipalities along the Panamericana; this increases the estimate of the difference-in-differences to 9.6 violent deaths per 100,000.
Panel B presents the same six specifications as panel A, but weighting the observations by population. Population weighting generally more than doubles the size of the difference-in-differences estimate and generally increases precision. This reflects the fact that big cities along the Panamericana experienced larger relative violence increases (relative, that is, to big cities elsewhere) than did smaller cities or towns. Online Appendix D.8 presents a triple-difference specification that allows the pre-post change in violent death rates to vary by city size.
Did Trafficking-related Violence Drive the Divergence?
Together with the qualitative accounts in the Context section, I interpret the quantitative results as evidence that rising revenues in drug trafficking markets—driven in part by intensified counternarcotics operations in neighboring Colombia—increased violence in Venezuela. Of course, places adjacent to the Panamericana highway differ from other places along a number of social, economic, and political dimensions. Could these differences, together with events other than the increase in drug trafficking, have produced the observed divergence in violent death rates?
As a first step toward answering this question, I consider the possibility that, due to any number of underlying differences, social or economic conditions post-1989 declined faster in municipalities along the Panamericana than in other municipalities. If this were the case, we might expect to observe differential trends in infant mortality—an outcome unlikely to have been affected by an increase in drug trafficking but plausibly affected by economic shocks or declining infrastructure (e.g., Baird et al. 2011; Bhalotra 2010). Figure 4A presents graphical results of this placebo test, and Column (5) in Table 2 presents estimates of Equation 1, but with infant deaths as the dependent variable. 16 That infant deaths declined at similar rates in treatment and control groups throughout the period is inconsistent with the notion that a general deterioration of conditions along the Panamericana accounts for the results presented above.
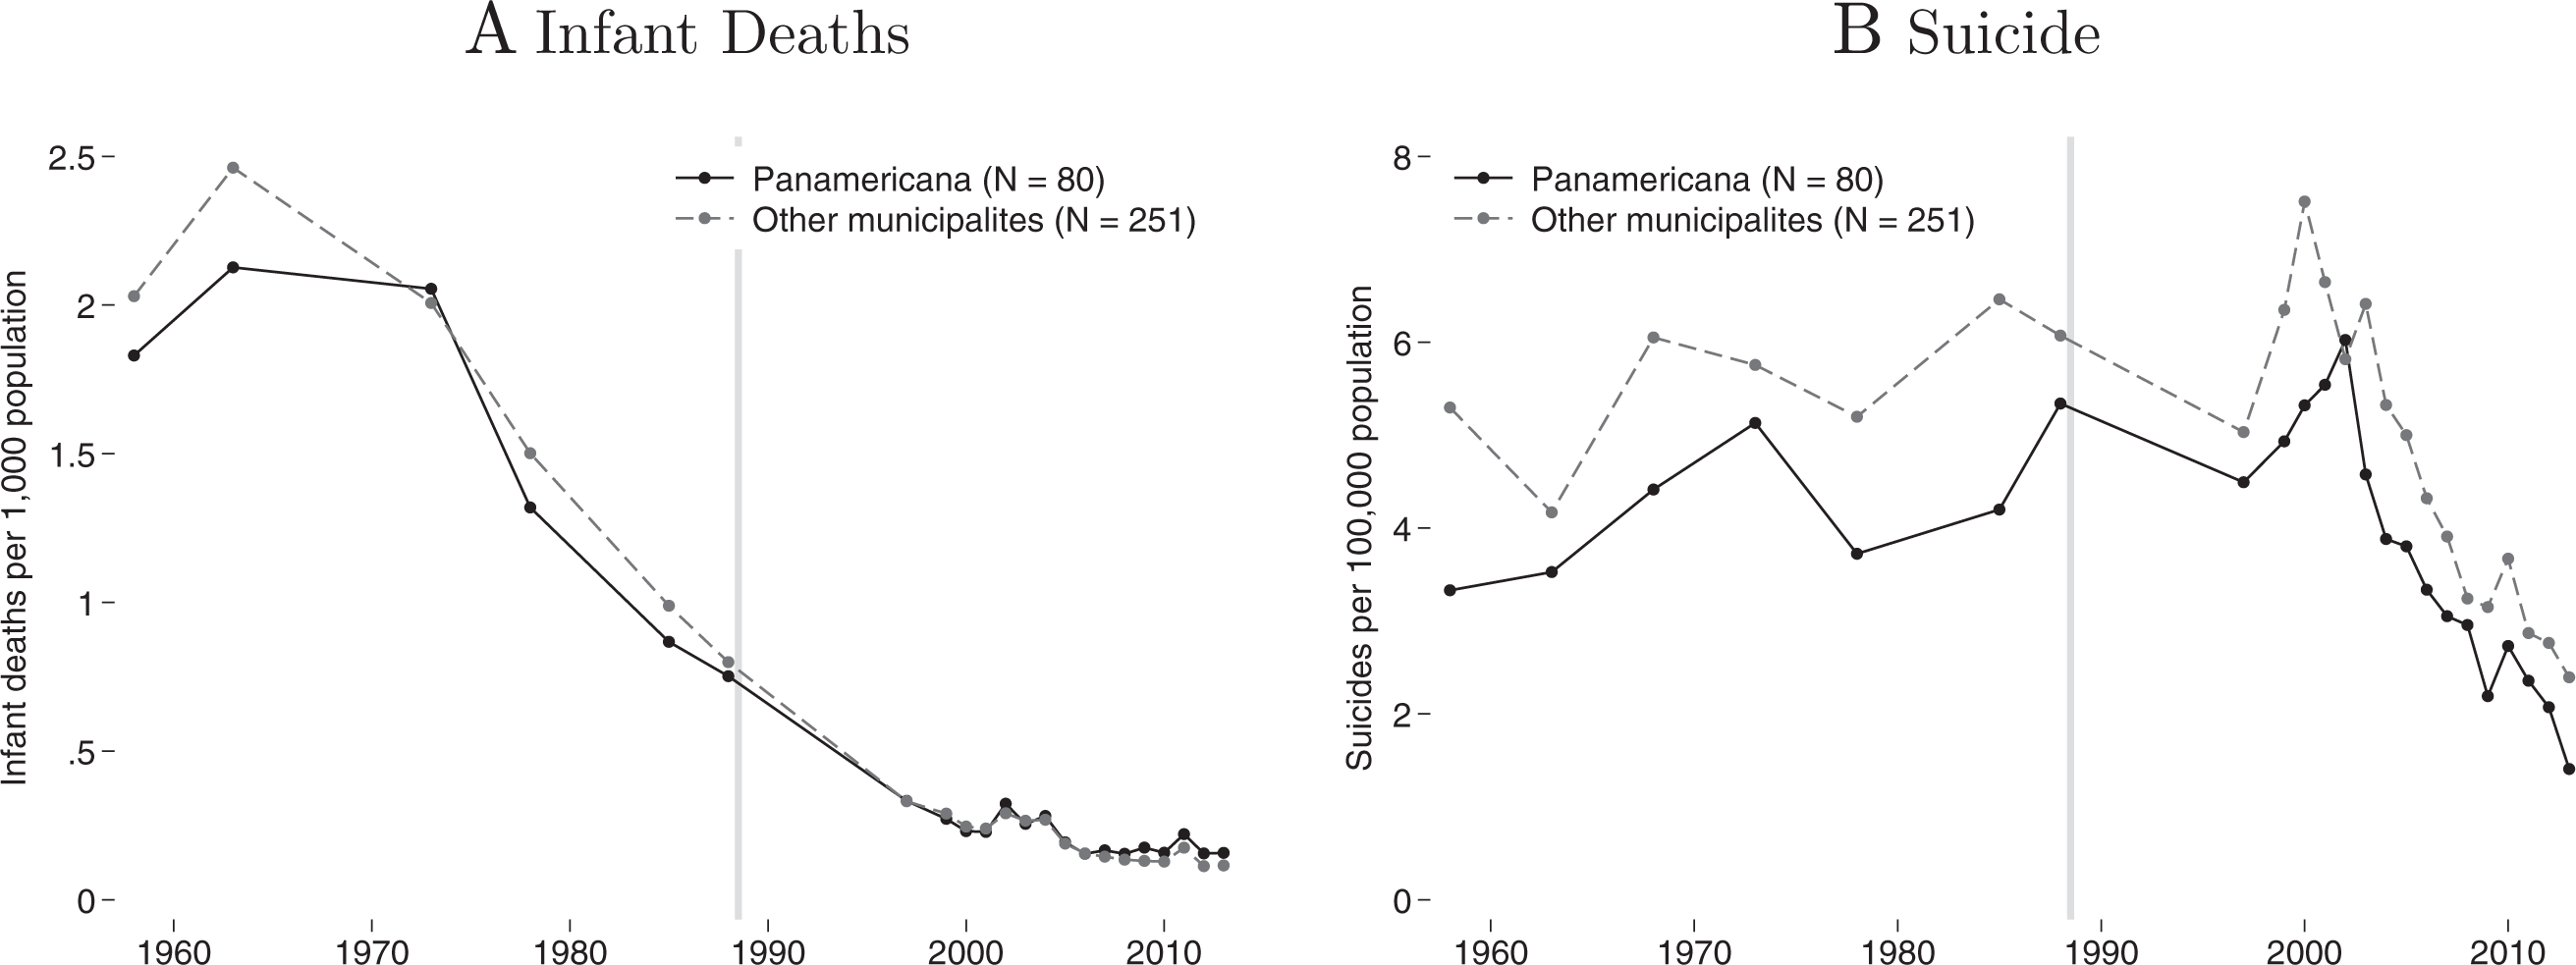
Placebo outcomes: Child mortality and suicide. This figure plots mean infant death rates and mean suicide rates in treated and control municipalities, both before and after 1989. These outcomes would not likely be affected by the drug-trafficking treatment but might well be affected by time-varying confounders such as divergent economic trends or differential access to small arms.
Additional specifications, differential increase along the Panamericana estimates of Equation 1.
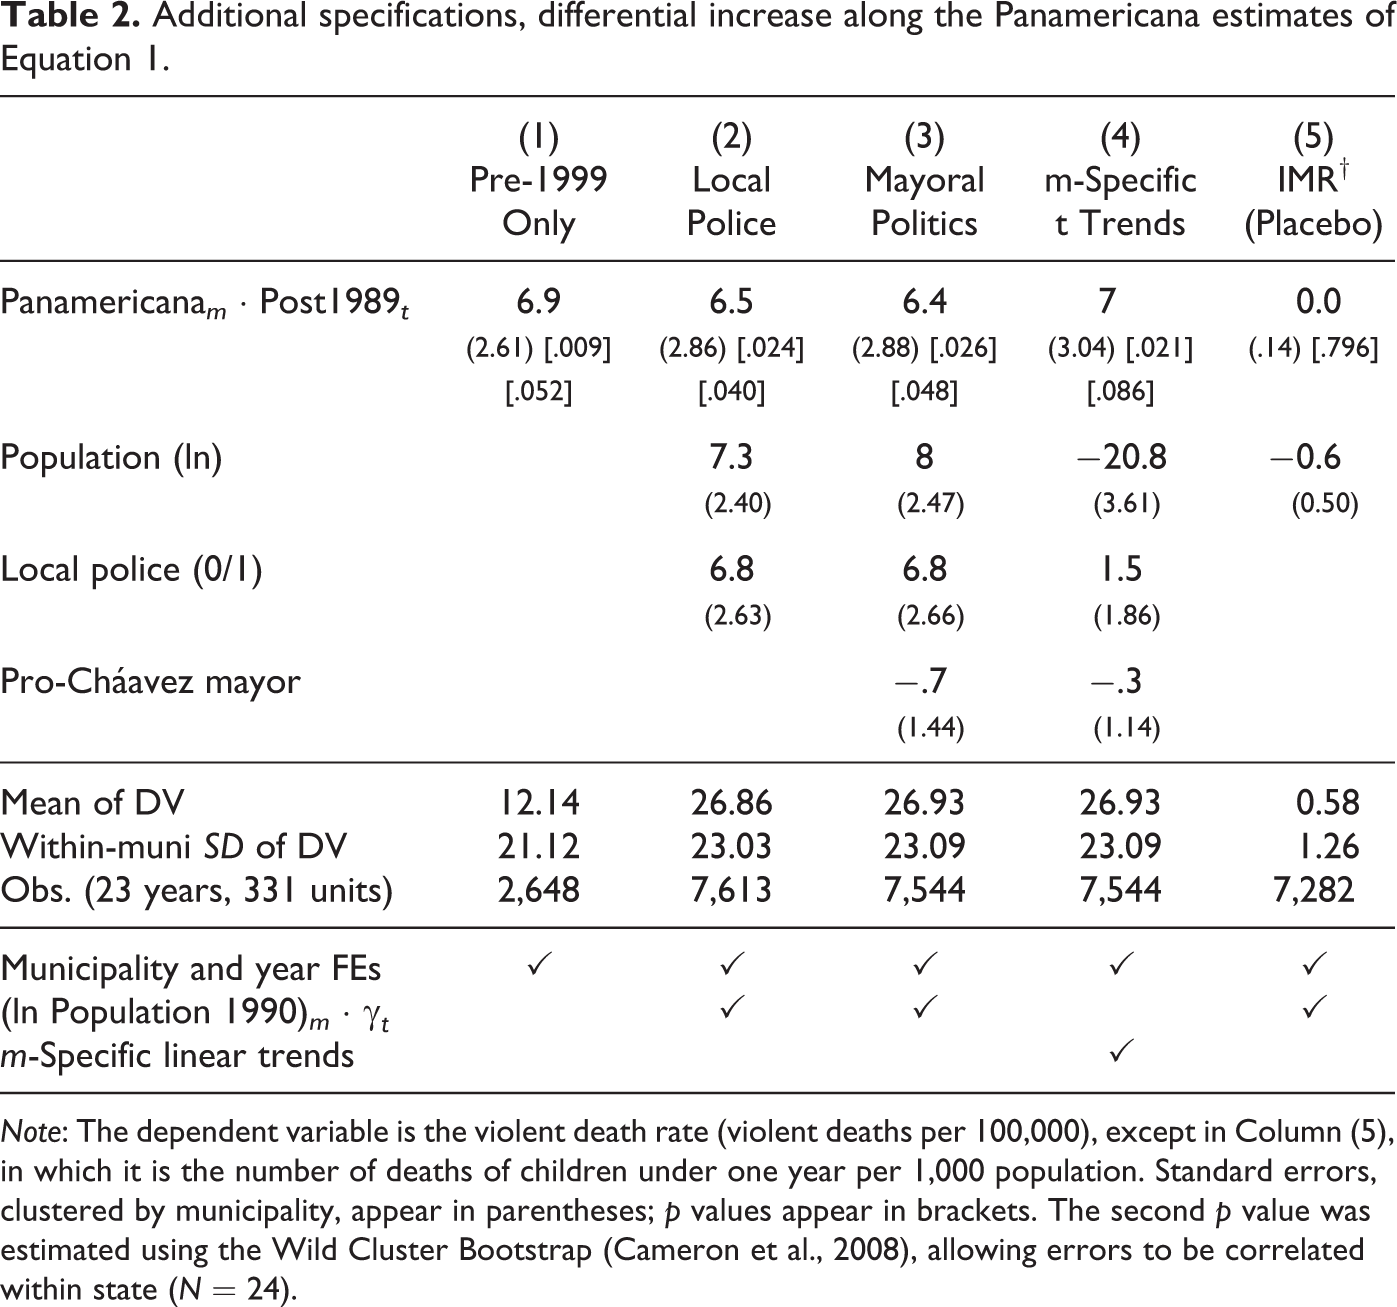
Note: The dependent variable is the violent death rate (violent deaths per 100,000), except in Column (5), in which it is the number of deaths of children under one year per 1,000 population. Standard errors, clustered by municipality, appear in parentheses; p values appear in brackets. The second p value was estimated using the Wild Cluster Bootstrap (Cameron et al., 2008), allowing errors to be correlated within state (N = 24).
Second, decentralization in 1989 included the partial devolution of law enforcement responsibilities to municipal governments; after 1989, municipalities began to establish their own local police forces. 17 If municipalities along the trafficking route were any more or less likely to found local police forces, and if the presence of a municipal police force were to affect violent death rates, these events might explain the patterns observed above. Online Appendix Figure D.9 shows that, indeed, municipalities along the Panamericana were more likely to establish local police forces than other municipalities, 18 and the results reported in Column (2) of Table 2 suggest a positive within-municipality relationship between violent death rates and the establishment of a municipal police force. However, with the inclusion of municipality-specific linear time trends—Column (4) of Table 2—this relationship is estimated close to zero, while the difference-in-differences of interest remains positive and of a similar magnitude and precision.
Third, Hugo Chávez took office as president of Venezuela in 1999. A number of Venezuelan scholars have attributed the violence wave to “the institutional destruction that broke out when President Chávez took power [in 1999]” (Briceño-León 2012) or “the voluntary weakening of Leviathan [during the 15 years of the Bolivarian revolution initiated by the late Hugo Chávez]” (Hausmann 2014). These accounts point to a broad range of policies, including “restriction of police action,” “speeches of uprising” (Briceño-León 2012), and permissions granted to armed pro-government groups known as colectivos. 19 If Chavista mayors were able to influence this “institutional destruction,” differential political trends on and off the Panamericana might account for part of the observed divergence in violence trends.
I address this concern in two ways. First, Column (1) of Table 2 presents a version of Equation 1 that excludes 1999 and all subsequent years. Because of gaps in the municipal-level time series (see Graphical Analysis section), this restricted analysis includes only one year of data in the post-1989 period (1997); even with such limited data, the result in Column (1) of Table 2 indicates that the pre-1999 divergence was statistically distinguishable from zero. 20 Second, I control for mayoral political affiliation. Column (3) of Table 2 indicates that the within-municipality correlation between violence and pro-Chávez control of the mayoralty is small and statistically indistinguishable from zero. 21
The Venezuelan sociology literature emphasizes the diffusion of small arms as a driver of Venezuela’s crime wave (e.g., Chacón and Fernández-Shaw 2013), and evidence from other contexts suggests that a shock to the gun supply can increase conflict (Dube et al. 2013). If small arms trafficking were to occur primarily along the Panamericana, and if the 1989 policy changes in Colombia also affected the gun supply, this could account for the divergence in violence between the two groups of municipalities.
I therefore consider two outcomes that have been found to correlate with gun prevalence, but which would not likely be affected by an increase in trafficking-related violence. The first is the proportion of suicides that are committed by firearm (cf., Azrael et al. 2004); Online Appendix Figure D.3 indicates that, in Venezuela, the proportion of suicides committed by firearm declined somewhat over time, at similar rates in treatment and control municipalities in recent years (these data are not available for earlier years). 22 The second outcome is the overall suicide rate, which some studies have found to correlate with gun prevalence (Miller 2006; Miller and Hemenway 2008); in Venezuela, suicide rates show no evidence either of divergence or of secular increase post-1989 (Figure 4B). If indeed a shock to the gun supply drove the divergence in violent death rates, it did so without affecting two outcomes tied to gun prevalence.
Finally, empirical work from elsewhere in Latin America has suggested a relationship between demographic structure and violent death rates. De Mello and Schneider (2010) find that demographic trends—in particular, the shrinking of the 15-to-24 age-group as a percent of the population—help explain the decline of violent death rates in São Paulo. 23 If the size of Venezuela’s 15-to-25 cohort increased at the same time as the violent death rate, and if the increase were larger in municipalities close to the trafficking route, demographic trends might in part explain the difference-in-differences in violent death rates. However, as Online Appendix Figure D.2 makes clear, the percentage of the population aged 15 to 24 peaked in the early 1980s, nearly a decade before the start of Venezuela’s violence wave. Moreover, demographic trends were similar across treatment and control states (age profiles at the municipal level are not available before 1990; Online Appendix Figure D.2).
Discussion
In the Context section, I cited Venezuelan policymakers and journalists who connected the growth of drug trafficking through Venezuela to higher profits and more violence. I interpret the differential increase in violence along the Panamericana highway as one piece of quantitative evidence consistent with these assertions.
Another quantitative pattern linking violence to the growth of drug trafficking is that, post-1989, violent death rates increased much faster among young men than in other groups. In Online Appendix E, I use police data from one Venezuelan state to document the fact that gang violence—often tied to control of drug markets—has a very different age profile than other types of violence (such as domestic violence or insurgency). I then use age-at-death to estimate the proportion of victims who died in gang violence (following Owens 2011). The results indicate that, indeed, this proportion jumped from near zero pre-1980 to approximately 20 percent in the 1990s and then 35 percent by 2012.
If money in illegal markets in Venezuela fueled violent conflict, why? This finding is in keeping with some theoretical results but at variance with others; empirically, while some studies document a positive relationship between trafficking booms and violence (e.g., Angrist and Kugler 2008; de la Sierra 2014; Castillo et al. Forthcoming), others point to the peaceful growth of international and domestic trafficking markets (e.g., Duran-Martinez 2015a; Lessing 2018).
The qualitative record suggests several potential explanations. First, traffickers may have expected the boom to be temporary: international counternarcotics operations could close Venezuelan routes, just as Caribbean routes were closed in the 1980s. Second, in local retail markets, community organization could matter; Antillano and Zubillaga (2014) point out that some Venezuelan communities designed mechanisms for limiting the violence associated with microtrafficking. For example, one community instituted motorcycle home delivery of illegal drugs to “inhibit territorial fights for valuable sale points (plazas)” (p. 136).
A third potential explanation is market fragmentation. In Venezuela, many small groups—rather than a few large groups—controlled the market; in most theoretical models, violence grows with the number of competitors. According to Mayorca (2017), small and violent neighborhood gangs with few members dominated Venezuela’s criminal scene for decades (p. 6). 24
The image of fragmentation in trafficking markets might seem at odds with the case of Venezuelan trafficker Walid Makled, “a king among kingpins” (US Attorney 2010). But while Makled briefly “controlled almost the entire drug industry in the center of the country” (Landaeta 2014, 29–30), his reign was short-lived. A 2005 Venezuelan law extended counternarcotics responsibility to the army, the air force, and the navy, where previously only the National Guard had jurisdiction (Landaeta 2014, 42–43). This led to “generals from other components of the armed forces becoming actively involved in drug trafficking” (p. 45), sparking a “fight to the death” between Makled, who worked primarily with the National Guard, and traffickers in the army, as both groups vied for control of key transshipment routes (p. 41).
In this account, fragmentation (induced by the 2005 law) intensified the relationship between profits and violent conflict among traffickers. Consistent with this hypothesis, I find that municipalities along the Panamericana grew even more violent (relative to municipalities elsewhere) after 2005—that is, the difference-in-differences widens in the post-2005 period (Online Appendix D.7).
Conclusion
Do booms in illegal markets fuel violence or facilitate peace? This is an open question. Some claim that money fuels violence by making it more difficult for traffickers to sustain low-violence agreements, while others argue the opposite. Some studies of alcohol prohibition in the United States, for example, assert that higher profits encouraged peace: that “prosperity seemed to breed content” among competing gangs (Funderburg 2014, 229). Others claim instead that profits provoked conflict: “To secure a cash flow like [3.6 billion untaxed dollars], murder could seem like bookkeeping” (Okrent 2010, 274).
The relationship between profits and violence in illegal markets is difficult to study empirically. I provide evidence on this relationship from drug trafficking in Venezuela. Using an original data set on violent death rates in 331 Venezuelan municipalities over fifty-four years, I compare municipalities adjacent to a major trafficking route to municipalities elsewhere in the country. When trafficking volumes were negligible, violent death rates and trends were similar in these two groups of municipalities. As trafficking expanded, violent death rates increased much faster in municipalities along the trafficking route than elsewhere.
Together with qualitative accounts, original interviews, and additional quantitative analysis, I interpret these results as evidence that the drug trafficking boom fueled lethal violence among traffickers and dealers in Venezuela. In addition to informing debates about profits and conflict in illegal markets, this finding helps explain one of the largest and least-studied criminal violence episodes on record.
Supplemental Material
Supplemental Material, sj-zip-1-jcr-10.1177_0022002719898881 - Profits and Violence in Illegal Markets: Evidence from Venezuela
Supplemental Material, sj-zip-1-jcr-10.1177_0022002719898881 for Profits and Violence in Illegal Markets: Evidence from Venezuela by Dorothy Kronick in Journal of Conflict Resolution
Footnotes
Acknowledgments
Special thanks to Georges Jabbour for excellent research assistance and to Steve Haber for extensive guidance. For comments, I thank colleagues at Stanford and the University of Pennsylvania, José Luis Fernandez-Shaw, Josbelk González-Mejías, Thad Dunning, Etan Green, Daniel Ortega, Jake Shapiro, Quico Toro, Alexander Westerfield, and workshop participants at AL CAPONE.
Declaration of Conflicting Interests
The author(s) declared no potential conflicts of interest with respect to the research, authorship, and/or publication of this article.
Funding
The author(s) disclosed receipt of the following financial support for the research, authorship, and/or publication of this article: This project was supported by a grant from the Stanford University Center for Latin American Studies.
Supplemental Material
Supplemental material for this article is available online.
Notes
References
Supplementary Material
Please find the following supplemental material available below.
For Open Access articles published under a Creative Commons License, all supplemental material carries the same license as the article it is associated with.
For non-Open Access articles published, all supplemental material carries a non-exclusive license, and permission requests for re-use of supplemental material or any part of supplemental material shall be sent directly to the copyright owner as specified in the copyright notice associated with the article.