




Abstract
This article argues that individuals’ attitudes toward members of other groups are at least partly shaped by the cultural environment in which the individuals live. Based on the theory of cultural values by Schwartz, it was tested whether cross-country differences in cultural value preferences can explain individual differences in negative group-related attitudes. Furthermore, the present article postulates that individuals with a migration background are less strongly guided by the cultural values of the society in which they live, because they are additionally exposed to cultural values originating from their heritage culture. Samples from 24 countries that were part of the fourth wave of the European Social Survey were examined. Cultural values were assessed using the Portrait Value Questionnaire. Group-related attitudes were operationalized through an index of attitudes toward four different groups. Analyses of hierarchical linear models supported the hypotheses: Participants’ degree of negative group-related attitudes varied as a function of the cultural values inherent in the individuals’ countries. Moreover, weaker effects were found for individuals with migration background compared to individuals without migration background, especially for first-generation immigrants and immigrants from culturally more distant countries. Moreover, country-level cultural values were found to moderate the relationship of individual education and income level with group-related attitudes. Results are discussed with regard to their contribution to the literature on acculturation and with regard to the validity of Schwartz’s cultural value theory.
Based on the theory of cultural values by Schwartz (2006), this study tested whether cross-country differences in cultural value preferences explain individual differences in group-related attitudes. Furthermore, the study compares individuals with to those without a migration background, assuming that cultural values differently relate to group-related attitudes among these groups. This comparison is considered providing a further validity test of Schwartz’s theory as well as suggesting a new perspective in acculturation research.
Schwartz’s Theory of Cultural Values and Its Implication for Group-Related Attitudes
According to Schwartz (1999), “cultural values represent the implicitly and explicitly shared abstract ideas about what is good, right and desirable in a society” (p. 25). They are the central feature of a culture and form the underlying basis that manifests itself in poetry, art, education, or childrearing practices and shapes societal institutions such as schools and the economic and judicial systems (Schwartz, 2006, 2010). Individuals are exposed to the cultural value climate in which they live, which provides stimuli that guide the individual’s attitudes and behavior (Schwartz, 2006, 2008). In this respect, cultural values also shape the relations between groups in the society through guiding group-related attitudes of their members.
Schwartz (1994, 2006) proposes three cultural value dimensions on which societies can be aligned. Each dimension has been described to relate to individuals’ group-related attitudes in particular ways (Leong & Ward, 2006; Schiefer, Möllering, Daniel, Benish-Weisman, & Boehnke, 2010; Schwartz, 2006). The first dimension ranges from egalitarianism at the one pole to hierarchy at the opposite pole. Egalitarian societies promote human equality and mutual cooperation for the welfare of all others, whereas in hierarchical societies an unequal distribution of power and status is viewed as natural and desirable. Hence, in more hierarchical and less egalitarian societies, negative group-related attitudes are more likely to emerge among the individuals (Leong & Ward, 2006; Schiefer et al., 2010; Schwartz, 2006). The second dimension distinguishes embeddedness from autonomy. In autonomous cultures, individuals are encouraged to think, feel, and act as unique individuals. They should follow their own ideas and thinking (intellectual autonomy) and their own attempts for positive affective conditions (affective autonomy). Conversely, societies committed to embeddedness emphasize the integration in social entities with shared goals and ways of living. This stronger emphasis on the group in more embedded societies makes group-based differentiations and judgments more likely to occur. This is less so in autonomous societies where the individual rather than the group is valued (Schiefer et al., 2010). The third dimension distinguishes harmony from mastery. Harmony values stand for unity with the social and natural environment. Fitting into the world is more valued than directing it (Schwartz, 2008, 2010). The mastery value, in turn, emphasizes an active managing, changing, and directing of the social and natural world in order to attain group or personal goals. Harmony is assumed to be associated with a weaker tendency to express negative group-related attitudes (Schwartz, 2006), whereas mastery is seen as promoting group-based competitions, which can (if the other group is viewed as competing with one’s goals) lead to negative group-related attitudes (Leong & Ward, 2006; Schiefer et al., 2010; Schwartz, 2006).
There is empirical evidence for the outlined assumptions. Schwartz (2006) documents correlations with attitudes toward homosexuality, gender equality, and immigrants; Fischer and Hanke (2009) with the level of peace. Still, results are somewhat inconsistent. Based on data from the European Social Survey, Schwartz (2006, 2007) found relations with attitudes toward immigrants only for the value types of egalitarianism and autonomy. Leong and Ward (2006) proved that only the harmony-mastery dimension is related to attitudes toward immigrants. Schiefer et al. (2010) reported that only the dimensions of egalitarianism-hierarchy and autonomy-embeddedness are predictive for attitudes toward ethnic out-groups.
Digression: Values—Cultural Versus Individual
The three-dimensional value structure proposed by Schwartz (2006) applies to cultural groups, not individuals. Schwartz empirically derived this structure using countries as units of analysis (e.g., Schwartz, 2010). Country mean scores of individual questionnaire-based data were utilized for smallest space analyses (Borg & Lingoes, 1987, as cited in Schwartz, 2006) from which the value types and dimensions were obtained based on interitem correlations. However, Schwartz (1992) had conducted the same analyses with the same measure but with individuals as units of analysis. He found the items to arrange in a different way, forming a value structure of 10 individual-level value types (e.g., universalism, power, or achievement) along two higher order dimensions (openness to change vs. conservatism, self-enhancement vs. self-transcendence). Schwartz (1994, 2010) suggested referring to the cultural value structure when describing differences in value preferences between cultural groups and to the 10 individual-level value structure when describing differences in value preferences between individuals. Both value structures overlap but cannot be considered completely the same (Schwartz, 2010). The term isomorphism has often been used in this regard, describing the correspondence between the value structures on the individual and cultural level (see Chen, Bliese, & Mathieu, 2005; Fischer, Vauclair, Fontaine, & Schwartz, 2010). Fischer et al. (2010) and Fischer (in press) tested the degree of isomorphism between the country-level and individual-level value structure and found substantial overlap yet no complete isomorphism.
Since the current article examines whether individuals’ attitudes vary according to the values of the culture in which they live (and not by their own personal values), the culture-level value structure was taken up, and as will be demonstrated, a multilevel design was applied.
Do Cultural Values of a Society Also Relate to Group-Related Attitudes of Immigrants?
Cultural values are assumed to direct the thinking of all individuals in a society. However, as known from acculturation research, immigrants are exposed to both the culture of the host society as well as the culture of their heritage group (e.g., Berry, 2005) compared to individuals without a migration background, who are only socialized in one cultural setting. Thus, cultural values of a host society can be expected to less strongly guide the attitudes of its immigrants, because they are additionally exposed to values that are rooted in another culture (e.g., Kwak, 2003). This assumption can be further differentiated in two ways. The first differentiation regards generational status. First-generation immigrants have spent a part of their life in the country of origin prior to their immigration and were thus directly exposed to the values shared by that culture. Especially when they are already adolescents or adults by the time they migrate, they enter the new country with a developed set of cultural values in mind. Compared to immigrants who were already born in the host culture, they are more motivated to retain their cultural heritage (Kwak & Berry, 2001; Phinney, Ong, & Madden, 2000). Second-generation immigrants, in turn, were socialized in the receiving society from the very beginning through the social environment and through educational and social institutions. Compared to their foreign-born parents, they more easily adopt the values of the host country (Hwang, 2006; Phinney et al., 2000). Though they also receive values from the culture of origin, it is not done directly but only transmitted through their families and co-ethnic peers (Kwak, 2003). Thus, the assumption that cultural values of a host society less strongly guide the attitudes of its immigrants should apply even more to first- compared to second-generation immigrants. Second, immigrants’ origin may also play a role. This assumption is based on the concept of cultural distance, defined as the degree of dissimilarities between cultures regarding aspects such as language, values, religion, forms of governance, and so on (Chirkov, Lynch, & Niwa, 2005). An immigrant from a culturally close country (e.g., a German migrating to Denmark) can be assumed to be more strongly guided by the host country’s cultural values than an immigrant from a culturally more distant country (e.g., a Chinese or Egyptian migrating to Denmark), because the former was socialized in a cultural environment more similar to the host country than the latter. The present article therefore compares individuals without migration background to second- and first-generation immigrants from both a culturally close region and a culturally more distant region.
This comparison is thought to bring a new perspective into acculturation literature, examining immigrants’ adaptation to their host society’s culture using cultural value theory as a base and—as will be shown—analyzing across countries instead of across individuals. Furthermore, if the data show that the relationship between cultural values and group-related attitudes is weaker among immigrants compared to nonimmigrants, this is empirical evidence for the validity of Schwartz’s cultural value theory, because its rationale clearly suggests that the degree of exposure to the particular culture plays a crucial role.
Hypotheses
Based on the above literature review, it is hypothesized that cultural values of a country are related to its individuals’ group-related attitudes. The closer a country is to the hierarchy, embeddedness, or mastery pole of the corresponding value dimension, as opposed to egalitarianism, autonomy, and harmony, the more negative group-specific attitudes will be shown by its individuals (Hypothesis 1). Second, the relationships assumed in Hypothesis 1 are expected to be weaker among immigrants (Hypothesis 2). Third, the assumption of Hypothesis 2 regards especially first-generation immigrants and immigrants from culturally distant countries. Therefore, among immigrants, the strongest effects are expected for second-generation immigrants from culturally close countries and the weakest effects for first-generation immigrants from culturally distant countries (Hypothesis 3).
Methodological Aspects
Measuring group-related attitudes among immigrants
A majority of the scales used in intergroup relation research focus on attitudes of members of the host society toward foreigners or immigrants. However, assessing attitudes toward immigrants among individuals who are immigrants themselves raises a question of validity. To account for that problem, the present study examined a general tendency to show group-related attitudes jointly expressed in attitudes toward diverse groups. This approach is based on assumptions laid out by Zick et al. (2008). The authors empirically showed that negative attitudes toward various groups are substantially interrelated. They identified a general underlying syndrome that they call group-focused enmity (GFE). Based on these findings, the authors reasoned that attitudes toward different out-groups “mirror a general devaluation of out-groups, that is, GFE” (Zick et al., 2008, p. 364). Interrelations of attitudes toward different groups have also been shown by previous researchers (e.g., Bratt, 2005). Based on these findings, this approach was seen as appropriate for the current purpose of comparing individuals with and without migration background.
Control variables
Migrants often have a socioeconomic status that differs from that of nonmigrants (Aycan & Berry, 1996; Clark & Berkowitz King, 2008). Socioeconomic status, operationalized, for example, by level of education, income, or occupational status, has in turn been shown to relate to group-related attitudes (Hainmueller & Hiscox, 2007; Malchow-Møller, Munch, Schroll, & Skaksen, 2009; Wagner & van Dick, 2001; Walker & Smith, 2002). Hence, since in the current study individuals with and without a migration background are compared, socioeconomic status was included in the analyses as a control variable. The multilevel approach utilized here allows us to include such individual-level characteristics in the analyses.
Method
Sample
The current study used data from Round 4 of the European Social Survey (ESS), conducted in 2008 in 30 European countries. Participants were assigned to categories of nonimmigrants as well as (a) second-generation immigrants and first-generation immigrants 1 and (b) immigrants from a culturally close and from a culturally distant country. The latter distinction was operationalized by differentiating between immigrants from European countries (EU immigrants) and immigrants from non-European countries (non-EU immigrants). 2 In order to receive reliable results, only those country samples were selected that comprised at least 20 second-generation and 20 first-generation immigrants as well as 20 EU immigrants and 20 non-EU immigrants. This cut the number of included countries down from the original 30 to 24 countries. Table 1 presents sample characteristics.
Sample Characteristics of the ESS Round 4 Data Used for the Present Analyses
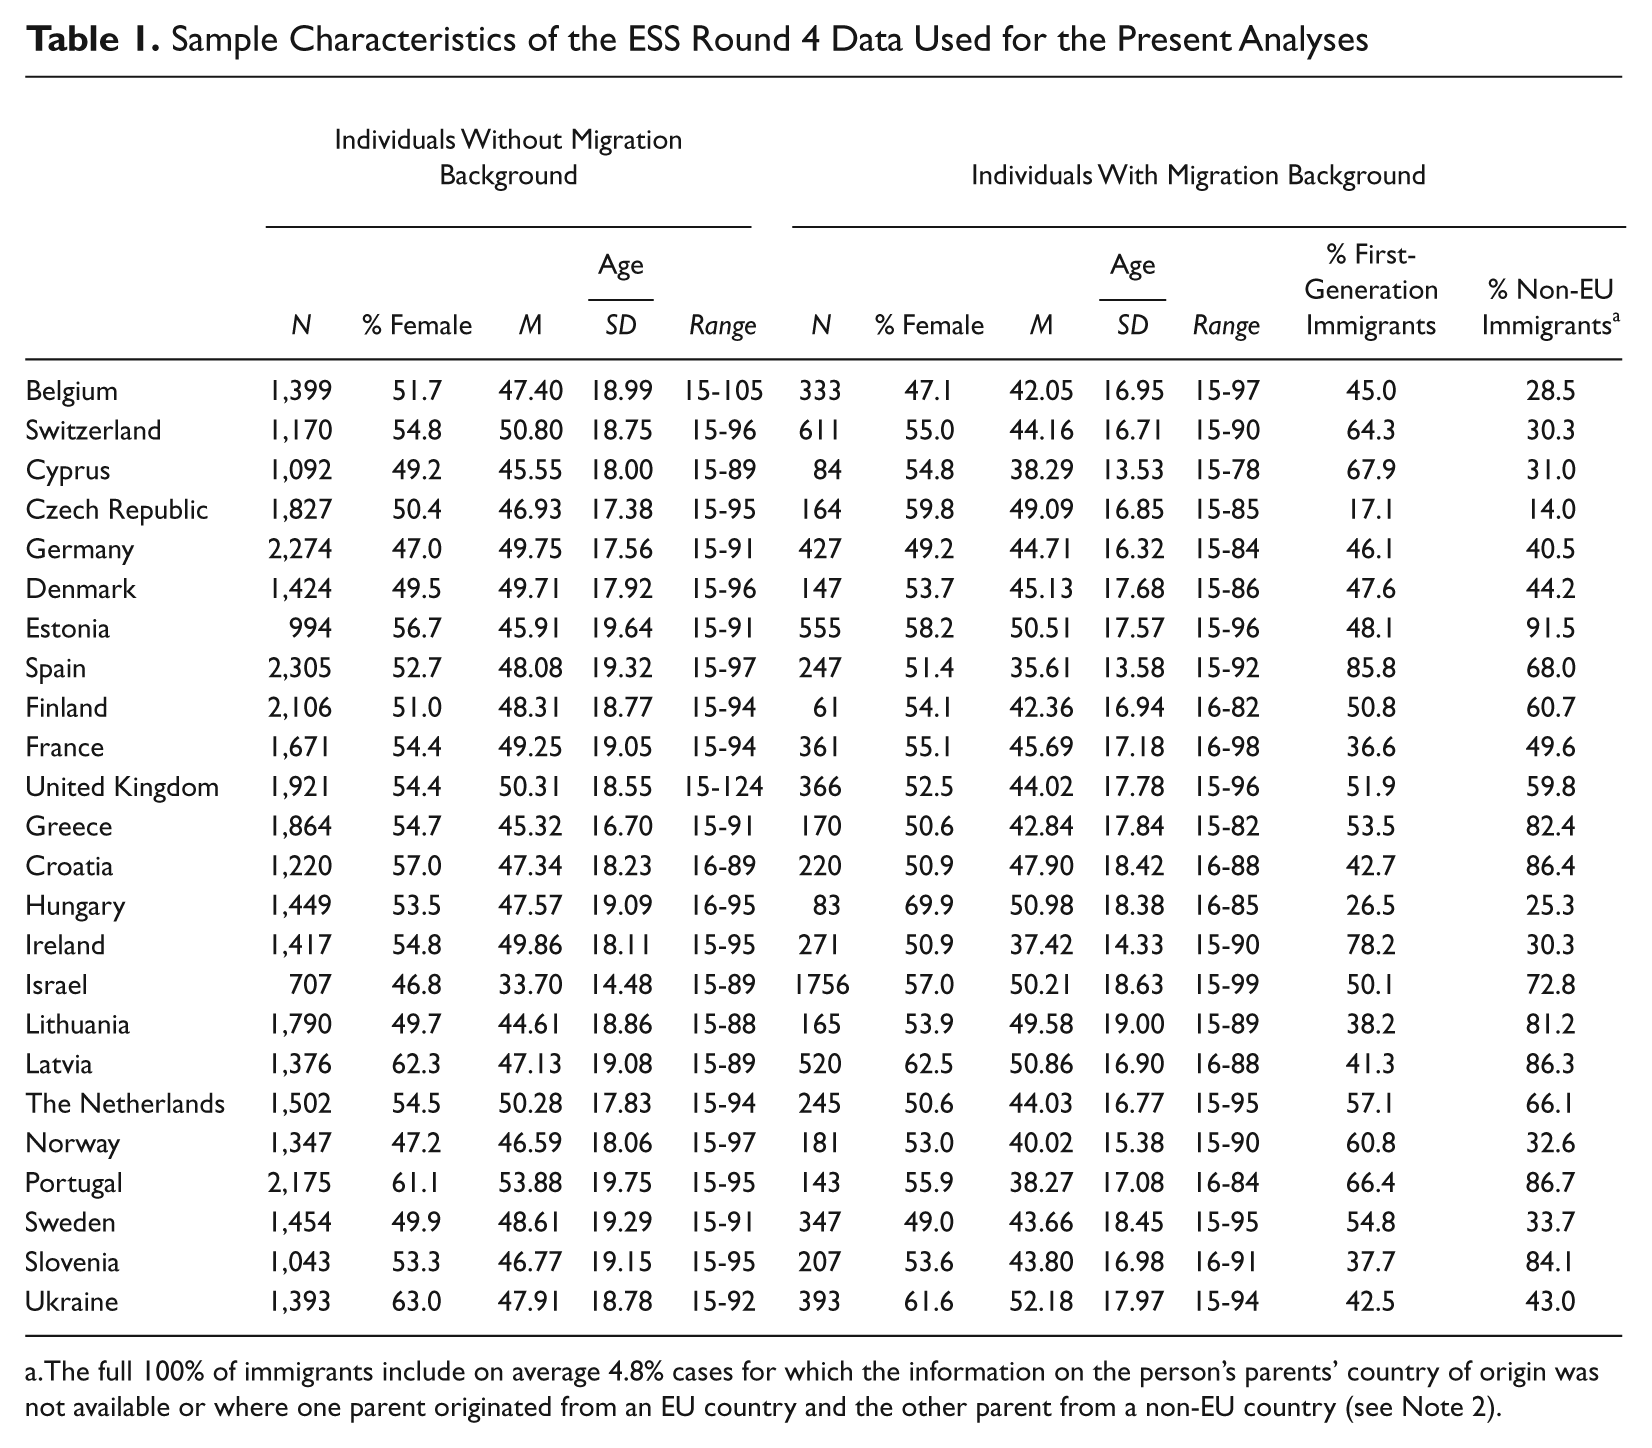
The full 100% of immigrants include on average 4.8% cases for which the information on the person’s parents’ country of origin was not available or where one parent originated from an EU country and the other parent from a non-EU country (see Note 2).
Measures
Cultural values
According to Schwartz (1994), country scores of cultural values can be derived by aggregating individual-level questionnaire-based data. One such measure is the Portrait Value Questionnaire (PVQ; Schwartz, Melech, Lehmann, Burgess, & Harris, 2001), which has been implemented in the ESS survey. The items comprise descriptions of a particular person’s goals, aspirations, or wishes (e.g., “She/He thinks it is important that every person in the world should be treated equally.”). 3 Participants are asked to indicate how similar the portrayed person is to them. The response scale ranged from 1 (very much like me) to 6 (not like me at all). 4 Schwartz (2006) demonstrated that the PVQ data of the ESS reflect the three-dimensional structure proposed in his theory. He also reported substantial correlations (mean = .63) between the PVQ-based scores and those derived from another measure, the Schwartz Value Survey, which had previously been demonstrated to be cross-culturally equivalent (see Schwartz, 2010). Finally, Schwartz (2006) documented correlations of his cultural value dimensions with those of Inglehart (Inglehart & Baker, 2000). For example, survival/self-expression conceptually overlaps with autonomy-embeddedness, which is reflected in correlations between .40 and .65 (see Schwartz, 2004, 2006). Fischer (in press) recently demonstrated a high stability of the cultural value structure in the PVQ data across the first three rounds of the ESS.
Schwartz (2006) specified precisely which PVQ-item measures which cultural value. Based on these specifications, items that jointly represent one value type were averaged. These individual scores were calculated using only data of individuals without a migration background to assess the values that are most typical for that particular country. The calculations were performed with weighted data in order to get scores representative for the countries’ nonimmigrant population (see Häder & Lynn, 2007, for a documentation of weighting in the ESS). Next, since conceptually two particular cultural value types (e.g., hierarchy and egalitarianism) each form the opposite end of one dimension (in the current case correlations of opposite value types ranged between r = –.37 and r = –.65), the single value types were transformed into value dimensions. This was done by subtracting the score of one value type from the score of the one constituting the opposite end of the corresponding dimension (see Schwartz, 2006, p. 162). For example, the dimension of egalitarianism-hierarchy was calculated by subtracting the score for egalitarianism from the score for hierarchy. Resulting scores range between −5 (strongest tendency toward egalitarianism, autonomy, or harmony) and 5 (strongest tendency toward hierarchy, embeddedness, or mastery).
In a last step, the individual-level scores for the cultural value dimensions were aggregated to the country level. Each participant of a country (migrant and nonmigrant) received the same score: the mean of the nonmigrant individuals of the respective country.
Enmity index
Based on Zick et al.’s (2008) concept of group-focused enmity, four items were selected to assess negative group-related attitudes.
These items differed with regard to their scale range and coding, which is why a number of transformations had to be made prior to the scale construction: The first three items assessed attitudes towards homosexuality (“Gay men and lesbians should be free to live their own life as they wish.“), attitudes towards gender equality (“Men should have more rights to get a job when jobs are scares.”), and negative perceptions of unemployed people (“Most unemployed people do not really try to find a job.”). These three items had a scale range from one (strongly agree) to five (strongly disagree). Thus, since higher numerical scores on these items should indicate stronger negative attitudes, the items assessing attitudes towards gender equality and towards unemployed people were recoded. The fourth item assessed attitudes towards members of other age groups (“How important is it for you to be unprejudiced against people of other age groups?”). 5 This item had a scale range from zero (not at all important) to 10 (extremely important). Thus, this item was also recoded to receive higher numerical scores that indicate more negative perceptions of other age groups. Finally, since the first three items had a different scale range than the fourth item, all items were z-standardized.
Several analytical steps were performed to find the appropriate way of creating the measure. First, a confirmatory factor analysis was conducted with AMOS 6 (Arbuckle, 2005) to test whether the items tap the intended construct comparably among nonimmigrants and immigrants in the different countries. A multigroup comparison model with 48 subgroups (one nonimmigrant and one immigrant group per country) was set up. The enmity index was modeled as a latent factor with the four items as observed indicators. To evaluate the model fit, the χ2 coefficient as well as the standardized root mean square residual (SRMR) and the root mean square error of approximation (RMSEA) were used. A good model fit is indicated by SRMR < .08 and RMSEA < .06 (Hu & Bentler, 1999).
A model constraining the measurement weights (item loadings) on the enmity factor to be equal across the 48 subgroups showed a good overall fit to the data, χ2 = 1,208.50(237), p < .01; RMSEA = .01; SRMR = .04. This implies that the assumption of equal factor structures in each group is compatible with the data. However, examining a model that allowed the measurement weights to vary freely between the groups (a model assuming group differences in the factor structures) showed that in 8 of the 48 subgroups, 1 item (different in each group) loaded too strongly on the factor, which resulted in negative variances. Therefore, the overall fit of such an unconstrained model could not be estimated properly. This indicates that in some of the groups, attitudes toward particular reference groups are more meaningful than others.
To account for these unequal factor loadings in some groups, items were not averaged to a mean scale but were transformed into an index: First, the z-standardized items were summed up. Then, the distribution of the sum score in the total sample was checked, and cutoff points for 10 equal sections of this distribution were calculated. These cutoff points were used to locate each individual on the index ranging from 1 to 10. For example, all individuals with a summed z score of −3.12 or lower received a score of 1 on the index, individuals with a summed z score between −3.12 and −2.27 received a score of 2, and so on. Higher scores on the index indicate higher enmity. The range of the index from 1 to 10 was chosen to make it more comparable to the scaling of the original items. 6
The use of an index instead of a mean scale was based on the formative indicator approach of construct measurement, which has been primarily applied in business and marketing research (e.g., Bollen & Lennox, 1991; Diamantopoulos & Winklhofer, 2001). The basic idea of this approach is that various indicators can be additively combined to “form” a theoretically deduced construct. In the current case, attitudes toward four different groups are additively combined to form the construct of group-focused enmity, which is deduced from the theorization of Zick et al. (2008). Other popular examples are indices of socioeconomic status, combining, for example, unemployment, education, or income (e.g., Hauser, 1973). According to the approach’s rationale, in different individuals or groups, particular indicators of an index can theoretically have stronger weights than others (Bollen & Lennox, 1991). Transferred to the present case, in one country enmity can express itself more with less endorsement of gender equality, and in other countries enmity can express itself more in negative perceptions of unemployed people.
Individual-level predictors
Because attitudes toward gender equality were part of the enmity index, gender was included in all analyses as a control variable. Furthermore, participants’ level of education was included, using a scale based on the International Standard Classification of Education (UNESCO, 2006). The scale ranged from 1 (lowest education level) to 5 (highest education level). Third, an item assessing participants’ household monthly net income was used. This item was z standardized, because in one country (Cyprus) it had a different scale range than in all other countries (see European Social Survey, 2010). 7 Finally, participants’ migration status and origin was included in the model by use of four dummy variables: one for second-generation EU immigrants, first-generation EU immigrants, second-generation non-EU immigrants, and first-generation non-EU immigrants. Nonimmigrants served as the reference category in the analyses.
Results
Descriptives
Table 2 documents means and standard deviations of the cultural value dimensions for each country as well as the means of the total sample and the standard deviations across countries. Most countries were closer to egalitarianism, harmony, or autonomy as opposed to hierarchy, mastery, or embeddedness (mean scores below zero). Importantly, there was still variance between the countries with regard to all three cultural value dimensions. Table 3 shows the means for the individual-level variables (enmity index, education, and income) separately for nonimmigrants, second- and first-generation EU immigrants, as well as second- and first-generation non-EU immigrants. First-generation non-EU immigrants scored highest on the enmity index, and second- and first-generation EU-immigrants scored the lowest (the latter two showing no significant differences). Interestingly, nonimmigrants were significantly less educated than immigrants. Income was highest among second-generation immigrants from both EU and non-EU countries (both not significantly different from each other) and lowest among first-generation immigrants from non-EU countries.
Means and Standard Deviations of the Three Cultural Value Dimensions
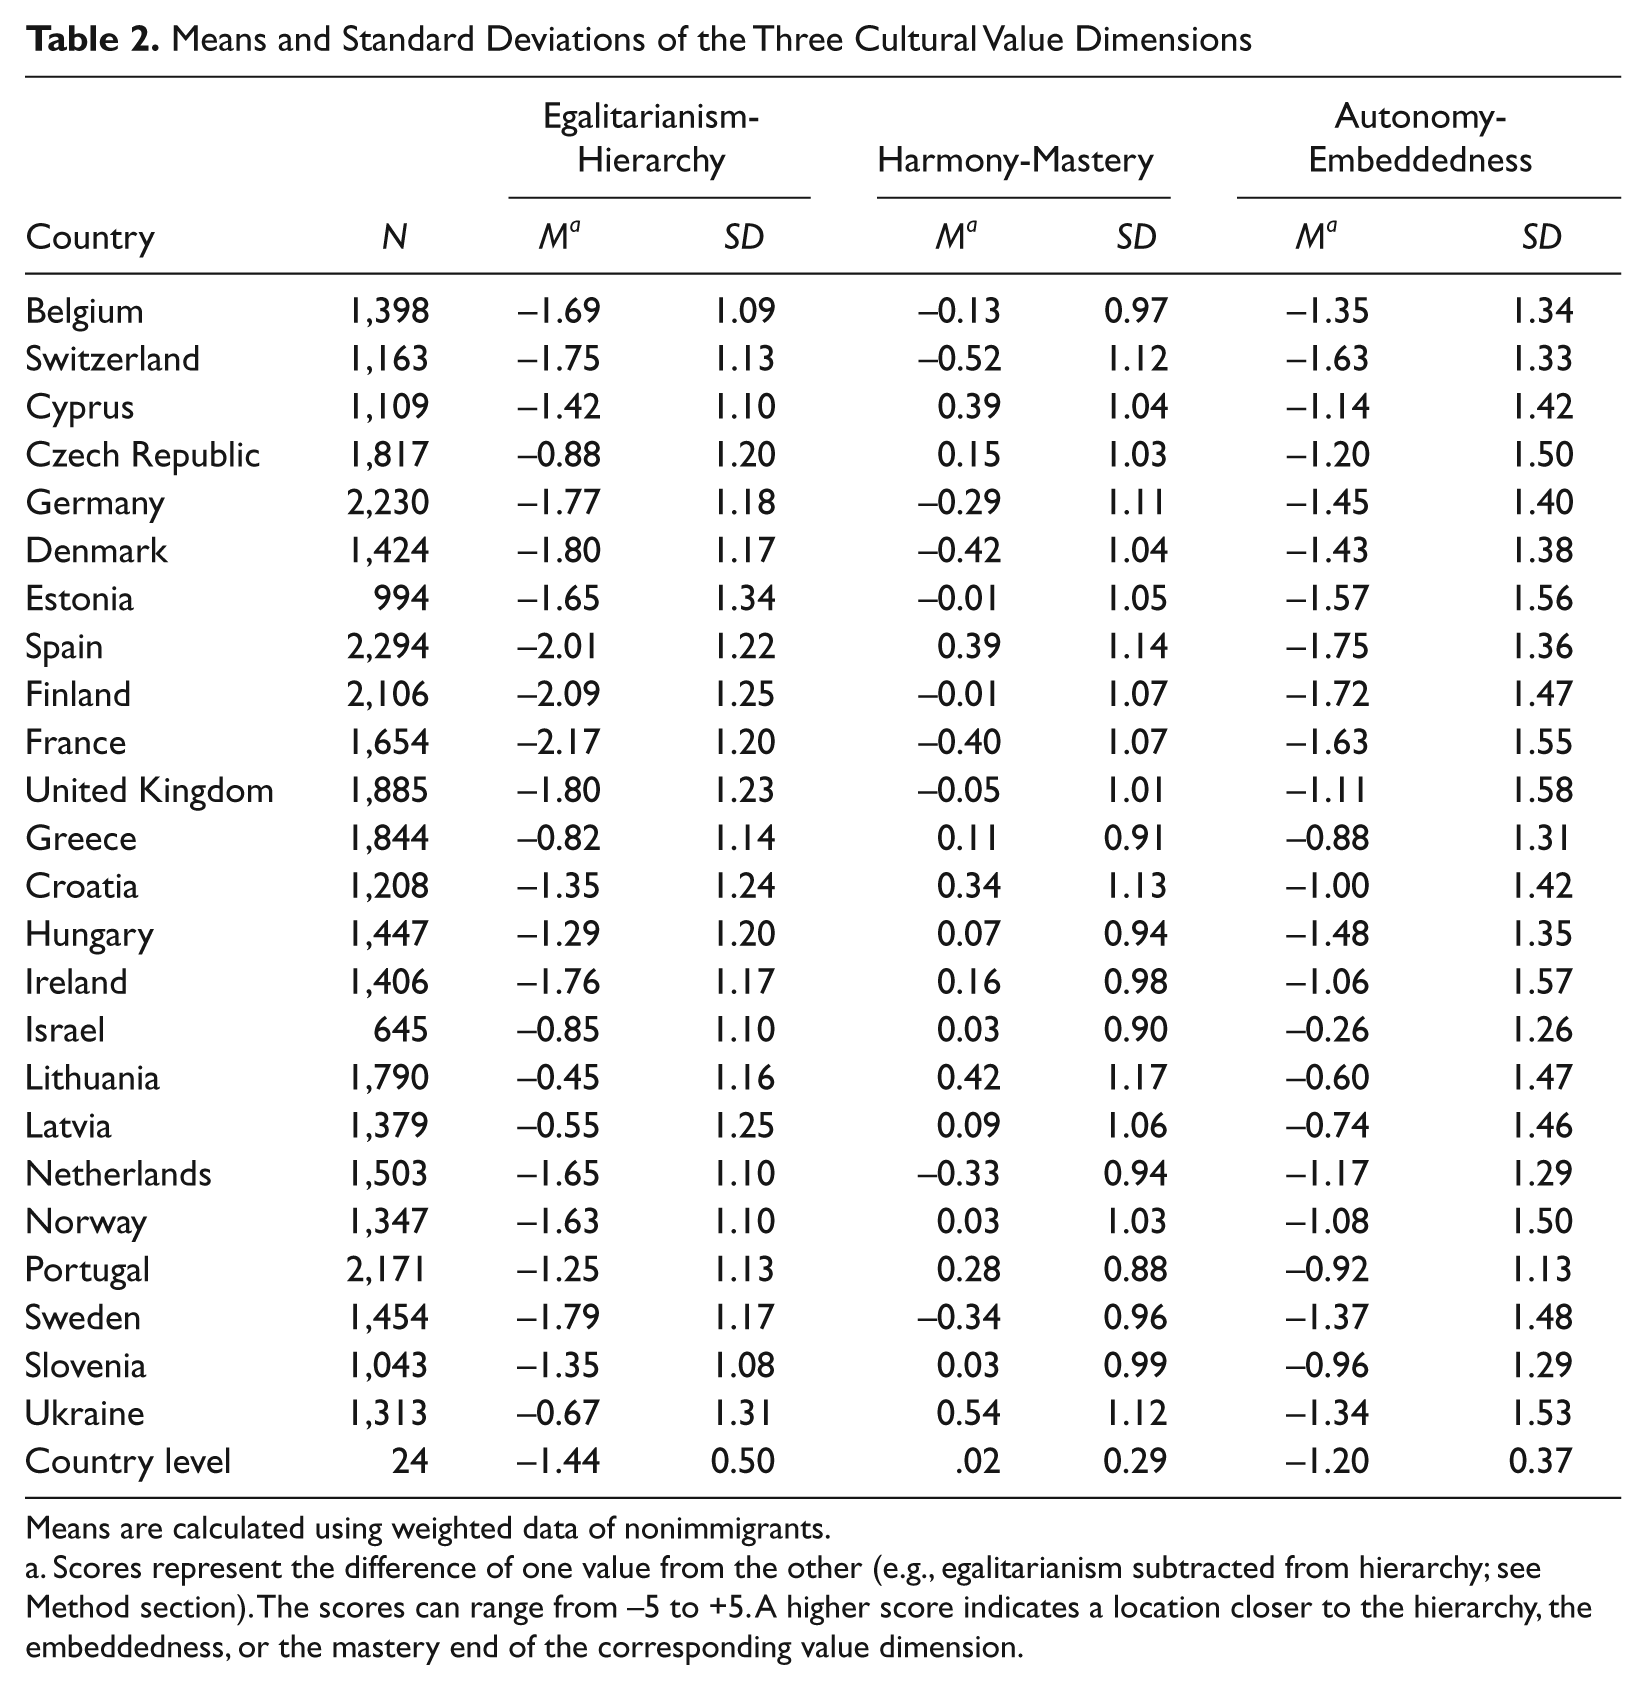
Means are calculated using weighted data of nonimmigrants.
Scores represent the difference of one value from the other (e.g., egalitarianism subtracted from hierarchy; see Method section). The scores can range from −5 to +5. A higher score indicates a location closer to the hierarchy, the embeddedness, or the mastery end of the corresponding value dimension.
Means and Standard Deviations of the Dependent and Control Variables
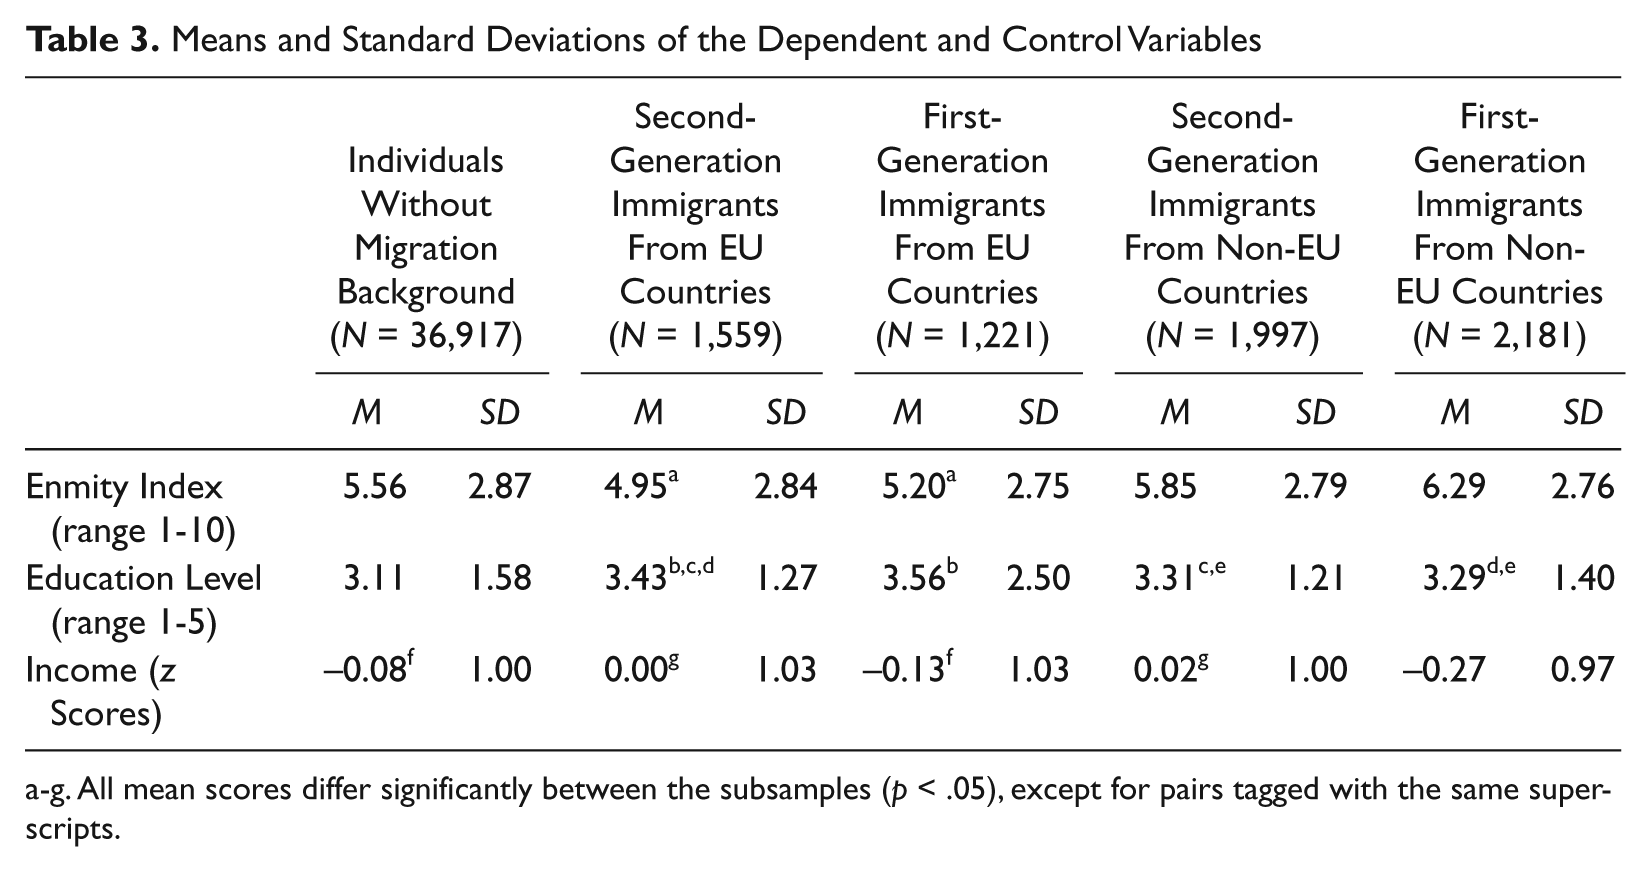
All mean scores differ significantly between the subsamples (p < .05), except for pairs tagged with the same superscripts.
Testing the Hypotheses
Multilevel analyses using HLM 6 (Raudenbush & Bryk, 2002) were performed to examine the predictive power of the individual-level variables (gender, education, income, migration generation, and origin) and the group-level variables (cultural values) on the individuals’ scores on the enmity index as well as cross-level interactions. Beforehand, it was tested what percentage of the overall variance of the enmity index can be attributed to country-specific differences (intraclass coefficient). Belonging to a particular country accounted for 20.36% (p < .01) of the overall variance, indicating that multilevel analyses are worthwhile.
Altogether, seven models were examined. On the individual level, each model contained the four dummy variables representing second-generation EU immigrants, first-generation EU immigrants, second-generation non-EU immigrants, and first-generation non-EU immigrants, as well as the control variables gender, education, and income. At the country level, the cultural value dimensions were included—in different combinations (see below). All models tested whether (a) the countries’ locations on particular cultural value dimensions explain variance in the individuals’ scores on the enmity index and (b) whether cultural values interact with the four individual-level dummy variables representing second-generation EU immigrants, first-generation EU immigrants, second-generation non-EU immigrants, and first-generation non-EU immigrants. Furthermore, interactions with the individual-level control variables of gender, education, and income were examined. For information about the mathematical principle behind HLM, see Raudenbush and Bryk (2002).
Let’s turn to the first three models for the moment: Each contained only one particular cultural value dimension. This separate analysis has been recommended by Schwartz (2003; see also Schwartz, 2007, p. 180) to technically avoid problems associated with multicollinearity and provide for the circumplex structure of value interdependence. Table 4 provides a full documentation of the first three models. The individual-level predictors showed significant relationships with the enmity index. Higher levels of education and income were associated with less negative group-related attitudes. Also, second-generation EU and non-EU immigrants scored significantly lower on the enmity index, and first-generation non-EU immigrants scored higher.
Effects of the Cultural Value Dimensions on the Enmity Index and Interactions With Migration Status and the Control Variables

Coeff = unstandardized effect coefficient; SE = Standard Error; VC = Variance Component.
All three cultural value dimensions were significantly related to the enmity index (significant effects on the intercept, Table 4, 14th row). In countries closer to hierarchy, embeddedness, or mastery, individuals showed more negative group-related attitudes.
Furthermore, the three value dimensions showed a number of interactions with the dummy variables representing immigrants’ generation and origin. Egalitarianism-hierarchy and autonomy-embeddedness interacted with being a first-generation EU immigrant (significant for egalitarianism-hierarchy, marginally significant for autonomy-embeddedness; see Table 4, 20th row) and with being a first-generation non-EU immigrant (significant for both dimensions; Table 4, 22nd row). The latter interaction (non-EU) showed higher coefficients than the former (EU). The dimension harmony-mastery significantly interacted with being a second-generation EU immigrant (Row 19 of Table 4) and less strongly and marginally significantly with being a first-generation non-EU immigrant (Row 22).
Interestingly, cultural values also interacted with the control variables. Egalitarianism-hierarchy significantly interacted with education, and autonomy-embededdness significantly interacted with education and income (e.g., Table 4, 17th row shows a t value of 4.89, p < .01, for the interaction of egalitarianism-hierarchy and education).
Let’s turn now to the subsequent models. These were performed to test how the results change when jointly including either two value dimensions or all three of them. Four additional models were performed: One included the dimension egalitarianism-hierarchy and autonomy-embeddedness, a second one combined egalitarianism-hierarchy and harmony-mastery, a third one embeddedness-autonomy and harmony-mastery, and a fourth one comprised all three value dimensions. Table 5 gives an abridged overview of the central coefficients (direct effects on enmity and interactions with the dummy variables resembling migrants’ generation and origin).
Models Including Two or All Three Cultural Value Dimensions (Overview Over Central Coefficients)
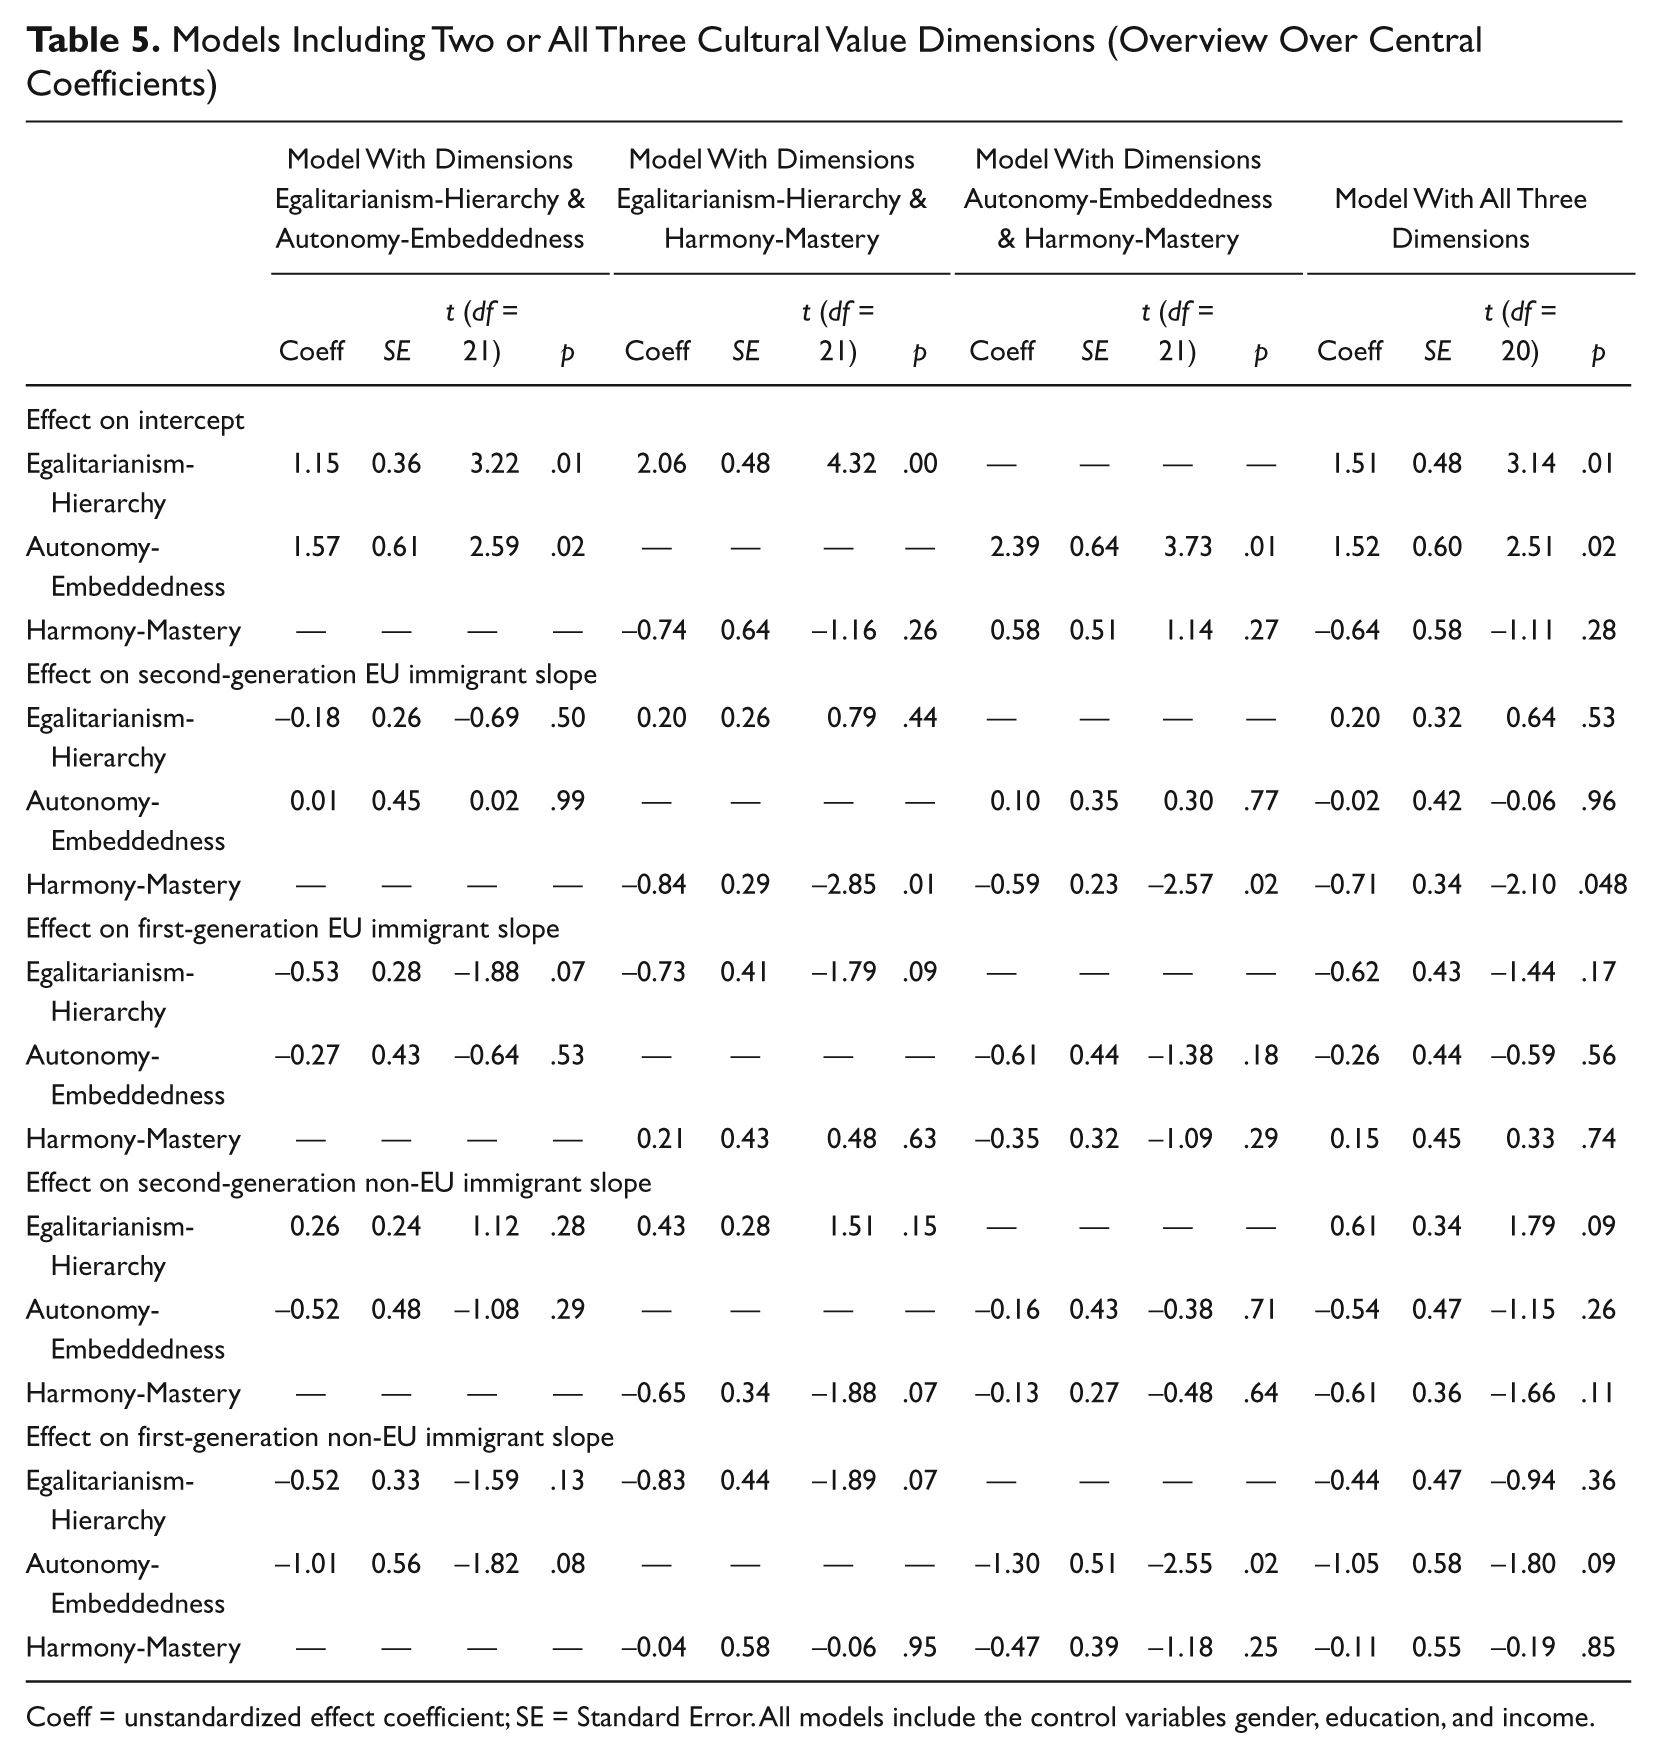
Coeff = unstandardized effect coefficient; SE = Standard Error. All models include the control variables gender, education, and income.
As can be seen from the table, the combined models revealed only a few significant effects: Regarding the direct effects on enmity, egalitarianism-hierarchy and autonomy-embeddedness remained significant predictors, no matter how they were combined with the other dimensions. Harmony-mastery, in turn, did not reach significance when adding one or two of the other dimensions. Regarding the interactions of cultural values with the four dummy variables, only four coefficients were significant: In three of the four combined models, the harmony-mastery dimension interacted with being a second-generation EU immigrant. In addition, in the model combining autonomy-embeddedness and harmony-mastery, autonomy-embeddedness interacted with being a first-generation non-EU immigrant.
The interaction of harmony-mastery with being a second-generation EU immigrant was the most consistent. Therefore, Figure 1 additionally illustrates the co-variation of harmony-mastery and enmity separately for all five subgroups. Similar trends can be seen for all groups. The curves of nonimmigrants and second-generation EU immigrants (for which the interaction was consistently significant) deviate most strongly in the Scandinavian samples of Finland, Denmark, and Norway, but also in the samples of Spain, Greece, and Israel. Note that the curve for first-generation non-EU immigrants shows the smallest variations across countries.
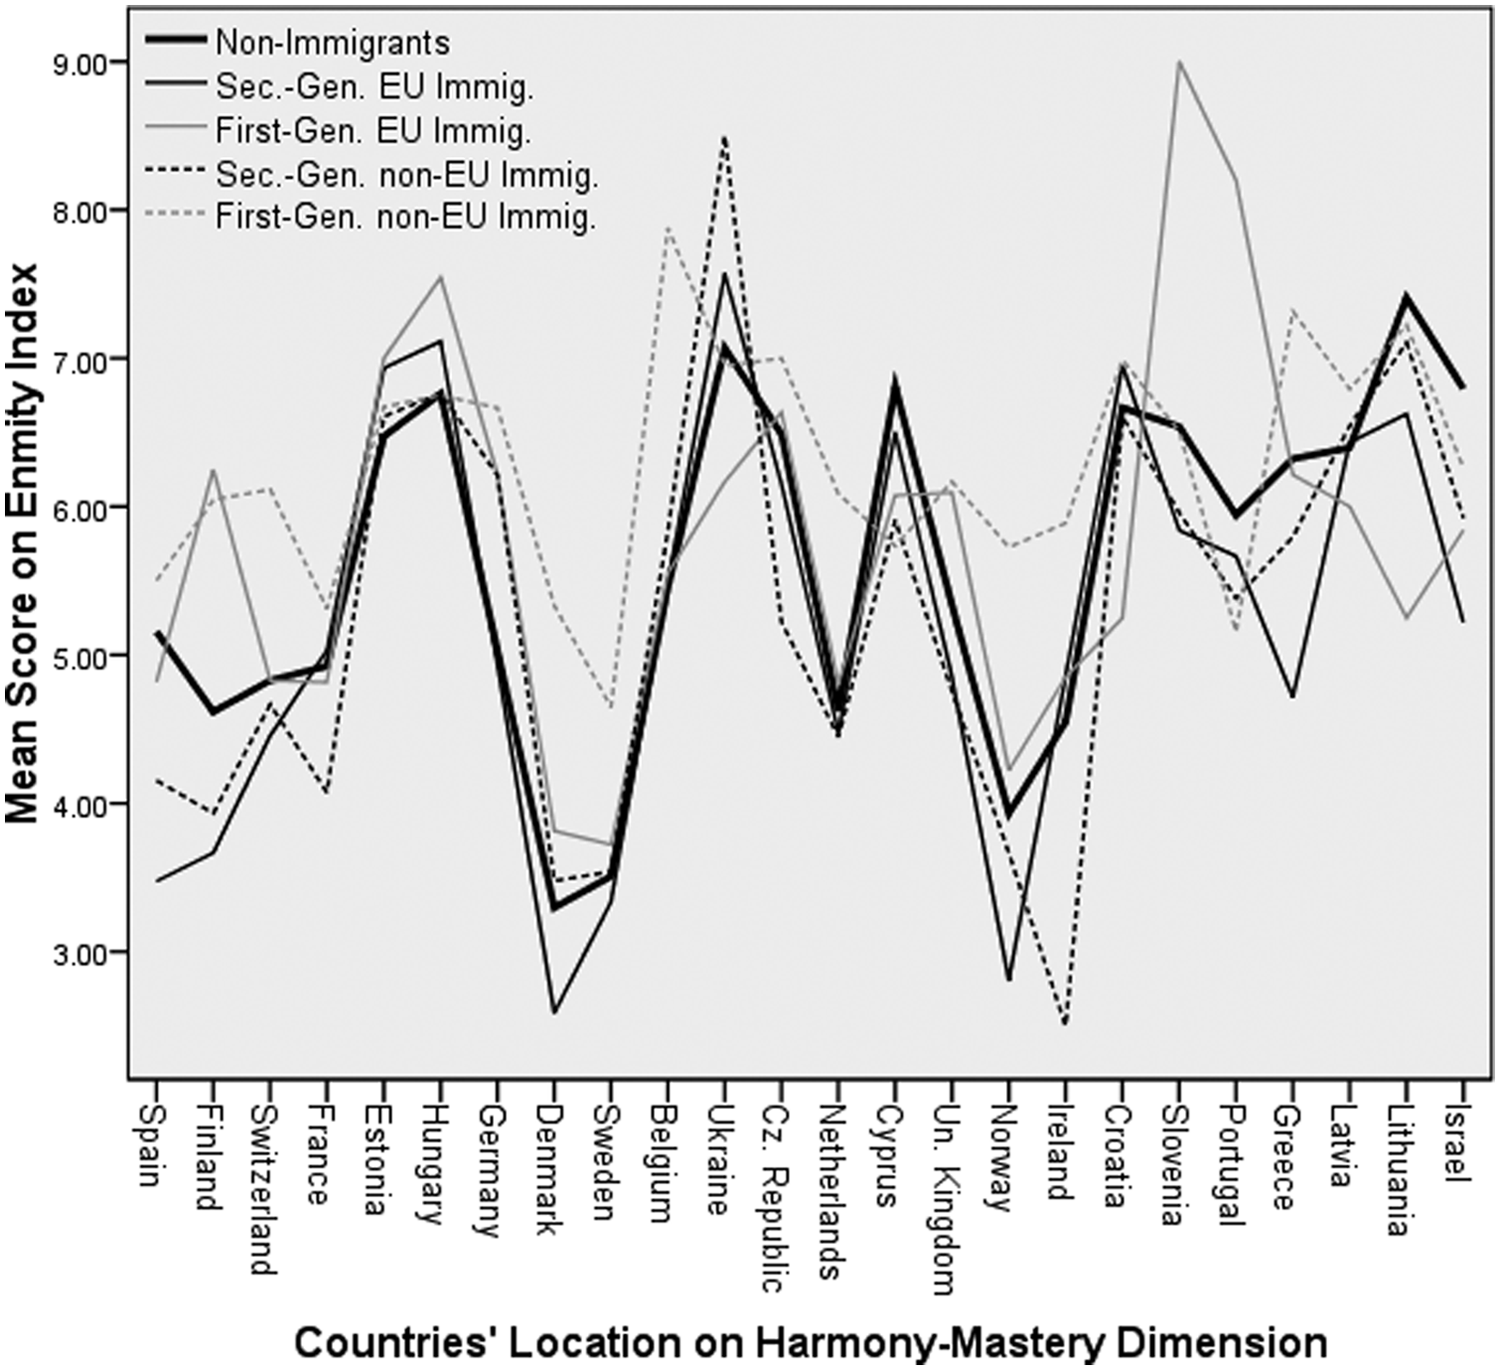
Comparison of Nonimmigrants with Second- and First-Generation Immigrants From EU and Non-EU Countries Regarding the Relationship Between the Cultural Value Dimension Harmony-Mastery and Enmity
To summarize, Hypothesis 1 was confirmed by the models that included only one particular cultural value dimension. Here, all three dimensions relate to the enmity index as predicted. Hypotheses 2 and 3 also received support in these models, with some specifications: The relationships of the cultural value dimensions of egalitarianism-hierarchy and autonomy-embeddedness with the individuals’ enmity were weaker among first-generation immigrants (but not among second-generation immigrants) compared to nonimmigrants. This is especially true for first-generation immigrants from non-EU countries. The relationship between the harmony-mastery dimension and individuals’ enmity, in turn, was weaker among second-generation EU immigrants compared to nonimmigrants and, with less strong coefficients, among first-generation non-EU immigrants.8,9
In models jointly including one or two value dimensions, harmony-mastery was no significant predictor of enmity anymore. However, it appeared to be the only dimension that showed consistent interactions with being a (second-generation EU) immigrant.
Discussion
The present study tested whether cultural values of a country are associated with group-related attitudes of its individuals (Hypothesis 1). Furthermore, it was assumed that this relationship is stronger among nonimmigrants compared to immigrants, since the latter are partly socialized in another cultural environment and thus less strongly guided by the host country’s value climate (Hypothesis 2). This assumption was further differentiated. It was expected that first-generation immigrants are even less affected by the host country’s cultural values than second-generation immigrants and that immigrants from a culturally more distant country (non-EU immigrants) are even less affected than immigrants from a culturally closer country (EU immigrants) (Hypothesis 3).
Hypothesis 1 received support. In models that examined the three value dimensions separately, all dimensions related to the measurement of group-related attitudes used in this study. Models combining more than one value dimensions especially proved the dimensions of egalitarianism-hierarchy and autonomy-embeddedness to be substantial predictors. Hypotheses 2 and 3 also received support, but with some specifications: In models analyzing the value dimensions separately, the effects on enmity were found to be weaker among first-generation immigrants. For immigrants of the second generation, effects were not different from those for nonimmigrants. The only exception concerned the relationship between harmony-mastery and the enmity index, which was significantly weaker among second-generation EU immigrants. The result pattern shows that the differentiation between immigrants’ generation was worthwhile. Second-generation immigrants not only seemed to be stronger affected by the host country’s cultural values than first-generation immigrants, but by and large, they even seemed to be guided by the host country’s values as strongly as the nonimmigrant population. This supports previous studies showing that immigrants’ generational status has important implications in terms of adapting to the receiving country (e.g., Birman, 2006; Kwak, 2003). As has been reviewed in the introduction, second-generation immigrants more easily adopt the values of the receiving country, due to their life-long exposure to these values (Hwang, 2006; Phinney et al., 2000).
In models combining more than one cultural value dimensions, all but one interaction of cultural values with being an immigrant lost significance. This might be associated with multicollinearity, since the circumplex structure of cultural values implies substantial interrelations between the three dimensions. Interestingly, however, the interaction between the mastery-harmony dimension and being a second-generation EU immigrant “survived” the inclusion of more than one value dimension, pointing to a stronger relevance of this interaction. It does, however, contradict the previous discussed results, because it implies weaker effects among second- instead of first-generation immigrants. This contradicting finding shows that additional studies with other available samples and measures (e.g., the Schwartz Value Survey; see Schwartz, 2006) are required to corroborate the assumptions made in this article. Still, it supports the assumption of weaker effects among immigrants compared to nonimmigrants.
The results call for a further examination within the framework of acculturation research. Besides generational status and origin, the role of individual acculturation strategies for the adoption of cultural values should be of interest for future research. Berry (e.g., 2005) proposes four acculturation strategies—integration, separation, assimilation, and marginalization—resulting from the degree to which individuals incorporate either the culture of origin, the host culture, both, or none into their selves. Assumingly, migrants that pursue a separation strategy are less strongly guided by the host society’s cultural values compared to individuals favoring assimilation or integration. Unfortunately, the ESS Round 4 data do not provide appropriate measures of acculturation. Further studies should examine the role of individual acculturation strategies using multidimensional measures of orientation toward both the heritage and the host cultural group (see, e.g., Tsai, Ying, & Lee, 2000).
Individuals with lower education and income scored higher on the enmity index. Such a relationship has often been interpreted in terms of relative deprivation, described as a perceived lack of resources relative to other individuals or groups (Walker & Smith, 2002). When individuals perceive relative deprivation, they can react dismissively towards the particular reference groups or individuals (e.g., Pettigrew, Christ, Meertens, van Dick, & Zick, 2008; Tripathi & Srivastava, 1981). Interestingly, in the present data education and income partly interacted with cultural values. Education and income was less strongly related to group-related enmity in countries closer to egalitarianism and autonomy. Perhaps, in more egalitarian and autonomous countries, individuals who perceive relative deprivation are less likely to show stronger group-related enmity, because it is generally more normative to be open and tolerant toward other groups. In more hierarchical or embedded countries where differences in group status are more normative, deprived individuals are more prone to show group-related enmity. The present study cannot clarify whether this is the case. To shed light on this issue, one would need more accurate measures of relative deprivation, such as the subjective perception of personal and collective deprivation in different domains and corresponding appraisals and feelings (see, e.g., Pettigrew et al., 2008).
Limitations
The study used aggregated individual-level scores from the ESS data to measure country-level cultural values instead of scores already provided by Schwartz (e.g., 1994) based on student and teacher samples. Preference was given to this procedure, since the ESS country samples are in the author’s view more representative than samples of students and teachers. Still, although controlled for in an extra analysis (see Note 8), it can be argued that in the current data nonimmigrants are more strongly affected by cultural values because these are the individuals from which the cultural values were aggregated. Ideally, one should have used data from different individuals of the same countries, at best from an earlier time. However, previous rounds of the ESS did not yet include all countries represented in Round 4. Nevertheless, correlations between the cultural values scores of Round 4 countries with the respective scores from countries that were also part of Round 3 (collected among different people) showed strong relationships (r > .90, see also Fischer, in press). Thus, the effects would have been comparable when deriving cultural value scores from different individuals.
The hypotheses were tested controlling for education and income. Still, one aspect worth considering is that in the present data immigrants were on average educated more highly and partly had higher incomes than nonimmigrants. This is somewhat counterintuitive given that immigrants are often described as having a lower socioeconomic status (e.g., Aycan & Berry, 1996; Nielsen & Krasnik, 2010). A closer inspection of the country samples showed that many immigrants originate from neighbor states. For example, the largest group in the German sample comes from Poland and in the Danish sample from Germany. Furthermore, Table 1 shows that in half of the country samples most immigrants come from EU countries. In the other half the majority are non-EU immigrants but still originate from countries of the European continent or surrounding areas (e.g., most immigrants to Estonia or Finland come from the Russian Federation or Belarus). This indicates that the immigrant participants of the ESS are primarily labor migrants from EU or neighbor states instead of, for example, refugees or individuals immigrating for economic reasons. Fleischmann and Dronkers (2010) reported a similar pattern in the ESS Round 2 data. They showed that compared to immigrants from other world regions, those coming from Europe have higher employment rates in the host countries, due to higher living standards in the heritage countries. However interpreted, it has to be kept in mind that higher status immigrants have been found to be more adapted to the host society (Negy & Woods, 1992; Shen & Takeuchi, 2001). Hence, one can assume that the higher status immigrants in the present data are more strongly guided by the host society’s cultural values compared to low-status immigrants, because they are more adapted to the host society. Presumably, differences between immigrants and nonimmigrants would have even been greater if one had had a more representative sample of immigrants in each country.
Conclusion
The present study provided further validation of Schwartz’s (e.g., 2006) cultural value theory by showing that the relationship between countries’ cultural values and group-related attitudes of the individuals in these countries is stronger among nonimmigrants compared to immigrants, because the latter are additionally exposed to cultural values originating from their country of origin. The study brings a new perspective into acculturation research by showing that acculturation can also be approached by examining the degree to which immigrants are guided by the cultural values of the host society. Future research should examine the role of individual acculturation strategies, ideally using immigrant samples that are more representative of the particular country.
Footnotes
Declaration of Conflicting Interests
The author(s) declared no potential conflicts of interest with respect to the research, authorship, and/or publication of this article.
Funding
The author(s) received no financial support for the research, authorship, and/or publication of this article.