



Abstract
The current study tested the relation between culture and cyberbullying using a short-term longitudinal research design. College-aged participants from the United States (n = 293) and Japan (n = 722) completed several questionnaires at Wave 1 that measured cyberbullying frequency, cyberbullying reinforcement, positive attitudes toward cyberbullying, and interdependent self-construal. Approximately 2 months later, participants completed the cyberbullying frequency questionnaire again. Results showed higher levels of cyberbullying change for the U.S. sample compared with the Japanese sample. Follow-up analyses showed that cyberbullying reinforcement and interdependent self-construal moderated this effect. Specifically, cyberbullying change was the highest (showing an increase over time) for the U.S. sample when reinforcement was highest and when interdependent self-construal was the lowest. Theoretical implications are discussed.
The methods by which people harm others evolve with changes in, and in access to, technology. For instance, Anderson and Huesmann (2003) noted that the availability of handguns and other fire arms is associated with higher homicide rates. In today’s technological culture, information, and entertainment media are converging. People browse the Internet, watch movies, and even write on blogs from their cellular telephones. Such convergence and the development of new social media (e.g., Instant Messaging, Facebook) have given aggressors a “new” method to cause harm, termed cyberbullying. Cyberbullying has been defined as “ . . . bullying and harassment of others by means of new electronic technologies . . . ” (Cost, 2012), which extends the definition of traditional bullying (e.g., Olweus, 1999) by adding a technology component. Individuals can send unkind text messages and emails, post secrets about another for public viewing, and even upload embarrassing photos/videos of others all with the intent to harm others. Even respectable information sites, such as Wikipedia, can be used to disseminate false, harmful information about others. Recent statistics suggest that cyberbullying is a major problem. Survey findings show that 11% of youth engage in cyber-aggression regularly, 47% have witnessed cyber-aggression, and 29% reported being cyber-victimized (Patchin & Hinduja, 2006), further validating the need to continue to study what factors predict cyberbullying behavior.
Being able to predict cyberbullying behavior has important implications, both theoretically and practically. Several studies have found that those who are cyber-victimized experience a wide array of negative psychological and behavioral outcomes. For instance, research has found that cyber-victims are more likely to feel angry (Dehue, 2008), fearful (Beran & Li, 2006), sad (Patchin & Hinduja, 2006), have problems in school (Beran & Li, 2007), and engage in aggressive behaviors (Hinduja & Patchin, 2008). The purpose of the current research is to test several theoretically identified risk factors as predictors of cyberbullying behavior, and to examine the hypothesis that cultural self-construals moderate the relations between the predictors of cyberbullying and cyberbullying change using a short-term longitudinal design.
Theoretical Framework and Cyberbullying
The literature on cyberbullying is relatively new, and the majority of this research has been mostly atheoretical and descriptive. Recently, Barlett and Gentile (2012) made specific predictions regarding the predictors of cyberbullying derived from several social-cognitive models of learning and aggression (the General Learning Model: Buckley & Anderson, 2006; Gentile et al., 2009; and General Aggression Model: Anderson & Bushman, 2002). Their model posits that cyberbullying frequency largely results from common learning mechanisms. Each successful cyberbullying encounter is a learning trial, in which individuals likely learn that cyberbullying is an appropriate aggressive action. Barlett and Gentile (2012) posited that, through such learning, cyberbullies likely learn that (a) there is often little immediate consequences for the online aggressor, (b) cyberbullying tactics may be more anonymous than traditional bullying methods (e.g., Barlett & Gentile, 2012; Vandebosch & Van Cleemput, 2008), and (c) the traditional power imbalance between a traditional bully–victim dyad is decreased or shifted (even weaker people can cyberbully with technology; Vandebosch & Van Cleemput, 2008). Continued positively reinforced experiences and learning trials with cyberbullying are related to the development of positive attitudes toward cyberbullying, which directly predict cyberbullying frequency. In support of their theory, Barlett and Gentile (2012) found (a) significant positive correlations between cyberbullying frequency, positive attitudes toward cyberbullying, positive attitudes toward anonymity and lack of power differential; (b) cyberbullying and cyber-victimization remained relatively stable over time; and (c) positive attitudes toward cyberbullying and cyberbullying reinforcement mediated the stability in cyberbullying frequency.
Possible Cultural Differences in Cyberbullying
There are reasons to expect that the aforementioned theoretical underpinnings in cyberbullying frequency may differ between samples in the United States and Japan. In European American cultural contexts, most people are primed with and reinforced for behaving consistent with an independent self-construal (viewing the self as separate from the social context and emphasizing autonomy; Singelis, 1994). However, in Japanese cultural contexts, most people are primed with and reinforced for behaving consistent with an interdependent self-construal (viewing themselves within the broader social context; Singelis, 1994). Research has shown that such different self-construals influence a variety of social behaviors, including aggression. For instance, individuals primed with an interdependent self-construal are more likely to pay attention to situational contexts compared with individuals primed with independent self-construal (e.g., Masuda & Nisbett, 2001). Thus, after a provocation, interdependent individuals may assume some situational factors caused the provocation to occur (“they are having a bad day”), whereas those with primed independent self-construals likely assume some personality factors caused the provocation (“he/she is a jerk”) and may retaliate aggressively. Furthermore, those with primed interdependent self-construals process emotional information from the perspective of others, whereas those primed with an independent self-construal gather emotional meaning about situations from their own perspective (Mesquita & Leu, 2007). Finally, relevant research suggests that direct and indirect aggression is lower in countries that encourage interdependent self-construals compared with countries that encourage independent self-construals (e.g., Bergeron & Schneider, 2005; Cross & Madson, 1997).
Therefore, one might hypothesize that participants from the United States would engage in more hurtful cyber-behaviors (i.e., cyberbullying) than participants from Japan. Alternatively, one might hypothesize the opposite effect for two reasons: the greater access to cyberbullying technology in Japan and the ability of cyberbullying to be conducted privately. Because cyberbullying happens in the mediated world, high-technology countries that encourage interdependent self-construals, like Japan, may have more accessibility and opportunity to cyberbully. Japan outranks the United States in terms of technological development. Indeed, Florida et al. (2011) showed that Japan outranked the United States in global technology rankings (an index based on financial resources devoted to research and development, the share of human resources devoted to research and development, and number of patents per capita). The present data set allows us to test two competing hypotheses:
Despite the paucity of research testing cross-cultural cyberbullying differences (specifically variables that moderate any cross-cultural differences), research has shown that cyberbullying is a worldwide problem. Although the questionnaires used to assess cyberbullying differs (and clearly impacts frequency rates; Rivers & Noret, 2010), cyberbullying has been observed in several studies conducted with samples from the United States (e.g., Patchin & Hinduja, 2006), Canada (e.g., Beran & Li, 2006), China (e.g., Li, 2009), Singapore (e.g., Ang, Tan, & Mansor, 2010), Turkey (Cetin, Yaman, & Peker, 2011), England (e.g., Smith et al., 2008), Switzerland (Perren, Dooley, Shaw, & Cross, 2010), Spain (Calvete, Orue, Estevez, Villardon, & Padilla, 2010), and other countries. Li (2009) sampled participants from both China (culture that emphasizes interdependence) and Canada (culture that emphasizes independence) and showed that 15% of Canada participants were classified as cyberbullies compared with 7% from the Chinese sample. Although important, this research did not test cross-cultural differences in cyberbullying change, did not use a longitudinal design, and did not test what variables moderate cyberbullying change using a theoretical approach.
Longitudinal Cyberbullying Research
To date, the majority of the research on predicting cyberbullying has been cross-sectional (or correlational), limiting the conclusions in several ways. First, because temporal precedence is not observed, correlational data cannot be used to make causal claims. Second, cross-sectional data cannot assess change in several outcomes of interest. Longitudinal research designs correct for both these shortcomings. At the time of publication, we were aware of only three longitudinal studies testing the predictors of cyberbullying. Jose, Kljakovic, Scheib, and Notter (2012) tested the cross-lagged relations between traditional bullying, cyberbullying, traditional victimization, and cyber-victimization measured 1 year apart (hence a two-wave longitudinal study). Results showed that Wave 1 traditional and cyberbullying frequencies significantly predicted Wave 2 cyberbullying. No other predictors were tested. Also using a two-wave longitudinal study, Fanti, Demetriou, and Hawa (2012) found that Wave 1 narcissism, traditional bullying, and cyber-victimization predicted Wave 2 cyberbullying frequency (1 year later). Finally, Barlett and Gentile (2012; Study 2) used a short-term longitudinal study and found (a) strong stability in cyberbullying over time, (b) that positive attitudes toward cyberbullying mediated this stability, and (c) cyberbullying reinforcement also mediated the stability in cyberbullying over time. The need for additional longitudinal research in the cyberbullying literature is dire, and the current study further tests such longitudinal relations. Akin to Barlett and Gentile (2012), the current study used a short-term longitudinal study in order to test what variables predict cyberbullying change over time. One variable that has been understudied in the literature and absent from longitudinal analysis is culture.
Overview of the Current Study
The purpose of the current study was to test what variables are related to changes in cyberbullying behavior using a short-term longitudinal design. We chose to use a longitudinal design to assess change in cyberbullying behavior and test possible moderating variables in any changes in cyberbullying frequency over time. This method is preferred over single time-point cross-sectional research designs, because causal claims can be made regarding the relation between variables assessed at Wave 1 and Wave 2, as temporal precedence is observed (Baron & Kenny, 1986). In the current study, participants completed several questionnaires used to assess cyberbullying frequency, cyberbullying reinforcement, positive attitudes toward cyberbullying, and interdependent self-construal. Approximately 2 months later, participants completed the cyberbullying frequency measure again.
Derived from the previous literature and the theoretical postulations of the Barlett and Gentile (2012) distal model, we predicted that culture would moderate the relationships between several Wave 1 predictor variables (e.g., cyberbullying attitudes, cyberbullying reinforcement, and interdependent self-construal) and Wave 2 cyberbullying frequency. The hypothesized main effects of the predictor variables on cyberbullying frequency have already been elaborated on; however, as previously mentioned, it is unclear how culture will affect the direction and strength of the slopes of these relations. At one level, because Japan is more technologically advanced relative to the United States, the effects may be stronger for Japanese participants. At another level, the effects may be strongest for the U.S. sample, because of the previously mentioned differences in self-construals.
Method
Participants
Samples were gathered from both the United States and Japan. Overall, 980 (54% female) undergraduate students participated in both waves of data collection in the current study. The average age of the entire sample was 20.51 (SD = 2.00) years. The majority (53%) were in their 1st or 2nd year of undergraduate education. The Japanese sample (n = 722; 50% female) had an average age of 20.92 (SD = 1.69) years. The U.S. sample (n = 258; 69% female) had an average age of 19.35 (SD = 2.33) years. In addition, for the U.S. sample, the ethnocultural breakdown was 225 Euro-American, 6 African American, 7 Latino/a, 5 multiracial, and 15 participants classified as “Other.”
Materials 1 and Procedure
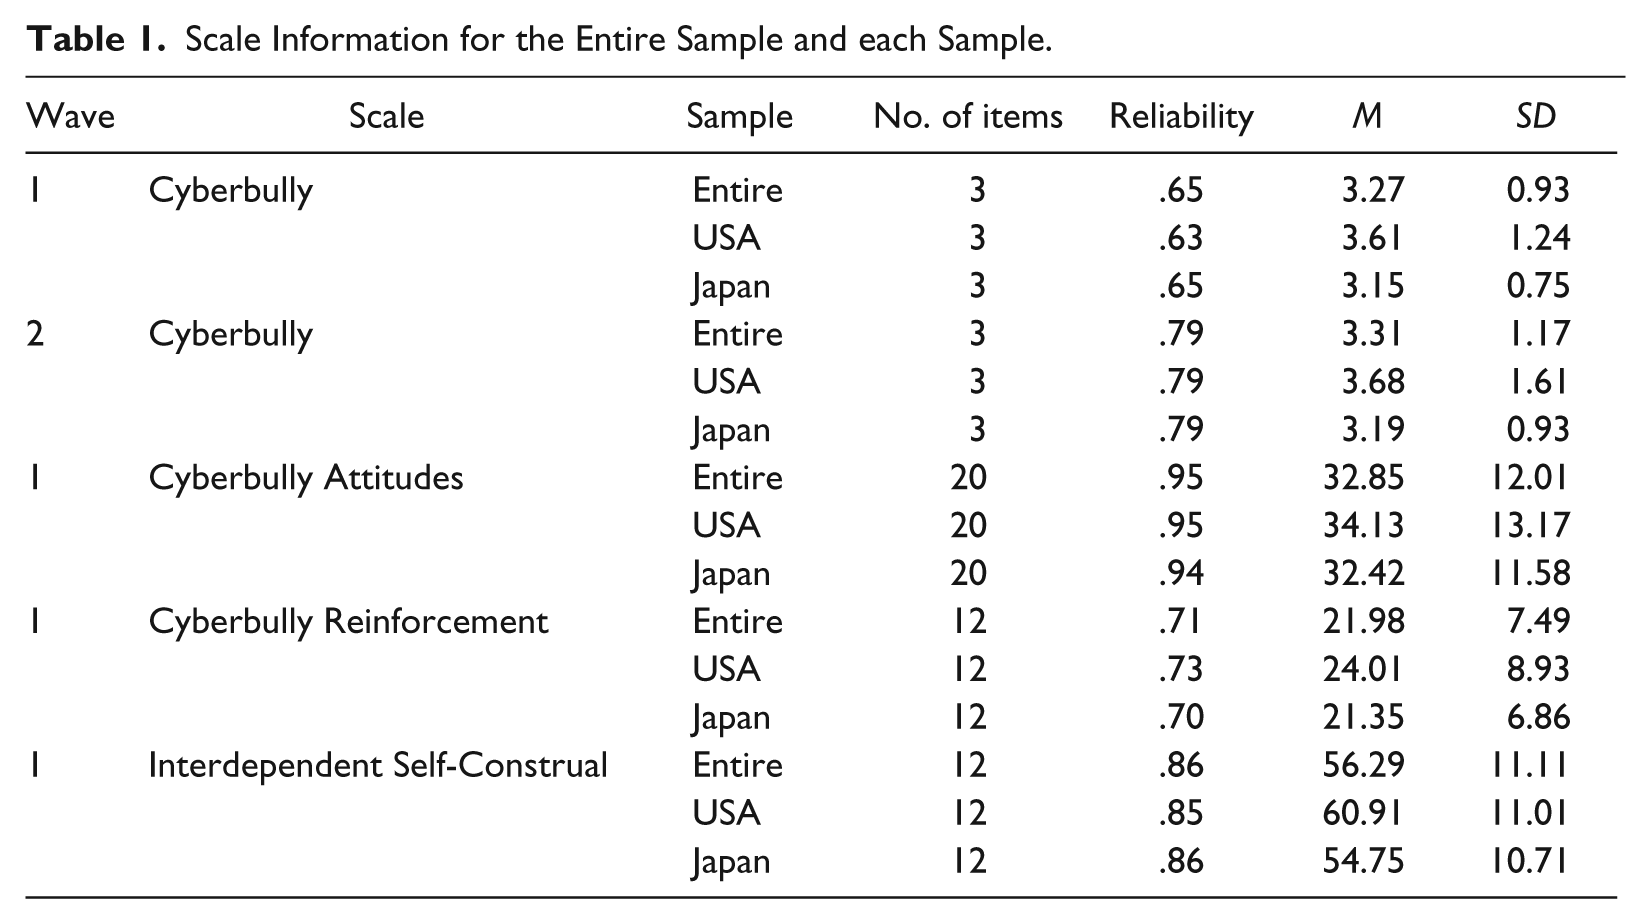
Data were collected as a part of a much larger cyberbullying study. Upon completion of the informed consent, participants completed the following questionnaires 2 (Table 1 displays the reliabilities and general information for these scales):
Scale Information for the Entire Sample and each Sample.
Cyberbullying behaviors
The Ybarra, Diener-West, and Leaf (2007) cyber behavior questionnaire was used to assess cyberbullying frequency. This scale consisted of three items and asked participants how often they cyberbullied others in the last year on a 1 (never) to 6 (everyday/almost every day) rating scale. Items were summed such that higher scores indicate higher cyberbullying. A sample item includes “Made rude comments or mean comments to anyone online.”
Cyberbullying reinforcement
The Cyberbullying Reinforcement Scale (CRS; Barlett & Gentile, 2012) was used to assess the extent to which individuals are positively reinforced by their friends and family for aggressing using technology. This is a 12-item questionnaire that asks participants to indicate their level of agreement with the questions on a 1 (not at all) to 7 (extremely) rating scale. Certain items were reverse scored and summed such that higher scores indicate higher levels of cyberbullying reinforcement. A sample item includes, “My friends and I both get satisfaction from being mean to others online.”
Positive attitudes toward cyberbullying
The Positive Attitudes Toward Cyberbullying Questionnaire (PACQ) was used to assess the extent to which participants feel positively about cyberbullying others. This is a 20-item questionnaire that has participants indicate their level of agreement with the items on a 1 (strongly disagree) to 5 (strongly agree) rating scale. These items are summed such that higher scores indicate more favorable attitudes toward using cyberbullying tactics. A sample item includes, “When provoked, it is acceptable to retaliate using the Internet, emails, or text messages.”
Interdependent self-construal
The Interdependent Self-Construal subscale of the Independent/Interdependent Self-Construal Scale (Singelis, 1994) was used to assess how much participants identified with being interdependent. We used only this subscale because, at a theoretical level, should be a stronger predictor of cyberbullying than the independent subscale. This is a 12-item subscale that has participants indicate their level of agreement with the items on a 1 (strongly disagree) to 7 (strongly agree) rating scale. A sample item includes, “I should take into consideration my parents’ advice when making education/career plans.” Certain items were reverse scored and then summed, such that higher scores indicate higher levels of interdependent self-construal.
Demographics
A demographic questionnaire was used to assess sex, ethnicity, age, and other relevant information.
Approximately 2 months later, participants completed a modified version of the Ybarra et al. (2007) Cyberbullying subscale again and then were thanked and fully debriefed. We modified the instructions of the scale to read “How often have you done the following things in the past two months.”
Results
Testing Differences Between Samples and Sex
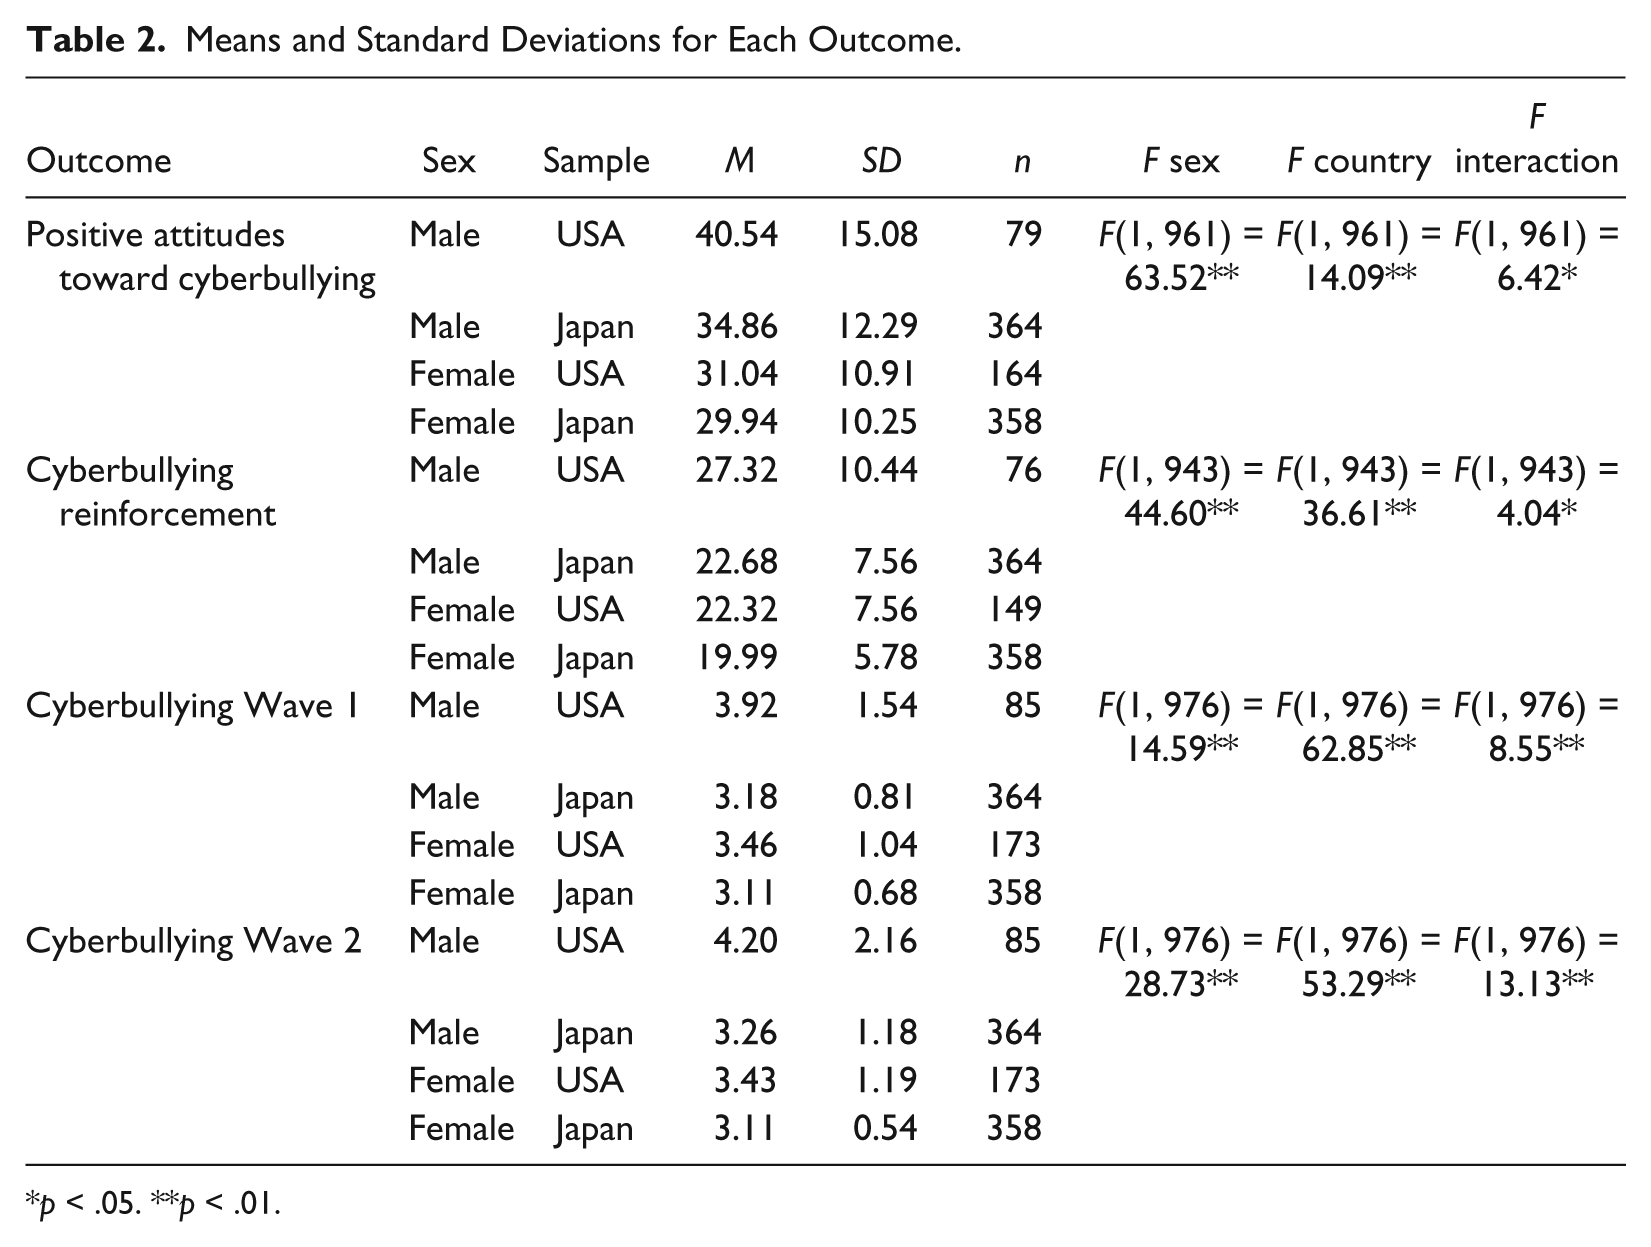
To test differences between culture, sex, and the interaction on relevant variables, several 2 (sex) × 2 (country) ANOVAs were conducted. The results are displayed in Table 2. In all analyses, results showed significant main effects for country and sex. Examination of the means showed that, on average, males tended to have higher scores on all outcomes. In addition, on average, participants from the United States (vs. Japan) scored higher on all outcomes. However, these main effects were qualified by significant Sex × Country interactions for all outcomes. In all cases, the difference between the United States and Japan means was larger for males than for females.
Means and Standard Deviations for Each Outcome.
p < .05. **p < .01.
Zero-Order Correlations
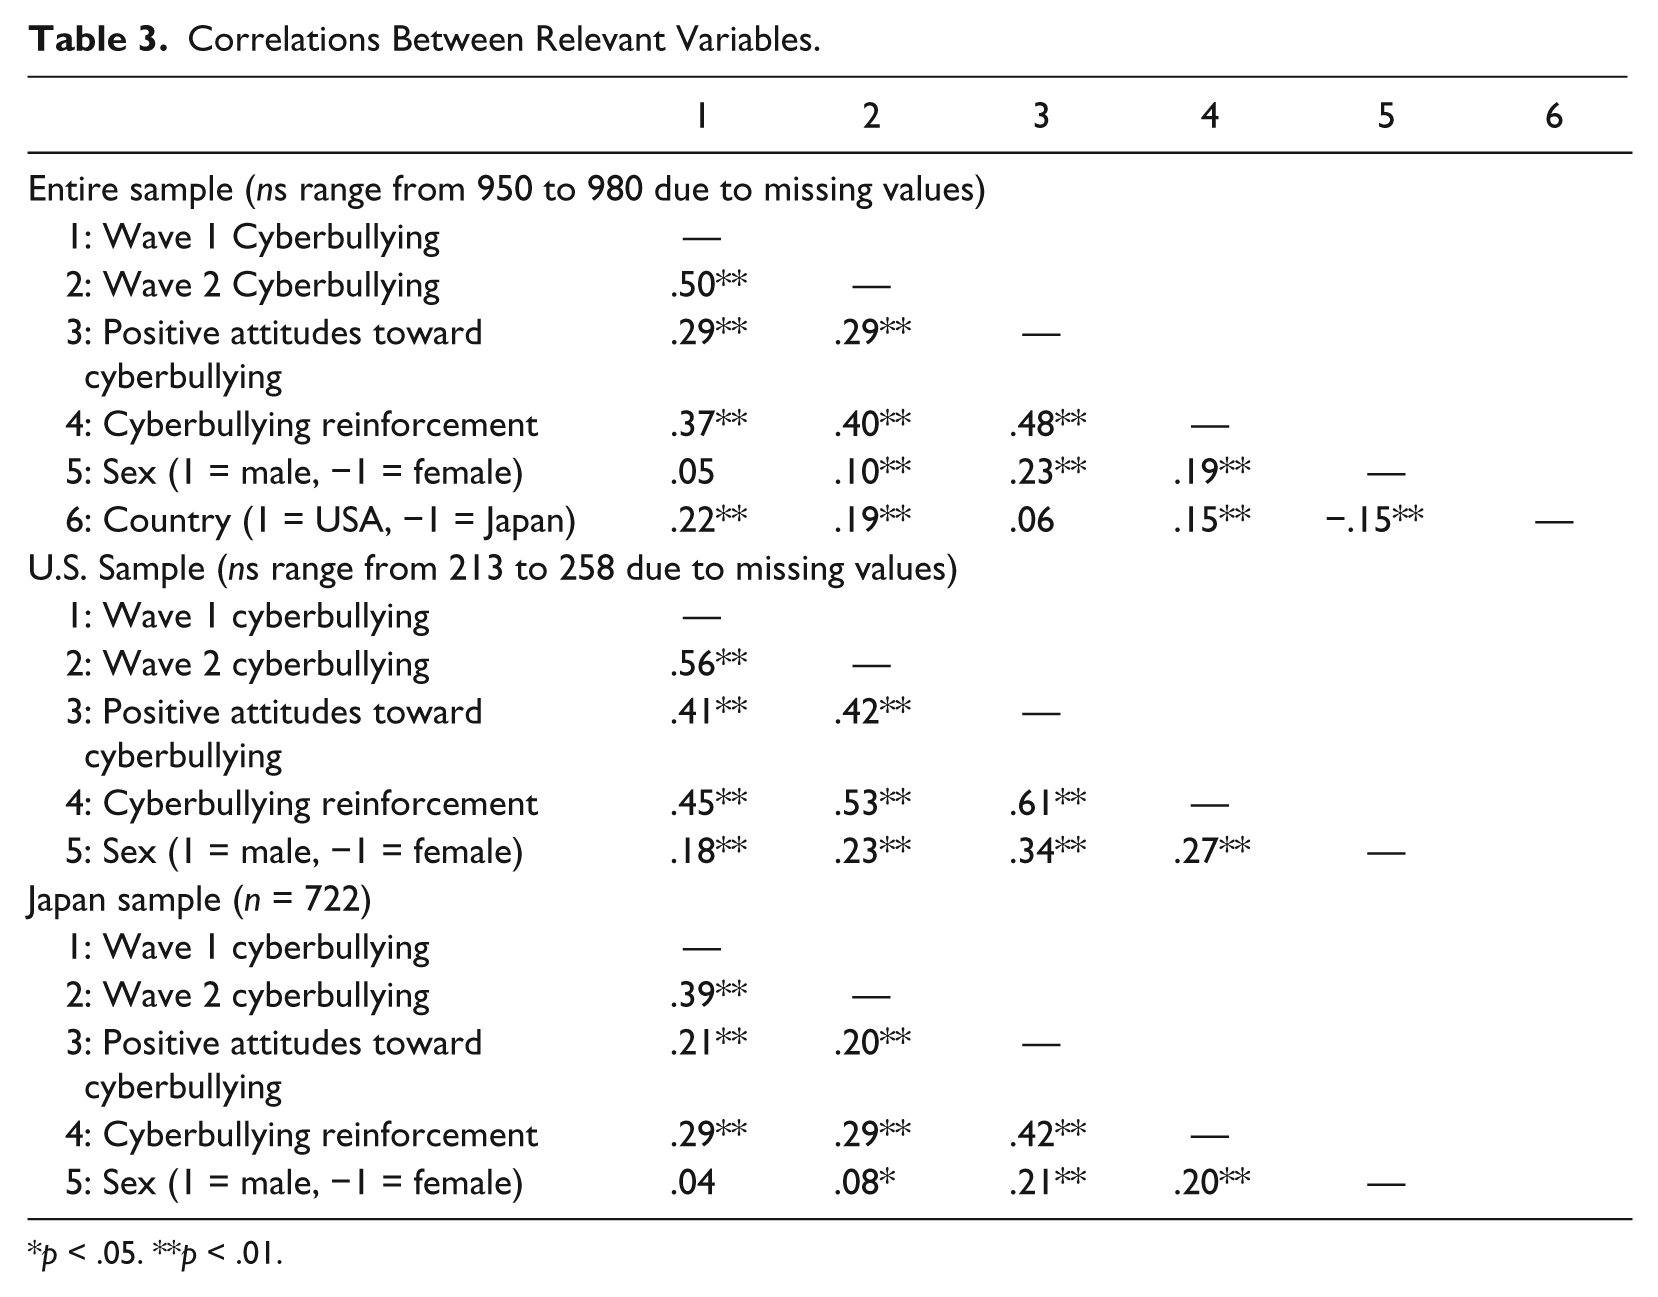
Table 3 displays the correlations between relevant variables for the entire sample, Japanese sample, and the U.S. sample. In all cases, results showed that cyberbullying at Wave 2 was significantly correlated with cyberbullying at Wave 1 (rs > .39, ps < .01), positive attitudes toward cyberbullying (rs > .19, ps < .01), and cyberbullying reinforcement (rs > .29, ps < .01).
Correlations Between Relevant Variables.
p < .05. **p < .01.
Predicting Wave 2 Cyberbullying
Next, we examined predictors of cyberbullying at Wave 2 relative to Wave 1 cyberbullying with a 2 (sample: USA, Japan) × 2 (sex: male, female) ANCOVA in which cyberbullying at Wave 2 was used as the outcome variable and cyberbullying at Wave 1 was used as the covariate. This analysis is akin to testing predictors of cyberbullying change at Wave 2 relative to Wave 1. As expected, Wave 1 cyberbullying was a strong predictor of Wave 2 cyberbullying, F(1, 975) = 270.74, p < .001, B = .59. Results also showed significant main effects for sample, F(1, 975) = 15.58, p < .001, and sex, F(1, 975) = 16.11, p < .001. Females had lower levels of Wave 2 cyberbullying (M = 3.36, SE = .05) compared with males (M = 3.57, SE = .06), suggesting that the relative change from Wave 1 was greater (increased cyberbullying) for males than for females. Similarly, the U.S. sample engaged in relatively more cyberbullying (M = 3.57, SE = .07; relative to Wave 1) than did the Japanese sample (M = 3.26, SE = .04).
However, these main effects were qualified by a significant Sample × Sex interaction, F(1, 975) = 6.47, p < .02. A simple effects analysis was used to probe this interaction. Results showed a significant main effect of sample for male participants, F(1, 975) = 10.71, p < .01. U.S. males reported higher levels of cyberbullying (M = 3.81, SE = .11) compared with Japanese males (M = 3.32, SE = .05). In addition, results showed a non-significant difference, F(1, 975) = 3.21, ns, between U.S. females (M = 3.32, SE = .08) and the Japanese females (M = 3.32, SE = .05) on Wave 2 cyberbullying (see Figure 1). Again, because Wave 1 cyberbullying was partialed out as a covariate, this interaction suggests that U.S. males showed a relatively greater increase in cyberbullying over time than did Japan males, but that there was no difference in relative amount of cyberbullying over time for females in the two samples.

Sample and sex effects on cyberbullying at Wave 2 while controlling for cyberbullying at Wave 1.
Moderation Tests
Several moderation analyses were conducted to further investigate cyberbullying change. Cyberbullying at Wave 2 was the dependent variable in all of these analyses, Wave 1 cyberbullying and sex were covariates, and the sample (coded 1 = USA, −1 = Japan) was the moderator.
The first test used Wave 1 cyberbullying reinforcement as a potential moderated predictor. Results showed significant moderation, B = .02, t(941) = 5.16, p < .001. Simple slopes analyses showed that the relation between cyberbullying reinforcement and cyberbullying at Wave 2 was significant and positive for both the U.S. sample, B = .07, t(941) = 8.96, p < .001, 95% confidence interval (CI) = [.05, .08], and the Japanese sample, B = .02, t(941) = 4.07, p < .01, 95% CI = [.01, .03]. This suggests that participants who reported more positive reinforcement for their cyberbullying at Wave 1 had greater relative increases in cyberbullying 2 months later (see Figure 2). Although this effect was found for both samples, it is most pronounced in the U.S. sample, as revealed by the significant moderation effect (i.e., the Sample × Cyberbullying reinforcement interaction).
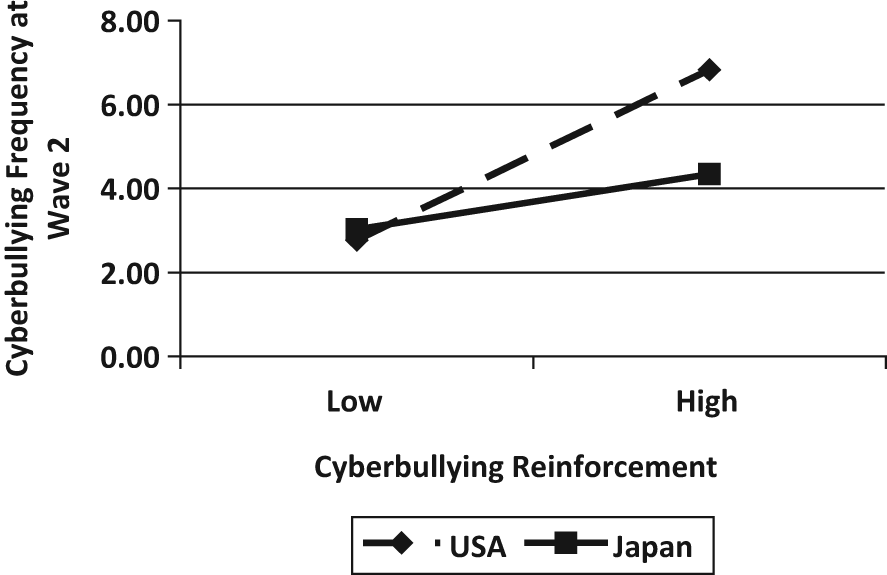
Moderating effect of culture on the relation between cyberbullying reinforcement and cyberbullying frequency at Wave 2.
The second moderation test used cyberbullying attitudes as a potential moderated predictor. Results showed significant moderation, B = .01, t(959) = 3.79, p < .001. Simple slopes analyses showed that the relation between cyberbullying attitudes and cyberbullying at Wave 2 was significant and positive for both the U.S. sample, B = .03, t(959) = 5.94, p < .001, 95% CI = [.02, .04], and the Japanese sample, B = .01, t(959) = 2.46, p < .02, 95% CI = [.002, .01]. This suggests that participants who held more positive attitudes toward cyberbullying at Wave 1 had greater relative increases in cyberbullying 2 months later (see Figure 3). Once again, this effect was found for both samples, but it was most pronounced in the U.S. sample, as revealed by the significant interaction.
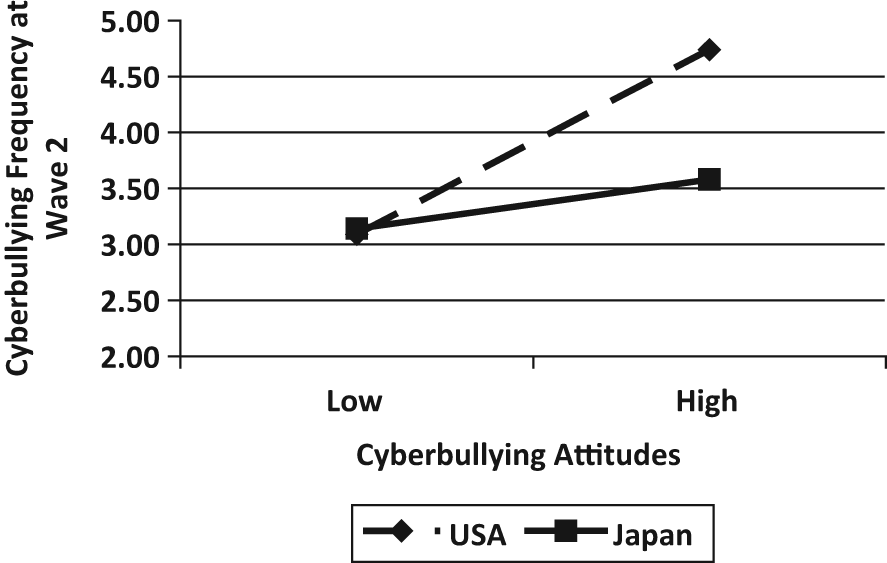
Moderating effect of culture on the relation between cyberbullying attitudes and cyberbullying frequency at Wave 2.
The final moderation analysis used interdependent self-construal as the predictor. Results showed significant moderation, B = −.01, t(934) = −3.30, p < .01. Simple slopes analyses showed that the relation between interdependent self-construal and cyberbullying at Wave 2 was significant and negative for the U.S. sample, B = −.03, t(934) = −4.99, p < .001, 95% CI = [−.04, −.02]. This suggests that the highest levels of cyberbullying occurred at the lowest levels of interdependent self-construal for the U.S. sample. This effect was not found for the Japanese sample, B = −.007, t(934) = −1.97, p = .049, 95% CI = [−.01, .000], as the 95% CI included 0 (see Figure 4).

Moderating effect of culture on the relation between interdependent self-construal and cyberbullying frequency at Wave 2.
Discussion
Two competing hypotheses regarding cultural differences in cyberbullying were tested in the current study. One hypothesis posited that cyberbullying would be higher in the U.S. sample compared with the Japanese sample due to their self-construal. The second hypothesis posited the opposite pattern of responding because Japan outranks the United States in technological advancement (Florida et al., 2011). Results showed that participants from the United States reported higher levels of cyberbullying than the Japanese sample. Results also showed that cultural context (Japan vs. United States) moderated the relation between positive attitudes toward cyberbullying, cyberbullying reinforcement, interdependent self-construal, and cyberbullying frequency. The relations between positive attitudes to cyberbullying and later cyberbullying behavior, and between perceived positive reinforcement for cyberbullying and later cyberbullying behavior, were positive and significant for the both samples, but were significantly stronger in the U.S. sample than in the Japanese sample.
Aggression continues to be a societal problem. Research in this domain has conceptualized aggressive behaviors along a continuum of severity, ranging from relatively low levels of physical harm (e.g., cyberbullying) to extremely violent behaviors (e.g., murder, assault). Gentile and Sesma (2003) suggested that such behaviors can also be described as being organized on a pyramid of frequency, such that behaviors on the low end of the aggression continuum are more frequent than those high on the continuum. This has important implications for future aggressive behavior. Theory and research on aggression escalation suggests that minor provocations can easily lead to more severe retaliations, continuing in an upward escalating cycle (Anderson, Buckley, & Carnagey, 2008). Thus, understanding the antecedents of cyberbullying has implications for understanding future, perhaps more violent, physical aggressive behavior, such as traditional bullying. Results from the current study suggest that culture, reinforcement, and positive attitudes, are key predictors of cyberbullying.
The findings from the current study may also generalize to the research in the broader bullying domain. Although the current study did not analyze data on traditional versus cyberbullying, other research (e.g., Barlett & Gentile, 2012) has found high correlations between traditional bullying, cyberbullying, traditional victimization, and cyber-victimization. This suggests that cyberbullies may also be traditional bullies and cyber-victims are likely traditional victims. Thus, the roles that aggressors and victims assume in the online world may also manifest in the real world. However, if our theory is correct then, certain components of cyberbullying (i.e., positive attitudes toward cyberbullying) should be more strongly correlated with cyberbullying than traditional bullying. This is exactly what Barlett and Gentile (2012) found. Therefore, it may be that the cultural differences and moderators described in this article may be more strongly associated with cyberbullying than traditional bullying, although this is an area of future research.
Implications for Theory
Barlett and Gentile (2012) found evidence to suggest that general learning theories (GLM; Gentile et al., 2009) can predict cyberbullying frequency. This theory suggests that each successful cyberbullying incident is a learning trial, and with continued cyberbullying, individuals likely learn that cyberbullying is an appropriate behavior to inflict harm. Results of the current study supported these relations by showing significant correlations between cyberbullying frequency, positive attitudes toward cyberbullying, and cyberbullying reinforcement. This suggests that reinforcement from others and one’s own internal attitudes both predict cyberbullying. In short, our model predicts, and our results show, that self and others influence cyberbullying through learning processes.
We further extended our distal theory of cyberbullying by showing that learned cultural attitudes (interdependent self-construals) are related to cyberbullying behavior. This suggests that although learned cyberbullying attitudes may be commonplace, learned cultural self-construals influence the expression of aggressive behavior. Interdependent self-construal, therefore, may serve as a protective factor in the relation between other learned attitudinal variables and cyberbullying behaviors.
Limitations and Future Research
Like all psychological research, there are some limitations that could be addressed with future research. First, the mean scores of cyberbullying were low (Ms = 3.28-3.31) and below the midpoint on the Cyberbullying scale. This may accurately suggest that cyberbullying frequency is low, or it may be a limitation of the Ybarra et al. (2007) measure. Future research should continue to test scales that reliably assess cyberbullying frequency. In addition, the scales used to assess cyberbullying attitudes and reinforcement (from Barlett & Gentile, 2012) used the term cyberbullying in several items without providing participants with a concrete definition of cyberbullying. Some researchers have used measures that include a definition of cyberbullying (e.g., Beran & Li, 2007; Hinduja & Patchin, 2008; Jose, Kljakovic, Scheib, & Notter, 2012), whereas others do not (e.g., Ang et al., 2010; Boulton, Lloyd, Down, & Marx, 2012; Erdur-Baker, 2010). We elected to not include a definition of cyberbullying. Both the Cyberbullying Attitudes and Reinforcement scales were originally published by Barlett and Gentile (2012) and we did not want to include additional instructions or definitions to their measure. Such changes can have a negative effect on the reliability and validity of psychological instruments. However, the probability that we “missed” some variance in cyberbullying by not including a definition in our measures is likely very small. Because these are college-aged samples and cyberbullying is such a “hot topic” in media and press coverage, we remain confident that participants understood the definition of cyberbullying. Nonetheless, future research should carefully consider what questionnaires to use to measure cyberbullying and decide whether providing a definition of cyberbullying to participants would be advantageous.
Second, the current study included undergraduate students rather than younger adolescents. Research has suggested that cyberbullying peaks in late adolescence (e.g., high school; Sevcikova & Smahel, 2009). Although speculative, the results from the current study may suggest that the theoretical relations in the Barlett and Gentile (2012) distal model (that were tested in an undergraduate sample) may be stronger in an adolescent sample. Thus, future research should attempt to test the theoretical relations between key cyberbullying variables in adolescents to determine whether the results are similar, or even stronger.
A third limitation to the current study was that some of the questionnaires did not show adequate measurement equivalence across groups. 3 This is important because the primary results rely heavily on mean comparisons. Results from our measurement equivalency tests (see Footnote 3) showed cultural invariance for cyberbullying reinforcement. This suggests that the results using reinforcement must be interpreted with a certain degree of caution; however, this alone does not diminish the importance of the overall findings. Given the similarities in internal consistency, mean score, and the use of careful item development (i.e., translations and back-translations), we feel that the findings are still valid.
Finally, we limited the time lag between Wave 1 and Wave 2 to 2 months. This was done both for practical reasons and because technology can change quickly. It was important to estimate cyberbullying consistently from Wave 1 to Wave 2 to test for the short-term longitudinal change. However, future research should attempt to investigate the longitudinal relations and predictors in cyberbullying using longer time lags (see Fanti et al., 2012; Jose et al., 2012). Such longitudinal designs will allow for a test of the mediating influence of several variables assessed at Wave 2 (e.g., interdependent self-construal, cyberbullying attitudes, and cyberbullying reinforcement) in the relation between cyberbullying frequency at Waves 1 (independent variable) and 3 (dependent variable).
Final Comments
As technologies continue to become more incorporated into daily activities, the methods for how people can aggress against others will also increase. As cellular phones become more able to connect to wireless networks, personal computers become more mobile and cheap, and media converge, the access to methods for cyberbullying will increase. The current research extended our understanding of cyberbullying by further elucidating some of the theoretical risk and protective factors in cyberbullying frequency. It is hoped that with continued research and theoretical developments, interventions can be created and tested to reduce cyberbullying behavior.
Footnotes
Declaration of Conflicting Interests
The author(s) declared no potential conflicts of interest with respect to the research, authorship, and/or publication of this article.
Funding
The author(s) disclosed receipt of the following financial support for the research, authorship, and/or publication of this article: Data collection for the Japanese sample was supported by JSPS KAKENHI Grant Number 20330132. The author(s) received no financial support for the sample collected in the United States.