
Abstract
In a demanding test of measurement invariance, we examine the relative cross-cultural generalizability of the five-factor model of social axioms in samples from 23 nations (total N = 7,275). With some modifications, results showed modest evidence of both configural and factorial invariance of the measure. Even such modest evidence is impressive in such a diverse sample and with such a stringent test, but nonetheless, areas are noted where the Social Axioms Survey could be improved to achieve better fit for invariance tests.
Social axioms are designed to complement values in understanding cultures and accounting for cross-cultural differences (Leung et al., 2012). They are defined as generalized expectancies, that is, abstract beliefs, which people endorse as basic premises that guide their behavior (Leung et al., 2002). Social axioms are labeled as such because they are axiomatic, that is, taken to be true and going unchallenged, by definition. They can be beliefs about people, social institutions, the physical or spiritual world, or phenomena in the social world. They can be measured with the Social Axioms Survey (SAS; Leung & Bond, 2004), using items that are statements of relationships between two entities (e.g., “Adversity can be overcome by effort”). This differentiates them from values, which are statements about the absolute merit or desirability of a single entity.
Social axioms are organized into five dimensions (Leung et al., 2012), each corresponding to one scale. Social cynicism refers to a negative view of human nature, a bias against some social groups, general distrust toward social institutions, and the beliefs that power is corrosive to moral standards and that people are unscrupulous in the pursuit of their goals. Social complexity refers to the belief that there are many ways to solve a problem and that people change their behavior to adapt to situations and circumstances. Reward for application (RA) refers to the belief that hard work and careful planning are rewarded with positive outcomes. Religiosity/spirituality (RE) refers to a belief in the existence of supernatural entities and a belief that traditional religiousness has a positive effect on society. Fate control (FC) is the belief that fate influences life outcomes but that it, in turn, can be predicted and influenced.
The five-factor structure of the SAS was derived and tested in many countries (e.g., Gari, Panagiotopoulou, & Mylonas, 2009; Ismail, 2009; Leung & Bond, 2004; Leung et al., 2002; Leung et al., 2012; Safdar, Lewis, Greenglass, & Daneshpour, 2009; Van de Vijver, Valchev, & Suanet, 2009), and the fit of the five-factor model has been deemed acceptable. To our knowledge, no studies have attempted to test the measurement invariance (MI) of the SAS using multi-group confirmatory factor analysis (CFA) with single items as indicators in a fairly representative sample of countries from around the world. This study aims to fill this gap in the literature on social axioms.
MI
A MI testing approach allows us to determine the extent to which the basic structure of the SAS is cross-culturally stable and the degree to which individuals in different populations use its scales similarly. In addition, it allows for more confidence when making mean comparisons between groups on social axiom factors/scales and when interpreting correlations between the SAS and other psychological measures, for example, personality. The most basic level, here called “configural invariance,” indicates the same factor structure (i.e., same number of factors based on the same indicators) across groups (Vandenberg & Lance, 2000). The next level, factorial invariance, requires that factor loadings of indicators on their respective latent factors are equal across groups (e.g., Spini, 2003). If established, it indicates that the same latent factors are being measured by the indicators across groups. In other words, the content of the latent factors is well matched. Factorial invariance also indicates that it is appropriate to examine the relationships of the latent factors with other variables of interest across different groups.
More stringent constraints can be imposed if desired. The next level of MI, scalar invariance, imposes equality constraints on the intercept of each indicator across groups. This level of invariance allows direct comparisons of factor means between groups because it indicates that factors have the same scale and origin (Fischer & Lun, 2008). The final level, full invariance, imposes equality constraints on the error variance of each indicator across groups. This level of invariance establishes that all group differences are due to differences on the latent factors (Chen, 2007).
Invariance testing is an extension of single-group CFA. The task of achieving reasonably good fit in CFAs with multidimensional instruments has proven to be very challenging. For example, Hopwood and Donnellan (2010) cite the general finding in the literature that multidimensional personality inventories, many of them developed by exploratory factor analysis, routinely fail to achieve adequate fit. Their own CFAs of inventories on five different platforms, all constructed in North America, found that none of them achieved adequate fit in a North American community sample. If it is difficult to achieve a good fit of multidimensional models in just one population, it should be even more challenging to locate a good fit in models tested across many populations. Nevertheless, such fit is often assumed when a measure or model is used across multiple cultural contexts, and it is important to check the tenability of this assumption.
Method
Participants
The data analyzed come from participants in the Survey of Worldviews collected online by way of a project coordinated from the University of Oregon in 2012. Data were collected from 8,883 individuals (the vast majority being college students) in 33 countries that add up to two thirds of the world population in both number and economic impact (see Saucier et al., 2013, for details about the full sample and study methodology and sample demographics). The subsample used in this study consists of those 8,245 individuals from 26 nations who met the following criteria: They were college students (this restriction enables a control on the level-of-education variable). Their responses were not among a few protocols suspected of being duplicates or of being random responders. They did not have 100% missing data on the variables of interest. See Table 1 for a list of countries, sample sizes, and factor means for each of the countries. The factor means were calculated using Mplus 7.0 (L. K. Muthén & Muthén, 2012) and are only directly comparable if the conditions for scalar invariance are met.
List of Countries, Sample Sizes, and Means and Standard Deviations of Social Axioms Scales.
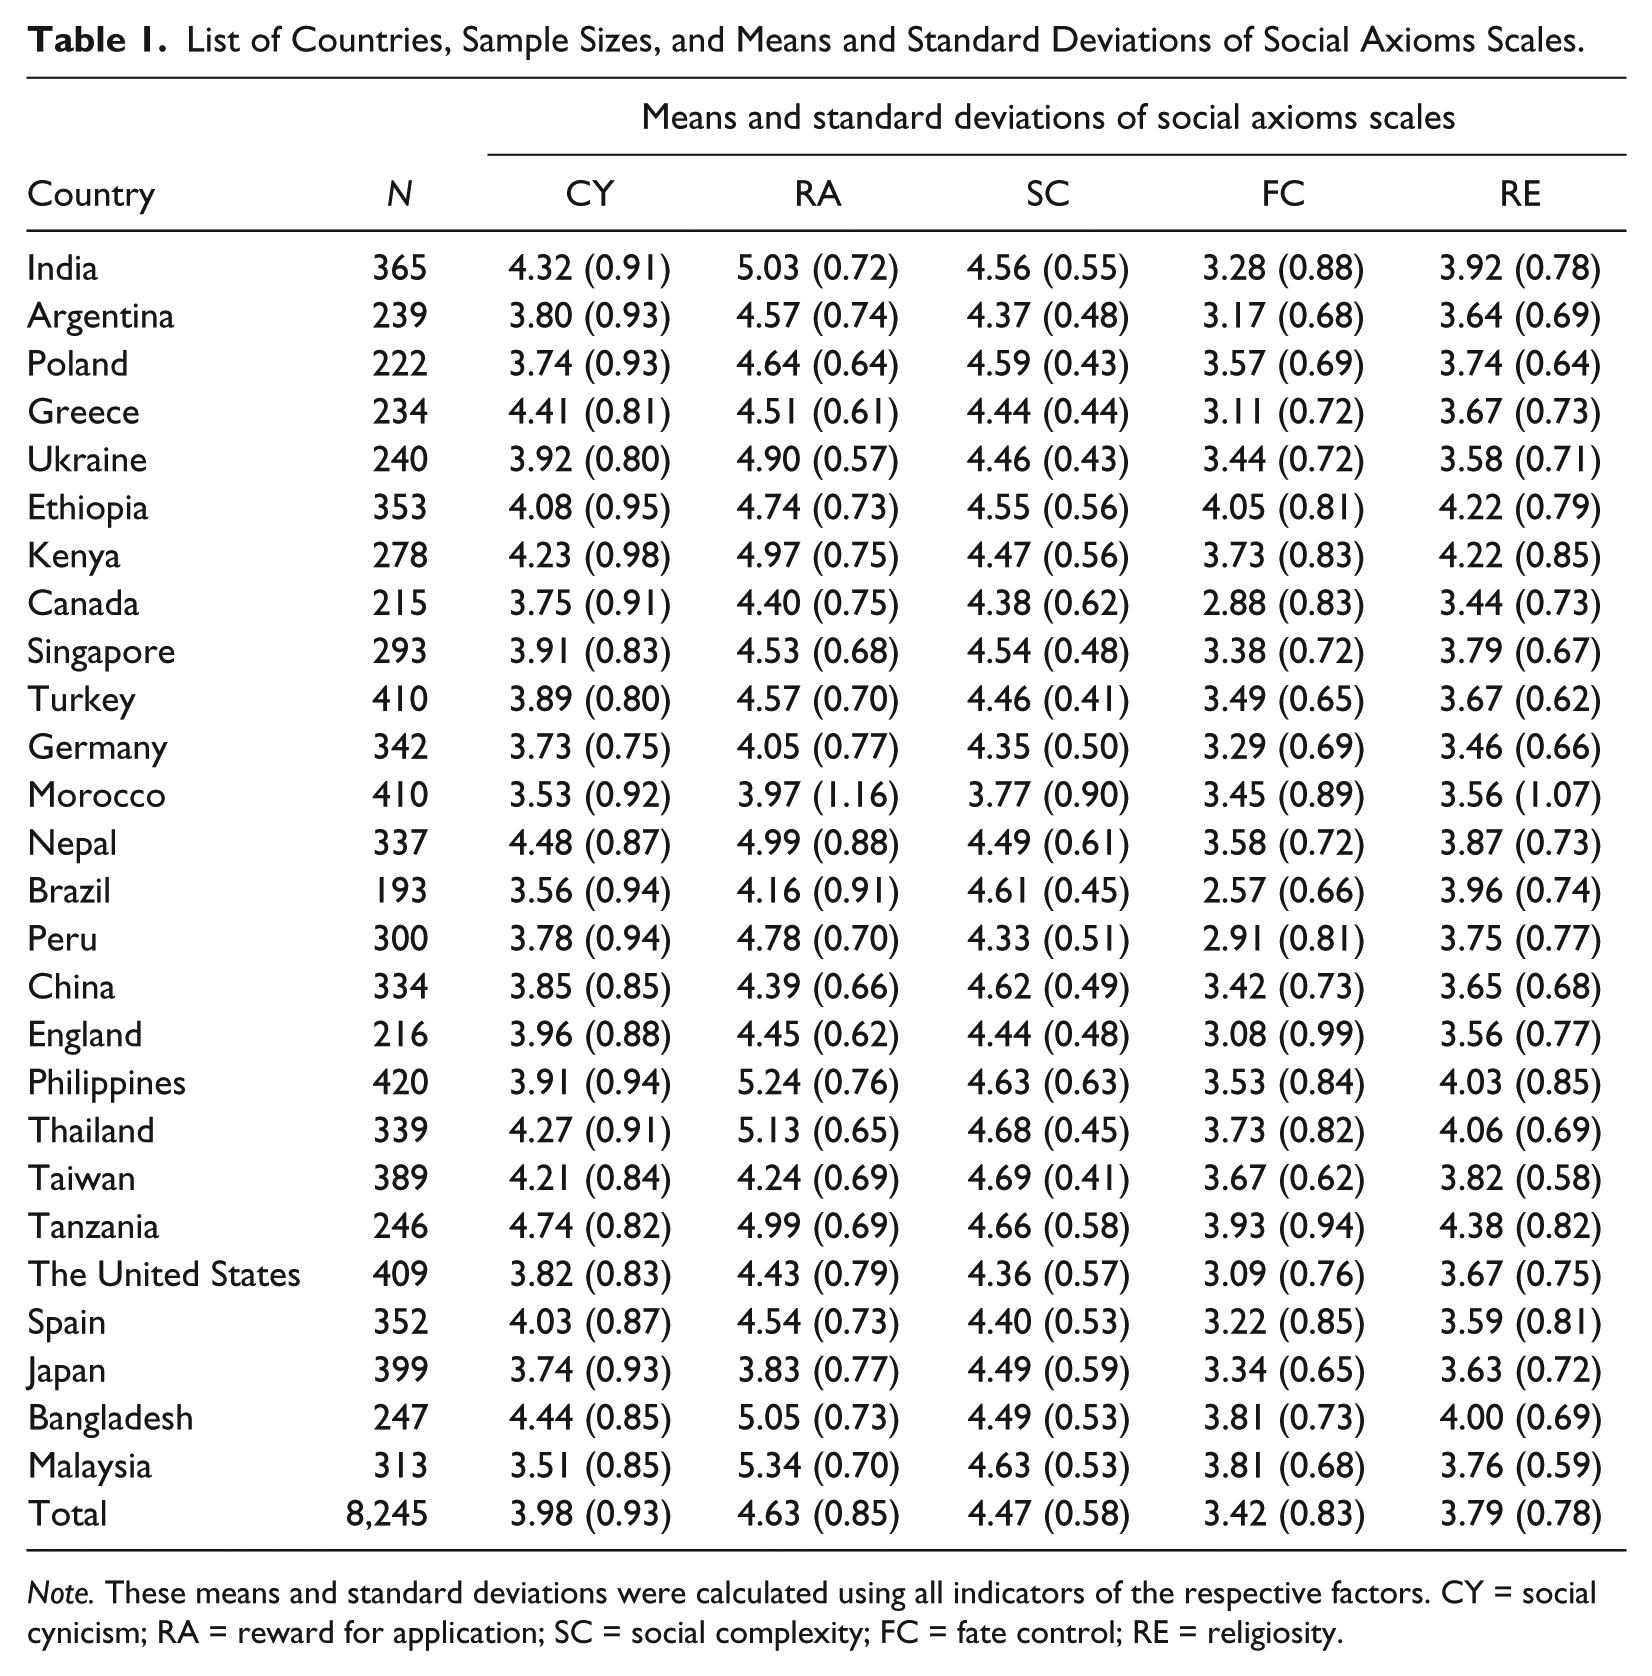
Note. These means and standard deviations were calculated using all indicators of the respective factors. CY = social cynicism; RA = reward for application; SC = social complexity; FC = fate control; RE = religiosity.
Measures
Analyses were conducted on a 30-item version of the SAS. The questionnaire was administered in each country’s major native language (with English used in India and Kenya) using a process of blind back-translation. Each item was treated as an indicator for one of the five factors. The measure included 4 indicators of social cynicism, 5 indicators of reward for application, 10 indicators of social complexity, 7 indicators of fate control, and 4 indicators of religiosity. Items were rated on a scale from 1 (strongly disagree) to 6 (strongly agree). 1 See Table 2 for a list of the items.
List of Social Axioms Scales and Their Indicators.

Procedure
The literature on the structure of the SAS was examined to rank items in terms of their performance in previous studies. The items that performed most consistently (i.e., had a high primary loading on the appropriate factor and low secondary loadings on other factors) in previous studies, listed first under their factors in Table 2, were used to scale their respective factors in our analyses. It is notable that social complexity items after the third and fate control items after the second all performed relatively inconsistently according to our criteria in previous studies. In addition, these two subscales, Social Complexity and Fate Control, are the longest. They were lengthened to increase their reliabilities, which were lower than other subscales (Van de Vijver et al., 2009). Given this information, we suspected that indicators of social complexity and fate control would again be a source of misfit and were candidates for removal.
We split our countries into two random sets, the first containing 12 countries (India, Argentina, Poland, Greece, Ukraine, Ethiopia, Kenya, Canada, Singapore, Turkey, Germany, and Morocco) in Table 1 and the second containing the remaining 14 countries (Nepal, Brazil, Peru, China, England, Philippines, Thailand, Taiwan, Tanzania, the United States, Spain, Japan, Bangladesh, and Malaysia). This enabled us to not merely test one a priori structural model but to also empirically derive a model that might achieve a better fit and rigorously test it so as to establish its generalizability and usefulness to investigators in future studies. Specifically, we could then use the first set of countries as a derivation sample, in which a model is derived and optimized, and the second set of countries as a cross-validation sample, in which the fit of the optimized model is interpreted as a realistic estimate of the generalizability of the optimized model to other samples (Wiggins, 1973). Cross-validation is recommended for procedures based on regression-based procedures when the sample is large enough (Horst, 1966; Wiggins, 1973). Each of our two sets of countries had roughly 4,000 cases, which seems a sufficient sample size either for empirically deriving or for testing a model.
A baseline model with five correlated factors and their respective indicators (as outlined in Table 2) was fit in each country separately to verify that it would converge with no errors. The baseline model did not converge initially in Morocco. It was suspected that there were duplicate responses in the data. Suspected duplicate responders, four in all, identified via a correlation ≥.98 with at least one other respondent were eliminated. The model then converged but still had a non-positive definite matrix due to estimated correlations greater than 1.00 between the social complexity factor and all other factors, suggesting that social complexity was not distinguishable in that sample. Bangladesh and Malaysia also produced non-positive definite matrices. In Bangladesh, social complexity had an estimated correlation greater than 1.00 with reward for application. In Malaysia, fate control had correlations beyond −1.00 with all factors but social cynicism. In short, it appeared that social complexity in Morocco and Bangladesh and fate control in Malaysia were not fully distinguishable from the other factors. Notably, these are the factors that were identified a priori as potential sources of misfit based on prior research. These countries were dropped from further analyses. The fit indices of the baseline model in each of the countries can be found in Table 3. The standardized loadings of each of the indicators on their respective factors in each country can be found in the appendix.
Fit Indices of Progressively Stringent Measurement Invariance Tests.
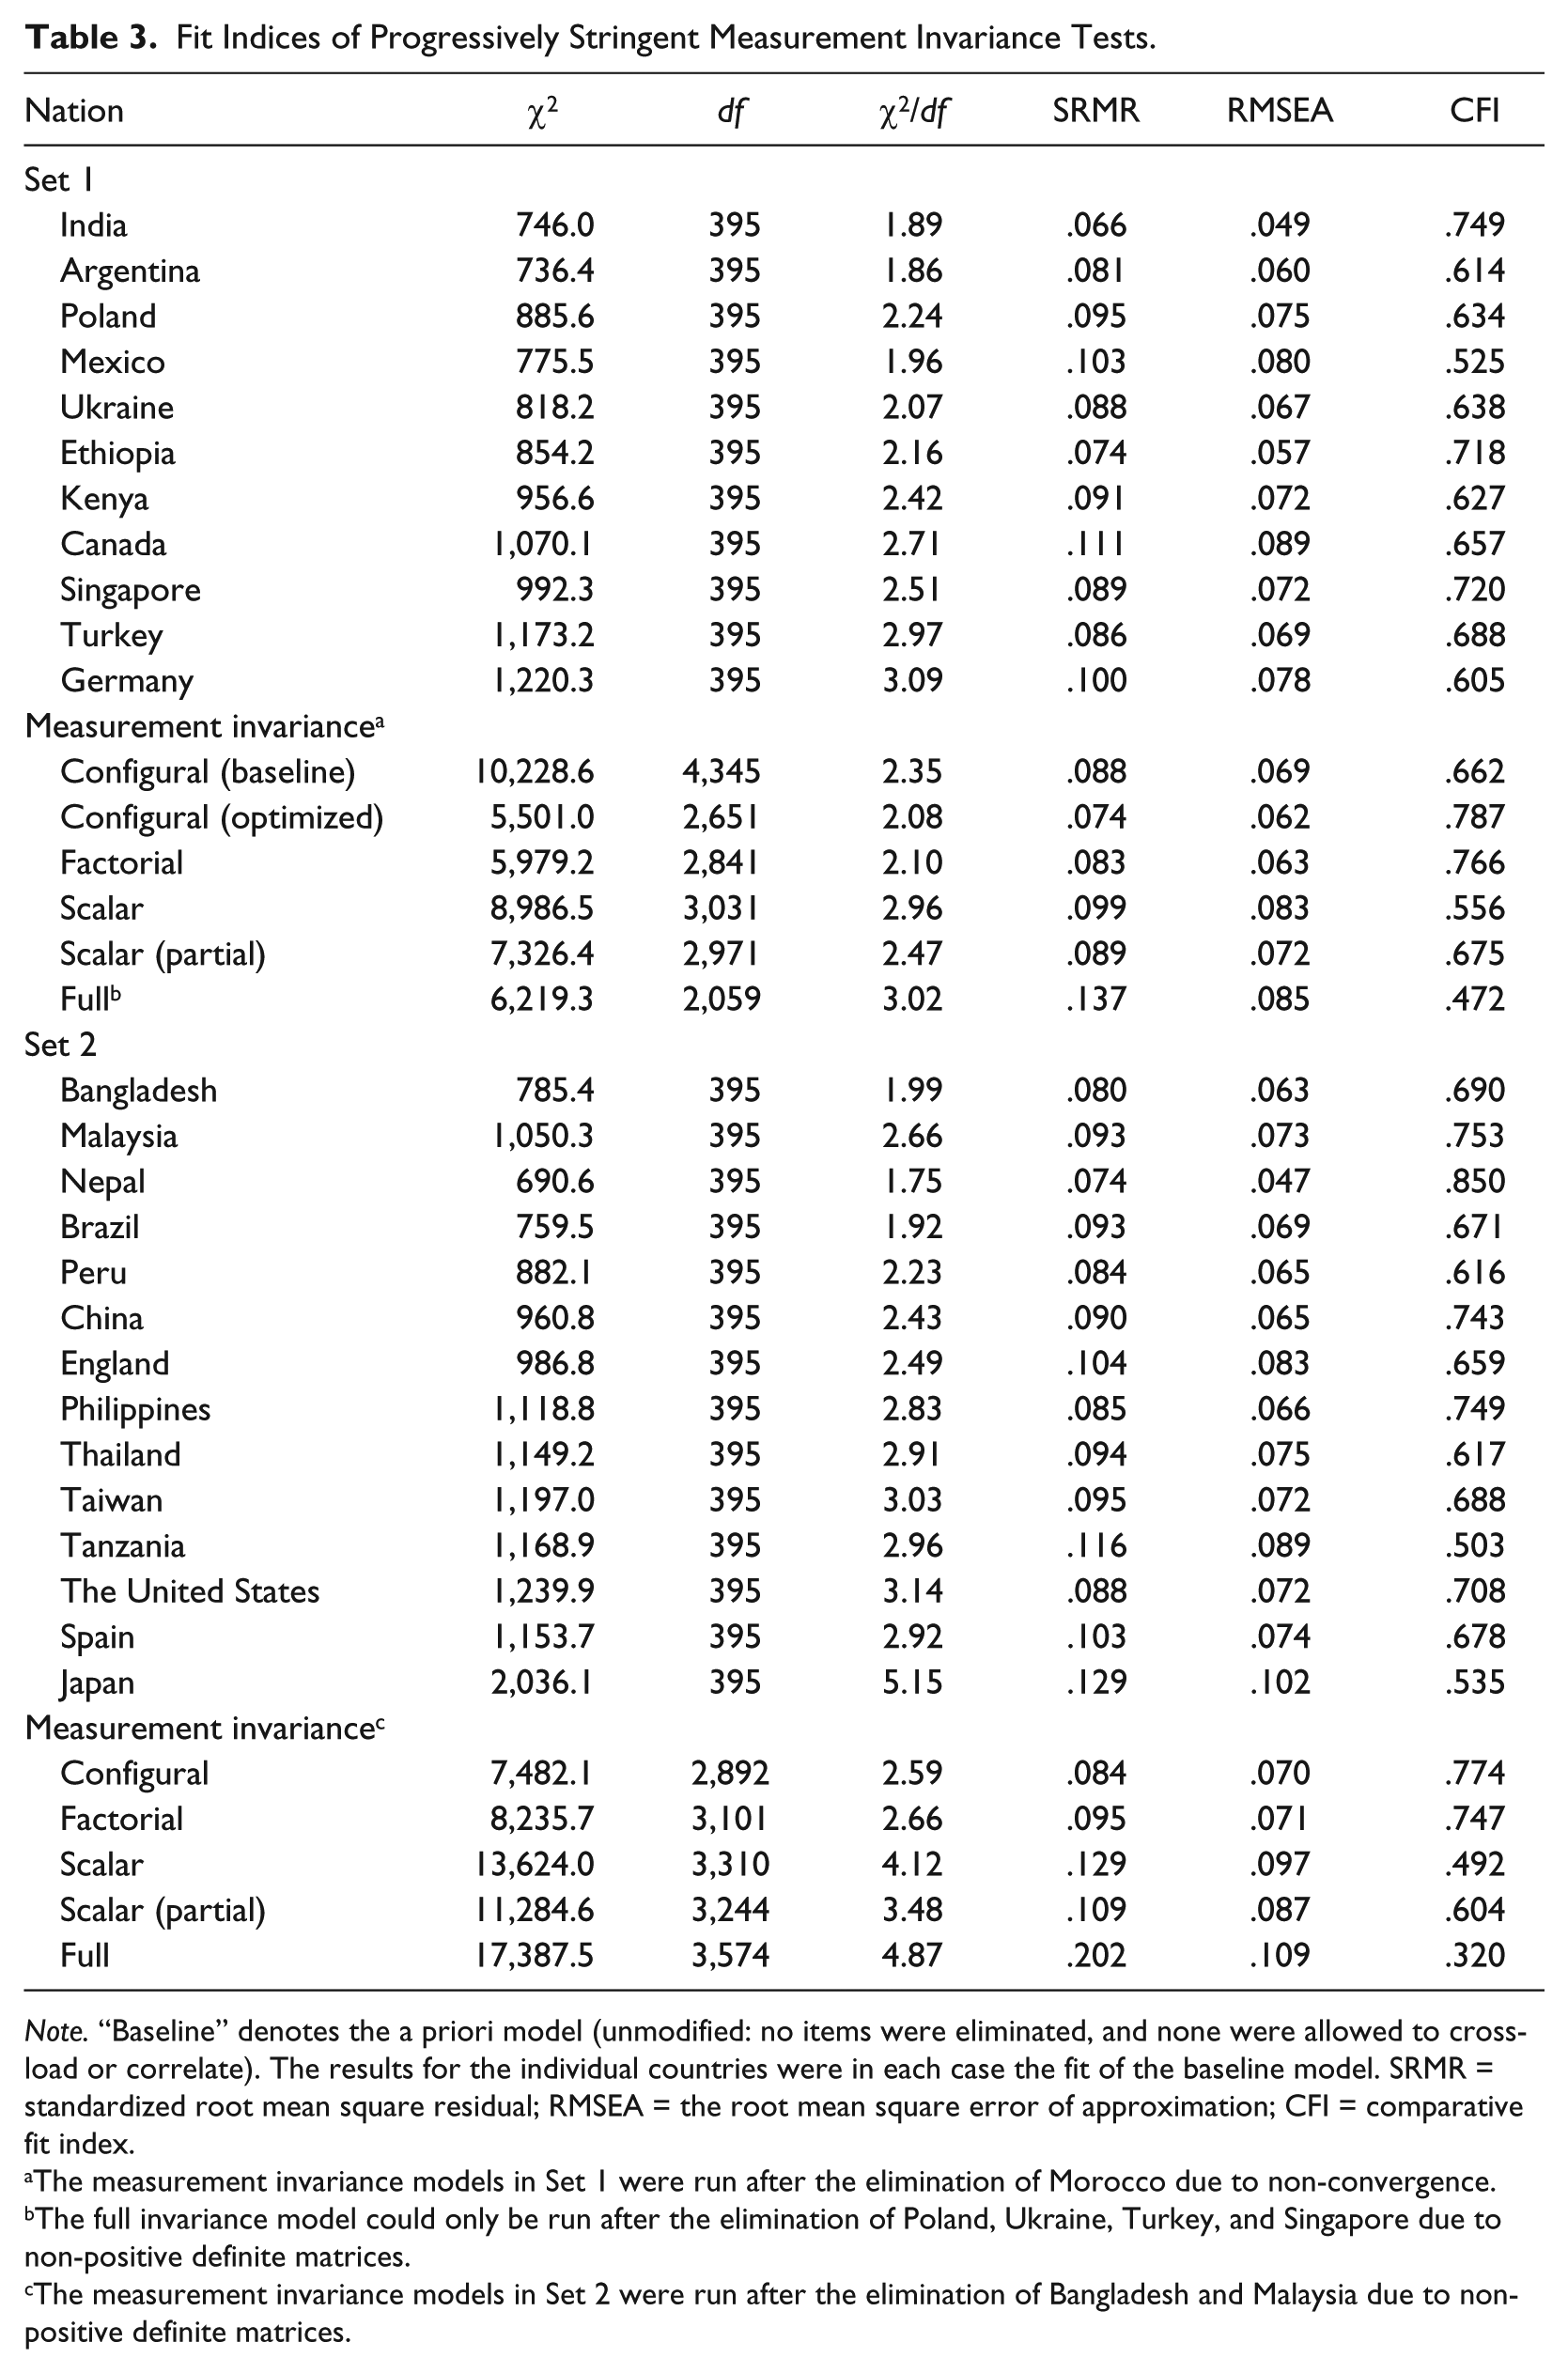
Note. “Baseline” denotes the a priori model (unmodified: no items were eliminated, and none were allowed to cross-load or correlate). The results for the individual countries were in each case the fit of the baseline model. SRMR = standardized root mean square residual; RMSEA = the root mean square error of approximation; CFI = comparative fit index.
The measurement invariance models in Set 1 were run after the elimination of Morocco due to non-convergence.
The full invariance model could only be run after the elimination of Poland, Ukraine, Turkey, and Singapore due to non-positive definite matrices.
The measurement invariance models in Set 2 were run after the elimination of Bangladesh and Malaysia due to non-positive definite matrices.
Configural invariance was then evaluated in the first set of countries. Modification indices were examined. The most common recommendations for modification were to allow cross-loadings for two social complexity items: “There is usually only one way to solve a problem” on reward for application and “There are phenomena in the world that cannot be explained by science” on religiosity. These items tended to show these cross-loadings also in previous studies. A test of configural invariance where the cross-loadings were allowed did not converge. For this reason and to maintain a simpler model, these two items were eliminated from further analyses.
Once the two social complexity items were eliminated, the performance of other items was examined. Four more items were eliminated because they commonly had negative loadings (when they are meant to be forward keyed) or loadings close to 0. These items were as follows: “One who does not know how to plan for his or her future will eventually fail” (RA), “There are many ways to predict what will happen in the future” (FC), “There are certain ways to help us improve our luck and avoid unlucky things” (FC), and “Religious beliefs lead to unscientific thinking” (RE). These items were not good candidates for partial invariance rather than elimination because they did not consistently load on the same factor across groups (Cheung & Rensvold, 1998) but had substantial cross-loadings or loadings close to 0 on the factor they were meant to be indicators for.
Based on the modification indices in another test of configural invariance after these items were eliminated, the error terms of the first two social cynicism items were allowed to correlate. These two items are both worded in terms of “kind-hearted people” suffering negative consequences. Then, more stringent tests of MI (factorial, scalar, and full) were imposed on the first set of countries using this optimized model. Finally, the full set of MI tests (configural, factorial, scalar, and full) were run on the second set of countries using the optimized model to verify whether it could be generalized beyond the set of countries in which it was derived.
In our MI tests, model fit was assessed using a variety of indices. We present model χ2 statistics and associated degrees of freedom (df). Some researchers have suggested that a more meaningful measure of model fit than χ2 is the ratio of the χ2 statistic to the degrees of freedom for the model; a ratio less than 3 is generally considered to reflect acceptable fit (Carmines & McIver, 1981); results with this easy-to-use χ2/df ratio as an index of fit are presented as a supplement.
For our prime fit indices, however, we followed the recommendations of Hu and Bentler (1999), and examined a variety of fit indices that evaluate misspecification: the standardized root mean square residual (SRMR), the root mean square error of approximation (RMSEA), and the comparative fit index (CFI). SRMR is a measure of absolute fit, that is, how well (on average) the correlation matrix has been reproduced by the model. RMSEA indicates absolute fit adjusting for model parsimony, that is, the magnitude of the covariance residuals are adjusted for degrees of freedom. CFI reflects the proportion of improvement in fit relative to the null (or independence) model.
Hu and Bentler (1999) suggest that, to confirm the adequate fit for a model, CFI should ideally be greater than .95, RMSEA should be less than .06, and SRMR should be less than .08. In examining both absolute and relative fit of the various models tested, we follow Hu and Bentler’s combinational rule. By the most conservative standard, a good-fitting model will pass the given criteria for all these fit indices. A more lenient standard would allow for labeling slightly lower index values (CFI .90-95, RMSEA .06-.08, SRMR .08-.10) as reflective of marginally well-fitting models. For the purposes of testing MI, we followed the cutoffs recommended by Chen (2007). For any invariance test, a change of ≥.005 in CFI or ≥.01 in RMSEA would indicate non-invariance. For SRMR, the cutoffs are ≥.025 for testing loading invariance and ≥.005 for testing intercept or residual invariance. All models were estimated using full information maximum likelihood in Mplus 7.0 (L. K. Muthén & Muthén, 2012).
Results
Fit indices for each of the MI models can be found in Table 3. 2 In the first set of countries, the fit of the configural invariance test on the baseline a priori model showed acceptable fit according to the higher, more lenient cutoff points of SRMR (.088 < 1.0) and RMSEA (.069 < 0.08). The fit indices of the configural invariance test on the optimized model showed considerable improvements over those of the baseline a priori model. SRMR (.074) and RMSEA (.062) indicated a reasonably good fit for the configural invariance test. Fit remained reasonably good for factorial invariance according to these criteria. In addition, Δ RMSEA ( .001 < .005 ) and Δ SRMR ( .009 < .025 ) were acceptable. Fit was also acceptable for factorial invariance according to two of the guidelines set by Chen (2007) though Δ CFI was .021 > .001 It is notable, however, that none of the models demonstrated a good fit by the standards of the more stringent cutoff points for SRMR (≤.08) and RMSEA (≤.05). In addition, CFI (<.95) remained below the threshold of a good fit for all models. The low CFI values may at least partially be due to the large number of indicators and the complexity of the model. Simulation studies suggest that CFI tends to decrease under these circumstances and is not necessarily problematic especially when RMSEA shows a reasonable fit (Kenny & McCoach, 2003). SRMR (.099; Δ SRMR = .016 > .005) and RMSEA (.083; Δ RMSEA = .020 > .01) both exceeded the upper limit of their respective rules of thumb for a good fit in the scalar invariance test and also indicated a poor fit in the full invariance model.
We examined the modification indices in the scalar invariance test and identified items that consistently contributed to a poor fit: Items 3 and 4 in the Social Cynicism subscale, Item 2 in the Social Complexity subscale, Items 1 and 5 in the Fate Control subscale, and Item 5 in the Reward for Application subscale. A partial scalar invariance model was run that freed the intercepts of these items in each of the countries. The fit was an improvement over the full scalar invariance model with improved SRMR (.089; Δ SRMR = .006 > .005), RMSEA (.072; Δ RMSEA = .009 < .01), and CFI (.675).
See Figure 1 for a diagram of the full invariance model, the most restrictive test of invariance, based on the Indian sample. Note that Poland, Ukraine, Turkey, and Singapore had to be dropped from the estimation of the model under the full invariance constraints because they produced non-positive definite matrices.
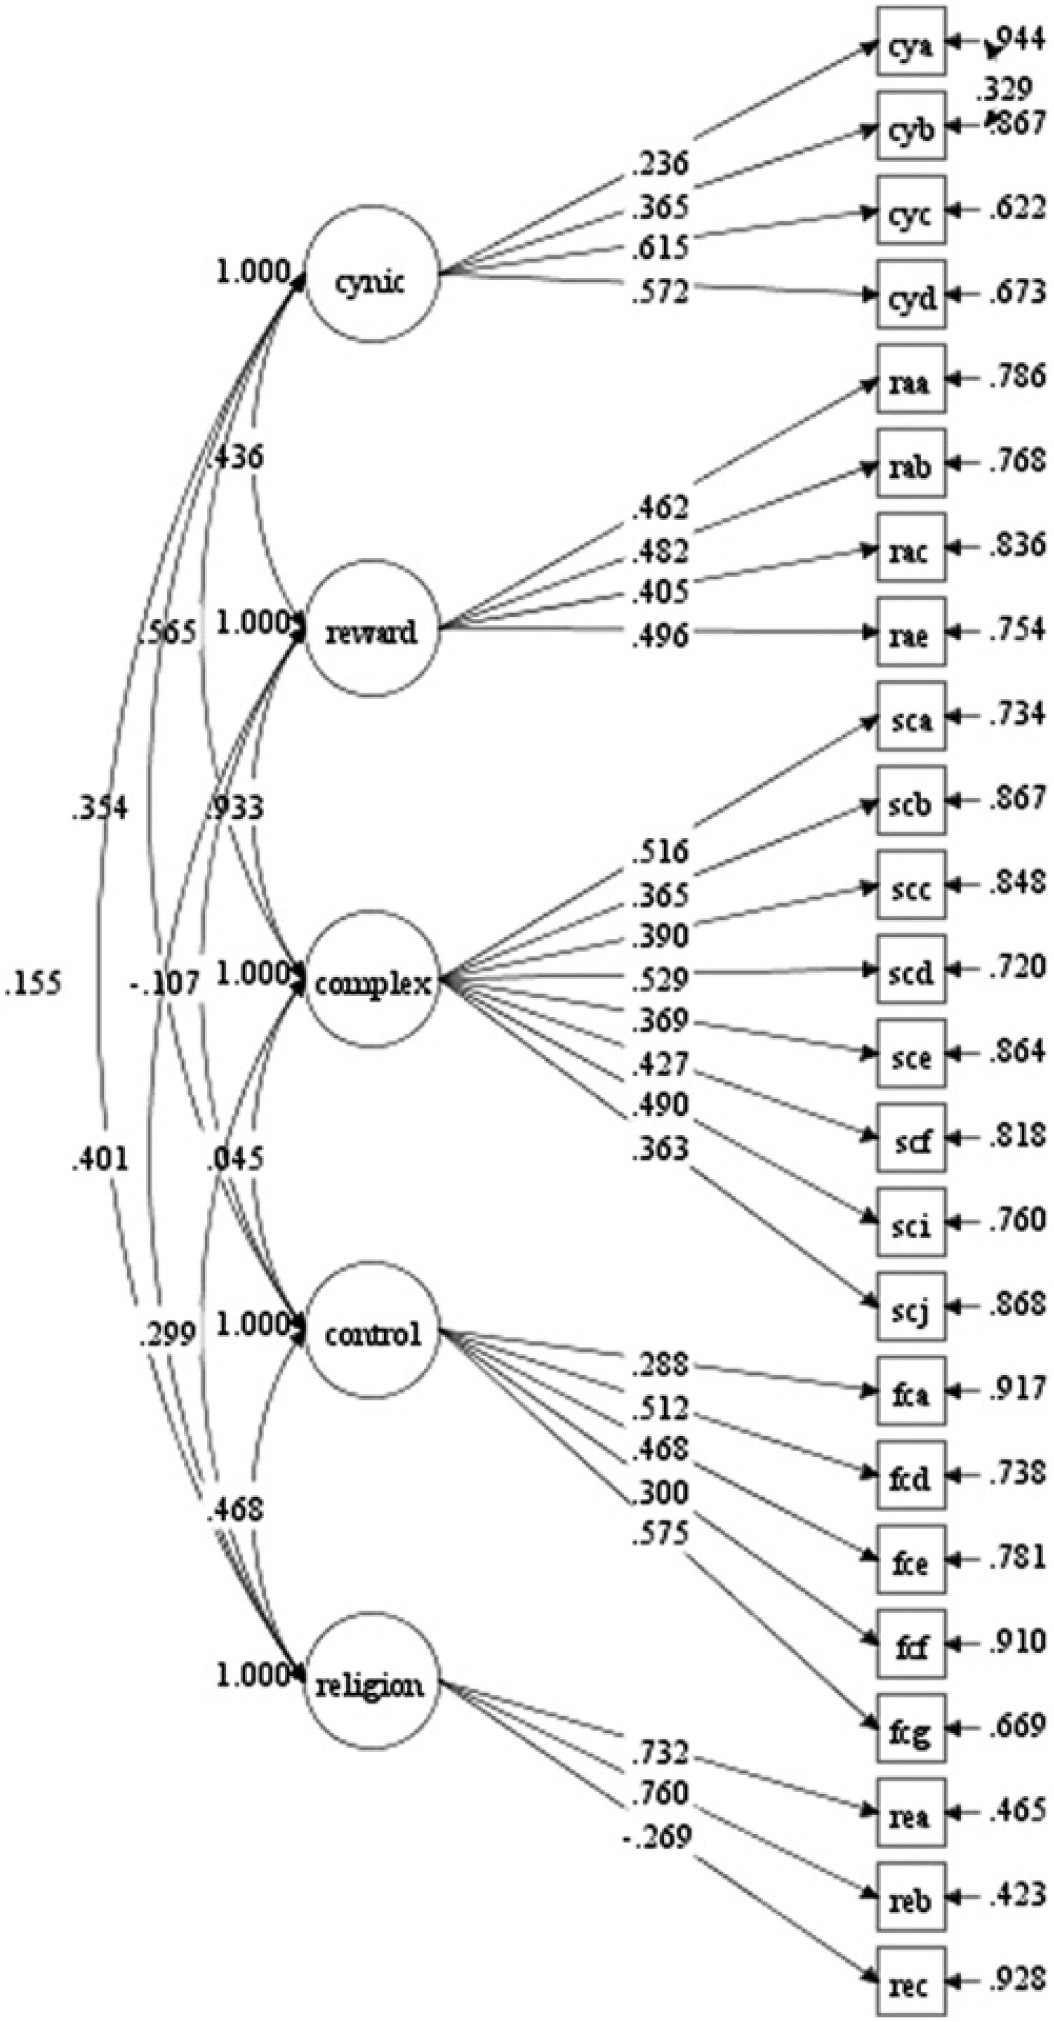
Diagram of the full invariance optimized model test on the first set of countries as estimated in the Indian sample (N = 365).
In the cross-validation test in the second set of countries, SRMR (.084) and RMSEA (.070) indicate an adequate fit for the test of configural invariance. RMSEA (.071) and SRMR (.095) remain adequate for factorial invariance, as do Δ RMSEA (.01) and Δ SRMR (.011). CFI indicates an inadequate fit for both tests but does not decrease substantially from the test of configural invariance to the test of factorial invariance. Much like in the first set of countries, all three indices indicate a progressively worse fit for the more stringent MI tests, and again, it is noteworthy that none of the models met the standard, more stringent cutoff points for a good fit for SRMR or RMSEA. As in the derivation sample, we tested a partial scalar invariance model that freed the intercept of the several items. The fit of the partial scalar invariance test was still inadequate but was an improvement over the full scalar invariance test. This suggests that the items identified as contributing most consistently to misfit in the derivation sample also contribute to misfit in the cross-validation sample.
Despite the low CFI values, it is worth considering the CFI in terms of its properties. CFI is a relative fit index, indicating how much fit is improved over the null (or independence) model. In these data (and data from previous studies on the structure of social axioms), many indicators have relatively modest loadings on the latent variables. The low (≤.80) CFI values communicate that the improvement over the null model is unremarkable. Thus, the CFI values mean that a caveat on any other index of fit here should be as follows: “The covariances of indicators and latent variables tended to be modest in magnitude.”
Other models were examined in an attempt to improve CFI. Factor indicators that consistently showed low loadings (<.2) or loaded in the opposite direction than expected on their factors across the countries were progressively eliminated to identify the core indicators of each factor. Social cynicism was left with three indicators (Items 2, 3, and 4). Reward for application was left with four indicators (Items 1, 2, 3, and 5). Social complexity was left with three indicators (Items 1, 4, and 9). Fate control was left with three indicators (4, 5, and 7). Religiosity was left with three indicators (Items 1, 2, and 3). With such a model, CFI only reached its more lenient cutoff point (.9) in one country, India, and the configural invariance model did not converge. 3 This suggests that, besides the five items previously identified and eliminated, the items of the SAS are comparable in quality, so it is difficult to identify core items to retain and peripheral items that can be eliminated. The source of misfit seems to be that the factors (particularly social complexity and fate control) are broad and diffuse. Consequently, their indicators show only modest loadings.
Discussion
The principal findings of the foregoing analyses are as follows: Using standard fit indices (Hu & Bentler, 1999), the fit of an optimized model with five social axioms dimensions was marginal at the configural and factorial levels across samples from a diverse group of countries around the world. This optimized model, while not demonstrating an exceptional fit, was an improvement over the standard model presented in the literature. SRMR and RMSEA indicated adequate though not close fit while CFI remained below a lenient threshold (.9). The SAS, then, has room for improvements.
The factor loadings of the indicators available in these data tended to be modest in magnitude, and better “relative fit” would be shown by indicators with higher loadings on the latent variables. Certain items, particularly the very few reverse-keyed items and certain indicators of fate control and social complexity, were identified as contributing to misfit. However, it was difficult to improve fit by eliminating items. This suggests that the problem is not necessarily that there are “good” core items and “less good” peripheral items but rather that the factors are broad and diffuse. Improvements would ideally refine the content domain that each factor is meant to cover. In particular, it may be useful to identify the core of the domain of each factor and represent that core with more indicators. Alternatively, it may be useful instead to split each factor into more tractable sub-dimensions.
Social complexity and fate control are the main offenders. They have previously demonstrated lower internal consistency and lower levels of cross-cultural replicability than the other factors (Leung et al., 2012). In this study, eliminating two indicators each for social complexity and fate control improves fit, further highlighting the need to improve the indicators for these factors especially and all social axioms factors in general. Leung and associates (2012) have produced a newer, longer version of SAS (that nevertheless includes the 30 indicators used in this study). The more recent version of the SAS may produce improved results.
Nevertheless, we believe it is quite impressive that the SAS shows even modest fit at the level of factorial invariance over such a diverse sample of countries, suggesting that people across the world are using more or less the same factors. The requirements of MI using CFA are stringent, especially when using single items as indicators, and the SAS performs better across multiple groups than several commonly used measures of personality show in a single group (Hopwood & Donnellan, 2010). This adds to the growing body of literature demonstrating the cross-cultural applicability of the SAS, its relative lack of an ethnocentric Western bias, and its criterion validity (e.g., C. Hui & Hui, 2009).
We should be clear about what the present analyses do not demonstrate. Because scalar and full MI remain to be established for this 30-item inventory, we cannot endorse the interpretation of cross-cultural differences in means. Even partial scalar invariance was difficult to achieve for this scale, and several items were identified that contribute to misfit due to having different levels of endorsement across groups. The invariance is nevertheless informative. The SAS does not have balanced keying. Only three items (“There is usually only one way to solve a problem,” “Religion makes people escape from reality,” and “Religion leads to unscientific thinking”) are reverse-keyed. Two of these items contributed to misfit and were eliminated. It is possible that increasing the number of reverse-keyed items would change their operation.
The lack of invariance also suggests an issue with multi-dimensionality. There is a subtle difference in content between the items that were identified as contributing most to scalar non-invariance, and those that were not. For example, the two non-invariant social cynicism items reference powerful people and their capacity to hurt or exploit others, whereas the two other (better performing) items reference kind-hearted people as victims. Power and powerful people have political connotations that may be the source of the variability in their base level of endorsement in different groups. Fate control is similarly heterogeneous in content. The core of the subscale seems to be related to “All things in the universe have been determined” and “Fate determines one’s successes and failures,” both fundamental, generalized assumptions about the world. “Characteristics that one is born with like appearance affect one’s fate,” which was non-invariant, is distinct in identifying one specific determinant of fate, rather than belief in fate generally; it may be that countries vary less on belief in fate than on what the specific determinants of fate are. Given that it focuses on a particular characteristic (appearance), it is more likely to be differentially endorsed across countries. The non-invariant social complexity item is the only item in that subscale to reference feelings. Most others focus strictly on behavior.
Similar problems of multi-dimensionality and large factor correlations were found with the shortened 22-item Portrait Values Questionnaire measure of the Schwartz Human Values Scale used in the European Social Survey (Beierlein, Davidov, Schmidt, Schwartz, & Rammstedt, 2012; Knoppen & Saris, 2009). Items were selected to broaden the coverage of the factors. Consequently, within-factor correlations (and factor loadings) were small whereas across-factor correlations (and cross-loadings and factor inter-correlations) were large. Certain pairs of factors were indistinguishable. Recommendations for improvement included changing item selection so that the content covered by each factor was uniform or merging indistinguishable factors. In response, Schwartz and colleagues (2012) developed a new measure of human values consisting of 19 factors, much narrower in scope than the original 10, that still adequately covered the values domain. The factors were more homogeneous, factor loadings were high, and cross-loadings low. In addition, the original 10 values could be retrieved from the new 19. This measure apparently compromised neither fit nor coverage. The literature on human values demonstrates a promising avenue for improving the SAS. The current 5 factors could serve as over-arching factors for a greater number of more homogeneous factors that would be more coherent.
Finally, the SAS is designed to represent a domain of beliefs about the world, and the present analyses do not address its relative comprehensiveness of that domain. Model fit is an important criterion for measurement quality, but not the only one; there are a variety of criteria for what makes a model good (Saucier & Srivastava, in press). Capacity to be predictive of important outcomes may be only partly dependent on the tight factor structure and other qualities assessed in MI testing, and such predictiveness is not evaluated in the present study. Many broadband personality inventories perform poorly on tests of MI and still have good criterion validity (Hopwood & Donnellan, 2010).
Conclusion
Some evidence was found for factorial invariance of a five-factor model of social axioms samples from a diverse sample of countries around the world. This finding indicates some cross-cultural generalizability for this structure, although the set of indicators for this structure tended to show modest loadings and clearly need development and refinement. This study adds to the growing body of literature demonstrating the cross-cultural applicability of the Social Axioms Survey while simultaneously noting areas where the measure could be improved.
Footnotes
Appendix
Standardized Factor Loadings of Indicators on Intended Factors Across Countries.
| Items | India | Argentina | Poland | Mexico | Ukraine | Ethiopia | Kenya | Canada | Singapore | Turkey | Germany | Nepal | Brazil | Peru | China | England | Philippines | Thailand | Taiwan | Tanzania | USA | Spain | Japan |
|---|---|---|---|---|---|---|---|---|---|---|---|---|---|---|---|---|---|---|---|---|---|---|---|
| CY1 | .367 | .230 | .576 | .249 | .162 | .700 | .235 | .389 | .687 | .513 | .660 | .527 | .316 | .562 | .700 | .421 | .473 | .565 | .808 | .540 | .230 | .595 | .410 |
| CY2 | .490 | .365 | .554 | .399 | .218 | .818 | .340 | .472 | .752 | .532 | .699 | .465 | .515 | .607 | .696 | .471 | .468 | .679 | .791 | .697 | .359 | .363 | .309 |
| CY3 | .574 | .752 | .694 | .552 | .711 | .284 | .749 | .753 | .496 | .596 | .169 | .497 | .682 | .512 | .455 | .605 | .575 | .475 | .480 | .297 | .774 | .595 | .635 |
| CY4 | .541 | .574 | .667 | .587 | .703 | .303 | .595 | .736 | .504 | .386 | .162 | .569 | .680 | .435 | .460 | .769 | .660 | .469 | .417 | .467 | .684 | .600 | .805 |
| RA1 | .531 | .517 | .454 | .445 | .290 | .568 | .618 | .600 | .522 | .427 | .684 | .704 | .659 | .391 | .580 | .442 | .689 | .267 | .510 | .310 | .651 | .426 | .657 |
| RA2 | .538 | .307 | .461 | .589 | .536 | .586 | .528 | .424 | .488 | .439 | .388 | .616 | .271 | .354 | .147 | .366 | .598 | .613 | .514 | .250 | .548 | .398 | .267 |
| RA3 | .565 | .472 | .730 | .480 | .678 | .376 | .550 | .724 | .721 | .567 | .601 | .701 | .737 | .643 | .479 | .758 | .700 | .693 | .662 | .379 | .681 | .653 | .456 |
| RA4 | .287 | .256 | .077 | .413 | .173 | .226 | .455 | .187 | .240 | .349 | .296 | .367 | .490 | .288 | .278 | −.037 | .427 | .252 | .177 | .456 | .267 | .281 | .353 |
| RA5 | .485 | .660 | .701 | .688 | .486 | .506 | .380 | .603 | .716 | .626 | .536 | .662 | .726 | .655 | .629 | .543 | .671 | .691 | .594 | .629 | .589 | .499 | .440 |
| SC1 | .603 | .404 | .469 | .569 | .564 | .496 | .553 | .685 | .758 | .488 | .594 | .709 | .410 | .466 | .688 | .760 | .631 | .426 | .653 | .522 | .643 | .700 | .633 |
| SC2 | .382 | .367 | .530 | .441 | .563 | .380 | .319 | .632 | .734 | .479 | .474 | .627 | .539 | .306 | .579 | .647 | .419 | .416 | .399 | .410 | .599 | .585 | .626 |
| SC3 | .379 | .520 | .399 | .411 | .493 | .531 | .434 | .628 | .626 | .510 | .488 | .541 | .494 | .340 | .585 | .626 | .562 | .417 | .380 | .563 | .637 | .725 | .660 |
| SC4 | .556 | .339 | .421 | .538 | .561 | .477 | .592 | .709 | .530 | .479 | .566 | .696 | .540 | .312 | .663 | .508 | .628 | .526 | .676 | .455 | .579 | .621 | .769 |
| SC5 | .270 | .484 | .453 | .485 | .228 | .478 | .317 | .473 | .430 | .347 | .364 | .598 | .371 | .232 | .570 | .168 | .439 | .472 | .551 | .324 | .392 | .460 | .503 |
| SC6 | .426 | .230 | .324 | .215 | .187 | .455 | .350 | .584 | .594 | .268 | .505 | .040 | .146 | .261 | .631 | .356 | .479 | .416 | .627 | .244 | .559 | .297 | .404 |
| SC7 | −.147 | −.218 | −.214 | −.098 | −.453 | −.333 | −.384 | −.218 | −.400 | −.327 | −.398 | −.287 | −.016 | −.008 | −.507 | −.220 | .095 | −.159 | −.435 | −.124 | −.414 | −.251 | −.319 |
| SC8 | .118 | .020 | −.077 | .455 | .040 | .481 | .262 | .124 | .255 | .008 | .062 | .477 | .070 | .177 | .307 | −.066 | .472 | .176 | .257 | .373 | .274 | .148 | .322 |
| SC9 | .463 | .292 | .612 | .390 | .409 | .548 | .596 | .609 | .526 | .324 | .496 | .397 | .492 | .464 | .521 | .285 | .620 | .366 | .543 | .639 | .547 | .613 | .693 |
| SC10 | .370 | .195 | .389 | .157 | .248 | .295 | .316 | .565 | .438 | .260 | .515 | .437 | .167 | .338 | .662 | .315 | .449 | .315 | .571 | −.024 | .486 | .408 | .589 |
| FC1 | .507 | .174 | .438 | .411 | .298 | .366 | .441 | .401 | .456 | .045 | .228 | .475 | .051 | .534 | .519 | .447 | .521 | .577 | .551 | .464 | .187 | .567 | .307 |
| FC2 | .332 | −.150 | .394 | .468 | .017 | .424 | .373 | .411 | .048 | −.157 | .267 | .195 | .131 | .505 | .409 | .465 | .465 | .351 | .297 | .730 | .398 | .350 | .029 |
| FC3 | .476 | −.027 | .272 | .453 | .076 | .448 | .388 | .519 | .281 | .082 | .246 | .197 | .228 | .544 | .262 | .650 | .452 | .503 | .162 | .699 | .394 | .210 | .262 |
| FC4 | .487 | .460 | .556 | .502 | .501 | .333 | .534 | .773 | .678 | .461 | .608 | .384 | .429 | .477 | .635 | .737 | .547 | .521 | .739 | .216 | .695 | .711 | .750 |
| FC5 | .303 | .226 | .329 | .483 | .533 | .516 | .628 | .697 | .478 | .210 | .375 | .382 | .468 | .544 | .153 | .737 | .678 | .429 | .185 | .348 | .711 | .503 | .196 |
| FC6 | .284 | .408 | .288 | .275 | .345 | .295 | .181 | .311 | .423 | .239 | .261 | .311 | .506 | .130 | .547 | .446 | .182 | .363 | .526 | −.049 | .264 | .427 | .243 |
| FC7 | .497 | .616 | .335 | .454 | .677 | .369 | .230 | .442 | .551 | .879 | .728 | .520 | .382 | .299 | .594 | .681 | .249 | .644 | .494 | .559 | .459 | .559 | .745 |
| RE1 | .737 | .856 | .828 | .544 | .681 | .645 | .708 | .812 | .796 | .902 | .780 | .808 | .664 | .751 | .826 | .895 | .805 | .797 | .680 | .750 | .869 | .718 | .598 |
| RE2 | .724 | .700 | .684 | .717 | .820 | .675 | .798 | .833 | .763 | .780 | .723 | .675 | .794 | .790 | .739 | .843 | .779 | .742 | .820 | .637 | .691 | .815 | .866 |
| RE3 | −.213 | −.595 | −.698 | −.385 | −.483 | −.200 | −.112 | −.533 | −.397 | −.750 | −.646 | −.344 | −.464 | −.421 | −.102 | −.211 | −.031 | −.380 | −.403 | −.316 | −.444 | −.256 | −.066 |
| RE4 | −.208 | −.303 | −.478 | −.114 | −.411 | −.040 | .003 | −.502 | −.364 | −.603 | −.512 | −.221 | −.298 | −.288 | −.202 | −.556 | −.030 | −.258 | −.348 | −.177 | −.383 | −.154 | −.029 |
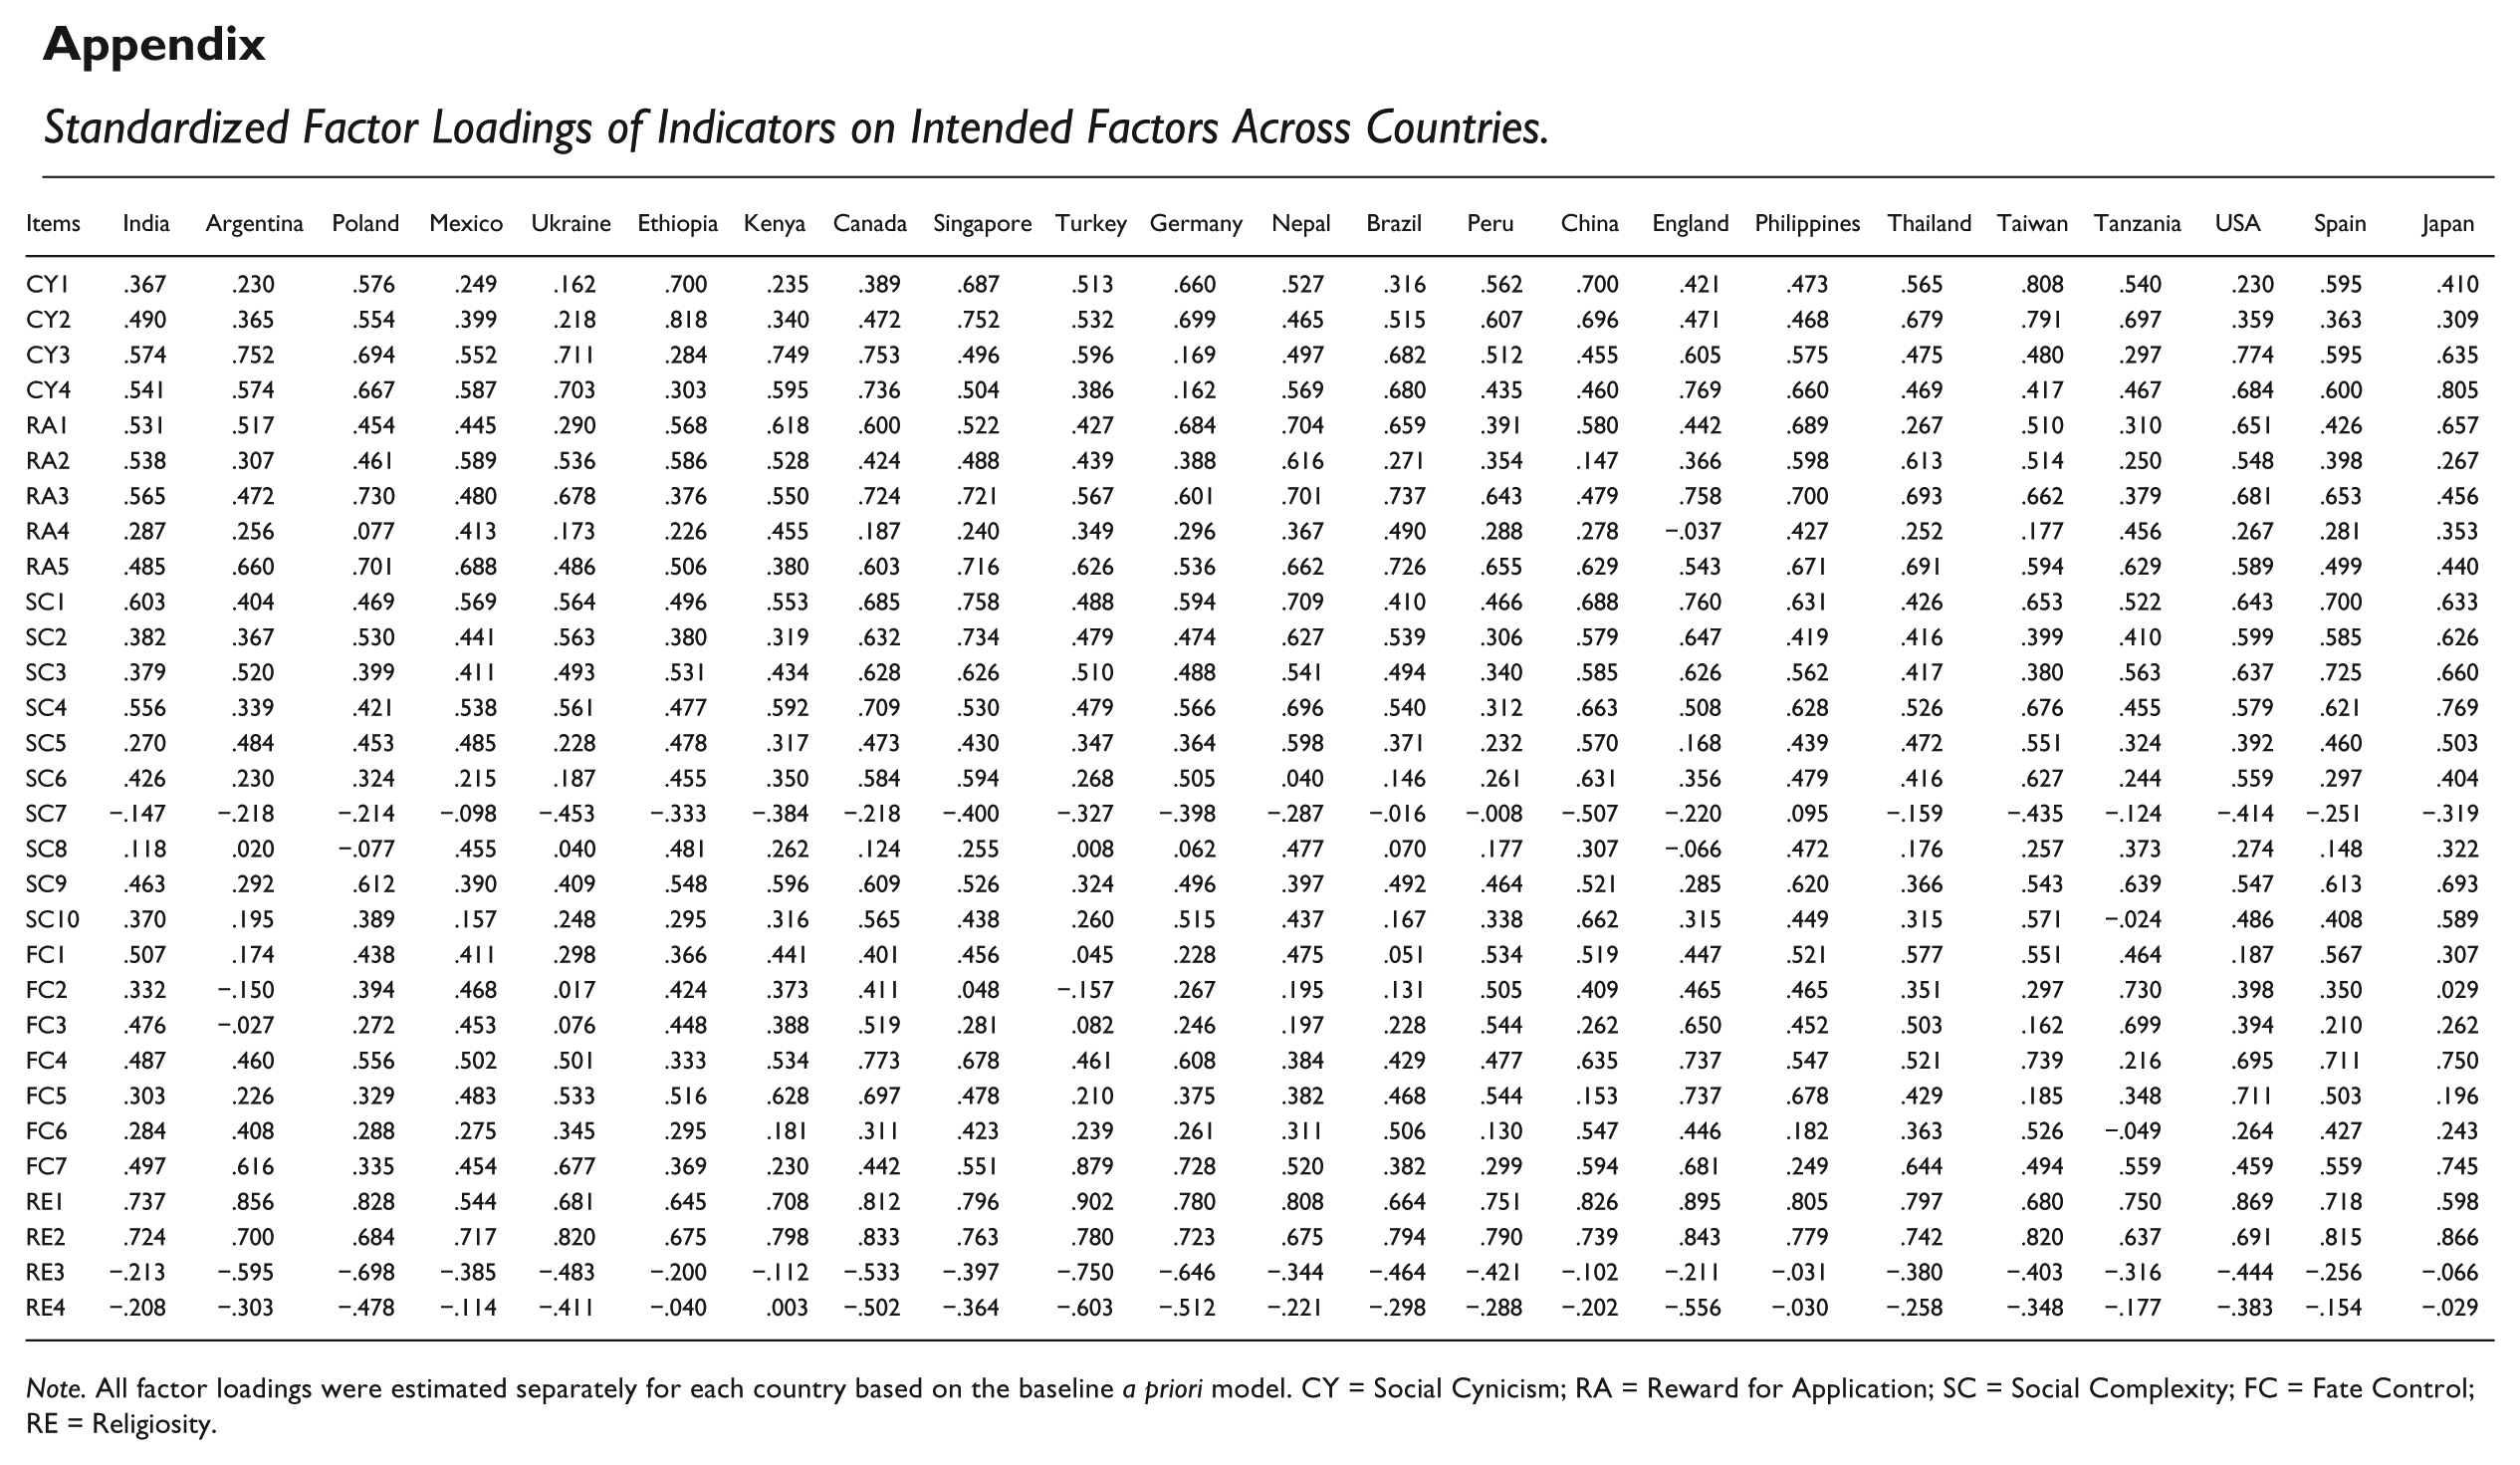
Note. All factor loadings were estimated separately for each country based on the baseline a priori model. CY = Social Cynicism; RA = Reward for Application; SC = Social Complexity; FC = Fate Control; RE = Religiosity.
Declaration of Conflicting Interests
The author(s) declared no potential conflicts of interest with respect to the research, authorship, and/or publication of this article.
Funding
The author(s) disclosed receipt of the following financial support for the research, authorship, and/or publication of this article: This project benefited from Grant FA-9550-09-1-0398, Air Force Office of Scientific Research.