
Abstract
In two studies, we examined the shared and unique meaning of acquiescent, extreme, midpoint, and socially desirable responding in association with the Occupational Personality Questionnaire (OPQ32), a forced-choice format personality measure designed to be less affected by these response styles, compared with personality inventories with Likert-type scales. Country-level response style indexes were derived from six waves of the International Social Survey Programme and from a meta-analysis of a social desirability scale. In the country-level correlational analysis, the four response styles formed a general response style (GRS) factor which was positively associated with (a) dominance (vs. submission) in interpersonal relationships, (b) competitive (vs. modest and democratic) feelings and emotions, and (c) data rational thinking. In a multilevel analysis, age showed a positive and education a negative effect on the individual-level GRS. Negative effects of country-level socioeconomic development and individualism and positive effects of competitiveness and data rational thinking on the individual-level response style were found. We conclude that country-level response styles are systematically associated with country personality measured by the OPQ32, suggesting that they can be viewed as having substantive meaning (i.e., culturally influenced response amplification vs. moderation). Implications are discussed.
Keywords
This article focuses on the association of response styles and personality traits in a cross-cultural context. Response styles are defined as respondents’ systematic tendency to answer questionnaire items on some basis other than the specific item content (Paulhus, 1991). Response styles can create validity threats in cross-cultural studies, because observed score differences across cultures may not reflect true differences in the target construct, due to confounding response styles (e.g., van Herk, Poortinga, & Verhallen, 2004). We investigate the shared and unique meaning of the four most studied response styles, namely, acquiescent response style (ARS: the tendency to agree to a statement regardless of content), extreme response style (ERS: the tendency to overuse the end points of a scale), midpoint response style (MRS: the tendency to overuse the midpoint of a scale), and socially desirable responding (SDR: the tendency to answer questions in a way to make oneself look good). ARS, ERS, and MRS can be categorized as uniform response biases (i.e., the tendency to distort responses in a particular direction more or less regardless of the content of the stimulus), whereas SDR is more susceptible to the direction of the content (Cheung & Chan, 2002).
The consistency and stability of these response styles (e.g., Weijters, Geuens, & Schillewaert, 2010) point to their trait-like properties and possibly even links to personality. Researchers have found associations among response styles and personality traits at both individual and country levels. At individual level, ARS was associated with impulsiveness and extraversion (Couch & Keniston, 1960). ERS was positively related to intolerance of ambiguity, simplistic thinking, decisiveness, extroversion, and conscientiousness (Austin, Deary, & Egan, 2006; Naemi, Beal, & Payne, 2009). MRS was associated with evasiveness (Ayidiya & McClendon, 1990). SDR was associated with the general personality factor which consists of the combination of agreeableness, conscientiousness, extroversion, openness, and emotional stability (Bäckström, 2007; Schermer & MacDougall, 2013). However, a clear patterning of correlations between personality and response styles has not been established at country level, mainly because relatively few studies have been conducted. Harzing (2006) reported a positive association of extroversion with ERS and a negative one with MRS; McCrae, Terracciano, and 79 Members of the Personality Profiles of Cultures Project (2005a) reported a negative association of conscientiousness with ARS. Smith (2011) reported a negative association of openness with ARS and none of the Big Five personality traits related to ERS.
Findings on these reported associations could be challenged on two grounds. First, the operationalizations of response styles were different in various studies. For instance, when constructed as the endorsement rate of the agree and strongly agree categories (e.g., 4 and 5 in a 5-point scale), ARS becomes a weak form of ERS (e.g., van Herk et al., 2004); when only the agree category is taken as ARS (e.g., 4 in a 5-point scale) to avoid confounding with ERS, ARS is more related to MRS (e.g., He & van de Vijver, 2013). Second, and more importantly, personality traits, often used as the validity measures of response styles, are typically measured with Likert-type scales, which themselves are likely to be tainted by the same response styles as are being investigated (Bentler, Jackson, & Messick, 1971).
The present study aims to address the two problems raised. To create consistency in the operationalizations of response styles, we integrate the four response styles in a general response style (GRS) to achieve more robust estimates, in addition to examining each response style separately. We predict response styles with personality traits using the forced-choice format version of the Occupational Personality Questionnaire (OPQ32) provided by SHL, a talent measurement solutions company (SHL, 1999, 2006, 2013). SHL is a part of CEB (Corporate Executive Board), which provides talent management services for organizations all over the world. The major difference in the forced-choice format and the conventional Likert-type scale personality instrument is that the former is robust to uniform response biases (i.e., ARS, ERS, and MRS), which allows us to measure country-level personality traits free from these uniform effects of response styles and to explain country variations in response styles that are found using other formats (e.g., Likert-type scales). In Study 1, we constructed country-level response style indexes and studied their integration and correlations with aggregated personality traits. Based on the country-level correlates identified, we applied a multilevel design in Study 2 to examine the unique variance explained by aggregated personality traits in individual-level response styles.
Study 1: Country-Level Analysis of Response Styles and Personality
We test the personality correlates of response styles and examine the convergence of results from personality traits measured with various formats. We focus on relationships of response styles with the forced-choice item format version of the OPQ32. We also use other personality instruments, which employ conventional Likert-type scales, to compare results of instruments that are more susceptible to influences of response styles and to test the generalizability of our results.
Specific Response Style and GRS
It has been found that there is a predictable pattern of correlations among ARS, ERS, MRS, and SDR. ERS and MRS are negatively related to each other, reflecting the contrast of promotion and prevention focus (Cabooter, 2010). ERS and SDR are positively related, as both are associated with desirable traits, such as extroversion and conscientiousness (Austin et al., 2006; Schermer & MacDougall, 2013). ARS, when operationalized as endorsing only the agree category, shows a negative correlation with ERS (Morren, Gelissen, & Vermunt, 2013). To integrate the full range of response styles, a GRS factor can be extracted with ERS and SDR as positive indicators and ARS and MRS as negative indicators (He & van de Vijver, 2013). This GRS factor serves as a filter of questionnaire responses, by moderating or amplifying responses. In other words, the GRS factor has the function of a volume button that can play up or play down responses.
OPQ32
The OPQ32 measures 32 work-related personality traits defined as individual styles or preferences at work in three domains: relationships with people, feelings and emotions, and thinking style (see Table 1 for an overview; SHL, 2009). It was developed with both a normative (Likert-type scales, OPQ32n) and a forced-choice version (OPQ32i, in which respondents choose one statement as most like me and one as least like me in blocks of four statements; SHL, 1999, 2006). The OPQ32i was further evolved, resulting in the OPQ32r (SHL, 2013), which has 104 triplets selected from the original version. Responses to the triplets are scored as paired comparisons to which a multidimensional item response modeling model is applied. It can recover normative scale data from the forced-choice item format (SHL, 2006, 2013). Compared with the OPQ32n and OPQ32i, the OPQ32r measures the same constructs, demonstrates good psychometric properties and external validity, provides a good indication of the trait standing, and, like the OPQ32i, is robust to the effects of uniform response biases.
Definitions of the OPQ32 Scales.

Note. OPQ32 = Occupational Personality Questionnaire.
Through combining 26 out the 32 personality scales in the OPQ32, the Big Five personality scores can be produced (SHL, 2006). Furthermore, the OPQ32 has been adapted for use in 30 languages, and the construct and scalar equivalence have been demonstrated across 39 countries (Bartram, 2013a, 2013b); thus, this country-level measure is proven to be suitable for cross-cultural comparative studies.
The Present Study
Based on what has been reviewed, we aimed to answer three research questions in the present study. First, can a GRS factor, that was found previously at individual level (He & van de Vijver, 2013), be replicated at country level? We expect to find the same GRS factor with positive loadings of ERS and SDR and negative loadings of ARS and MRS at country level.
Second, what are the associations of response styles with expressions of personality traits that are free of uniform response biases? If response styles reflect culturally preferred communication styles (e.g., Smith, 2004), we expect that the preference to dominate in relationships, characterized by high levels of being controlling and outspoken and low levels of being affiliative, modest, and democratic, would be positively related to response styles (in the direction of ERS and SDR vs. ARS and MRS). In the feeling and emotions domain, we expect that being competitive and decisive would be associated with higher levels of response styles (Naemi et al., 2009). In the thinking domain, the preference to analyze statistical information and base inferences on facts and figures (i.e., data rational) to reduce ambiguity may boost the tendency to use response styles.
Third, is there convergence in the associations of response styles with the Big Five personality traits measured with the forced-choice format (i.e., the OPQ32r) and other Likert-based inventories? If response styles only reflect scale usage, we would expect that a forced-choice questionnaire would show other correlations with measured personality traits than a Likert-based measure would. However, if response styles share trait variance with personality, we would expect more convergence between the two types of measures. Bartram (2013a) compared the 31 country-level Big Five scale means extracted from the OPQ32i with three other data sets: the Likert-based self-report of the Revised NEO Personality Inventory (self-report NEO) and other-report of this instrument (other-report NEO), and the Likert-based self-report Big Five Inventory (BFI). He found moderate convergence among these four data sets.
Method
Data sources for ARS, ERS, and MRS
We located six waves of the International Social Survey Programme (ISSP 2003, 2004, 2005, 2006, 2007, and 2008 from www.issp.org) with national representative samples from over 30 countries that had items suitable to construct ARS, ERS, and MRS indexes. Detailed information of the surveys and use of items for response style indexes is presented in Table 2.
Overview of Surveys.

Note. ISSP = International Social Survey Programme; ARS = acquiescent response style; ERS = extreme response style; MRS = midpoint response style.
We computed indicators of ARS, ERS, and MRS, using a variety of items that measured different constructs with Likert-type scales in each survey. The average inter-item correlations among items for each response style index ranged from −.01 to .20, indicating sufficient heterogeneity in item content (e.g., Greenleaf, 1992b). We used different items to compute each index, which ensured data independence and avoided statistical artifacts in testing the interrelatedness of response styles. ARS scores were derived from a set of items with five response options, ranging from 1 (strongly agree) to 5 (strongly disagree); the frequency of choosing 2 (agree) was taken as an ARS score (the endorsement of 1 = strongly agree was not used to avoid the confounding with ERS). 1 Due to the limited number of Likert-type scale items with the strongly agree to strongly disagree anchors available in the ISSP data sets, ARS indexes were constructed with smaller numbers of items compared with ERS and MRS. ERS was derived from another set of items with various response options (e.g., not at all to very much, not important to extremely important) other than agree–disagree scales; the frequency of choosing the end points (e.g., 1 and 5 in a 5-point scale) was taken as an ERS score. MRS was constructed with a third set of items with various response options; the frequency of choosing the middle category (e.g., 3 in a 5-point scale) was taken as an MRS score. For each style, we first calculated the individual index for each respondent, and then averaged the indexes across members of the same country to obtain a country-level index.
To get a global indication of country-level response styles, we replaced the missing values of the three response style indexes across the six surveys (20.45% missing) using Expectation-Maximization imputation, given that the missing values were missing completely at random (MCAR) (Little’s MCAR test: χ2(120) = 137.90, p = .13; Little & Rubin, 2002). We treated the six indexes of each response style as scale items, and used the means across the six surveys as scores of ARS, ERS, and MRS. The values of Cronbach’s alpha for the ARS, ERS, and MRS indexes were .85, .88, and .84, respectively.
Data sources for SDR
Scores on the country-level SDR were derived from an instrument-based meta-analysis (van Hemert, 2003) of the Marlowe–Crowne Social Desirability Scale from 42 countries (Domínguez Espinosa & van de Vijver, 2012). This scale was chosen because of its popularity over the years and prolific publications around the world. A total of 1,052 publications from 1960 to 2011, which used the Marlowe–Crowne Social Desirability Scale or its various short forms, were reviewed. Data from 153 journal articles, 4 unpublished theses, and 1 technical report were retained after excluding studies with clinical, army, and inmate samples, and studies with “faking” or experimental instructions. Among all the studies, the scale was used in English (49.7%); French (10.1%); Spanish (8.2%); Chinese (6.9%); German (5.7%); Danish (3.8%); Portuguese (2.5%); Japanese, Swedish, Hebrew, Turkish, and Arab/Iranian (1.9% each); Italian and Dutch (1.3% each); and Croatian, Greek, Norwegian, Indonesian, and Hindu (0.6% each). Means and standard deviations of the Marlowe–Crowne Social Desirability Scale were recorded for each study and aggregated to country level. We used the mean scores of SDR at country level in the present study (for more details of the meta-analysis and country rankings, refer to Domínguez Espinosa & van de Vijver, 2012).
Aggregated personality traits
The country-level sten scores (standardized scores ranging from 1 to 10, with a mean of 5.5 and a standard deviation of 2) of the 32 narrow personality traits as well as the Big Five personality traits from the OPQ32r in 39 countries were obtained from 113,480 working adults with over 20 languages in the data pool of SHL (Bartram, 2013b). These data were collected as part of occupational assessments (i.e., for selection or development purposes in the workplace).
The country-level scale means of the Big Five personality traits from 31 countries with the self-report NEO were obtained from McCrae (2002). The respondents were college students and working adults. The country-level scale means of the Big Five personality traits from 50 countries with the other-report NEO were obtained from McCrae et al. (2005b). The respondents were college students who were instructed to rate someone they knew well.
The country-level scale means of the Big Five personality traits from 56 countries with the self-report BFI were obtained from Schmitt, Allik, McCrae, and Benet-Martínez (2007). The respondents were mainly college students and in a few countries community-based samples.
Results
We report the findings in three parts. We first examined the interrelatedness of the four response styles at country level and the extraction of a GRS factor; then we correlated the response styles with the 32 personality scales from the OPQ32r; and finally, we compared the correlation patterning of response styles with the four sets of Big Five personality data.
Interrelatedness among response styles
Table 3 presents the correlations among the four response styles at country level. ERS and SDR were positively related, and both were negatively related to MRS. The correlations of ARS with the other three response styles were nonsignificant. A one-factor solution was supported from the principal components analysis with the four response styles. This factor (explaining 54.76% of the variance) had positive loadings of ERS (loading .87) and SDR (.72), a negative loading of MRS (−.96), and a loading close to zero for ARS (−.05). This finding largely replicates the GRS representing response moderation to amplification (He & van de Vijver, 2013). The only difference with the previous study was that in the present study ARS had a negative loading closer to zero. We used the factor score as an index of GRS.
Correlations Among the Response Style Indexes at Country Level.
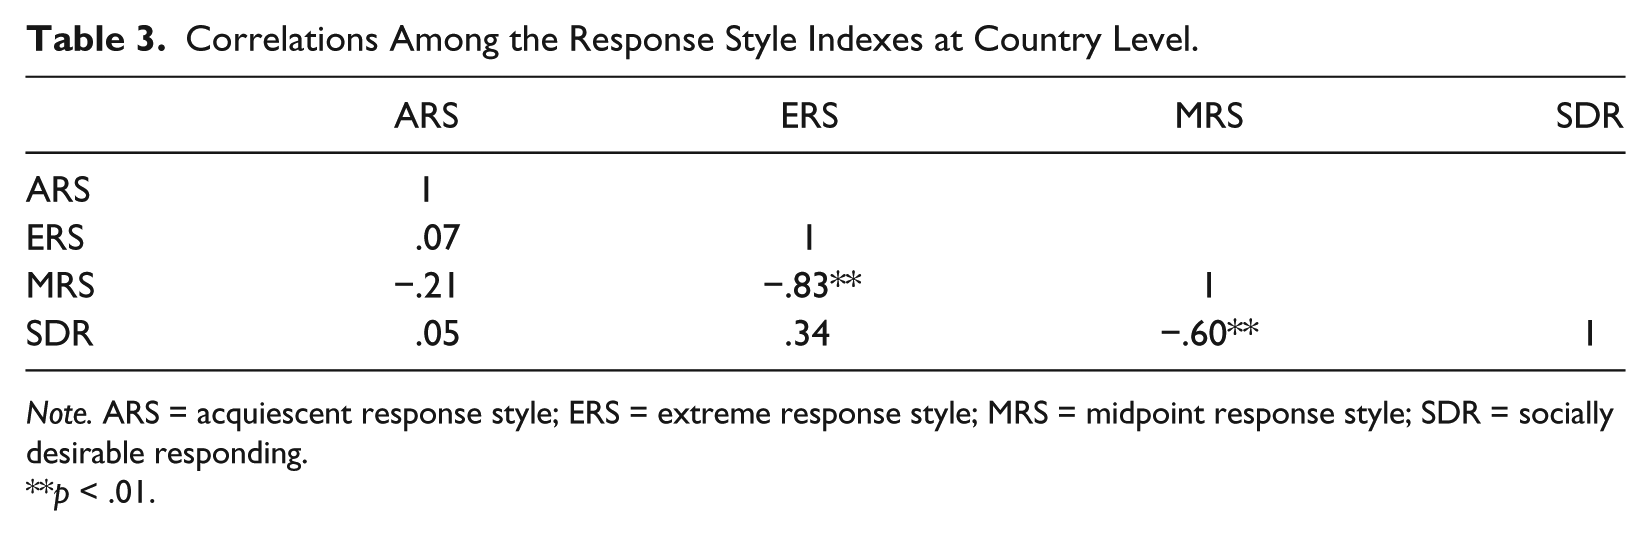
Note. ARS = acquiescent response style; ERS = extreme response style; MRS = midpoint response style; SDR = socially desirable responding.
p < .01.
Associations of response styles with the 32 personality scales
The response style indexes, including GRS, ARS, ERS, MRS, and SDR, were correlated with the 32 scales of personality traits from the OPQ32r (Table 4). GRS was positively related to Competitive and Data Rational, and negatively related to Affiliative, Modest, Democratic, Caring, and Relaxed. Although not statistically significant, Persuasive, Controlling, and Worrying showed positive associations, and Adaptability, Trusting, Emotionally Controlled, and Vigorous showed negative associations with GRS. The contrast in correlational patterns between ERS and MRS was most salient; ERS had positive associations with Persuasive, Controlling, Outspoken, and Innovative, and negative associations with Affiliative, Adaptable, Democratic, and Emotionally Controlled, whereas MRS showed an opposite pattern. ARS was not significantly associated with these personality traits. SDR was positively related to Independent Minded and negatively related to Affiliative.
Zero-Order Correlation of Response Styles With the OPQ32r at Country Level.
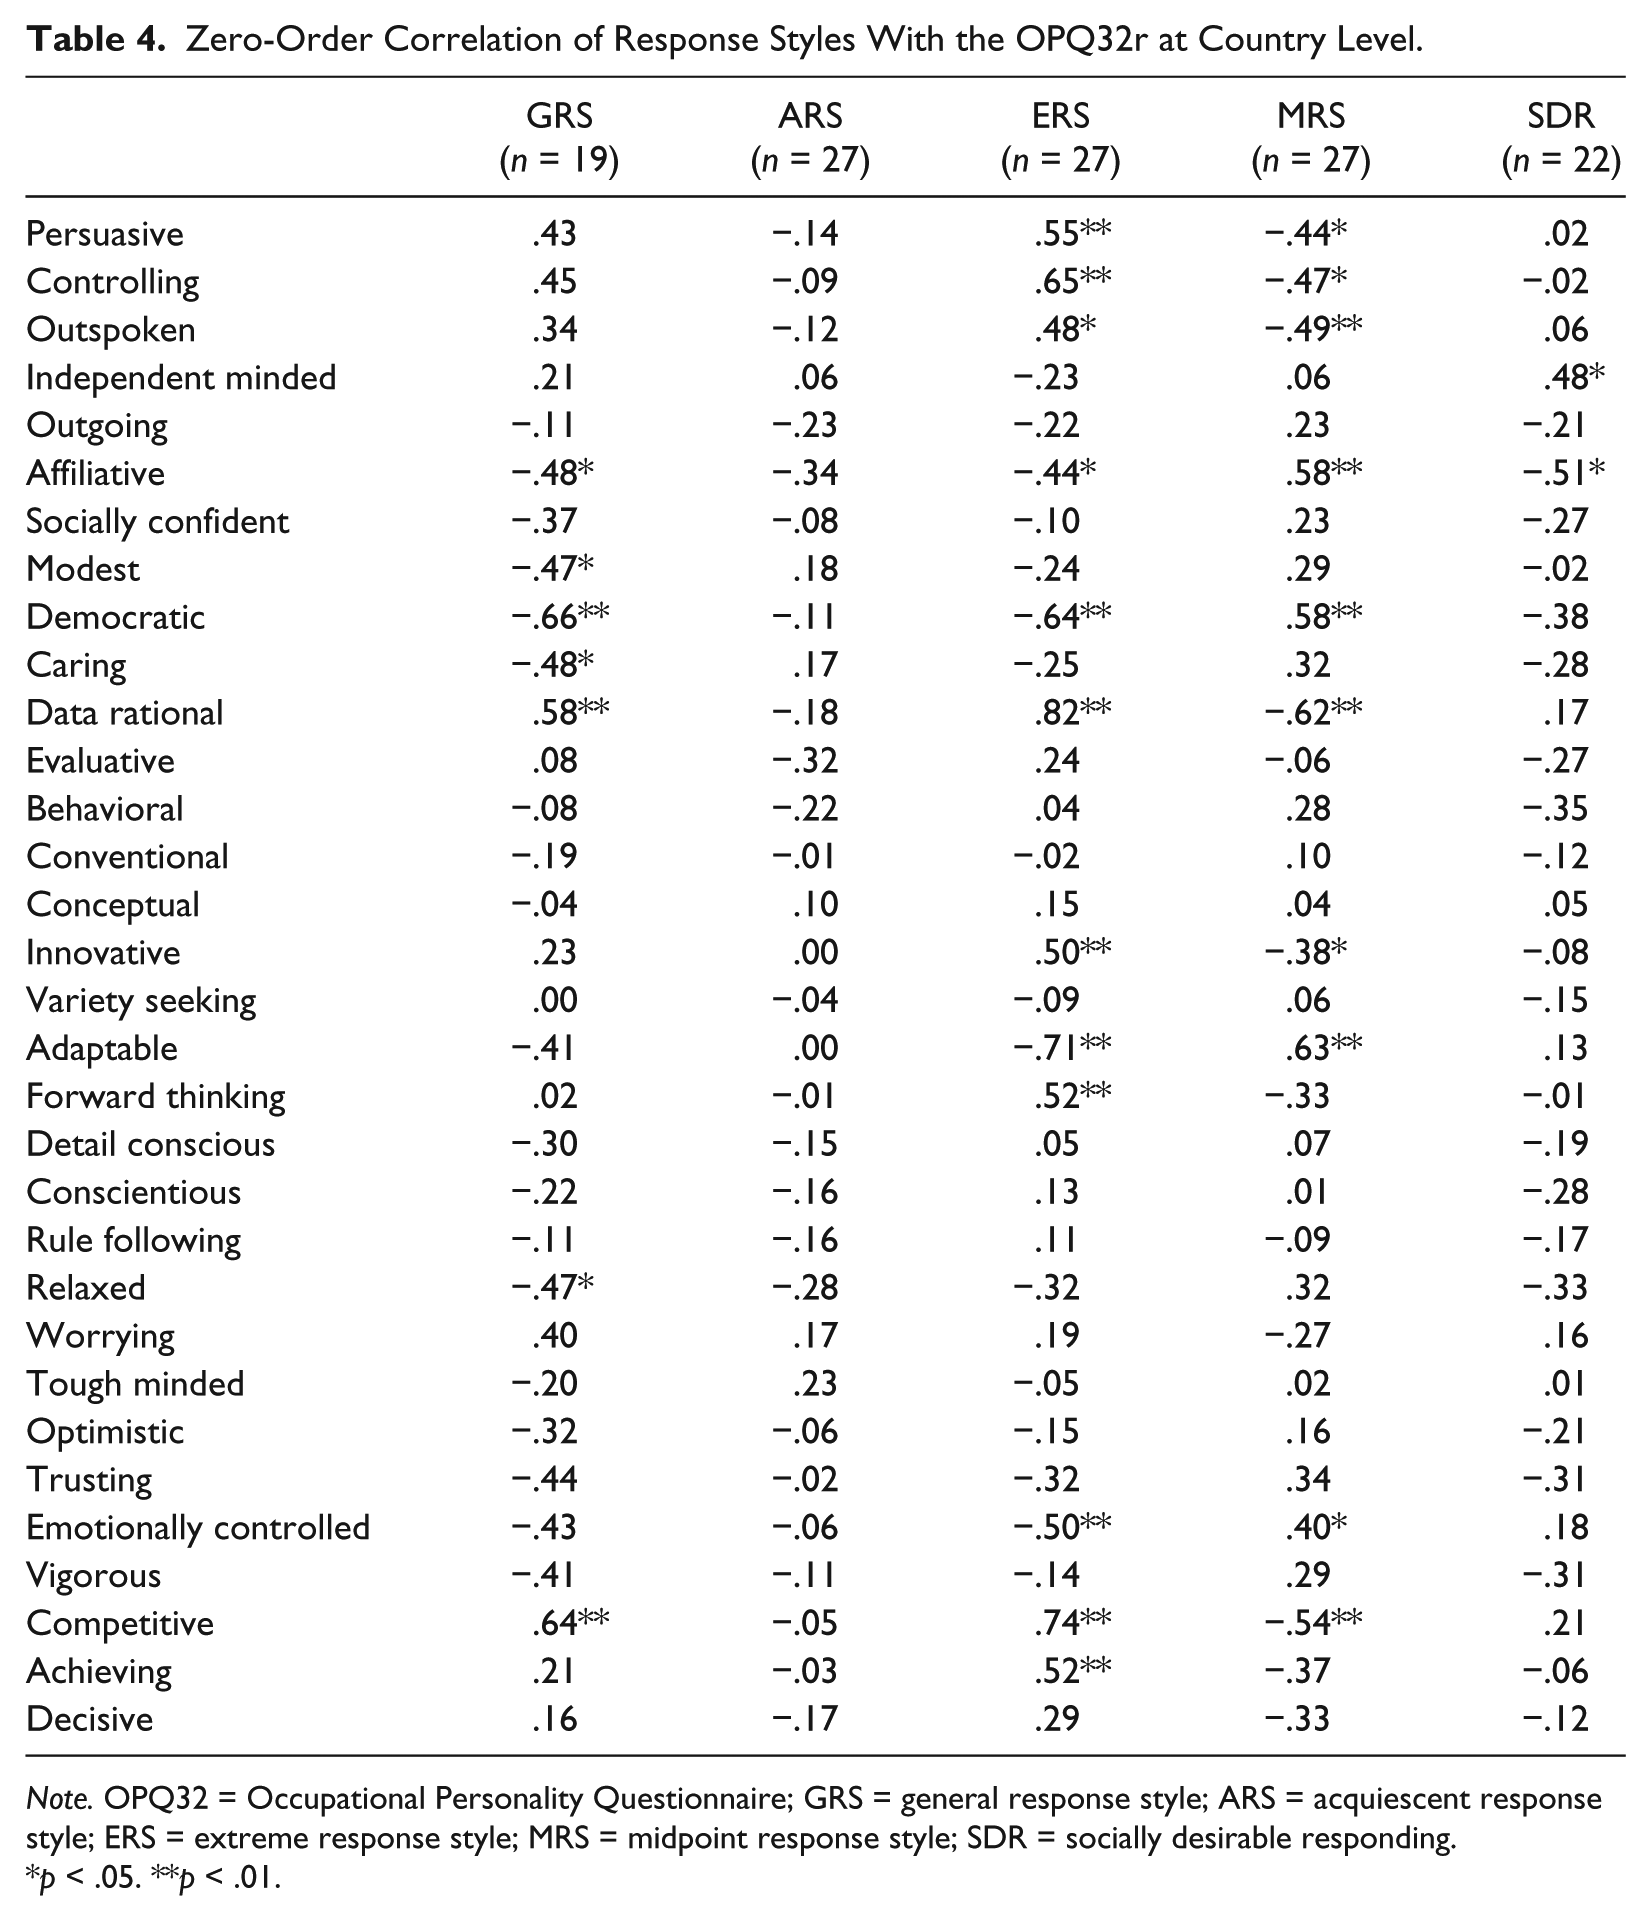
Note. OPQ32 = Occupational Personality Questionnaire; GRS = general response style; ARS = acquiescent response style; ERS = extreme response style; MRS = midpoint response style; SDR = socially desirable responding.
p < .05. **p < .01.
Associations of response styles with the Big Five personality traits
We correlated the response style indexes with the Big Five personality traits measured by the OPQ32r, self-report NEO, other-report NEO, and self-report BFI (Table 5). GRS was strongly correlated with the OPQ-based agreeableness (negative) and the NEO-based self-report conscientiousness (positive). Emotional stability and extroversion from all the four sets of data were unrelated to any of the response styles. However, the main finding of the analysis was the weak convergence of correlations across instruments. Across all traits, correlations between the correlations shown in Table 5 across instruments were only significant for the two NEO measures, r(25) = .80, p < .001. Notably, the absence of any relationship between the two Likert-based self-report measures is remarkable, even if a lack of significant correlations is a recurrent problem in this field. Moreover, we could not replicate the association of extroversion with ERS and MRS that was found by Harzing (2006), probably due to the different personality measures used (in Harzing’s study, extroversion was from the Eysenck Personality Questionnaire that stresses expressiveness and liveliness). Contrary to McCrae et al. (2005a), we found a positive association of ARS with conscientiousness, which could be explained by the very different operationalization of ARS in their study (i.e., the sum of the raw scores of the 240 NEO personality items as ARS). The failure to replicate the negative association of ARS with openness as in Smith (2011) may be attributed to a similar cause (ARS there was calculated using twice the number of scale point “5” responses, plus the number of scale point “4” responses in a 5-point scale). Our findings suggest that response styles are instrument specific; yet, we cannot rule out the impact of sample incomparability as all measures are based on convenience sampling.
Correlations of Response Styles With Big Five Personality Traits.
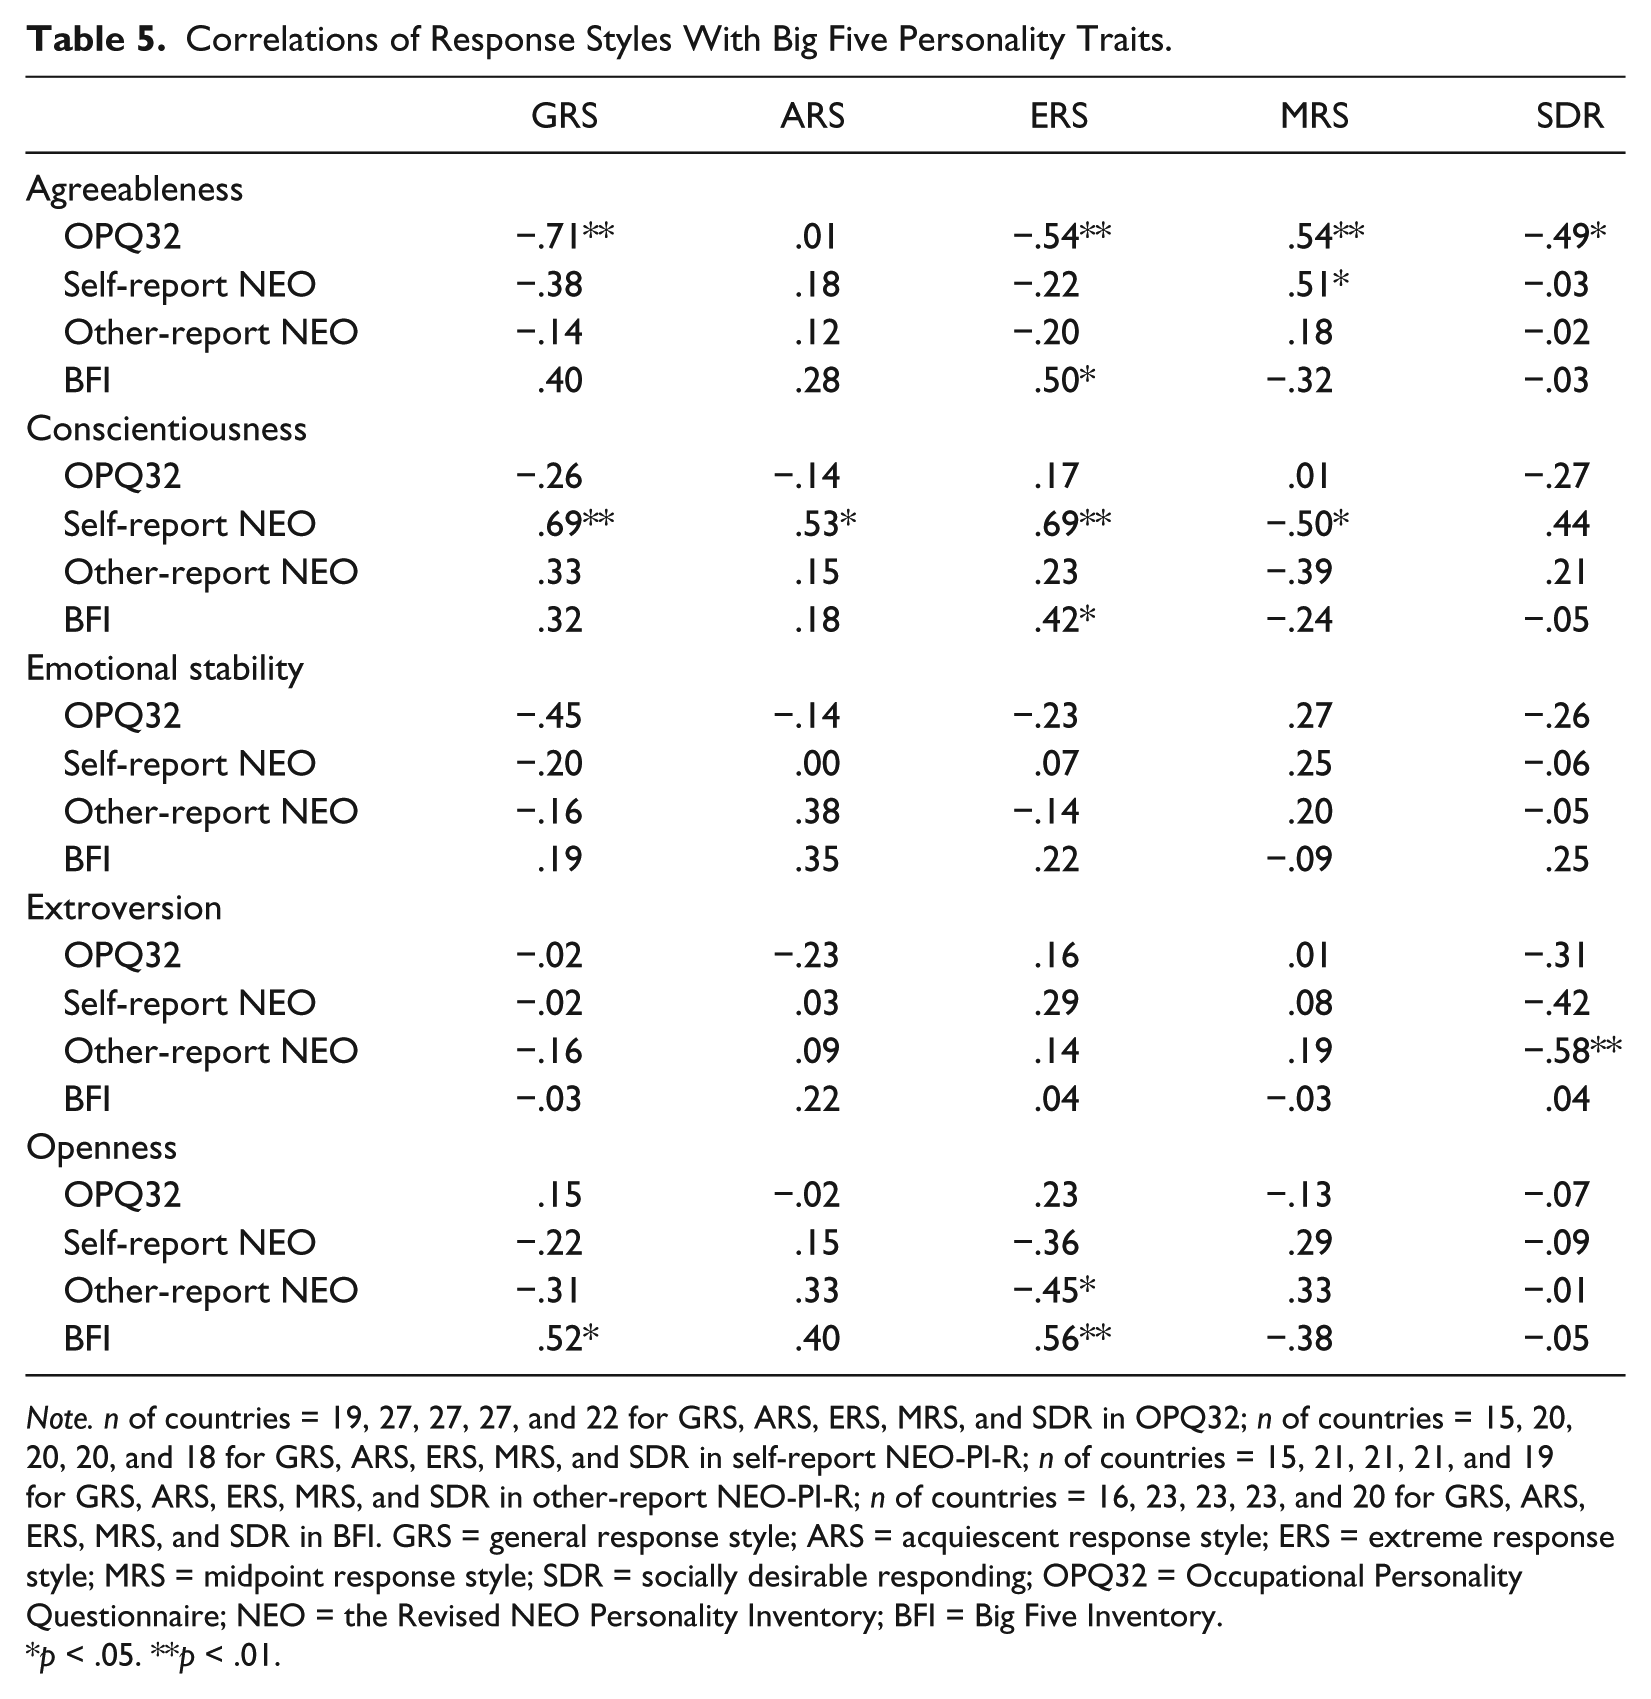
Note. n of countries = 19, 27, 27, 27, and 22 for GRS, ARS, ERS, MRS, and SDR in OPQ32; n of countries = 15, 20, 20, 20, and 18 for GRS, ARS, ERS, MRS, and SDR in self-report NEO-PI-R; n of countries = 15, 21, 21, 21, and 19 for GRS, ARS, ERS, MRS, and SDR in other-report NEO-PI-R; n of countries = 16, 23, 23, 23, and 20 for GRS, ARS, ERS, MRS, and SDR in BFI. GRS = general response style; ARS = acquiescent response style; ERS = extreme response style; MRS = midpoint response style; SDR = socially desirable responding; OPQ32 = Occupational Personality Questionnaire; NEO = the Revised NEO Personality Inventory; BFI = Big Five Inventory.
p < .05. **p < .01.
To summarize, we found some significant personality correlates of response styles, and we did not find strong convergence of the associations between response styles and Big Five personality traits. However, it seems that even if we use a response scale that cannot reflect ARS, ERS, or MRS, the Big Five personality scales were still related to response style indexes, which strongly suggest that these indexes have a substantive meaning.
Discussion
We carried out country-level correlational analyses with response styles extracted from national representative respondents from multinational surveys and personality traits from the OPQ32r and other Likert-based inventories. We found a GRS factor (i.e., the shared meaning of ERS and SDR vs. ARS and MRS) that reflected the tendency to amplify or to moderate responses. The significant correlations of some but not all personality traits measured with the forced-choice OPQ32r supported our expectation that response styles have some substantive meaning, given that the uniform response style bias cannot influence this instrument and response styles such as ARS, ERS, and MRS cannot be computed on the basis of the forced-choice instrument. In other words, scores on the OPQ32r cannot reflect scale usage and should have some substantive meaning if there would be significant correlations between scores on this personality inventory and response style indexes. Specifically, we found support that response styles at country level reflect aspects of culture (Smith, 2004), as evidenced in (a) dominating versus submitting to interpersonal relationship, (b) competitive versus modest and democratic feelings and emotions, and (c) data rational thinking. Therefore, response styles can be viewed as culturally moderated communication filters that amplify or moderate responses. Response styles cannot be dismissed as only reflecting scale usage; instead, it appears that the way in which individuals use scales is telling of their personality. These effects are even more pronounced when scores are aggregated at country level.
Study 2: A Multilevel Analysis of Response Styles
Building upon Study 1, we studied the psychological meaning of individual-level ARS, ERS, and MRS (individual-level data on SDR were not available, thus not included) in a multilevel design with country-level OPQ32r scale scores.
Individual (Demographic) Correlates of Response Styles
The effects of age, gender, and education on response styles have been frequently examined. Some studies reported that both ARS and ERS were more commonly used among elderly (Greenleaf, 1992a; Meisenberg & Williams, 2008) and the less educated (Marin, Gamba, & Marin, 1992), whereas MRS was more frequently used by the more educated (Sturgis, Roberts, & Smith, 2010). Yet some studies reported the opposite effects; for example, Austin et al. (2006) found a negative effect of age on ERS. Effects of gender were generally inconsistent and small (Van Vaerenbergh & Thomas, 2012). A possible explanation for such conflicting results could be the sampling scheme in different studies (using either convenience or probability samples). The national representative samples from the ISSP, as used in the current study, are expected to have adequate variations on these background variables and findings based on such samples may afford better ground for generalization.
Country-Level Correlates of Response Styles
We investigate the socioeconomic development, the overarching cultural value (i.e., individualism), and aggregated personality traits at country level that were found to be relevant for response styles. It has been reported that the socioeconomic development of a country has a strong relationship with response styles (van Hemert, van de Vijver, Poortinga, & Georgas, 2002). It may be related to individual opportunities in life; people living in countries with lower levels of socioeconomic development may need to use whatever accessible resources and strategies to survive and thrive, resulting in more use of amplifying response styles.
Individualism (vs. collectivism), the most frequently studied cultural value dimension (Hofstede, 2001), was found to be associated with response styles in many studies. Yet findings were not unequivocal. Harzing (2006) reported a negative association of individualism with ARS and MRS, and no association with ERS. de Jong, Steenkamp, Fox, and Baumgartner (2008) reported a positive association of individualism with ERS. van Herk et al. (2004) reported a negative association of individualism with ERS and ARS. Again, sampling frames could be a confounding factor. We explore the effects of individualism on response styles from our multiple national representative samples.
Drawing from the first study, we selected four personality traits at country level: Affiliative, Democratic, Data Rational, and Competitive. These four personality traits were chosen, because they showed the strongest and most consistent correlations with GRS at country level.
Method
Data sources of individual-level response styles
We used the same ISSP data sets as in Study 1. We calculated the individual-level ARS, ERS, and MRS in each of the six ISSP data sets. We factor analyzed the three response styles at individual level in each set, and found a one-factor solution (with explained variances ranging from 48.51% to 65.10%) with a positive loading of ERS (loadings ranged from .19 to .82 with a mean of .70) and negative loadings of ARS (from −.04 to −.76 with a mean of −.35) and MRS (from −.72 to −.82 with a mean of −.78) for all the six data sets. Pairwise comparisons of the structural equivalence of the factor solutions in the six data sets were carried out by means of the calculation of Tucker’s phi (van de Vijver & Leung, 1997). We found an average value of .90, indicating acceptable structural equivalence. The factor scores were taken as the GRS scores in this study. In addition to these individual-level response styles, we used five dummy variables to gauge ISSP survey-specific effects.
Individual-level predictors
For each respondent in all the six ISSP surveys, data on age (in years), gender (male as 1 and female as 0), and education measured as the highest degree achieved from 1 (no formal qualification) to 5 (university completed) were available.
Country-level predictors
The Human Development Index (HDI) was used to indicate the socioeconomic development of a country. HDI is a composite measure of the average achievements in a country in three basic dimensions of human development: life expectancy, enrollment in education, and Gross Domestic Product per capita. Individualism scores for 70 countries were taken from Hofstede (2009). The sten scores of Affiliative, Democratic, Data Rational, and Competitive from the OPQ32r were the same as in Study 1.
Analysis
We conducted the analyses with HLM version 6 (Raudenbush & Bryk, 2002). In total, data covered 184,433 respondents in 26 countries. The values of the intraclass correlation coefficients were 13% for GRS, 6% for ARS, 15% for ERS, and 10% for MRS, suggesting enough variation at country level to conduct multilevel analysis (van de Vijver & Poortinga, 2002).
In accordance with Enders and Tofighi (2007), we standardized all predictors to z scores, and centered all individual-level predictors around their respective country means and the country-level predictors around the grand mean, except for dummy variables at individual level to distinguish survey differences which were neither standardized nor centered.
In line with the model building proposed by Nezlek (2008), we used the forward-stepping procedure to add predictors, first with individual-level variables and then country-level variables for each model. To be specific, we first checked if there were mean differences across surveys by adding the dummy variables, and then we added age, gender, and education at individual level. Next, we added HDI, then individualism, and finally each of the chosen personality traits from the OPQ32r. As Bartram (2013a) reported that country-level OPQ32 scales were strongly associated with HDI and individualism, adding country-level predictors in such a sequence would allow us to examine the unique variance explained by the aggregated personality traits. We evaluated the significance of the change of chi-square statistics after adding each predictor, from which we determined whether to retain the predictor in the model. All multilevel analyses employed random intercepts and fixed slopes.
Results
Table 6 presents the model building for GRS, ARS, ERS, and MRS. We excluded country-level variables that resulted in an increase in chi-square statistics for each response style index. Table 7 presents the regression coefficients for each response style. At individual level, means of indexes varied across surveys (as indicated in the significant regression coefficients in the survey-specific dummy variables), which pointed to domain-specific effects of response styles (van Dijk, Datema, Piggen, Welten, & van de Vijver, 2009). Age was positively related to GRS and ERS, and negatively related to ARS and MRS. Males scored lower on GRS, and higher on ARS and MRS. Education had a negative effect on GRS and ERS, and a positive effect on MRS. However, all these effects were small.
Model Building in Multilevel Analysis.
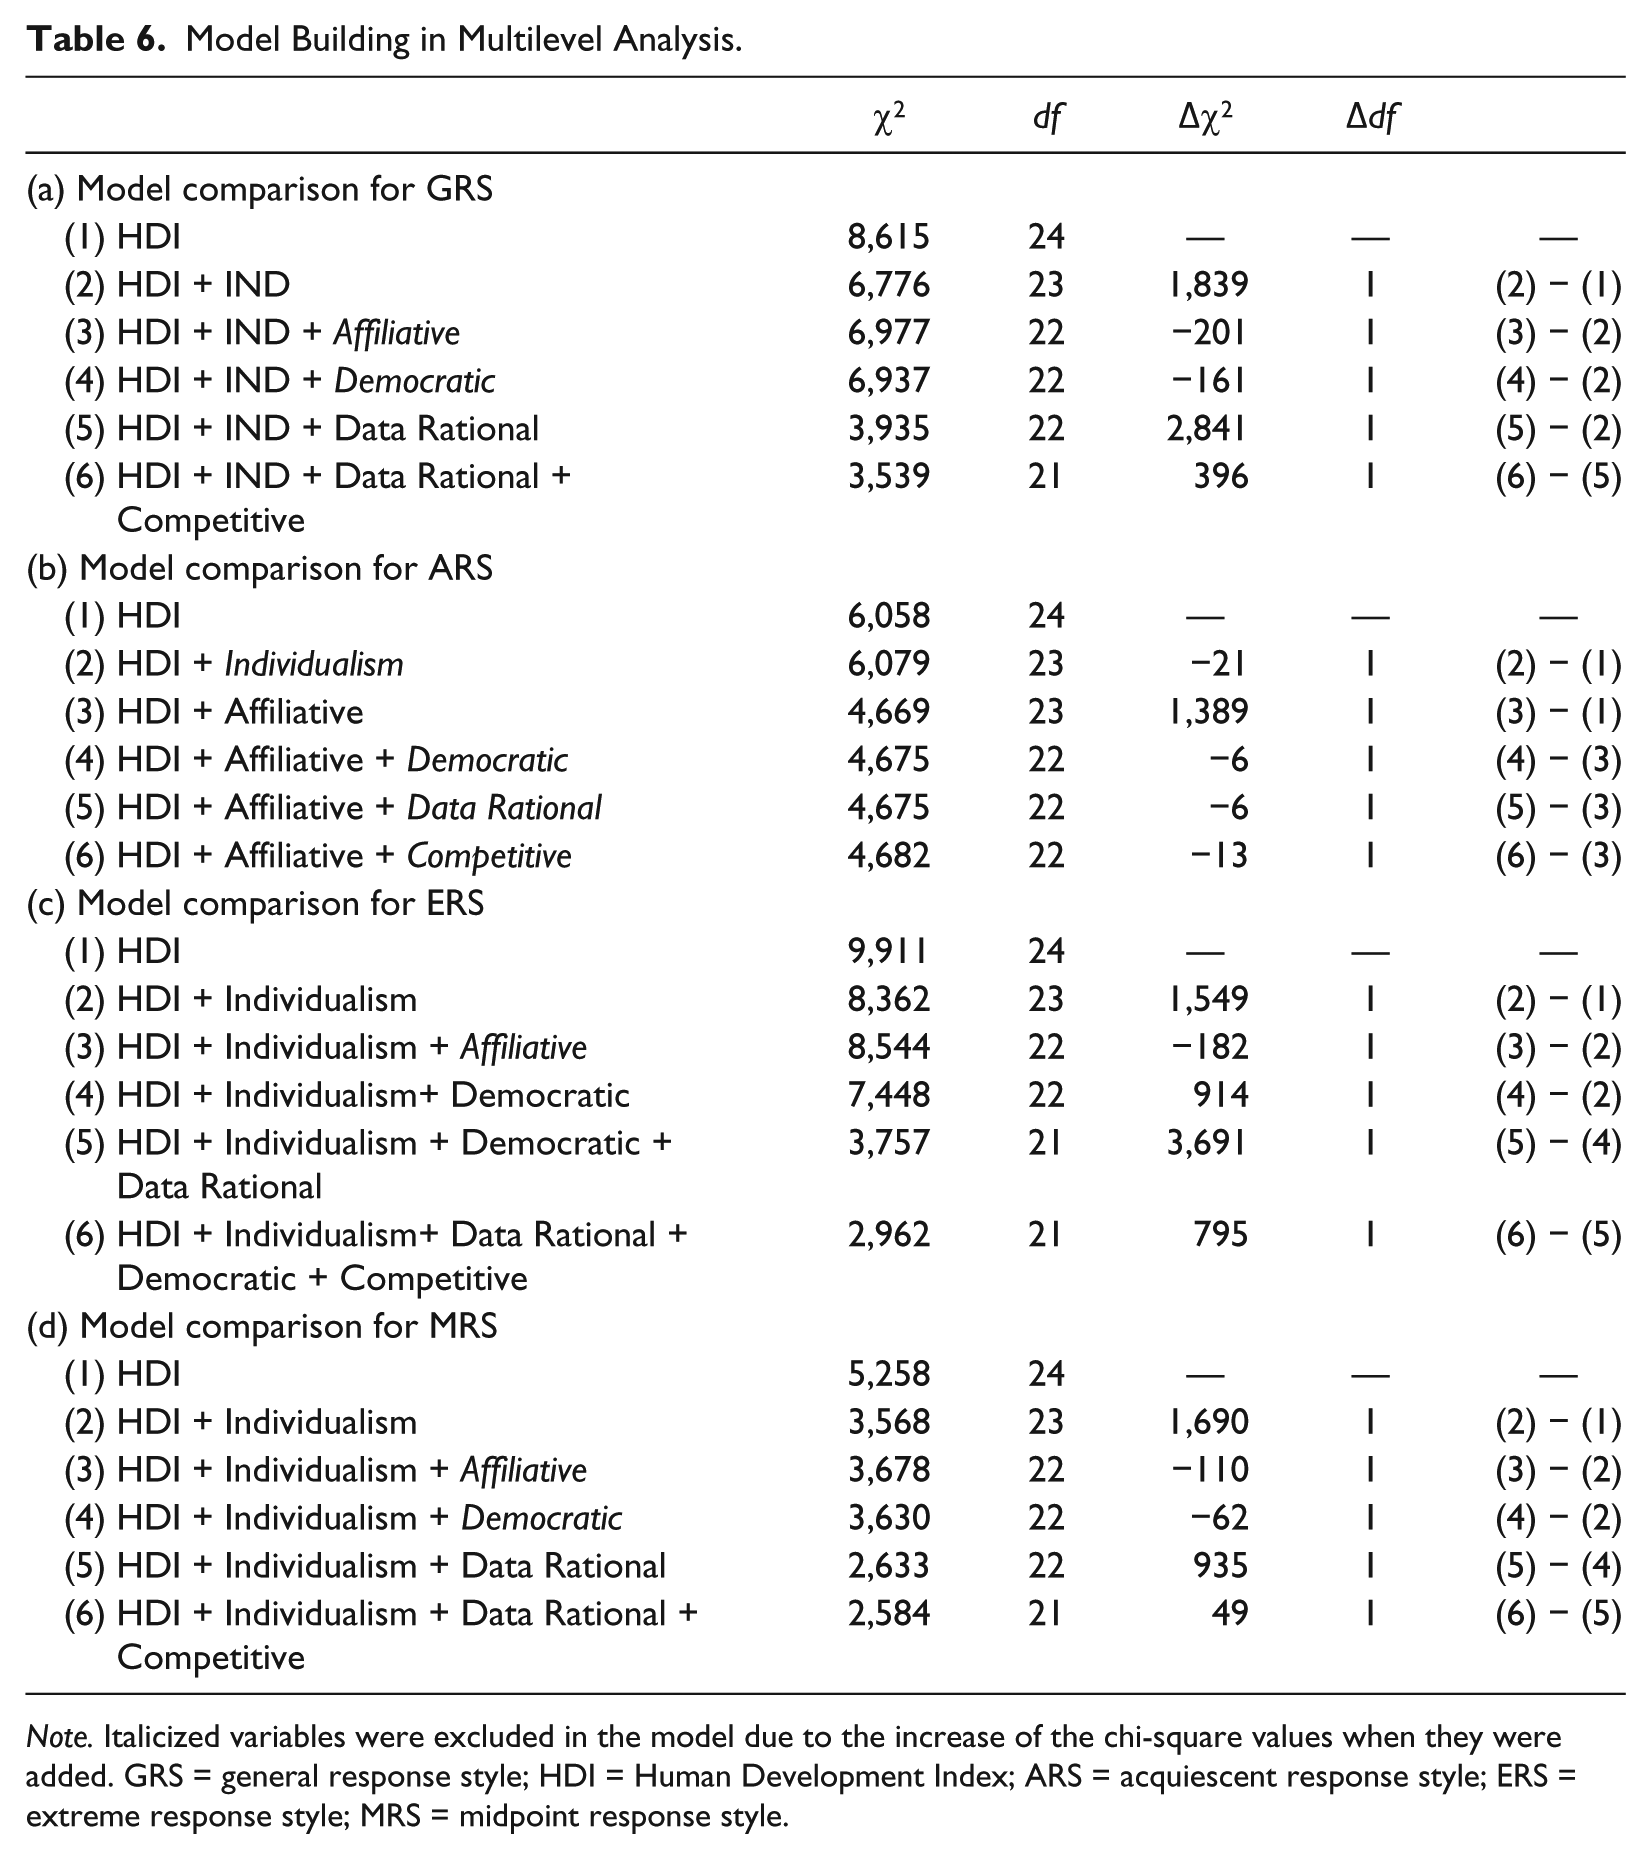
Note. Italicized variables were excluded in the model due to the increase of the chi-square values when they were added. GRS = general response style; HDI = Human Development Index; ARS = acquiescent response style; ERS = extreme response style; MRS = midpoint response style.
Regression Coefficients in Multilevel Analysis.

Note. GRS = general response style; ARS = acquiescent response style; ERS = extreme response style; MRS = midpoint response style; ISSP = International Social Survey Programme; HDI = Human Development Index.
p < .10. *p < .05. **p < .01.
At country level, GRS was characterized by low HDI, low Individualism, high Data Rational, and high Competitive; the same patterning was found for ERS, and the opposite patterning for MRS. ARS was predicted only by high HDI and low Affiliative.
Discussion
Using national representative samples from 26 countries, we studied the individual-level response styles in associations with age, gender, and education at individual level, and socioeconomic development, individualism, and aggregated personality traits at country level. The regression coefficients for GRS at individual level were consistent, and they were stronger than those of specific response styles, indicating that the use of a GRS results in more robust estimates. The effects of age and education were largely in line with Meisenberg and Williams (2008); older and less educated respondents tend to use amplifying response styles more, whereas younger and more educated respondents tend to use moderating response styles more. It seems that being from a younger generation with higher education is associated with a preference for more nuanced views, which may work against the use of ERS and may be more in line with preferences of middle categories of response scales. Gender differences were much smaller than those of age and education; therefore, gender is a less salient predictor for response styles.
At country level, HDI and individualism were negatively associated with ERS and positively associated with MRS. In our view, this patterning suggests that individuals in less affluent and more collectivistic countries show a stronger tendency to stress their conformity and to amplify what the members of their group are supposed to respond. Aggregated personality traits, although closely linked with cultural values (Bartram, 2013a; Hofstede & McCrae, 2004), could explain additional variance in response styles, which furthered our understanding of the mechanism underlying response styles. The positive effects of Competitive on GRS and ERS and the opposite effect on MRS demonstrate that response amplification is more prevalent in countries where people enjoy competitive activities more. The effects of the Data Rational scale provide evidence for the rational thinking–based amplifying response style. It seems counterintuitive that GRS is positively associated with data rational thinking, as data rational thinking is expected to be positively related to education level at individual level and affluence at country level. Enjoying the analysis of statistical information and basing decision on facts and figures may be positively associated with education; however, the unwillingness to deal with opinions and feelings points to rigidity and inflexibility, which could lead to the endorsement of ERS rather than ARS and MRS. To conclude, the multilevel analysis of the large set of response style with predictors from both levels presents a complex picture of the response style constructs.
General Discussion
We studied the psychological meaning of response styles in a correlational and a multilevel study with the OPQ32r and other country characteristics. We found that response styles are interrelated, thus a GRS can be extracted with positive loadings of ERS and SDR (when available), and negative loadings of ARS and MRS, at both individual and country levels. The general as well as specific response styles are systematically related to socioeconomic development, individualism, and aggregated personality traits (in particular Competitive and Data Rational) from the OPQ32r at country level, although the convergence of associations with the Big Five personality across measures is not very high. At individual level, response styles are systematically related to age and education.
Interpretation of Response Styles
There has been an ongoing debate on the nature of response styles. On one hand, response styles are viewed as mere measurement artifacts; they may pose serious challenges to the validity and comparability of scores (Clarke, 2001) or have negligible effects (Ones, Viswesvaran, & Reiss, 1996). On the other hand, response styles are a promising candidate in characterizing aspects of national cultures (Smith, 2009), as they may represent preferred ways of communication that are embedded in individual and cultural values and personality traits (Harzing, 2006; Smith, 2004, 2011). Our findings provide some evidence for the substance interpretation of response styles. The personality traits measured by the forced-choice format OPQ32r provided the unique opportunity for response styles to manifest themselves as systematic effects on scores other than uniform response biases that prevail in the analysis of Likert-based scales. At country level, there are significant positive associations of GRS (i.e., ERS and SDR vs. ARS and MRS) with Competitive and Data Rational, and negative associations with Affiliative, Democratic, and Modest. Moreover, controlling for the effects of socioeconomic development and individualism, we still see unique effects of Competitive and Data Rational on individual-level response styles; therefore, it is reasonable to conclude that response styles are more about substance than nuisance (e.g., Schwartz, Verkasalo, Antonovsky, & Sagiv, 1997).
As we found significant correlations of response styles with traits measured by a personality instrument that cannot display ARS, ERS, or MRS, response styles seem to be integrated in personality traits or at least their expression. Thus, response styles may not be a red herring as suggested by Ones et al. (1996). In practice, researchers should be cautious in applying any measure to control for response styles (Fischer, 2004). If we were to correct for such response styles, we would eliminate valid personality variance. We conclude that GRS, the integration of the four styles, can be interpreted as a filter that influences all self-reports, yet the extent of the influence may vary across constructs. Response styles share trait variance with constructs related to dominance, competitiveness, and data rational thinking; therefore, response styles are better not be corrected for in the measurement of these constructs.
Convergence and Divergence of Personality Instruments
We set out to study response styles with a personality instrument that is robust to the effects of uniform response biases and found different levels of convergence with other personality instruments. In predicting response styles with the 32 individual personality traits of the OPQ32r, the significant personality trait correlates were in line with expectation, yet the aggregated Big Five personality traits showed a less consistent pattern. The lack of convergence may be due to sample differences (e.g., small country-level sample sizes, incomparable samples from convenience sampling), instrument characteristics (e.g., different response formats in which different levels of uniform biases are embedded), and construct differences (e.g., the OPQ-based Big Five personality shared the working definitions of the five traits with the NEO). Mõttus et al. (2012) found that country rankings of self-reported conscientiousness from Likert-type scales would change if response styles were taken into consideration, which demonstrated the strong uniform response biases resulting from the Likert-type scales. All in all, caution should be taken when interpreting the association of response styles or other constructs with the Big Five personality traits derived from different measures, especially when forced-choice format personality measures, such as the OPQ32r, can provide valuable additional information.
Limitations and Further Directions
The present study has a few limitations. First, our response style indexes were constructed with items measuring other constructs, therefore it is difficult to ascertain that these response style indexes are adequately disentangled from the target constructs. However, the independent assessment and the high reliability in each response style alleviate these measurement concerns. Second, we operationalized ARS as the endorsement rate of the agreeing category with limited numbers of items, which may explain the very low loading of ARS on the GRS and its weak correlations with personality traits. However, irrespective of the various operationalizations of ARS, integrating different response styles into a general factor, which represents response amplification to moderation, helps to create consistency in findings. For these with a special interest in ARS, alternative data sources may be pursued. Items with dichotomized response options such as Agree/Disagree can be used to derive ARS indexes that are not confounded with ERS or MRS. Third, the OPQ32r personality data were collected among working adults, which may pose some sample bias in generalizing the findings. Further efforts should improve the measurements of response styles, such as to develop direct measures of response styles or to locate external evidence to validate the indirect measures of response styles. When studying the underlying mechanism of response styles across cultures, it is also imperative to include unobtrusive measures such as HDI, measures with response formats that are resistant to response styles, and other techniques to effectively control for response styles (e.g., anchoring vignettes). In conclusion, the integration of specific response styles and the efforts to employ validity measures of different response formats are promising in deepening our understanding of the nature of response styles and ensuring valid cross-cultural comparisons.
Footnotes
Declaration of Conflicting Interests
The author(s) declared no potential conflicts of interest with respect to the research, authorship, and/or publication of this article.
Funding
The author(s) received no financial support for the research, authorship, and/or publication of this article.