



Abstract
The present study reexamined the relationship between biculturalism and adaptation in the ICSEY1 data. The sample consisted of 5,365 immigrants, aged between 13 and 18 years (M = 15.35, SD = 1.56) who were living in 13 different countries. We measured biculturalism bilineally using a range of ICSEY variables akin to acculturation. The study findings revealed that biculturalism was the most preferred acculturation mode across countries and within most of the countries. Biculturalism was positively related to two out of three psychological adaptation measures and one out of two sociocultural adaptation measures across and within most participating countries. The pattern of relationship remained true after controlling for perceived discrimination in the analyses.
Introduction
In 1997, Berry asserted that when cultural minority individuals and groups seek integration, that is, by being “doubly engaged” in their heritage culture and in the larger society, they will be more successful in achieving a higher level of adaptation. This assertion has become known as the “integration hypothesis” or the “biculturalism hypothesis” and has generated supportive evidence and controversies (see Rudmin, 2003). Much of the controversies have been related to whether integration is the most preferred strategy among acculturating individuals, whether integration is related to the best form of (psychological and sociocultural) adaptation, and the manner in which acculturation strategies (of which integration is one form) has been operationalized and assessed (Ward & Kus, 2012). Although a meta-analytic study found support to the “integration and best adaptation outcome” question (Nguyen & Benet-Martínez, 2013), the universality of integration as the most preferred strategy, all things being equal, has been ambiguous (see Brown, Zagefka, & Tip, 2016), with the outcome being dependent on the manner in which integration is operationalized.
The present study sought to answer the following research questions:
Does biculturalism constitute the most preferred acculturation orientation within and across countries among immigrant youth?
Does a positive relationship exist between biculturalism and adaptation within and across countries among immigrant youth?
Does a positive relation between biculturalism and adaptation continue to exist among immigrant youth after controlling for perceived discrimination?
To answer the above questions, we utilized the ICSEY dataset, which is one of the most comprehensive datasets to date on immigrant youth, not only because it includes a large sample of different ethnic groups but also the groups reside in over a dozen societies of settlement. The ICSEY-project itself has been criticized (Rudmin, 2008) and rebutted (Berry, Phinney, Sam, & Vedder, 2008) but we have nevertheless opted to use the dataset because one of the major criticism to the project is the manner in which the dataset was analyzed, specifically operationalizing integration through a fourfold measure. To escape Rudmin’s (2008) critique, we conceptualized and measured integration bilineally, that is, through an interaction between the underlying dimensions of acculturation, a strategy that was also used in Nguyen and Benet-Martínez (2013). A range of ICSEY variables akin to acculturation were exploited in the adopted operationalization. In addition, given that perceived discrimination can intervene in the relationship between biculturalism and adaptation, this variable was controlled for in the analyses as suggested by Rudmin (2009), but was not addressed in Nguyen and Benet-Martínez (2013).
Method
Participants
The sample consisted of 5,365 immigrants, aged between 13 and 18 years (M = 15.35, SD = 1.56) who were living in 13 different countries. Full sample characteristics and the process of data collection have previously been published (see Berry, Phinney, Sam, & Vedder, 2006/2010, 2006).
Measures
Ethnic dimension
This was measured in the present study by aggregating four separately assessed ICSEY data: six ethnic language competence items (e.g., “how well do you speak [ethnic language]?”), eight ethnic identity items (e.g., “I am proud of being [ethnic]”), four items referring to ethnic peer contacts (e.g., “how often do you spend free time in school with [ethnic members]?”), and one item for ethnic activities/customs participation (“how often do you participate in traditional [ethnic] activities or customs?”). The mean Cronbach’s alpha reliability of this dimension across the participant countries was .85 (SD = .053).
National dimension
Similar to the ethnic dimension, this dimension was measured aggregating the following ICSEY data measures: six items referring to national language competence (e.g., “I speak [national language] with my parents”), four national identity items (e.g., “I feel I am part of [national] culture]”), four items referring to national peer contacts (“How often do you play sport with [national members]?”), and one item for participation in national activities/customs (“how often do you participate in traditional [national] activities or customs?”). The mean Cronbach’s alpha reliability of this dimension across the participant countries was .83 (SD = .045).
Adaptation
Three measures of psychological adaptation, namely, self esteem (10 items), life satisfaction (five items), psychological problems (15 items), and two measures of sociocultural adaptation, namely, school adjustment (seven items) and behavioral problems (10 items) were employed. With the exclusion of school adjustment which had a relatively low mean Cronbach’s alpha reliability of .65 (SD = .10) across countries, all other measures had a satisfactory mean reliability: .75 (SD = .105) for self esteem, .77 (SD = .056) for life satisfaction, .88 (SD = .037) for psychological problems, and .80 (SD = .077) for behavioral problems. See Berry et al. (2006) for full description of the adaptation measures.
Perceived discrimination
This was measured using nine items (e.g., “I do not feel accepted by [national group]”). The mean Cronbach’s alpha reliability of this measure was .83 (SD = .039) across countries.
The response scale in all aforementioned measures ranged from 1 to 5, with lower numbers indicating lower level of the trait recorded by the measure. Mean scores of the scales were used in the analyses. Means and standard deviations of all study measures are presented in Table 1.
Means and Standard Deviations of All Study Measures.

Results
Biculturalism Preference
To answer the question whether biculturalism is the preferred acculturation mode among immigrant youth, the study used a bipartite split using the theoretical median of each dimension (i.e., 3), as is common in the field of acculturation research using the bilineal method (e.g., Donà & Berry, 1994; Ward & Kus, 2012), with those scoring higher than the medians on both dimensions being defined as bicultural. The majority, 64.2% (95% confidence interval [CI] = [62.9%, 65.5%]), were identified as bicultural across the participant countries. Analyses by country indicated that in 11 out of 13 countries, a preference toward biculturalism was evident among more than 50% of immigrant youth in a particular country, as shown in Table 2. Immigrant youth in Finland and Sweden in particular showed less than 50% preference toward biculturalism, 42.1% and 49.2%, respectively. In these specific countries, a preference toward separation was as almost high as a preference toward biculturalism, 42% (95% CI = [37.3%, 46.8%]) in Finland and 45.4% (95% CI = [41.8%, 48.9%]) in Sweden.
Biculturalism Preference Among Immigrant Youth.
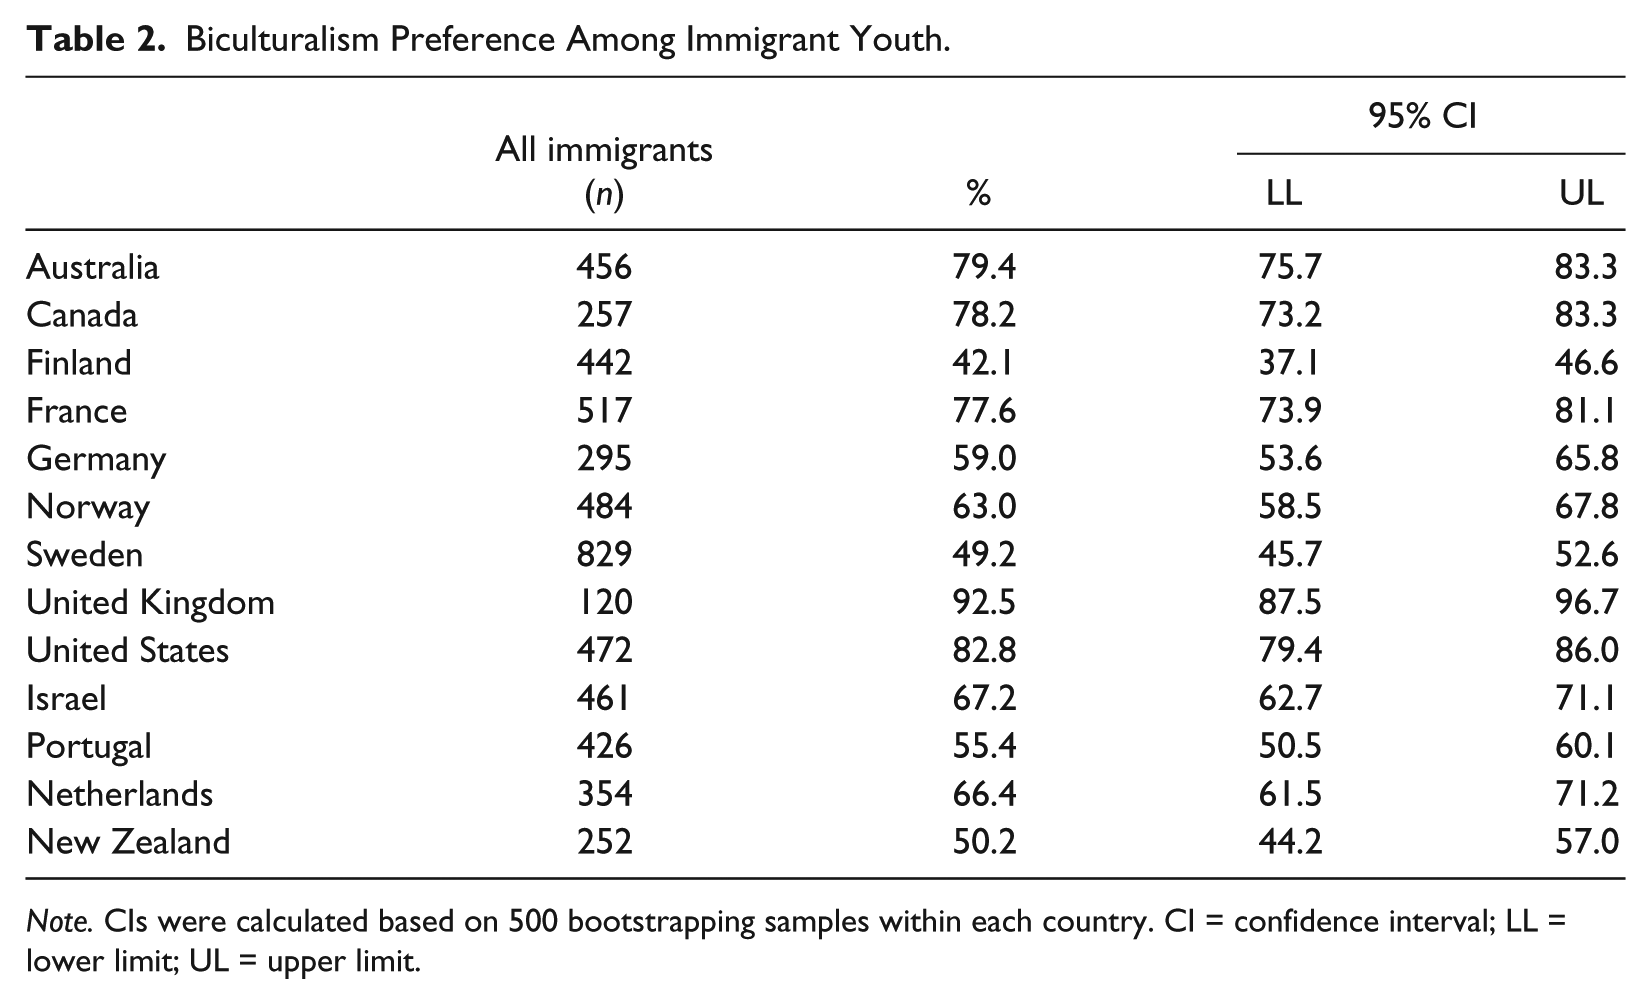
Note. CIs were calculated based on 500 bootstrapping samples within each country. CI = confidence interval; LL = lower limit; UL = upper limit.
Biculturalism and Adaptation
Zero-order correlations between biculturalism and adaptation and partial correlations controlling for perceived discrimination are summarized in Table 3.

Biculturalism was empirically denoted in multiplicative terms, that is, Ethnic × National scores. Two other metrics were also used: (a) SQRT of the multiplicative term and (b) additive term (ethnic + national scores). Calculations based on these two metrics provided similar correlations to those given in the table and are not quoted here for the sake of brevity.
p < .03. **p < .008.
As far as indicators of psychological adaptation are concerned, the analyses revealed a statically significant positive correlation between biculturalism and self esteem in each of the participant countries except for the Netherlands, with r ranging from .14 to .36 and the overall r being .2 (95% CI = [.18, .23]). This pattern persisted after controlling for perceived discrimination, with the overall r across countries being .19 (95% CI = [.17, .22]). For life satisfaction, a pattern of positive relationship emerged in each of the countries except for the United Kingdom and Portugal. Statistically significant correlations ranged from .16 to .35, with the overall r across all countries being .19 (95% CI = [.16, .22]). The correlations remained similar when perceived discrimination was controlled for; the overall r across countries was .18 (95% CI = [.15, .21]). For the psychological problems measure, statistically significant negative correlations emerged in only six out of the 13 participant countries; r in these countries ranged from −.12 to −.18 with the overall r across all participant countries being −.07 (95% CI = [−.04, −.10]). The correlations remained significant in just five countries after perceived discrimination was controlled for, with the overall r across all countries being negligible, r = −.04 (95% CI = [−.01, −.07]).
As far as sociocultural adaptation is concerned, the analysis revealed statistically positive correlations between biculturalism and school adjustment in all countries except for Portugal and New Zealand, with statistically significant correlations being in the range of .12 to .39 and the overall r across all countries being .21 (95% CI = [.18, .23]). This pattern of positive relationship persisted in just nine countries after controlling for perceived discrimination, with the overall r across all countries being .19 (95% CI = [.16, .22]). For behavioral problems, statistically significant correlations emerged in just three countries, with the overall correlation across all countries being negligible, r = −.07 (95% CI = [−.04, −.10]). Once perceived discrimination was taken into account, a statistically significant negative correlation between biculturalism and behavioral problems appeared in just one out of 13 countries. It should be noted, however, that the measure of school adjustment had a relatively low reliability which might have affected the reported results.
Discussion
The study findings showed that biculturalism is the most occurring acculturation profile among immigrant youth across countries (64.2%). This was also true in 11 out of 13 countries where more than 50% of immigrant youth preferred a bicultural orientation. There were, however, between-country variations, suggesting that biculturalism preference may be moderated by factors like the cultural diversity of the receiving society and the cultural background of the acculturating group. In their original analysis of the ICSEY data, Berry et al. (2006/2010) reported an overall 36.4% frequency of a preference toward integration (biculturalism) across counties based on the fourfold measure, which was the subject matter of Rudmin’s (2008) criticism of the ICSEY study. Although the bilineal method underlying the current study’s analysis was not designed to validate the fourfold measure, the overall conclusions derived from present study lend support to Berry et al.’s (2006/2010) argument that immigrant youth prefer biculturalism over other modes of acculturation.
As far as the question of biculturalism–adaptation relationship is concerned, the study findings indicated that in two out of the three employed psychological adaptation measures, namely, self esteem and life satisfaction, and in one (school adjustment) out of two sociocultural adaptation measures, positive relationships emerged within most of the participating countries and across countries. Biculturalism was not linked to negative indicators of adaptation (i.e., psychological problems and behavioral problems). This finding indicates that positive and negative indicators of adaptation may not necessarily represent opposite ends of the same adaptation continuum. Simply like other psychological constructs (e.g., positive and negative contact; Techakesari et al., 2015), maladaptation and adaptation may be considered distinct dimensions that would be differentially linked to biculturalism. We tentatively suggest that any attempt to address the interconnection between biculturalism and adaptation should diversify the use of positive and negative adaptation measures.
The biculturalism–adaptation patterns of relationships remained true for each of the measures after controlling for perceived discrimination and regardless of the metric underlying biculturalism (i.e., using a multiplicative term, SQRT of the multiplicative term, or an additive term). Although these findings support and extend Berry et al.’s (2006/2010, 2006) overall conclusions regarding the relationships between biculturalism and psychological and sociocultural adaptation, they indicate that the strength of such relationships differs by the cultural context of the acculturating group and appears generally to be modest. The study findings also support and extend the recent meta-analytic study conclusions (Nguyen & Benet-Martínez, 2013), considering that the current ICSEY study analysis may be looked at as a mini meta-analysis on its own that took into account perceived discrimination in the analyses, a factor that was not considered in Nguyen and Benet-Martínez (2013).
Footnotes
Acknowledgements
Our thanks are due to Professor John Berry for his kind permission to reanalyze the ICSEY data. We also thank Professor Paul Vedder for making it easy for us to access the ICSEY datasets at the KNAW/DANS-EASY site.
Declaration of Conflicting Interests
The author(s) declared no potential conflicts of interest with respect to the research, authorship, and/or publication of this article.
Funding
The author(s) received no financial support for the research, authorship, and/or publication of this article.