




Abstract
We examined the link between ethnic diversity and social capital to test Putnam’s hypothesis on the negative impact of ethnic diversity on social capital. Data came from a representative survey in two multicultural regions of Russia (N = 2,061). To assess the level of ethnic diversity, an ethnic diversity index was calculated using data from the latest National Population Census in Russia. Data were analyzed using two-level structural equation modeling. The results did not confirm Putnam’s hypothesis and showed that ethnic diversity, as assessed in the latest National Population Census in Russia, was not negatively related to social capital in Russia. We argue that the long-standing ethnic diversity in Russia is positively related to informal sociability, and does not affect generalized trust and community organizational life. It is concluded that Putnam’s hypothesis does not have universal validity, presumably because the link between diversity and social capital is moderated by various regional and national characteristics.
This study examines how ethnic diversity of a society is related to its social capital. We first explain why social capital became the focus of our attention, and then we explain why the link between ethnic diversity of society and its social capital is interesting to study in the Russian context. There are two main levels of analysis for social capital: micro and macro. At microlevel, social capital is seen, generally speaking, as a social resource owned by people or small groups. At macrolevel, the focus of our study, Putnam, Leonardi, and Nanetti (1993) defined social capital as “those features of social organization, such as trust, norms and networks that can improve the efficiency of society by facilitating coordinated actions” (p. 167). Many studies consider social capital as one of the most important noneconomic facilitators of progress (Fukuyama, 2002; Helliwell & Putnam, 1995; Putnam, 2001; Westlund & Adam, 2010; Woolcock, 1998). Like physical and human capital, social capital influences the productivity of individuals, groups, and whole societies. However, social capital has many more positive effects. Thus, high social capital counteracts corruption in society (López & Santos, 2013), is positively correlated with health levels (Chirkov, Lebedeva, Molodtsova, & Tatarko, 2012), creates an environment fostering innovation in society (Landry, Amara, & Lamari, 2002), and promotes entrepreneurship and technological advances (Rizwan, Naseem, & Farooq, 2011).
In our research, we study the influence of ethnic diversity on social capital. The relevance of this study comes from the increasing migration in the modern world and the ensuing ethnocultural heterogeneity of many societies. The number of international migrants worldwide has continued to grow rapidly over the past 15 years reaching 244 million in 2015, up from 222 million in 2010, and 173 million in 2000 (United Nations, Department of Economic and Social Affairs, 2016). In addition, many countries in the world are inherently multicultural and have a high index of ethnic heterogeneity (Alesina, Devleeschauwer, Easterly, Kurlat, & Wacziarg, 2003). Due to the intensity of migration, researchers started focusing on the impact of ethnic diversity on social capital (or its components) in multicultural societies. However, the studies were found to be controversial and sparked debate. In fact, the debate arose with the studies by Putnam (e.g., 2000, 2009), conducted in the United States, which were used by the researcher to show that the social capital of a society diminishes by ethnocultural diversity, presumably due to the looser ties in these heterogeneous societies. Some researchers confirmed a negative relationship between social capital and ethnic diversity (Coffé & Geys, 2006; Lancee & Dronkers, 2008; Leigh, 2006). Putnam’s theory is most often confirmed in empirical studies on the North American continent (Costa & Kahn, 2003; Hero, 2003; McClain, 2003). However, some studies from other parts of the world do not confirm Putnam’s hypothesis. For example, studies in Europe found that ethnic diversity was only weakly related to social capital and that political variables showed a stronger association (Gesthuizen, Van der Meer, & Scheepers, 2009; Letki, 2008).
These conflicting results suggested that the influence of ethnic diversity on social capital can depend on the context. So, what are moderators of the link between diversity and social capital? From this point of view, Russia is an interesting context, as it is one of the most multicultural societies in the world having 194 ethnic groups (according to the All-Russian Population Census, 2010). Furthermore, Russia has historically two sources of diversity. First, some places in the countries have a large number of recent immigrants coming from other countries, which is similar to many other places where diversity is studied such as countries in Western Europe. Second, many regions of Russia are characterized by a high level of long-standing ethnic diversity. We are particularly interested in the latter source of diversity, which has never been addressed in the discussion on the link between diversity and social capital. Thus, the goal of our study is to examine the relationship between ethnic diversity and social capital in specific Russian regions, as outlined below.
Operationalization of Social Capital
As this study tested Putnam’s hypothesis about the negative relationship between ethnic diversity and social capital, we consider the indicators of social capital used by Putnam in his studies (Putnam, 2007, 2009). Based on his own definition of social capital, Putnam proposed a set of indicators (Putnam, 2000; see also Griswold & Nichols, 2006), which are divided into such dimensions as:
measures of community organizational life (such as the mean number of club meetings attended in the last year),
measures of engagement in public affairs (turnout in presidential elections, attended public meetings on town or school affairs in the last year),
measures of community volunteerism (mean number of times worked on community project in the last year, mean number of times volunteer work done in the last year),
measures of informal sociability (agree with statements such as “I spend a lot of time visiting friends” or the mean number of times entertained at home last year), and
measures of trust (e.g., agree with statements such as “most people can be trusted” and “most people are honest”).
Frequently studied measures of social capital are engagement in public affairs and other types of civil engagement (Campbell, 2007; Levels, Scheepers, Huijts, & Kraaykamp, 2015; Putnam, 2007) and community volunteerism (Costa & Kahn, 2003; Healy, 2007; Miguel & Gugerty, 2005). These measures consistently show negative relations with ethnic diversity. However, the link seems to be moderated by societal factors; Kesler and Bloemraad (2010) showed that these negative effects of diversity on trust and political engagement are mitigated in economically more equal societies, in more corporatist societies, and in societies with more elaborate multicultural policies.
The three other indicators of social capital (trust, informal sociability, and community organizational life) have shown rather inconsistent research findings, as discussed in detail below. We set out to focus on those indicators of social capital, for which the empirical data are inconsistent and contradictory. For this reason, we used three social capital dimensions in our empirical study: trust, community organizational life, and informal sociability.
Generalized Trust and Ethnic Diversity
We define generalized trust as “an abstract preparedness to trust others and to engage in actions with others” (Stolle, 2002, p. 403). The attitudes of trust are generalized when they go beyond specific personal settings of already known persons. In the case of generalized trust, the domain of trust is not well specified (Nannestad, 2008).
Evidence of an association between ethnic diversity in society and generalized trust is not consistent. On the one hand, there is evidence of the negative impact of ethnic diversity on social capital. For example, trust is lower in societies with a higher ethnic diversity (Putnam, 2007; see also Dinesen & Sønderskov, 2015). The basis of this approach is the assumption that, in general, people do not feel at ease in an ethnically diverse environment (Alesina & La Ferrara, 2002). Ethnic diversity reduces trust and increases uncertainty among people. The more ethnically diverse a society, the fewer the people whom individuals can identify with, and the less people trust each other, resulting in weakened communication (Putnam, 2007).
On the other hand, other studies pointed to a very small effect of ethnic diversity on trust (Andrews, 2009; Kesler & Bloemraad, 2010; Tolsma, Van der Meer, & Gesthuizen, 2009). The presence of cultural distance between members of society, in particular, has no adverse effect on the level of trust (Johnston & Soroka, 2001). One study found that ethnic diversity has a different effect on different types of trust. Sturgis, Brunton-Smith, Read, and Allum (2011) found a negative association between ethnic diversity and strategic trust. However, the results of their study showed no effect of ethnic diversity on generalized trust. Stolle and Harell (2013) showed that despite a negative relationship among adults, younger Canadians with diverse social networks show higher levels of generalized trust. According to the authors’ explanation, these results seem to confirm that socialization experiences with rising diversity and the normalization of diversity in a multicultural environment contribute to beneficial effects of diverse social networks (Stolle & Harell, 2013). A secondary analysis of data from 100 countries showed that ethnic diversity has no statistically significant impact on social trust (Bjørnskov, 2008). It can be concluded that the association between ethnic diversity in society and trust is far from settled, and that there is inconclusive evidence for the notion that ethnic diversity reduces trust in society.
Two caveats are needed here. First, studies on the link between trust and diversity do not take into account the existence of a recurrent feature of research on the relationship between ethnic diversity and trust in that, despite the existence of various forms of trust, such as generalized and specific trust (Levi, 1996), trust is mostly not differentiated in the literature on ethnic diversity. If researchers conclude that ethnic diversity erodes and undermines trust, it is not always clear what kind of trust is involved (Soroka, Helliwell, & Johnston, 2007). The negative effects of ethnic diversity on trust may vary for different trust types (Sturgis et al., 2011). To avoid this uncertainty in our study, we are focusing on generalized trust only. Second, trust can be measured using two parameters: level and radius (Fukuyama, 1995). We follow extant literature by focusing on level of trust.
Given the inconclusive evidence on the relationship between diversity and trust (both negative and null relationships have been found), we do not put forward a specific hypothesis. Thus, we tested the nature of this association in our Russian sample.
Community Organizational Life and Ethnic Diversity
Community and organizational life refers to the integration of an individual into society through participation into voluntary associations (Gracia & Herrero, 2004) and public organizations such as civic, professional, religious, sports, and interest clubs. Studies on the influence of ethnic diversity on community organizational life show conflicting results.
On the one hand, as in the case of generalized trust, some research has shown a negative association between ethnic diversity and community organizational life. A review pointed out that ethnic diversity reduces people’s participation in community organizational life (Stichnoth & Van der Straeten, 2013). Similarly, Costa and Kahn (2003) found a negative association between ethnic diversity and membership in non-church organizations. Putnam found that respondents in areas of greater diversity demonstrated a lower expectation that others would cooperate to solve dilemmas of collective action and a smaller likelihood of working on a community project (Putnam, 2007).
On the other hand, even Putnam acknowledged that civic engagement seemed relatively unaffected by ethnic diversity in U.S. communities: “Organizational activity of various sorts, including religious activity, is essentially uncorrelated with diversity, once we control for confounding variables” (Putnam, 2007, p. 150). To complicate the picture further, many studies found that ethnic diversity leads to an increasing demand for different networks of contacts and organizations (Anderson & Paskeviciute, 2006; Smith & Shen, 2002). People living in ethnically diverse regions require social support in various community organizations as a way of adapting in ethnically diverse regions. Residents in more diverse regions face different barriers, and community organizations could be instrumental in providing its members with information or a variety of social services. For instance, based on Eurobarometer data of 2004, a positive relationship between immigration (as an indicator of ethnic diversity) and the level of informal support and the level of participation in voluntary organizations was found (Gesthuizen et al., 2009). Researchers attribute this to people forming social ties and uniting in organizations based on their differences from other members of society, and becoming isolated along with the “like-minded” (Smith & Shen, 2002). Representatives of ethnic minorities could create community organizations, including hometown associations and faith-based groups. As a consequence, the presence of a cultural distance between the members of a society may not have any negative impact on participation in organizations (Johnston & Soroka, 2001). Given the inconclusiveness in findings on the link between the organization of community life and diversity, we refrain from formulating any hypothesis and examine the link in an exploratory way.
Informal Sociability and Ethnic Diversity
Sociability is defined as “a form of social bonding amongst people” (Matsui, 2015). Informal sociability refers to social bonding among members of the informal network, such as friends and neighbors. Informal sociability reflects the degree to which members of an informal network socialize with one another (Marschall & Stolle, 2005). As in the two previous cases, the results of the studies examining the impact of ethnic diversity on informal sociability are far from consistent.
On the one hand, there is literature providing evidence that ethnic diversity has a negative impact on the informal sociability and solidarity of the population. Putnam (2007) suggested his “constrict theory,” according to which diversity reduces both in-group and out-group solidarity (p. 144). Therefore, in ethnically diverse areas, people have fewer friends (Putnam, 2007). The more ethnically diverse a society, the fewer people there are with whom individuals can identify themselves and the less people trust each other, resulting in a weaker connection among people (Putnam, 2007). Informal communication (i.e., communication with friends) can weaken under the influence of ethnic diversity. In integrated threat theory (Stephan, Diaz-Loving, & Duran, 2000), it is argued that people feel anxious in intergroup interactions because they are concerned about negative outcomes, such as embarrassment, disapproval, and rejection (Stephan, Ybarra, Martnez, Schwarzwald, & Tur-Kaspa, 1998). As a consequence, the number of friendships in ethnically heterogeneous areas can be lower.
Social identity theory (Tajfel, 1982; Tajfel & Turner, 1986) predicts that the probability of friendships between people is higher if they belong to a single group and this group can be organized according to specific criteria (including ethnic, cultural, and regional criteria). Accordingly, the likelihood of a large number of friendly relations in ethnically heterogeneous regions may be lower, in line with the notion of homophily (i.e., people connect with others who are similar to themselves, this phenomenon is one of the basic principles of social relationships; Galupo & Gonzalez, 2013; McPherson, Smith-Lovin, & Cook, 2001; Ueno, 2010). Ethnic diversity reduces the possibility of finding similar people and, thus, impedes the emergence of friendships. All this gives us reasons to expect a negative relation between the ethnic diversity of a region and the number of informal links (friends) of the inhabitants of this region.
On the other hand, some studies quite convincingly showed that ethnic diversity can enhance informal sociability. At country level, empirical studies involving European countries have not observed a negative relationship between the level of informal communication and ethnic diversity (Savelkoul, Gesthuizen, & Scheepers, 2011). Moreover, a positive correlation was found between net migration in European countries and the frequency of contacts with friends and neighbors (Gesthuizen et al., 2009). Existing research showed that ethnic diversity increases the likelihood of intergroup contact (Schlueter & Scheepers, 2010). In turn, intergroup contact reduces negative attitudes toward out-groups in several ways, including a reduction of intergroup anxiety: It reduces feelings of threat and uncertainty that people experience in intergroup contexts (see Pettigrew & Tropp’s, 2006, meta-analytical study of the contact hypothesis). Intergroup anxiety is an important mediator of the relationship between ethnic diversity and informal friendly contacts among representatives of different ethnic groups (Savelkoul et al., 2011). Therefore, we can suppose that ethnic diversity increases the likelihood of interethnic contacts, which in turn has a positive effect on the size of a respondent’s informal network.
The many conflicting results suggest that testing Putnam’s constrict theory requires a thorough knowledge of the context. Thus, multilevel data obtained in schools show that ethnic diversity is associated with fewer friendships and a lower attachment to friends at individual level. However, this association appears to be due to the school’s socioeconomic composition. For immigrants, a higher ethnic diversity can yield more friendships and a higher attachment to friends (Demanet, Agirdag, & Van Houtte, 2012). Similarly, the evidence in favor of Putnam’s constrict theory is weaker in regions where there are more minorities and migrants (Wickes, Zahnow, White, & Mazerolle, 2014).
Thus, we see conflicting evidence on how ethnic diversity may be related to informal sociability. There is evidence pointing to a negative correlation, but there is also evidence that ethnic diversity at least does not preclude the formation of friendships, and that, under certain conditions, diversity can indeed lead to an increase in their number (Demanet et al., 2012). It can be concluded that extant literature does not allow for a specification of a clear link between ethnic diversity and the number of close friendships. Therefore, we refrained from specifying any hypothesis.
Russia as a Context for Testing Putnam’s Hypothesis
In summary, we see that in some contexts, cultural diversity has mainly a negative impact on social capital, whereas in other contexts, no such effects are observed. Accordingly, we can assume that there may be some contextual moderators influencing the relationship. Most likely, the reason may lie in the nature of ethnic diversity, its sources, and the history of its formation. So, not diversity as such but some of its structural features can affect trust in society (which is part of the social capital), as has already been suggested before (Tsai, Laczko, & Bjørnskov, 2011). So, the ethnic diversity of the country does not inevitably have a negative influence on social capital inside the country. We briefly discuss four potential moderators.
The first moderator is the ethnic groups’ historically long experience of living in the same area. The ethnic diversity of the Western European countries and the United States was formed largely due to intense and often recent immigration. The ethnic diversity of the many regions of Russia mainly results from the presence of internal ethnic groups having lived together for centuries, which enhances the mutual ethnocultural competence and contributes to a shared historical memory. The historical experience of living in the same area contributes to increased permeability of the intergroup boundaries and, consequently, may not adversely affect the social capital of the country. A large number of recent migrants, on the contrary, may reduce social capital, in particular one of its components—trust (Bjørnskov, 2008).
The second moderator is the possibility to preserve and develop minority ethnic cultures in the ethnic republics within Russia. On the one hand, the peoples living in the territory of the Russian Federation know Russian culture and history quite well, whereas, on the other hand, they have the opportunity to preserve and maintain their own ethnic culture. In particular, the Russian Federation includes 22 national republics and four national autonomous regions. The republics have the right to establish their official languages. These languages are used, along with the Russian language, by the state and local authorities of the republics of the Russian Federation (The Constitution of the Russian Federation, 1993).
As a result, in the national republics, children have the opportunity to study national languages in secondary schools. In most republics, there are media in the national languages (newspapers, television), as well as books, national poets, writers. About 20% of Russian education institutions teach monoethnic students in the native (non-Russian) tongue (Khaleeva, 2008). For example, in the Republic of Tatarstan, 15 from 22 state universities provide teaching in the national language (Muharyamova, Morenko, Petrov, Salahatdinova, 2004). In Russia, there are many different religious organizations of different confessions. Organizations of the Russian Orthodox Church take 59% among all religious organizations, which were registered in Russia and other religious organizations account for 41% (Federal State Statistics Service, 2016).
The third moderator is the source of migration. If migrants are characterized by a large cultural distance from the local population, such differences are likely to increase the level of intergroup anxiety and perceived threats to the local population (Stephan et al., 2000; Stephan et al., 1998), which is highly likely to have adverse consequences on social capital. However, in the case of Russia, the majority of international migrants come from the former republics of the Soviet Union (Vishnevsky, 2013). In the past, those people used to be citizens of the same nation state, which had a unified education system and the same mass media, and this reduced the cultural distance between the peoples. Therefore, the presence of such migrants is unlikely to lead to the erosion of social capital.
The fourth moderator is the percentage of external migrants in relation to the total population. Russia is very different in this respect from the European countries and the United States. Despite the fact that Russia has the third largest number of immigrants in the world, after the United States and Germany, the percentage of immigrants relative to the total population in Russia is lower than in these two countries. Among these countries, Russia has the smallest proportion of international migrants relative to the total population (8%), compared with 14% in the United States and 15% in Germany (UN Department of Economic and Social Affairs, 2016).
Thus, the analysis of the characteristics of the context, in which the intercultural interaction takes place in Russia, makes it possible to assume that the influence of ethnic diversity, which is due to contextual features, may be different from the findings of Putnam’s study made in the United States. In particular, the impact of Russia’s ethnic diversity on its social capital is likely to be very weak.
Method
Sample and Data Collection
We carried out the survey during the summer of 2012. Russia had eight federal districts at that time. These districts included 83 federal administrative units, 21 of which are “national” republics, named after the ethnic titles of one or more of the most numerous ethnic groups living in this republic. We conducted our research in two of eight districts (Central Federal District [CFD] and North Caucasus Federal District) and in 25 of 83 administrative units. We conducted the survey in the two regions of Russia with the highest variation of the ethnic diversity across the administrative units.
The total sample included 2,058 respondents. We interviewed (face-to-face) representative samples of 1,024 respondents from the CFD of Russia including Moscow, and 1,034 respondents from the North Caucasian Federal District (NCFD). All the respondents answered the questionnaire assessing their social capital. The sample was recruited using probability sampling so as to obtain an adequate picture of the population of these two regions, as explained below in more detail.
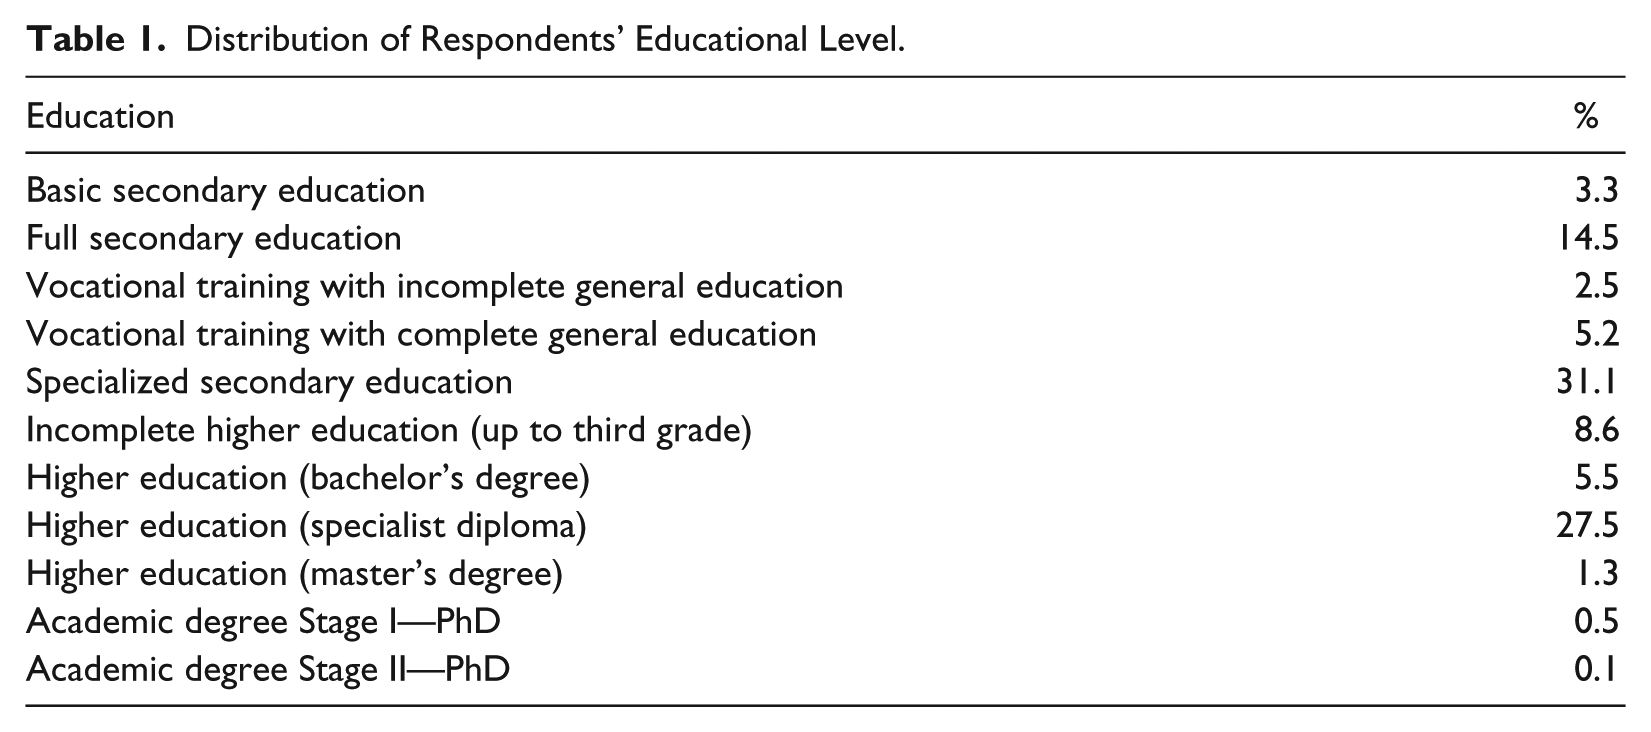
The sample included 61.1% of Russians and the remaining respondents belonged to other ethnic groups. The median age of the respondents was 39 years, the average was 38.8 years (SD = 12.6 years). The distribution of education (according to official Russian classification) of respondents is presented in Table 1. Respondent’s employment status was as follows: employee, 53.8%; self-employed/entrepreneur, 8.2%; education (student), 7.5%; housework/looking after children, 9.2%; military service, 0.4%; retired, 9.3%; unemployed, 11.7%. The sample was balanced by gender and included 49.4% of males and 50.6% of females.
Distribution of Respondents’ Educational Level.
Sample design
Persons aged 18 to 60 years old residing in private households in the two federal districts in Russia were eligible. These two districts include 25 smaller areas (administrative units), such as republics and oblasts. The total sample universe is 24.8 million people in the CFD and 5.8 million people in NCFD (All-Russian Population Census, 2010). We used these federal districts because the regions included in their structure provide the necessary variety in ethnic diversity (Figure 1). The North Caucasus Federal District has a rather high level of ethnic diversity in most republics, except for Chechnya, where diversity is close to zero. In the regions of the CFD, the level of ethnic diversity is lower, with the exception of Moscow and the Moscow region, which attract migrants from various regions of Russia and abroad. We think that the inclusion of other federal districts of Russia would not enable us to achieve such a high variance in terms of the level of ethnic diversity of regions (oblasts and republics) in federal districts.

Ethnic diversity index of the surveyed 25 regions of Russia.
The sample is supposed to cover the entire population aged 18 to 60 years old, residing in the territory of the two federal districts (Central and North Caucasian) in the period of interviewing. Entirely excluded from the survey were military reservations, monasteries, hospitals, rest or convalescent homes, homes for the aged, rooms in hotels or motels, and other institutionalized parts of the population. The type of sample was a multistage (three stages) area sample. In each Federal Okrug (District), the sample units were recruited in three stages: (a) PSUs (primary sample units): electoral district (100 in total), (b) SSUs (secondary sample units): households, and (c) sampling unit on the third stage of selection: persons within a household. More specifically, the first stage involved the stratification of all PSUs (electoral districts) by strata formed from state administrative units (oblast/krai/republic). The number of PSUs selected in each stratum was proportionate to the population in the strata (using a controlled rounding): 100 in total. In each stratum, all electoral districts were listed, and the number of PSUs proportionate to population was randomly selected with equal probability of selection (an electoral district contains approximately 2,000 people). The second stage involved the selection of the household. A list of all eligible housing units was constructed for each selected PSU and collated in one central database. Random selection was used to select the needed number of households. The average number was 15, but varied in inverse proportion to anticipated response rates (which ranged from below 50% in Moscow to more than 80% in some rural areas). The third stage of selection involved the selection of the respondent. At each selected housing unit, the interviewer listed all residents aged 18 to 60, first men, then women, from oldest to youngest. A Kish grid (i.e., a table with random numbers specifying which person to select) was then used to select one.
Measurement of ethnic diversity in the regions
To measure the level of ethnic diversity in the regions, we used the Herfindahl index of ethnic homogeneity. We used this index because Putnam also used it in his work (Putnam, 2007). Based on the last census (All-Russian Population Census, 2010), the percentage of each ethnic group in each of the 25 regions was calculated, on the basis of which a Herfindahl index (Alesina et al., 2003) was constructed. Then, the ethnolinguistic fractionalization of each region was calculated, which reflects the level of ethnic diversity in the region. The ethnolinguistic fractionalization variable was computed as one minus the Herfindahl index, and reflects the probability that two randomly selected individuals from a population belong to different groups. The data was produced and provided by L. Grigoryan (personal communication, August 01, 2013).
In our study, we took the level of ethnolinguistic fractionalization (FRACT) as the level of ethnic diversity and call it the ethnic diversity index (EDI).
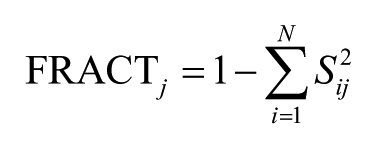
where s ij is the share of group i (i = 1, …, N) in region j. The EDI value can range from 0 (no diversity, ethnically homogeneous region) to 1 (complete diversity, ethnically diverse region).
Measurement of social capital variables
Generalized trust
We assessed social trust using two statements from different international surveys, such as “Most people can be trusted” and “Most people always act honestly” (Putnam, 2000, p. 291). We used the following responses on a five-point scale: (1) totally disagree, (2) disagree, (3) not sure/neutral, (4) somewhat agree, and (5) totally agree. Cronbach’s alpha was .85.
Community organizational life
We measured the community organizational life of the respondent by asking about the number of memberships in political parties, trade unions, professional, religious, sports, and interest organizations (cf. Häuberer, 2011; see also Table 2).
Results of a Multilevel Regression Model with Ethnic Diversity as Predictor of Indicators of Social Capital.
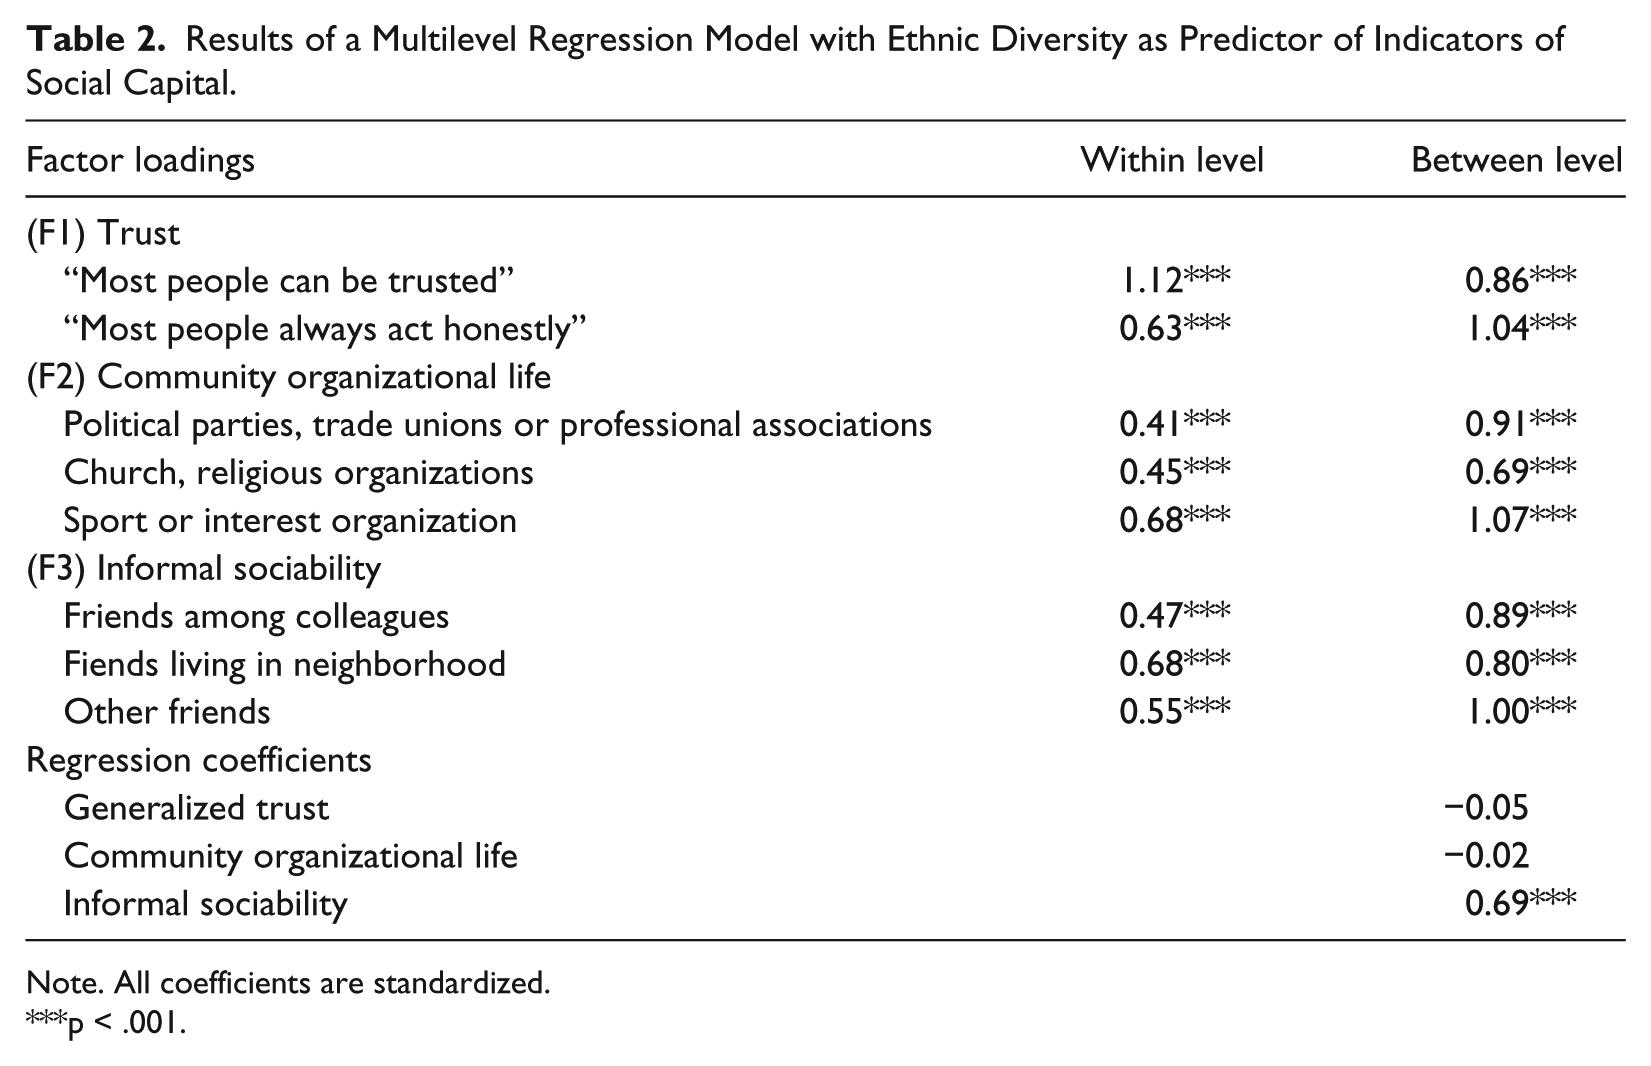
Note. All coefficients are standardized.
p < .001.
Informal sociability
We measured the informal sociability (the informal network of the respondent’s friends) by asking about his or her number of friends in the workplace, in their neighborhood, and other friends (Häuberer, 2011; van der Gaag, 2005).
Additional variables
We used seven macrolevel and microlevel additional control variables (cf. Allik et al., 2009; see also Allik, Mõttus, & Realo, 2010):
Microlevel variables. Gender: 1 = male, 2 = female. Education: the 11 stages the education has been traditionally classified into in Russia were encoded, increasingly, from 1 “basic secondary education” to 11 “academic degree Stage II—PhD” (doctor of sciences). Age: the respondent’s age was recorded as the number of complete years. Size of respondent’s settlement. We coded this variable from 1 to 7: “1” is “> 1 million people” to “7” is “< 20 thousand people.” Urbanity of respondent’s settlement. We coded this variable as 1 (urban) or 2 (rural).
Macrolevel variables. Unemployment rate: We estimated the unemployment rate as the percentage of the economically active population that is unemployed but actively seeking employment and willing to work. We based this on the data of the Russian Federation Federal State Statistics Service (2015). Average per capita income of region: We estimated the average per capita income of each region, based on the data of the Russian Federation Federal State Statistics Service (Federal State Statistics Service, 2015).
Statistical Analysis
We processed the data using multilevel structural equation modeling (MLSEM; cf. Cheung & Au, 2005; Hox, 2010; Muthen, 1985, 1994). We used this method because we wanted to analyze the association between the macrolevel variable (ethnic diversity) and the social capital indicators, which were measured at the microlevel (answers of the respondents). Similar to multilevel regression models, MLSEM decomposes the variability of the indicators into individual (within) and contextual (between) variability (Davidov, Dülmer, Schlüter, Schmidt, & Meuleman, 2012). In contrast to single-level analyses, MLSEM allows us to consider both levels of the hierarchically structured data simultaneously. In particular, it enables the partitioning of total variance into within- and between-region components and allows a separate structural model to be specified at both the individual and regional level. Three indicators of social capital are reconstructed as latent variables, which makes it possible, compared with the calculation of the mean, to preserve the dispersion as much as possible and obtain more accurate data.
Results
Ethnic Diversity Among Regions
Figure 1 shows the EDI values of the study regions. The most diverse region is the Republic of Dagestan, which is located in the NCFD. Ethnic diversity is the smallest in the Chechen Republic, which is also located in the NCFD. As can be seen, the variation in diversity is very large, which makes these regions a good context to explore the link between diversity and social capital.
Ethnic Diversity and Social Capital Indicators
The evaluation of the link between ethnic diversity and social capital was performed using two-level SEM (see Davidov et al., 2012, for a description of the procedure). Figure 2 shows a graphical representation of our multilevel SEM; Tables 2 and 3 present the output in tabular form.
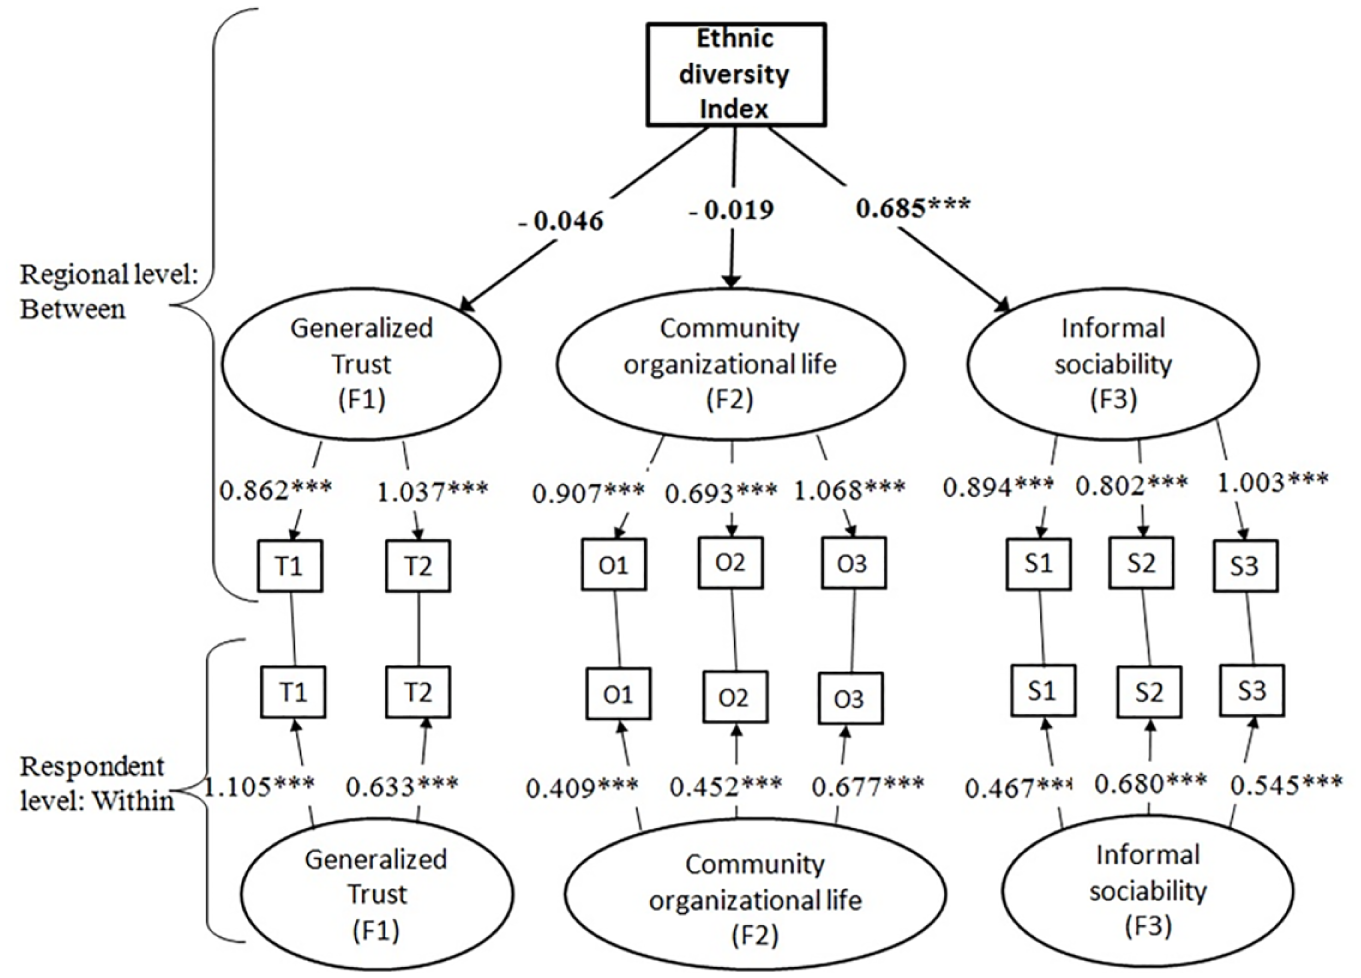
Graphical representation of the multilevel model depicting the associations of ethnic diversity and three social capital indicators.
Regression Coefficients (Standardized) of Control Variables Predicting the Indicators of Social Capital.
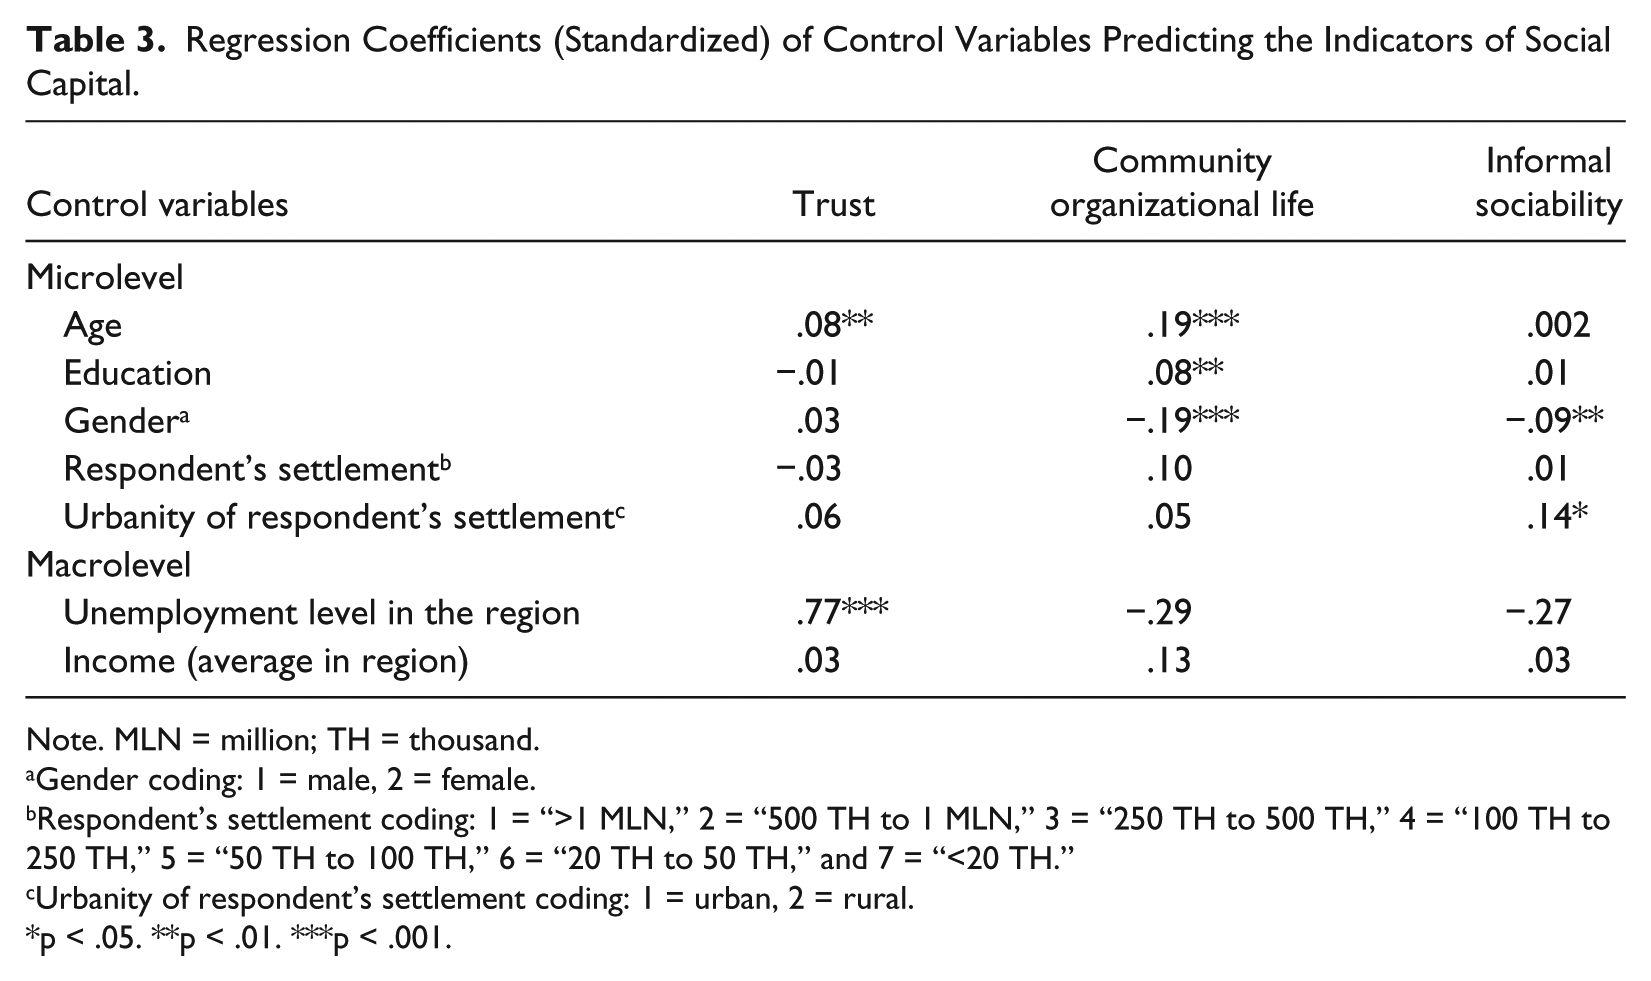
Note. MLN = million; TH = thousand.
Gender coding: 1 = male, 2 = female.
Respondent’s settlement coding: 1 = “>1 MLN,” 2 = “500 TH to 1 MLN,” 3 = “250 TH to 500 TH,” 4 = “100 TH to 250 TH,” 5 = “50 TH to 100 TH,” 6 = “20 TH to 50 TH,” and 7 = “<20 TH.”
Urbanity of respondent’s settlement coding: 1 = urban, 2 = rural.
p < .05. **p < .01. ***p < .001.
Table 2 provides the core information of the multilevel model (i.e., factor loadings at both levels) and the regression coefficients for the three social capital indicators at between level, whereas Table 3 provides the results of the tests of the individual-level control variables. The data showed a good fit: χ2/df = 212.40/73 = 2.91, comparative fit index (CFI) = .95, Tucker-Lewis index (TLI) = .92, root mean square error of approximation (RMSEA) = .03, Akaike information criterion (AIC) = 62,385.48, Bayesian information criterion (BIC) = 62,785.21, sample size–adjusted BIC = 62,559.64.
The results demonstrate that ethnic diversity was not associated with generalized trust and involvement of Russians in activities of different organizations. These results are in agreement with other studies (Anderson & Paskeviciute, 2006; Gesthuizen et al., 2009; Smith & Shen, 2002). However, a significantly positive regression coefficient of ethnic diversity on the number of respondent’s friends (informal sociability) was found. This result contradicts Putnam’s hypothesis (Putnam, 2007).
During the modeling process, we examined the role of a number of additional contextual variables measured at the micro- and macrolevels. Table 3 shows that the role of contextual variables is present, yet small. More specifically, at the microlevel, there was a small number of significant associations between individual characteristics of respondents and their social capital indicators, but these links were fairly weak, not higher than 0.19. Among macrolevel control variables, only the average unemployment rate in the region had a significant and strong effect (0.77, p < .001). In regions with a lower unemployment rate, the level of generalized trust was higher. Clearly, this relation should not be regarded as a causal link, as our design is not longitudinal and unemployment in the Russian regions is moderated by many other variables, including distance from the center of the country (Moscow), urbanity, and the specializations of the region.
Discussion
We did not confirm Putnam’s (2007) hypothesis about the negative relation between generalized trust and ethnic diversity in two regions with substantial differences in cultural heterogeneity in Russia. In large probability samples in regions with different ethnic diversity in Russia, the link between ethnic diversity and generalized trust had a negative sign, as would be expected in Putnam’s hypothesis but this link was weak and insignificant, which confirms findings of some other studies (e.g., Hooghe, Reeskens, Stolle, & Trappers, 2009). When assessing the impact of ethnic diversity on community organizational life and informal sociability, we obtained quite unexpected results. Ethnic diversity had no significant link with respondents’ involvement and activities in clubs and associations. Yet, ethnic diversity had a strong positive link with informal sociability (number of friends). So, ethnic diversity in our study did not increase formal aspects of social capital (generalized trust, community organizational life), but rather strengthened informal relation and relationships (informal sociability). These findings suggest that in the ethnically heterogeneous regions of Russia, members of organizations and communities do not provide the main social support, but friends and acquaintances do.
Why was ethnic diversity unrelated to some components of social capital? Why did we not detect any negative impact of ethnic diversity on social capital, as would be predicted by Putnam’s hypothesis? We would argue that the link between social cohesion and ethnic diversity is moderated by specific contextual characteristics and that Putnam’s hypothesis needs to be amended by incorporating such contextual conditions. We see four potential moderators in our study. The first is the long period of cohabitation in our study regions.
A long history of living together without much ethnic strife will probably lead to an experience of coexistence and tolerance toward ethnic diversity, in line with the contact hypothesis. Intercultural contact is one of the mechanisms of mutual adaptation and mutual acceptance. The second moderator refers to the cultural characteristics of people living in multicultural regions. Russia’s ethnic diversity is represented mainly by representatives of collectivistic and more or less traditional ethnic groups (e.g., by representatives of people from the North Caucasus). Representatives of such ethnic groups tend to have a lot of friends (see Häuberer & Tatarko, 2014). The third are the sources of ethnic diversity. Almost all research on the impact of ethnic diversity on social capital was conducted in countries in which ethnic diversity is the result of external migration (the United States, European countries, and Australia). Russia’s ethnic diversity has other sources—it has developed historically throughout centuries. Even recent immigrants tend to come from countries of the former USSR; so, Russian culture is not alien for them. In addition, they are not perceived as absolute “strangers” by the host population. Therefore, we concur with Hooghe (2007), who argues that ethnic diversity in itself will not reduce social capital but the influx of a large number of migrants having different mentality can. Finally, it is worth noting that the proportion of migrants and the level of ethnolinguistic fractionalization can lead to differences in the results between Russia (in our study) and the United States (in Putnam’s study). In the United States, the proportion of migrants (UN Department of Economic and Social Affairs, 2016) and ethnolinguistic fractionalization (Alesina et al., 2003) is higher than in the Russian Federation, hence the “pressure” of ethnic diversity on social capital is much stronger in the United States.
It has been argued that high ethnic diversity can adversely affect relationships in society, in particular the likelihood of civil wars (Fearon & Laitin, 2003). However, ethnic diversity is not an independent cause. Thus, it has been shown that ethnic diversity measures demonstrate a strong bivariate relationship with the onset of civil war, but this association evaporated completely after controlling for income (Fearon & Laitin, 2003). It can be concluded that Putnam’s original hypothesis requires modification by taking into account relevant contextual conditions, as specified. The lack to consider relevant contextual conditions may well underlie the inconsistencies found in replicating Putnam’s work.
Conclusion
Our study contributes to the understanding of how ethnic heterogeneity may have an effect on social capital. Using data from Russia, we found no negative influence of ethnic heterogeneity on social capital, unlike results reported by Putnam (2007). Our results lead us to believe that in considering the impact of ethnic diversity on social capital, it is important to take into account the nature of this diversity. If it is a consequence of relatively recent migration, and the number of new arrivals is high, diversity could lead to an erosion of social capital. If the proportion of recent migrants in this diversity is low, and the diversity has been established historically for centuries, which means that ethnic groups have already adapted to each other, such ethnic diversity may not have a negative effect on social capital (Hooghe, 2007). Thus, the negative influence of ethnic heterogeneity on social capital, described by Putnam (2007), is not universal or inevitable.
Our study has policy implications. The discourse in many affluent countries is anti-immigration. One of the arguments used against immigration is the poor cohesion of multicultural societies. It is important to appreciate that the link does not always appear and can indeed also lead to the opposite effects: There are many examples of neighborhoods where a strong social cohesion is combined with a high diversity (e.g., van de Vijver, Blommaert, Gkoumasi, & Stogianni, 2015).
Limitations
Our study has three limitations. First, the political and cultural context could play an important explanatory role in correlations between ethnic diversity and social capital. A limited variation in political and cultural variables is a limitation of this study. Second, we used a fractionalization rate, which was calculated mechanically. However, social capital can be influenced by factors that accompany ethnic diversity, in particular the existing relationships between groups and the history of the relationships between them. For example, the Republic of Chechnya has the lowest level of ethnic diversity in our sample, with only indigenous group of people living there (the Chechens). However, the situation in the Republic has not always been like this: It only started to take root in the beginning of the 1990s after prolonged military conflicts within the Republic. Ethnicity or ethnic diversity does not directly affect disunity and conflicts in the society. “Ethnicity matters, not intrinsically as the primordialists would claim, but rather instrumentally, when ethnic markers are used as a means of restricting political power or economic benefits to a subset of the population” (Esteban, Mayoral, & Ray, 2012, p. 864). A more nuanced measure of diversity should be used that contextualizes diversity more. Third, we did not consider the radius of trust, although it is significant for social exchange processes in society (van Hoorn, 2015), but this may become one of the future areas of research regarding these issues.
A reason of the absence of expected relations could be a radius of trust. Some studies emphasize the importance of trust radius in the evaluation of relationships between ethnic diversity and trust (Delhey, Newton, & Welzel, 2011). For example, a high level of trust in Confucian (collectivistic) countries is often explained by the narrow radius of trust—when people respond to the question about general trust, they often involve a narrow circle of people including the inner circle (Fukuyama, 1995). Ethnic diversity could be associated with a smaller radius of trust not affecting the level of trust in general. Taking into account these arguments, radius of trust could be one of the reasons why Putnam’s theses have not been confirmed in Russia, and future researches have to control this parameter of trust also.
Footnotes
Acknowledgements
A special thanks to Lusine Grigoryan, who helped to compile data of the last Russian census, and Sergy Chuvashov, who helped to draw pictures.
Declaration of Conflicting Interests
The author(s) declared no potential conflicts of interest with respect to the research, authorship, and/or publication of this article.
Funding
The author(s) disclosed receipt of the following financial support for the research, authorship, and/or publication of this article: The article was prepared within the framework of the Basic Research Program at the National Research University Higher School of Economics (HSE) and supported within the framework of a subsidy granted to the HSE by the Government of the Russian Federation for the implementation of the Global Competitiveness Program.