
Abstract
In this article, we test the hypothesis that individuals with higher levels of identity integration—or those who perceive their different social identities as more blended and harmonious—will exhibit greater interpersonal tolerance toward others holding dissimilar values and preferences. Three studies examined this hypothesis using bicultural identity integration (or perceived blendedness and harmony between multiple cultural identities) and generalized identity integration (or perceived blendedness and harmony between one’s social identities in general). We find that individuals who perceive higher levels of blendedness, but not harmony, between their social identities are more tolerant of dissimilar others, as demonstrated by making more positive trait inferences about them. We also find that experimentally increasing identity integration leads to more positive trait inferences. Our findings have theoretical and practical implications for managing conflict between individuals and groups.
During the 2016 U.S. presidential campaign, Donald Trump proclaimed that “. . . you have people coming in and I’m not just saying Mexicans, I’m talking about people that are from all over that are killers and rapists and they’re coming into this country” (Moreno, 2015). Trump’s remark was widely seen as incendiary because he inferred highly negative traits (such as being violent or immoral) to individuals in a cultural group. These negative trait inferences have serious outcomes as they were used to justify the creation of permanent distance between the two cultural groups—in this case, to build a wall between United States and Mexico.
This tendency to infer negative traits and dispositions to dissimilar others is characterized as intolerance (Greenberg, Simon, Pyszczynski, Solomon, & Chatel, 1992; Hewstone, Rubin, & Willis, 2002). Intolerance can be highly intractable, as people’s traits and dispositions are stable attributes that affect behaviors in multiple domains. Trump’s remarks imply that, even if immigration and law enforcement policies could stem migration and crime rates, the inherent violent and immoral nature of Mexicans would make them intolerable to individuals living in the United States in the long term.
Intolerance not only exists between individuals who belong to different cultural groups, but also interpersonally when there are “disagreements with individuals encountered frequently in daily life” (Kobayashi, 2010, p. 550). Indeed, beyond Mexicans, Donald Trump has made negative trait inferences about individuals with whom he did not see eye to eye, despite being members of the same ingroup. For example, he called John McCain—who is in Trump’s ingroup with regard to gender, race, nationality, and political affiliation—a “loser” for being captured as a prisoner of war in Vietnam, inferring that McCain is dispositionally cowardly and incompetent.
In this article, we propose that the way individuals psychologically manage their multiple self-identities influences their intolerance toward dissimilar others. Specifically, we argue that individuals who are better able to integrate dissimilar self-identities will be less intolerant, or less likely to make negative trait inferences of others with whom they disagree. Below, we provide a review of existing psychological work on interpersonal intolerance and identity integration (II), as well as the theoretical rationale underlying our proposition.
Interpersonal Tolerance: Trait Inferences of Dissimilar Others
Research on person perception finds that people spontaneously make dispositional trait inferences about others. In short, we tend to attribute others’ behaviors to their stable, internal, and global traits (Winter & Uleman, 1984). These trait inferences are prone to bias. Specifically, we tend to make positive trait inferences about ingroup members or individuals who are similar to us, and negative trait inferences about people who have different values, behaviors, or opinions than we do (Gaertner, Mann, Murrell, & Dovidio, 1989; Galinsky & Moskowitz, 2000). For example, when participants are in an intergroup context—that is, they are led to believe that they are members of one of two groups—they tend to attribute more positive traits to ingroup members and fewer positive traits to outgroup members. Outgroup members are seen as less warm, less friendly, less trustworthy, less moral, less intelligent, and even less clean (Byrne, 1961).
Intolerance (or tolerance) is also commonly discussed in the context of intergroup relations, where perceptions of others are based on their group membership. In this context, intolerance has been defined as lack of mutual acceptance of, stereotypes about, and discrimination against outgroup members (Berry, 2006; Verkuyten, 2010). As illustrated by Donald Trump’s quote about Mexicans, people who belong to a different group as we do are negatively stereotyped (e.g., perceived as dispositionally violent and immoral), subjected to discriminatory behaviors (e.g., enforced separation), and ultimately perceived as unacceptable. Yet, as Donald Trump’s statement about John McCain illustrates, tolerance or lack thereof can be exhibited outside of the intergroup context. In one study, Roccas and Amit (2011) measured interpersonal tolerance as feelings of closeness toward individuals who share different personal values. Specifically, Israeli participants read about individuals with values that differ from those of prototypical Israelis (e.g., a Jewish Israeli woman who chooses to marry outside her ethnic/religious group, or an Israeli who refuses to serve in the military). Tolerance was operationalized as participants’ willingness to have social contact with these individuals. This includes intermittent social relations, work or business relations, intimate friendships, having them as guests at their home, letting their children play together, and having them as next-door neighbors. In a similar study, interpersonal tolerance was operationalized as willingness to sit closer to dissimilar others (Skitka, Bauman, & Sargis, 2005). In addition, interpersonal tolerance has been operationalized as a tendency to favor rather than disadvantage dissimilar others. In a study on moral attitudes, Wright, Cullum, and Schwab (2008) exposed participants to an argument written by another participant that represented a divergent moral attitude. In an ostensibly unrelated study, they were asked to divide raffle tickets between themselves and the other participant. The number of raffle tickets they chose to give to the other participant was used as a measure of tolerance.
Drawing from this work, we suggest that interpersonal tolerance can be reflected in positive trait inferences of dissimilar others, or perceiving someone as likable, resourceful, competent, or warm even though they do not share one’s views (Byrnes & Kiger, 1988; Crandall, 1991; Roccas & Amit, 2011). It is important to note that here, tolerance is not necessarily reflected in positive perceptions about others’ positions; rather, tolerance is reflected in positive perceptions about others’ dispositions even though they hold positions or values that differ from one’s own (Halevy, Sagiv, Roccas, & Bornstein, 2006; Roccas & Amit, 2011; Skitka et al., 2005). Instead of explicitly asking people whether they accept another person with a different opinion (Wright et al., 2008), this conceptualization of tolerance allows us to tap into automatic attitudes that are less influenced by social norms and social desirability (Hewstone et al., 2002).
Recent studies show that self-perceptions may influence interpersonal tolerance. Particularly, individuals who see themselves as being represented by many different groups with distinct values are more likely to make positive trait inferences about others with opposing viewpoints (Brewer & Pierce, 2005; Gresky, Eyck, Lord, & McIntyre, 2005; Miller, Brewer, & Arbuckle, 2009; Roccas & Amit, 2011; Roccas & Brewer, 2002; Schmid, Hewstone, Tausch, Cairns, & Hughes, 2009). This suggests that individuals who are more able to detect similarities and common ground between identities may be more likely to exhibit interpersonal tolerance. Next, we turn to this literature on the psychological management of multiple identities and provide a detailed rationale of how these processes relate to interpersonal tolerance.
Identity Integration: Managing Multiple Identities
Individuals belong to and identify with multiple social groups at the same time. For example, one person can be an engineer, a Latina, a volleyball player, and a Buddhist. While some of these groups have similar values and norms, this is not always the case. For example, consider a bicultural individual who identifies as Chinese American. To the extent that Eastern and Western countries exemplify contrasting values (e.g., interdependent and independent values, respectively), individuals who identify with both Chinese and American cultural groups must negotiate the differences between their cultural identities.
There are important individual differences in how people engage in the process of managing multiple social identities (Roccas & Brewer, 2002). Studies on immigrants, or individuals who have been exposed to cultural values and norms of both their original/home countries and their new/host countries, find that some do not truly integrate these cultural identities—they adopt either the cultural orientation of their host or their home countries, but not both. However, others can integrate the cultural orientations of both their home and host countries (Berry, 1990; Roccas & Brewer, 2002).
Recent research finds that individual differences in identity management are captured by the construct of identity integration (II). II refers to individuals’ subjective perceptions of compatibility between their multiple social identities or the different groups to which they belong. II is comprised of two components: perceptions of blendedness/overlap between their identities and perceptions of harmony/lack of conflict between their identities (Benet-Martínez & Haritatos, 2005; Huynh, Nguyen, & Benet-Martínez, 2011). Research with biculturals, for example, finds that those with high II do not see their different cultural identities as mutually exclusive—They do not consider it problematic to adopt multiple cultural identities despite their opposing nature, and they find it easy to switch back and forth between different cultural orientations (Hong, Morris, Chiu, & Benet-Martínez, 2000; Padilla, 1994; Rotheram-Borus, 1993). Conversely, biculturals with low II perceive their multiple cultural identities as a source of internal conflict and tension, and they find it difficult to adopt opposing cultural identities at the same time (Gil, Vega, & Dimas, 1994; Phinney & Devich-Navarro, 1997; Vivero & Jenkins, 1999).
Early research on II focused on biculturals or individuals who identify with more than one cultural/ethnic group, such as Chinese Americans or Muslim Americans (Benet-Martínez, Leu, Lee, & Morris, 2002; Mok & Morris, 2010; Saleem, Dubow, Huesmann, & Lee, 2015). More recently, research on II has been expanded to examine identity management in other individuals who are members of other groups with conflicting values or norms. Gender-Professional II examines II among women in male-dominated professions (such as engineering and business); multiracial II examines II among multiracials; or work-family II examines II among individuals with strong work-related and family-related identities (Cheng & Lee, 2013; Cheng, Sanchez-Burks, & Lee, 2008; Hanek, Lee, & Brannen, 2014; Sacharin, Lee, & Gonzalez, 2009). Generalized identity integration (GII) is a broader conceptualization that describes people’s overall tendency to perceive their social identities as having compatible values or norms (Hanek & Lee, 2014). Here, II is considered a common and prevalent psychological process that is broadly relevant for all individuals.
Identity Integration and Interpersonal Tolerance
We suggest that perceptions of integration between one’s own identities will be linked to interpersonal tolerance. Specifically, those with higher levels of II (or those who perceive compatibility rather than conflict between their social identities) will make more positive trait inferences of others who have a different opinion or value than their own. This proposed relationship was first suggested by research on self-perceptions. In one study, Miramontez, Benet-Martínez, and Nguyen (2008) asked Latino-Americans to describe the personality traits of themselves, a typical Latino, and a typical Anglo-American. They found that individuals with higher II perceived more overlap and similarity in their descriptions of these categories. Similar studies found that individuals with high social identity complexity (SIC)—or individuals who see their selves as being represented by many rather than few groups—tend to be more tolerant of others with opposing viewpoints (Brewer & Pierce, 2005; Miller et al., 2009; Roccas & Amit, 2011; Roccas & Brewer, 2002; Schmid et al., 2009). Experimental manipulations of SIC—by asking individuals to conceptualize their identities in more or less complex ways—directly affects interpersonal tolerance (Gresky et al., 2005). This literature suggests that individuals who are more able to detect similarities and common ground between distinct groups hold more positive perceptions of dissimilar others.
Second, studies of biculturals (e.g., Asian Americans) found that those with higher II have more ethnically diverse relationships, have fewer coethnic relationships (e.g., they have more Asian friends and American friends, not just Asian American friends), and their networks are more interconnected (Benet-Martínez, Repke, & Maciocco, 2013; Mok, Morris, Benet-Martínez, & Karakitapoğlu-Aygün, 2007). Similarly, a recent survey of Muslim American youth found that those with high II are more likely to approach and less likely to avoid and confront individuals who do not share their cultural values and practices (usually Anglo-Americans; Saleem et al., 2015). In other words, those with higher II are more likely to be socially connected to members of multiple groups to which they belong even if these groups have conflicting values. Again, this research supports the idea that II may predict tolerance of dissimilar others.
Third, intergroup tolerance, or positive perceptions of outgroup members, is associated with psychological processes similar to the blendedness component of II, including incorporating culturally discrepant identities into the self, seeing connections between contrasting social identities, and being able to simultaneously identify with multiple identities (Amiot, de la Sablonniere, Terry, & Smith, 2007). Like blendedness, these psychological processes are measures of perceived overlap between one’s different identities. Interestingly, the intergroup literature suggests that the relationship between tolerance and harmony (or lack of conflict), the second component of II, may be less strong. Specifically, harmony or lack of conflict may reflect separation from dissimilar others, which can exacerbate perceptions of others as illegitimate or unacceptable (Cheng, Lee, Benet-Martínez, & Huynh, 2014). Thus, simply experiencing lack of conflict between identities may not necessarily be related to an ability to overcome negative perceptions of dissimilar others. In all, we propose that interpersonal tolerance (or lower tendency to make negative trait inferences about dissimilar others) will be positively related to the blendedness component of II, but the same relationship will be less apparent for the harmony component of II.
Summary and Hypotheses
In the current article, we examine the relationship between II and interpersonal tolerance. We hypothesize that people who show higher levels of blendedness and harmony will also show higher levels of tolerance toward people who endorse opposing positions from their own (Hypothesis 1). We also hypothesize that this relationship will be stronger for the blendedness component of II than the harmony component of II (Hypothesis 2). Finally, we hypothesize a direct causal relationship between II and tolerance, such that increasing II will lead to higher levels of tolerance (Hypothesis 3).
We conducted three studies to test our hypotheses, using different samples across cultures and different operationalizations of II. In the first study, we focus on bicultural identity integration (BII), or perceived blendedness and harmony between ethnic identities among a sample of multicultural individuals. In the second study, we focus on the relationship between tolerance and GII or perceived blendedness and harmony among one’s identities in general. In the third study, we manipulate II by prompting individuals to think of their identities as more or less blended and harmonious. In all three studies, we operationalize tolerance as positive trait inferences of individuals holding opinions different than one’s own. In all three studies, we focus on interpersonal rather than intergroup tolerance—that is, our operationalization of tolerance is not based on people’s impressions of outgroups, but on people’s impressions of others who have different positions or values than one’s own. Furthermore, our operationalization of tolerance is not based on people’s attitudes toward positions or values, but on people’s trait inferences of dissimilar others.
Study 1
In the first study, we focus on East–West biculturals, and examine how their perceptions of blendedness and harmony between their Eastern and Western identities relate to their tolerance for individuals who hold an opinion different from their own. We conducted this study in Singapore because it has strong Eastern and Western cultural influences. Despite being in Asia and having 98% of its inhabitants as Asians, Singapore is a former British colony that has retained deep Western influences. For example, English remains Singapore’s national language (Central Intelligence Agency, 2013). Also, most individuals living in this multicultural context have prior experiences mixing their Eastern and Western cultural identities. Multicultural individuals in Singapore may be quite similar to individuals who have been the target of previous research in Hong Kong because while Chinese is the dominant ethnicity, there has been strong Western influence as a product of British colonization in both countries (Chen, Benet-Martínez, & Harris Bond, 2008; Ng & Lai, 2010). We predict that participants with higher levels of II between their Eastern and Western cultural identities will make more positive trait inferences of another person who holds a contrasting opinion (Hypothesis 1). We further predict that this relationship will be stronger for the blendedness component of II and weaker for the harmony component of II (Hypothesis 2).
Method
Participants
Sixty-two students (29 females, 33 males; Mage = 24.35, SD = 2.964, range = 18-30) were recruited from a large university in Singapore using posted fliers around campus and a paid subject pool. All participants were ethnically Chinese (Chinese is the largest ethnic group in Singapore, comprising 74.2% of the population). Participants were compensated 10 Singapore dollars upon completion of the study.
Procedure
The procedure used a typical paradigm for examining tolerance (Brewer & Pierce, 2005; Miller et al., 2009; Schmid et al., 2009). Participants were brought into a lab individually and read a vignette about a student whose friend became ill during exam period. The protagonist was torn between two options: staying at school for an important exam review session or taking the sick friend to the hospital (see the appendix for the full vignette). Participants were asked to imagine themselves as the protagonist, and then choose one of these two options. Participants were then told that they would meet another participant, and that he or she had chosen the other, opposite option.
Before the meeting, participants completed several scales (see below for more detail). Upon completion of the scales, the experimenter told the participants that they would not actually be interacting with another person. Participants were then debriefed. No participant demonstrated concern about the deception. The study was approved by the institutional review boards at both the host institution in Singapore as well as the home institution of the lead author.
Measures
Participants completed the following scales in English, which is the language of instruction at the university where this research was conducted.
Cultural identification
Insofar as our study examines BII, it is important to determine whether participants identify with being Chinese and being Western (Benet-Martínez et al., 2002). Using a 6-point Likert-type scale ranging from 1 (very weak) to 6 (very strong), participants rated the following items: “To what extent do you identify with Chinese culture” and “To what extent do you identify with Western culture.” This is a common method for measuring cultural identification in previous research on II (Benet-Martínez et al., 2002; Cheng, Lee, & Benet-Martínez, 2006; Ng & Lai, 2010). While longer scales exist to measure cultural identification, these two items have been shown to correlate highly with these longer measures, and shown to predict a variety of behaviors (Guan, Lee, & Cole, 2012). Following previous research on BII, we only included participants who rated their identification with both Chinese and Western cultures above the scale midpoint. The remaining sample included 23 participants (Mage = 24.35, SD = 2.964; 9 females, 14 males; identification with Chinese culture: M = 4.83, SD = 0.834; identification with Western culture: M = 4.48, SD = 0.790).
BII
Participants filled out the Bicultural Identity Integration Scale (BIIS), which was adapted from the BII Scale–Version 1 (BIIS-1; Benet-Martínez & Haritatos, 2005) and the BII Scale–Version 2 (BIIS-2; Huynh et al., 2011). The adapted scale was abbreviated to include only nine items to reduce redundancy and participant fatigue (Gosling, Rentfrow, & Swann, 2003). Both scales tap into blendedness and harmony, the subcomponents of II. This two-factor structure has been extensively validated and replicated in previous studies (the subcomponents of blendedness and harmony have also been labeled as “distance” and “conflict,” respectively; see Cheng et al., 2014, for a review).
BII Blendedness Subscale. The Blendedness subscale consists of items measuring the level of overlap between different identity groups. In the BIIS-1, items that measure blendedness between two groups X and Y (say Chinese and American; or women and engineer) include “I keep X and Y separate” (reverse code [R]), “I am simply a member of X living in Y” (R), “I am a combination of X and Y,” and “I am an X-Y (hyphenated, a mixture of the two)” (Benet-Martínez & Haritatos, 2005). In the present study, we modified these items substituting “Chinese” and “Western” cultures for X and Y. (It should be noted that we did not use the item “I am an X-Y (hyphenated, a mixture of the two)” because the phrase “I am Chinese-Western” was awkward). We also added two additional items based on BIIS-2: “I feel like I am behaving in a Chinese way sometimes, and behaving in a Western way other times” (R) and “I feel like I am switching between Chinese and Western cultures” (R; these are modified versions of the item “I feel X and Y at the same time” in BIIS-2). Participants rated these items using a 5-point Likert-type scale ranging from 1 (strongly disagree) to 5 (strongly agree). After reverse scoring, higher scores on these items reflect higher levels of blendedness between Chinese and Western identities.
BII Harmony Subscale.The Harmony subscale measures lack of conflict or tension between different identity groups. In BIIS-1, items include “I do not feel trapped between X and Y,” “I feel conflicted between X and Y ways of doing things” (R), “I feel like someone moving between two cultures” (R), and “I feel caught between X and Y cultures” (R). The BIIS-2 had additional items about perceived compatibility between the two groups (e.g., “I feel that X and Y are complementary” and “I feel that X and Y are incompatible” [R]). Drawing from these items, we used the following items to measure harmony in the present study: “I am conflicted between the Chinese and Western ways of doing things” (R), “I feel conflicted between the Chinese and Western cultures” (R), “I don’t feel trapped between Chinese and Western cultures,” and “I feel that my Chinese and Western orientations are quite compatible.” Participants rated these items using a 5-point Likert-type scale ranging from 1 (strongly disagree) to 5 (strongly agree). After reverse scoring, higher scores on these items represent higher levels of harmony between Chinese and Western identities.
Tolerance
As mentioned, participants were led to believe that they would meet another person who chose the alternative option that they had chosen. Before the meeting, participants were asked to rate this individual along 14 dimensions on a bipolar scale: accepting, inattentive, loyal, anxious, moral, unsupportive, selfish, careless, reliable, likable, unintelligent, positive, not loving, and professional. This method is commonly used in previous research to measure people’s evaluations of the trait characteristics of others (see Ambady & Rosenthal, 1993; Lee & Hallahan, 2001). After reverse scoring negative traits, the ratings were averaged to form a single composite, where higher ratings indicated more positive trait inferences or higher levels of tolerance (Cronbach’s α = .942).
Control variables
The following measures were included as control variables.
Need for cognitive closure. Need for cognitive closure is an individual difference variable that measures desire for consistency and certainty (Roets & Van Hiel, 2011). Need for cognitive closure lowers individuals’ ability to integrate conflicting and discrepant ideas, and may be related to both II and tolerance (Webster & Kruglanski, 1994). In addition, multicultural exposure can reduce need for cognitive closure, which can in turn lead to higher tolerance (Tadmor, Hong, Chao, Wiruchnipawan, & Wang, 2012). Need for cognitive closure was measured using a 15-item scale. Items include “I don’t like situations that are uncertain” and “When I have made a decision, I feel relieved” (for all items, see Roets & Van Hiel, 2011). Each item was rated on a 6-point Likert-type scale ranging from 1 (strongly disagree) to 6 (strongly agree). The 15 items were averaged to form a composite score measuring need for cognitive closure (Cronbach’s α = .888).
Big-Five Inventory–10 (BFI-10). The BFI-10 measures the Big-Five personality dimensions of openness, conscientiousness, extraversion, agreeableness, and neuroticism (Rammstedt & John, 2007). II has been shown to be positively related to openness and negatively related to neuroticism (Cheng et al., 2014). Tolerance is also related to openness, agreeableness, and extraversion (Roccas, Sagiv, Schwartz, & Knafo, 2002). The 11-item version of this scale that includes three items to measure agreeableness and two items to measure each of the remaining dimensions was used. Agreeableness has been shown to correlate with tolerance and including an additional item for agreeableness is recommended when this dimensions is especially relevant. Participants rated the items in the BFI-10 on a 5-point Likert-type scale ranging from 1 (strongly disagree) to 5 (strongly agree) (for all items, see Rammstedt & John, 2007).
Racial essentialism. As Study 1 focuses on II between cultural and ethnic groups, racial essentialism was added as a control variable. This variable captures the extent to which people view race and ethnicity as biologically determined and unmalleable. Individuals who have higher levels of racial essentialism have rigid perceptions about another person’s ethnic and racial group membership, and the values and practices associated with those groups (No et al., 2008). As such, racial essentialism may be related to lower levels of BII, as well as tolerance for individuals with different cultural perspectives. The scale contains eight items, such as “To a large extent, a person’s race biologically determines his or her abilities and traits” and “Race does not have an inherent biological basis, and thus can be changed” (for all items, see No et al., 2008). Participants rated the items on a 6-point Likert-type scale ranging from 1 (strongly disagree) to 6 (strongly agree). Higher values represent higher levels of racial essentialism (Cronbach’s α = .804).
Results
Preliminary considerations
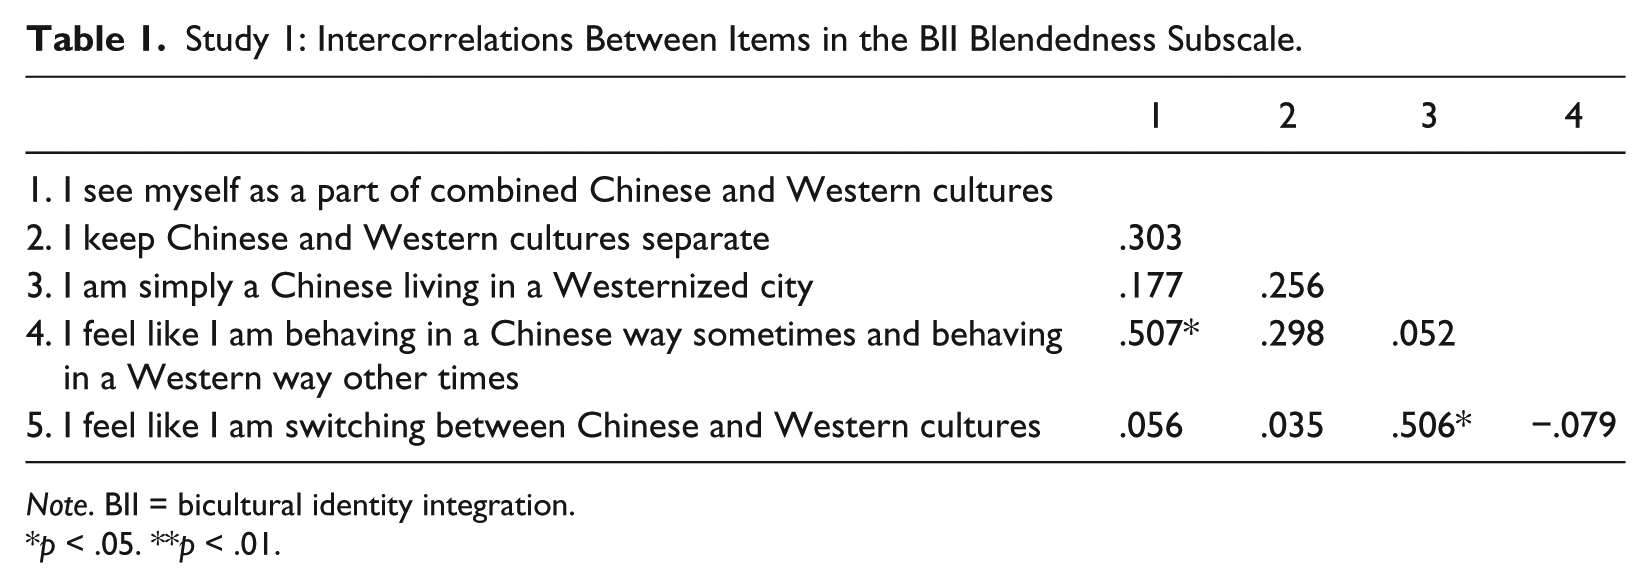
As mentioned, II is comprised of two components: blendedness and harmony. Table 1 lists the intercorrelations between the items measuring blendedness. The item “I see myself as part of a combined Chinese and Western culture” did not correlate with the rest of the items in the expected direction and was therefore deleted from the analysis. The remaining four items were averaged to form a composite measure of blendedness (Cronbach’s α = .432). The low reliability of the Blendedness subscale is not uncommon. In a review of the II literature, Cheng et al. (2014) stated that reliabilities of the II subscales are often low given the small number of items in the BIIS-1 (four items for each of the two subscales). In scales with few items, many measures of reliability such as Cronbach’s alpha may not be a good indicator of internal reliability because such indices are highly influenced by number of items (Gosling et al., 2003; Wood & Hampson, 2005). Importantly, past studies using these subscales have found support for predicted relationships with multiple outcome variables despite the subscale’s low reliability. For instance, the Blendedness subscale significantly predicted creativity in two studies, despite low reliabilities (Cronbach’s α = .55; Cheng et al., 2008). Given these considerations, our analysis will retain the blendedness composite, though interpretation of the results must consider the scales’ low reliabilities. Table 2 lists the intercorrelations between items measuring harmony. The following two items were reverse-coded: “I am conflicted between Chinese and Western ways of doing things” and “I feel conflicted between the Chinese and Western cultures.” The two reverse-coded and the other two items listed in Table 2 were averaged to form the measure of harmony (Cronbach’s α = .786).
Study 1: Intercorrelations Between Items in the BII Blendedness Subscale.
Note. BII = bicultural identity integration.
p < .05. **p < .01.
Study 1: Intercorrelations Between Items in the BII Harmony Subscale.

Note. BII = bicultural identity integration.
p < .05. **p < .01.
Hypotheses testing
Table 3 lists intercorrelations between the Blendedness subscale of II, the Harmony subscale of II, tolerance, and the control variables (racial essentialism, need for cognitive closure, and the Big-Five personality traits). First, consistent with previous research, blendedness and harmony are positively correlated. Also consistent with previous research, higher levels of neuroticism are associated with lower levels of blendedness and harmony (Cheng et al., 2014). Tolerance is not correlated with any of the control variables but positively correlated with both blendedness and harmony.
Study 1: Intercorrelations Between Key Variables.

Note. BII = bicultural identity integration.
p < .05. **p < .01.
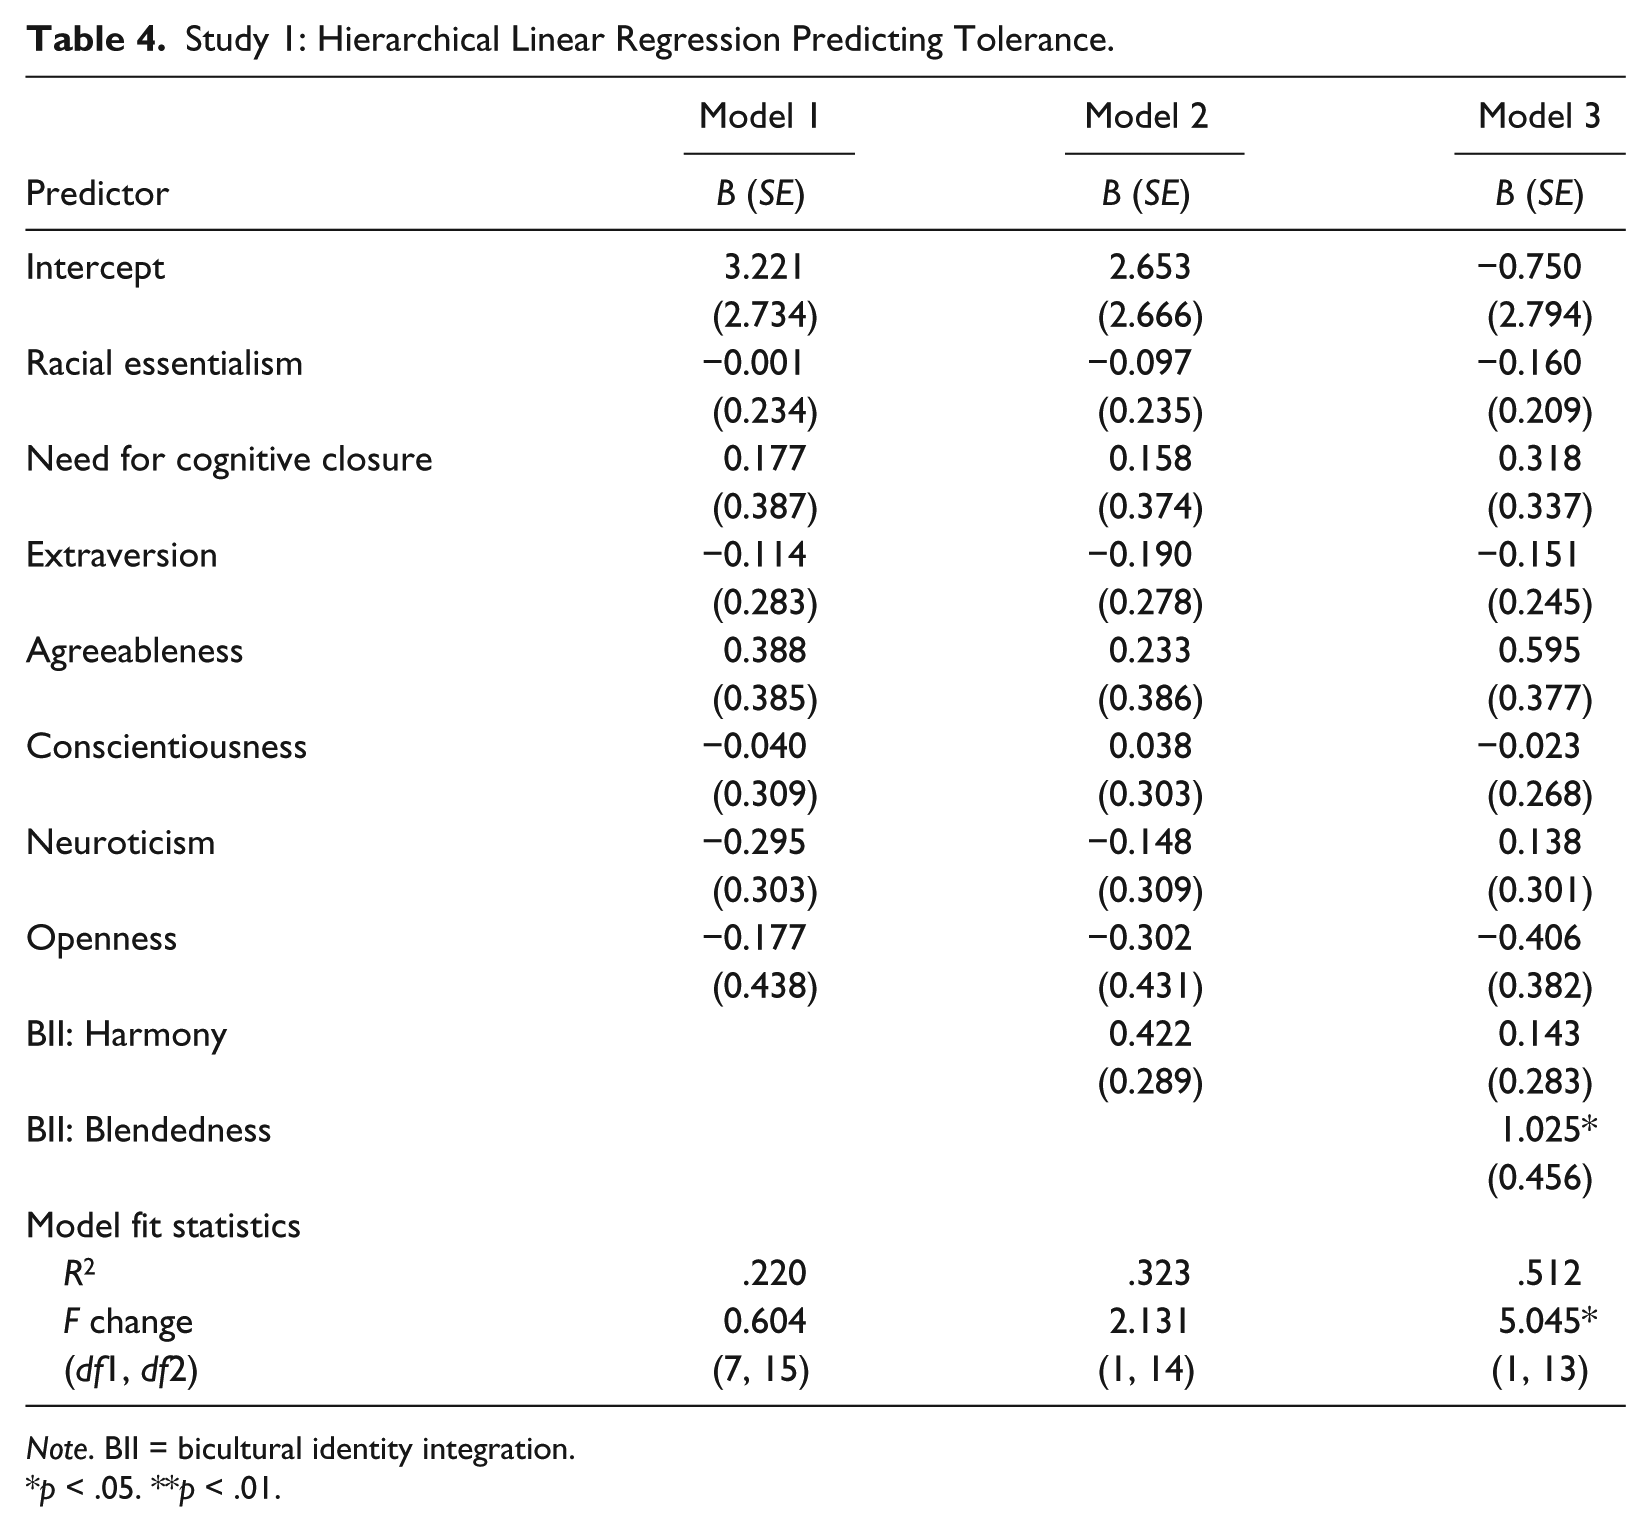
We first conducted a multiple regression, where tolerance was regressed on the control variables, blendedness, and harmony. In this analysis, none of the control variables were significant predictors of tolerance. Consistent with Hypothesis 1, blendedness significantly predicted tolerance. Harmony did not predict tolerance, supporting Hypothesis 2. To explore these effects further, we conducted a hierarchical multiple regression. The first model included the control variables. The Harmony subscale was entered in the second model, and the Blendedness subscale was entered in the third model. The results are shown in Table 4. There was a significant increase in R2 in the third model only, Fchange (1, 13) = 5.045, p = .043. The Blendedness subscale significantly predicted tolerance, Bstandardized = .652, t = 2.246, p = .043. No other variable significantly predicted tolerance in any of the three models. The full model explained 51.2% of the variance. A similar hierarchical multiple regression was conducted where the control variables were entered in Model 1, blendedness entered in Model 2, and harmony entered in Model 3. The results remained the same, such that only blendedness predicted tolerance in Model 2, Bstandardized = .716, t = 2.822, p = .014. In this analysis, only the second model had a significant increase in R2, Fchange (1, 14) = 7.962, p = .014. An additional analysis was conducted where a fourth model was added with the interaction between blendedness and harmony; the model was not significant.
Study 1: Hierarchical Linear Regression Predicting Tolerance.
Note. BII = bicultural identity integration.
p < .05. **p < .01.
Discussion
Study 1 examines how II between two cultural identities (i.e., Chinese and Western) relates to interpersonal tolerance or positive trait inferences of another who endorses different opinions or values. In support of Hypotheses 1 and 2, we found that II positively predicted tolerance, but only when we consider the blendedness subcomponent of II. Harmony did not significantly predict tolerance after controlling for individual difference variables. These findings support Amiot et al.’s (2007) contention that blendedness (or what they call “integration”) may be a more adaptive strategy than harmony to increase tolerance toward individuals with different perspectives.
Although we reasoned that our control variables—need for cognitive closure, BFI-10, and racial essentialism—may relate to tolerance, we found no significant relationships between these variables and tolerance. This may be because past research exploring these relationships has focused on intergroup processes, where perceivers are rating targets that belong to an outgroup. In our study, we focus instead on interpersonal interactions, where perceivers and targets do not necessarily belong to different groups, but nevertheless hold opposing values and beliefs. As we discuss later in the “General Discussion” section, future research is needed to examine the different psychological dynamics underlying interpersonal and intergroup dynamics.
There are several limitations to this study. First, the internal reliability of the Blendedness subscale was low, raising questions about the interpretation of the analysis. As mentioned, low reliability is not an uncommon problem in the measurement of II, especially when shorter versions of the II scale are used. In addition, low internal reliability presents a high risk for Type II error, that is, failing to find a significant relationship even though such a relationship exists (Cohen, Manion, & Morrison, 2007). In other words, having low reliability makes it more difficult to find the hypothesized effects. In this study, the low reliability of blendedness was less problematic for interpreting the results, given that we found support for our hypothesis that blendedness significantly predicted tolerance. This relationship might be stronger if the Blendedness subscale was more reliable.
That said, problems with the research design might have contributed to the low reliability. Although the BII scales have been extensively tested for their psychometric properties, these studies were predominantly conducted with Asian Americans, or first- and second-generation immigrants residing in the United States (Cheng et al., 2014). Their experiences managing dual East–West identities may be quite different from that of our sample of Chinese Singaporeans. Unlike the United States, Singapore is a uniquely multicultural society where Asian and Western cultural influences come together frequently and pervasively for all its inhabitants. Also unlike the United States, Chinese is the dominant ethnic group in Singapore, constituting three quarters of the total population (Central Intelligence Agency, 2013). These differences between Chinese Singaporeans and Asian Americans may have contributed to the low reliability of the Blendedness subscale.
Second, our analysis is based on a small sample of Chinese Singaporeans. Like low reliability, a small sample size makes it more difficult to detect effects. Given our findings showing significant relationships between blendedness and tolerance, this effect might be stronger if the sample size was larger. However, the low correlations between harmony and tolerance might be an artifact of the small sample size. Additional studies need to be conducted to examine whether we can replicate the same trend. Study 2 was conducted to address these issues.
Study 2
Study 1 focused on BII, or perceived II between Chinese and Western cultural identities among Chinese Singaporeans. Study 2 examines GII or perceived II between social identities generally, without specifying the exact type of identity group (Brannen & Lee, 2014). As we explain in more detail below, GII allows participants to define, for themselves, which of their social identities they consider as self-relevant. Using GII allows us to extend the results of Study 1 beyond cultural identities to a wide variety of other social identities, as well as go beyond biculturals to a broader sample. Like Study 1, we predict that GII will be positively related to interpersonal tolerance (Hypothesis 1). We also predict that this relationship will be stronger for blendedness than harmony (Hypothesis 2). The methods are identical to Study 1, except that we used a sample of U.S. students as participants, and we measured II using the GII rather than the BII scale.
Method
Participants
Participants were recruited from Introductory Psychology and Marketing courses at a large Midwestern University in the United States. A total of 124 participants (74 females, 50 males; Mage = 18.91, SD = 1.097) were recruited. All participants were born in United States and had never lived outside of the United States. Our sample was comprised of 58.9% Caucasians, 25.8% East Asians, 3.2% African Americans, 1.6% Middle Easterners, .8% Latino/as, and the remaining participants either selected more than one ethnic group or did not respond. Participants were given partial course credit upon completion of the study.
Procedure
The procedure was identical to Study 1. Participants read the same vignette and provided their own decision of whether to study for an exam or take the friend to the hospital. Participants were led to believe that they would meet another participant who made the opposite decision. Participants filled out the scales/measures below.
Measures
Measures of tolerance, need for cognitive closure, and BFI-10, were identical to Study 1. Racial essentialism was not included, as Study 2 focused on social identities generally rather than racial or ethnic identities. In Study 2, we used the GII scale, which measures how individuals generally manage their different identities or groups to which they belong (Brannen & Lee, 2014). The literature on II has shown that items from the original BII scale can be reliably modified to include many different types of social identities by changing the wording within specific items, and this same approach was taken to generate the GII scale (Cheng et al., 2014). Participants were first asked to think about social groups to which they belong that are important to how they define themselves. With these groups in mind, participants filled out a 10-item GII scale using a Likert-type scale of 1 (strongly disagree) to 7 (strongly agree). Sample items include “I feel comfortable having many selves,” and “I am best described by a blend of all my different selves” (see Table 5 for all items; Hanek & Lee, 2014).
Study 2: Factor Analysis for the GII Scale.

Note. GII = generalized identity integration.
Results
Preliminary considerations
Although the BII scale has been extensively studied, the GII scale is newer and its psychometrics properties are less well understood. Thus, we first examined whether items in the GII scale can be meaningfully grouped into Blendedness and Harmony subscales. We used a step-up-by-one principal components analysis procedure to examine the factor loadings of the 10 items on a single factor. Table 5 shows the factor loadings. Three items had factor loadings with absolute values that were 4 or lower, and they were excluded in the subsequent analysis. The remaining items map well with the theoretically validated subcomponents of blendedness and harmony. The items with positive factor loadings measure blendedness and include “My different selves blend together seamlessly,” “I can be described by all my different selves,” “I feel comfortable having many selves,” and “I am best described by a blend of all my different selves.” Ratings on these items were averaged to form a Blendedness subscale (Cronbach’s α = .739). The items with negative factor loadings measure harmony and include “I am often conflicted between my different selves” (R), “I am often torn between my different selves” (R), and “Having different selves creates tension” (R). Ratings on these items were averaged to form a Harmony subscale (Cronbach’s α = .826). Reliabilities for the tolerance composite and the need for cognitive closure scale were both acceptable (Cronbach’s α = .898; Cronbach’s α = .845).
Hypothesis testing
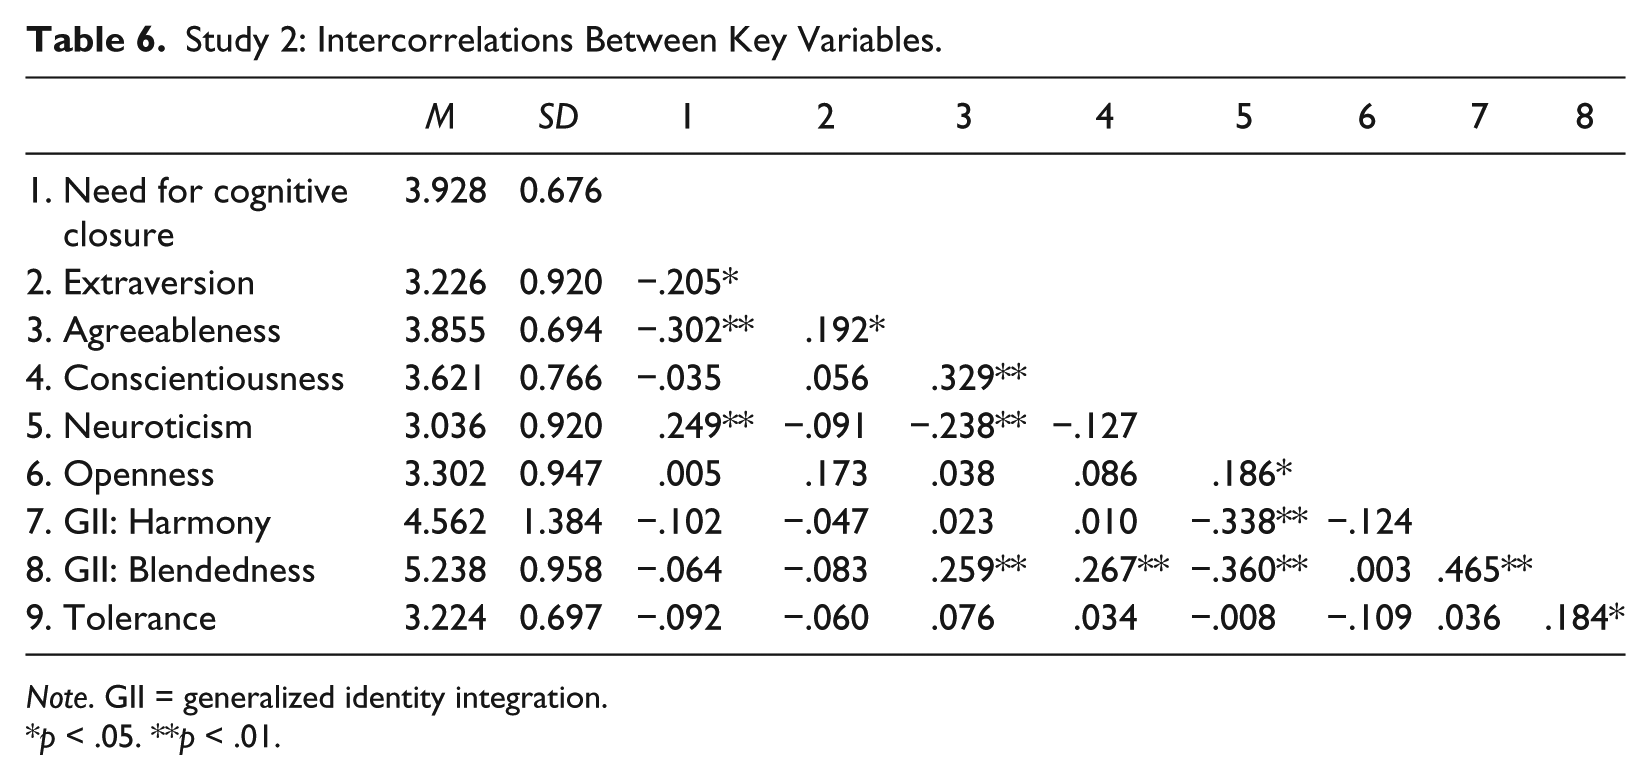
Table 6 lists intercorrelations between the Blendedness subscale of GII, the Harmony subscale of GII, tolerance, and the control variables. As Table 6 shows, blendedness and harmony were positively correlated. Consistent with Study 1, tolerance was positively correlated with blendedness, but not correlated with harmony or any of the control variables. Also consistent with Study 1, harmony and blendedness were positively correlated with one another.
Study 2: Intercorrelations Between Key Variables.
Note. GII = generalized identity integration.
p < .05. **p < .01.
We first conducted a multiple regression, where tolerance was regressed on the control variables, blendedness, and harmony. Consistent with Study 1, the regression shows that the Blendedness subscale significantly predicted tolerance, but there was no significant relationship with harmony. Next, we conducted a hierarchical multiple regression. The results are shown in Table 7. The first model included the control variables. The Harmony subscale was entered in the second model, and the Blendedness subscale was entered in the third model. Like Study 1, there was a significant increase in R2 in the third model only, Fchange (1, 115) = 4.674, p = .033. The Blendedness subscale significantly predicted tolerance, Bstandardized = .244, t = 2.162, p = .033. With the exception of neuroticism, no other variable significantly predicted tolerance in any of the three models. The full model explained 6.9% of the variance. A similar hierarchical multiple regression was conducted where the control variables were entered in Model 1, blendedness entered in Model 2, and harmony entered in Model 3. The results remain the same, such that only blendedness predicted tolerance in Model 2, Bstandardized = .154, t = 2.085, p = .039. In this analysis, only the second model had a significant increase in R2, Fchange (1, 116) = 4.349, p = .039. These results support our hypotheses.
Study 2: Hierarchical Linear Regression Predicting Tolerance.

Note. GII = generalized identity integration.
p < .05. **p < .01.
Discussion
Study 2 replicates Study 1 by showing that blendedness was positively related to tolerance, whereas the same trend was not apparent for harmony. Blendedness significantly predicted tolerance even when holding constant harmony and control variables. These results replicate Study 1’s findings in a different demographic sample and using a different operationalization of II. By using GII, Study 2 provides an important extension of Study 1 by showing that the relationship between II and interpersonal tolerance can be generalized beyond multiculturals’ integration of their cultural identities. Study 2 also extends Study 1 by providing a more reliable measure of blendedness. This makes sense as the GII scale was developed with for a general sample rather than a specific sample (e.g., Chinese Singaporeans).
Study 1 failed to find a relationship between harmony and tolerance, which may be an artifact of the small sample size. We found that this relationship was also not significant in Study 2 even though Study 2 used a larger sample. To further ascertain the relationship between harmony and tolerance, we meta-analytically combined the partial correlations between harmony and tolerance (controlling for the individual difference variables) from Studies 1 and 2. Although the measures of II are different between the two studies (BII for Study 1 and GII for Study 2), the measures provide adequate levels of conceptual similarity to allow for meta-analytic combinations (Rosenthal, 1991; Rosenthal & Rubin, 1986). The combined relationship between harmony and tolerance remains nonsignificant (r = –.031, p = .700). We also conducted the same meta-analytic analysis of blendedness and tolerance, and the combined effect is significant (r = .248, p = .002).
Study 3
Although Studies 1 and 2 found the predicted relationship between blendedness and tolerance, these data are correlational. While we suggested that higher II leads to higher tolerance, it is also feasible that tolerance for others engenders more interactions with people who hold different perspectives than one’s own, which in turn leads to higher levels of blendedness. Or, a third variable—such as living in highly diverse settings—may lead to higher levels of tolerance for others, as well as perceptions of one’s identities as integrated and blended (Woodward, Skrbis, & Bean, 2008).
Study 3 was conducted to examine the causal relationship between II and tolerance. Previously, II has been predominantly considered a stable individual difference variable, but recent research has shown that II can be experimentally manipulated as well. For example, Cheng and Lee (2013) asked people to recall positive or negative experiences with having multiple social identities and found that II increased when they recalled positive experiences and decreased when they recalled negative experiences. In the current research, we experimentally manipulated components of II by asking people to conceptualize their identities as either high or low blendedness, and high or low harmony (see “Method” section below for details). We expect individuals who conceptualize themselves as high in blendedness and high in harmony to exhibit higher levels of tolerance than individuals who conceptualize themselves as low in blendedness and low in harmony. Given that II typically comprises of both blendedness and harmony, we expect participants in the “mixed” conditions—high blendedness and low harmony, or low blendedness and high harmony—to exhibit an intermediate level of tolerance. However, based on the two previous studies showing that blendedness is a stronger predictor of tolerance than harmony, we expect those in the high blendedness and low harmony condition to exhibit higher interpersonal tolerance than those in the low blendedness and high harmony condition. In short, we expect to find a linear relationship between II and tolerance, where tolerance is highest in the high blendedness/high harmony condition, followed by high blendedness/low harmony, low blendedness/high harmony, and lowest in the low blendedness/low harmony condition.
Method
We conducted a between-subjects experiment where participants were randomly assigned into one of the following conditions: high blendedness/high harmony, mixed (high blendedness/low harmony, or low blendedness/high harmony), and low blendedness/low harmony.
Participants
One hundred five undergraduate students (Mage = 18.86, SD = 1.020; 53 females, 50 males, two did not report gender) were recruited from an Introductory Psychology course at a large Midwestern University in the United States. Of the participants, 62.9% are Caucasian, 15.2% East Asian, 8.6% African American, 6.7% South Asian, and 3.8% Latino/a. Participants were given partial course credit upon completion of the study.
Procedure
Participants were asked to draw a “self-map,” which consisted of (a) circles representing their different social identities and (b) a chart depicting whether the identities from the self-map are positively or negatively related to one another. In the instructions, participants were randomly presented with one of four examples representing the four conditions. Blendedness was manipulated by showing an example of a self-map with either overlapping or nonoverlapping circles (representing high vs. low blendedness, respectively). Harmony was manipulated by showing an example of a chart that either depicted all positive relationships between identities or all negative relationships between identities (representing high vs. low harmony, respectively).
After seeing the examples, participants were asked to create their own self-map using circles and charting whether the identities from the map were positively (+) or negatively (–) related to one another. Next, participants read the same vignette as Studies 1 and 2, and selected whether to study for an exam or take the friend to the hospital. They also completed scales measuring need for cognitive closure, BFI-10, GII, and demographic variables.
Results
Tolerance was operationalized in the same way as Studies 1 and 2 (Cronbach’s α = .891). We first conducted a one-way ANOVA with tolerance as the dependent variable, and the four levels of II as the independent variable—high blendedness/high harmony, high blendedness/low harmony, low blendedness/high harmony, and low blendedness/low harmony. The ANOVA was marginally significant, F(3, 101) = 2.339, p = .078, = .063. To test the hypothesized linear relationship between II and tolerance, we conducted a linear contrast with the following contrast weights: low blendedness/low harmony condition (–3), low blendedness/high harmony condition (–1), high blendedness/low harmony (1), and high blendedness/high harmony (3). There was a significant linear effect, F(1, 101) = 4.019, p = .048, = .038 (see Figure 1). Simple contrasts showed a significant difference between the high blendedness/high harmony and low blendedness/low harmony conditions (p = .026) and no other significant differences between conditions (p > .25).
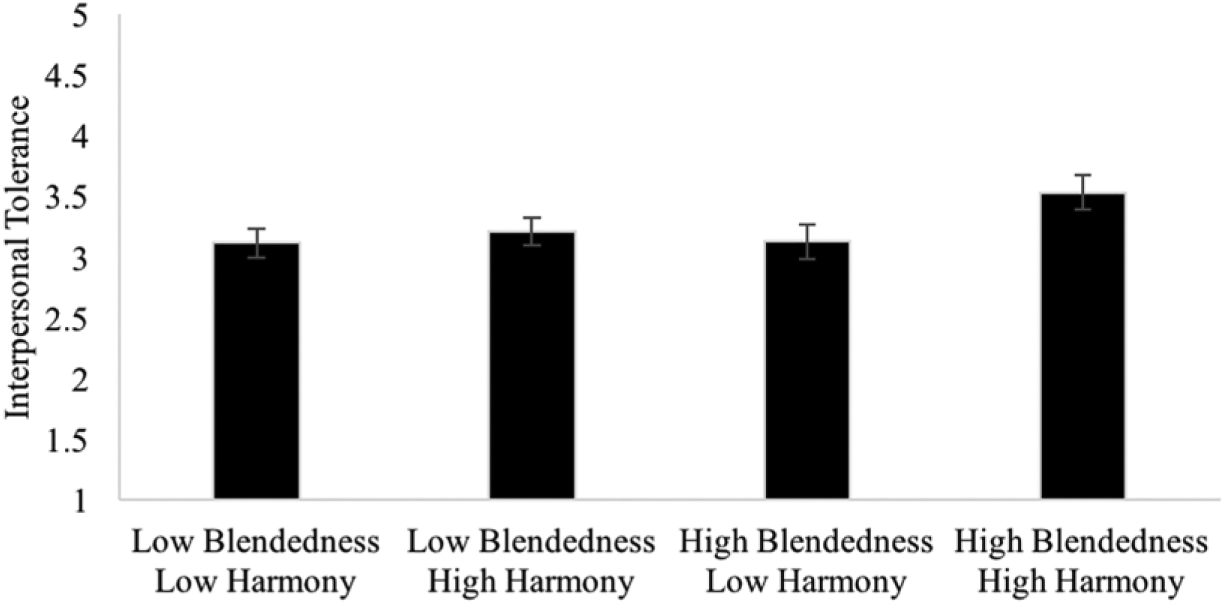
The linear effect of II on tolerance from Study 3.
Next, we conducted a one-way ANCOVA with II as the independent variable and tolerance as the dependent variable, while adding need for cognitive closure, BFI-10, self-reported GII blendedness, and self-reported GII harmony as covariates. Consistent with Studies 1 and 2, higher levels of self-reported GII blendedness was related to higher tolerance across all four conditions, F(1, 93) = 4.166, p = .044, = .043. The same effect was not evident for self-reported GII harmony. The main effect of condition remained marginally significant, F(3, 93) = 2.229, p = .090, = .067. The predicted linear relationship was significant, F(1, 93) = 4.616, p = .034, = .047.
Discussion
Study 3 provides evidence for a causal relationship between II and interpersonal tolerance, such that higher blendedness and higher harmony led to higher levels of tolerance. Our results suggest that blendedness and harmony have an additive effect on tolerance, such that high levels of both produced the highest level of tolerance, whereas being high on one or the other, but not both, produced an intermediate level of tolerance. As far as we know, this is the first study to simultaneously manipulate blendedness and harmony as separate variables. Our results also provide a novel method for manipulating II. Specifically, asking people to create self-maps of their social identities—with examples of overlapping circles representing blendedness and examples of positive relationships between the identities representing harmony—may alter people’s perceptions of compatibility between their own social identities.
Study 3 also raised some questions. Because both blendedness and harmony were manipulated, we were not able to test whether manipulating blendedness or harmony alone can increase tolerance. Furthermore, although Studies 1 and 2 found that blendedness was more strongly predictive of tolerance than harmony, we did not see a significant difference in tolerance between the mixed (i.e., high blendedness/low harmony and high harmony/low blendedness) conditions in Study 3. Future research is needed to examine and understand the stand-alone and interactive effects of blendedness and harmony on tolerance.
General Discussion
Interacting with others with different values and opinions can be a highly negative experience (Moscovici & Zavalloni, 1969; Tajfel, 1981; Tyler & Blader, 2003). For instance, such interactions are associated with experiences of rejection, discrimination, anxiety, and self-threat (Doerr, Plant, Kunstman, & Buck, 2011; Jasinskaja-Lahti, Mähönen, & Liebkind, 2011; Mendoza-Denton, Downey, Purdie, Davis, & Pietrzak, 2002). This creates a host of negative attitudes toward dissimilar others, including distrust, rejection, and avoidance (e.g., Crocker, Major, & Steele, 1998; Mähönen, Jasinskaja-Lahti, & Ketokivi, 2014; Schmitt & Branscombe, 2002; Shelton & Richeson, 2005; Tropp, 2003). To the extent that interpersonal tolerance facilitates positive inferences about dissimilar others, it can attenuate these negative experiences and attitudes.
In this article, we find that II (or perceived blendedness and harmony between one’s multiple social identities) is linked to interpersonal tolerance (or positive trait inferences of others whose opinions are different from one’s own). Studies 1 and 2 used two different national samples as well as different measures of II, though both studies found that perceptions of blendedness were positively related to tolerance. Study 3, an experiment, found that increasing perceptions of blendedness and harmony between one’s identities increased tolerance.
These findings dovetail nicely with previous research showing that II may be related to flexible thinking that enables more openness to and acceptance of alternative perspectives. Past studies have shown that those with higher II are better able to simultaneously activate discrepant knowledge sets and have more overlapping network connections across groups that endorse different cultural perspectives (Cheng et al., 2008; Mok et al., 2007). These findings are also consistent with previous findings that greater perceived overlap between identities leads to greater tolerance (Brewer & Pierce, 2005; Miller et al., 2009; Roccas & Amit, 2011; Roccas & Brewer, 2002; Schmid et al., 2009).
In addition, our findings extend previous research in several ways. By treating the II subcomponents of blendedness and harmony as separate variables, we could shed light on how blendedness and harmony impact psychological processes in different ways, as well as how each of these processes facilitate the other (Amiot et al., 2007). For example, Studies 1 and 2 found that blendedness is a stronger predictor of tolerance than harmony, though Study 3 found that blendedness and harmony have additive effects on tolerance. Together, these studies show that even though blendedness is more strongly related to tolerance, harmony can nevertheless boost tolerance when blendedness is already high. More broadly, our findings lend support to previous research showing that blendedness and harmony are distinct psychological processes that relate to different outcomes. For instance, research on the relationship between II and creativity has shown that blendedness, rather than harmony, predicts accessibility of multiple knowledge systems (Cheng et al., 2008). However, studies on II and ingroup favoritism found the opposite, showing that harmony predicts ingroup favoritism, but not blendedness (Cheng, Hanek, Odom, & Lee, 2015). It may be the case that blendedness (which focuses more on perceptions of overlap and categorization) is more predictive of cognitive or knowledge-related processes, while harmony (which focuses more on feelings of tension or lack thereof) is more predictive of affective outcomes.
Our data also have implications for the measurement of II. As mentioned, II scales often have reliabilities that are lower than ideal (Cheng et al., 2014). This is true in the present article, especially for our measure of blendedness in Study 1. This may be due to unique characteristics of the different samples used in II research. As mentioned, experiences in East–West cultural integration are very different between Chinese Singaporeans and Asian Americans, and they are likely to interpret items in the BII scales differently. For instance, take the item “I see myself as part of combined Chinese-Western culture.” In prior studies of Asian Americans, this item was included in the Blendedness subscale and correlated in meaningful ways with other items in the subscale. However, we found a different pattern in our Chinese Singaporean sample. This may be due to the highly multicultural nature in Singapore society, and Singaporeans have little choice but to live in a combined Chinese Western culture. Relatedly, combining cultural perspectives is a prescriptive norm that is publicly and explicitly endorsed in Singapore, and as such demand characteristics may affect participants’ responses to this item (Gopinathan, 2014). Similarly, GII examines II at a broad and non-identity-specific level, distinguishing it from other II scales that focus on specific identities such as culture, profession, or gender. In Study 2, we take this factor into consideration and adjusted our measures accordingly. In the same way, future researchers should pay particular attention to measuring II in ways that are appropriate for their sample.
In this article, we operationalized interpersonal tolerance as positive trait inferences people make of individuals holding an opinion different from their own. Interpersonal intolerance has similarities with intergroup intolerance (which focuses on tolerance for individuals from a different group), but these are distinct concepts. Intergroup intolerance is relevant when two groups with different values interact with one another, while interpersonal intolerance occurs when individuals with different opinions, values, or preferences interact with one another. We focus on interpersonal intolerance for several reasons. First, interpersonal intolerance is often more pervasive than intergroup intolerance. Groups with divergent values (e.g., a White supremacist group and a Black Lives Matter group) do not frequently have contact with one another, and thus the members of these groups rarely interact (Kobayashi, 2010). In contrast, individuals who differ on values and opinions that are not associated with membership in different groups are more likely to encounter each other, largely because there are no clear group boundaries separating these individuals.
Relatedly, studying interpersonal tolerance may be more globally applicable than studying intergroup tolerance because not all societies have the same prevalence of social divides along categories such as race and ideology (Kobayashi, 2010). In these contexts, it may be especially important to focus on everyday social interactions that allow for tolerance. Some argue that cultivating interpersonal tolerance—or a norm of accepting differences among people with whom you frequently interact—may actually lead to more long-term relationships with dissimilar others (Kobayashi, 2010). These long-term relationships can in turn cultivate greater intergroup tolerance.
Our study suggests several lines of future research. It will be valuable to test whether our findings extend beyond implicit measures of interpersonal tolerance (i.e., trait inferences) to other more explicit measures of interpersonal tolerance, such as the extent to which individuals proactively interact with, cooperate with, or give resources to others (e.g., Wright et al., 2008). Future research should also test how tolerance, in the form of positive trait inferences, may mediate the relationship between II and specific stereotyping processes (such as categorization vs. individuation, levels of processing, or self-regulation; Crisp & Turner, 2009).
Finally, our results have implications for effective management of a wide variety of situations that involve interpersonal tolerance, ranging from negotiations to international conflicts. Many interventions to reduce intolerance focus on structural changes in the context, such as introducing superordinate goals to create higher levels of interdependence between individuals (Argote & Kane, 2009). These structural interventions aside, our findings suggest that individual differences such as II may also play a role. Interestingly, our study shows that perceptions of blendedness in one domain—say between Singaporeans’ Chinese and Western cultural identities—may predict tolerance even when the context is not specifically related to culture (i.e., helping a friend or studying for an exam). As such, cultivating a greater sense of blendedness within individuals, whether between specific identities or all identities generally, can have far-reaching effects on tolerance in many different types of situations.
Footnotes
Appendix
Next, you will read a hypothetical scenario about the roles of student and friend. After reading the scenario, you will be asked questions regarding how you would respond to the scenario.
Imagine that you are a college student at a midsized undergraduate institution. You are approaching the end of the semester and you have your first final exam in a few days. This exam is very important because it will determine a substantial portion of your semester grades in these classes. You are planning to begin studying today after the review session.
However, you get a phone call from your best friend that she is very ill and needs someone to take her to the emergency room. Your friend’s parents are out of town and she does not have siblings in the area. Your friend has been to the emergency room before and you know that she could be in the hospital for a few days. You have to decide whether or not you are going take your friend to the hospital. Here is how you described the situation to a family member:
If I stay on campus, I can go to the review sessions for my psychology class. Unfortunately, I didn’t do as well as I could have done on the last few assignments for that class. At the review session, the professors will probably give study tips and strategies and go over some of the more difficult problems and topics that will be on the exams, and I could use the extra help.
However, I’m very close to my best friend, and I feel guilty that I wasn’t able to take her to the hospital last time. She has had bad luck with health lately and spent a lot of time trying to recover. She is also currently grieving the loss of her grandmother who died less than a year ago. I feel like I should be with her since she has been sick and grieving.
I don’t know if I should stay on campus or take her to the hospital. I am very close to my friend and want to be there for her. However, my exam grades this semester are really crucial because I am trying to show an upward trend in my grade point average as the semesters go on. I want to apply to graduate schools and research positions in the fall, and my GPA is extremely important. I’m feeling stressed and confused, and I have to decide what to do.
Acknowledgements
The authors are grateful to Radhika Santhanagopalan, Xiuyi He, Aubrey Ritz, Christie Chan, and Edith Jiang for research assistance. They also thank the reviewers and editors for helpful comments on previous versions of this article.
Declaration of Conflicting Interests
The author(s) declared no potential conflicts of interest with respect to the research, authorship, and/or publication of this article.
Funding
The author(s) disclosed receipt of the following financial support for the research, authorship, and/or publication of this article: This research is supported by The East Asia and Pacific Summer Institutes of the National Science Foundation, The National Research Foundation of Singapore, and faculty resources.