
Abstract
Biculturalism has typically been used as a framework to understand the experiences of people who move to new societies or who have multiple ethnic identities; we argue that first-generation college (FGC) students can also be thought of as bicultural as a function of social class. FGC students undergo adjustment to the middle-class culture of universities and face challenges negotiating different cultural identities. The present research demonstrated that FGC students are more likely to identify as bicultural and experience dissonance between home and school (Study 1), that integrated social class identities are linked to positive outcomes for FGC students during (Study 2) and after college (Study 3), and that these effects are due in part to reduced acculturative stress (Study 4). These findings suggest that integrating different class identities may be key to the success of FGC students.
College life is lived in a middle-class space with middle-class rules. People from the working-class must change themselves—or, at least, important parts of themselves—to fit.
Today, more first-generation college (FGC) students are enrolling in college than ever before; in fact, one out of every six students at 4-year colleges is a first-generation student (Housel & Harvey, 2009; Saenz, Hurtado, Barrera, Wolf, & Yeung, 2007). However, FGC students report more difficulty adjusting to college (Phinney & Haas, 2003; Rubin, 2012), perform more poorly (Pascarella, Pierson, Wolniak, & Terenzini, 2004), and are less likely to graduate compared with continuing-generation college (CGC) students (Bowen, Chingos, & McPherson, 2009; Hernandez, 2012). Given the importance of a college degree for upward mobility (Dewan, 2014), it is crucial to understand the factors that affect academic performance and persistence for FGC students.
We propose that beyond disadvantages in resources and academic preparation, FGC students face the challenge of acculturating to college settings, which embody middle-class norms (Fryberg & Markus, 2007; Stephens, Fryberg, Markus, Johnson, & Covarrubias, 2012; Stephens, Townsend, Markus, & Phillips, 2012). For FGC students, going to college may, in many ways, feel like moving to a foreign country. If this is the case, then developing an integrated social class bicultural identity—that is, viewing one’s working-class (i.e., home) and middle-class (i.e., college) cultural identities as harmonious—should ease acculturation for FGC students and improve academic, emotional, and health outcomes. The goal of the present research is to investigate whether integrated social class identities improve outcomes for FGC students.
Social Class as Culture
Past research has defined social class in both objective and subjective terms; objective indicators of social class include income (personal or household income; Howell & Howell, 2008; Kraus, Piff, & Keltner, 2009; Lareau & Conley, 2008; Norton & Ariely, 2011; Oakes & Rossi, 2003), educational attainment (individual or parental; Day & Newburger, 2002; Domhoff, 1998; Pascarella & Terenzini, 1980; Snibbe & Markus, 2005), and occupation (Kohn & Schoenbach, 1983; Kohn & Schooler, 1983). Subjective indicators of social class consist of perceptions of where one stands in the social hierarchy relative to others (e.g., Adler, Epel, Castellazzo, & Ickovics, 2000; Boyce, Brown, & Moore, 2010; Goodman et al., 2001; Kraus & Stephens, 2012) and have been shown to be distinct from objective indicators of social class (Kraus, Tan, & Tannenbaum, 2013; Stephens & Townsend, 2013).
In the present research, we utilize an objective measure of social class, college generation status (CGS; that is, whether at least one parent has attained a bachelor’s degree), as it likely has the most bearing on how a student experiences college. CGS is strongly correlated with objective and subjective indicators of socioeconomic status (SES) and income; FGC students are more likely to come from low SES contexts and to rank themselves lower in the social class hierarchy (Singh-Manoux, Adler, & Marmot, 2003). To understand the experiences of FGC students in middle-class contexts such as colleges and universities, it is essential to understand the ways that social class backgrounds influence differences in psychological processes.
Effects of Social Class on Psychological Processes
A growing body of research suggests that social class affects a broad range of psychological tendencies (Grossmann & Varnum, 2011; Markus & Kitayama, 1991; Na et al., 2010; Stephens & Townsend, 2013; Varnum, Grossmann, Kitayama, & Nisbett, 2010), all of which may affect experiences for FGC students transitioning between social class cultures. Specifically, people from working-class backgrounds tend to have more interdependent self-construals (Grossmann & Varnum, 2011; Na et al., 2010); less emphasis on personal choice and uniqueness (W. Johnson & Krueger, 2005; Lachman & Weaver, 1998; Reay, Davies, David, & Ball, 2001; Snibbe & Markus, 2005; Stephens, Hamedani, Markus, Bergsieker, & Eloul, 2009; Stephens, Markus, & Townsend, 2007); more holistic styles of thinking (Grossmann & Varnum, 2011; Kraus, Côté, & Keltner, 2010; Kraus et al., 2009; Na et al., 2010; Varnum, Na, Murata, & Kitayama, 2012); increased subjective, physiological, and neural responses to others’ distress (Kraus et al., 2010; Stellar, Manzo, Kraus, & Keltner, 2012; Varnum, Blais, Hampton, & Brewer, 2015); and a greater likelihood of attending to other human beings in complex environments (Dietze & Knowles, 2016). Taken together, these findings suggest that there are pronounced differences between working-class and middle-class cultures. These systematic differences across a wide variety of psychological tendencies are reminiscent of (and in some cases parallel to) those found between countries. As such, it is reasonable to conceptualize working-class and middle-class contexts as different cultures.
Given that different social class contexts have divergent sets of values, norms, and practices, individuals moving from one social class setting to another (e.g., FGC students) face similar dilemmas to those moving between other types of cultural contexts. Middle-class norms are predominant at American colleges (Fryberg & Markus, 2007; Greenfield, 1994; H. S. Kim, 2002; Y. K. Kim & Sax, 2009; Markus & Conner, 2013; Stephens, Markus, & Phillips, 2014) and may be unfamiliar to incoming FGC students. FGC students’ sense of alienation in these settings is well documented (e.g., R. M. Cohen, 1998; Dews & Law, 1995; hooks, 2000; Jensen, 2004; Levine & Nidiffer, 1996; Lubrano, 2004; Nelson, Englar-Carlson, Tierney, & Hau, 2006; Ostrove & Long, 2007; Roberts & Rosenwald, 2001; Rubin, 2012; Stewart & Ostrove, 1993; Tokarczyk, 2004; Tokarczyk & Fay, 1993). Indeed, research in higher education has described the challenges faced by FGC students as trying to live in two different countries or worlds (Rendon, 1992). Furthermore, researchers have described the transition to college as entry into an “alien culture” with unfamiliar values, speech, and ways of behaving (Bartholomae, 1985; Chaffe, 1992; Orbe, 2004; Rose, 1989; Terenzini et al., 1994).
Biculturalism and Bicultural Identity Integration (BII)
FGC students come from a cultural context whose values, norms, and behaviors differ from the college context; thus, in addition to struggling with differences related to lower preparation, cultural mismatch, and lack of cultural capital, FGC students must also integrate their working-class (e.g., home) and middle-class (e.g., college) identities. In other words, they face the challenge of becoming successful biculturals. Biculturalism is broadly defined as the experience of having been exposed to and internalized two or more cultures (Nguyen & Benet-Martínez, 2007). Research with ethnic biculturals suggests that acculturation strategies (i.e., integration, assimilation, separation, marginalization) are determined by attitudes toward one’s host and heritage culture (Berry, 1990; Berry & Sam, 1997). Among these, integration is the most commonly used strategy, followed by separation, assimilation, and marginalization (Berry, Phinney, Sam, & Vedder, 2006). Individuals who integrate have the least acculturative stress (Hong, Morris, Chiu, & Benet-Martínez, 2000), because they feel comfortable in, and can easily navigate, both their home and host cultural contexts. However, this framework does not capture the complexity of the bicultural experience, in part because it ignores the subjective experience of combining two identities; for example, someone can integrate or assimilate because it is the most advantageous to them, but experience guilt about leaving their home culture behind or compromising certain values to fit in with the host culture.
Bicultural Identity Integration
In an effort to establish a more comprehensive view of the bicultural experience, Benet-Martínez and colleagues proposed a theory of BII. The BII framework examines the extent to which bicultural individuals perceive their cultural identities as congruent. Those who perceive their identities as harmonious and compatible have high BII, while those who perceive their identities as incompatible or contradictory have low BII (Haritatos & Benet-Martínez, 2002; Huynh, 2009). Whereas other theories on biculturalism attend to differences in identification with one’s home and host culture, the BII framework importantly focuses on the feelings associated with the relationship between home and host cultures, which may better predict outcomes for biculturals (Benet-Martínez, Leu, Lee, & Morris, 2002; Huynh, Nguyen, & Benet-Martínez, 2011; Nguyen & Benet-Martínez, 2007). Interestingly, both low and high BII biculturals tend to employ Berry’s integration strategy of acculturation; however, they differ in the ease of integrating those identities (Benet-Martínez & Haritatos, 2005; Benet-Martínez, Lee, & Leu, 2006; Benet-Martínez et al., 2002). The development of BII depends on external factors, including the immediate environment, as well as the broader historical context of individuals’ home and host cultures, such as the extent to which individuals from a particular background are welcomed in the host culture (Cheng, Lee, Benet-Martínez, & Huynh, 2014; Huynh et al., 2011).
Past research on ethnic biculturals demonstrates that integrated identities are linked to better adjustment, including higher self-esteem, satisfaction with life, and happiness, and lower depression, anxiety, and loneliness, and these associations hold after controlling for trait neuroticism (Chen, Benet-Martínez, & Bond, 2008). Individuals with more integrated identities tend to have more diverse social networks, with more friends from the host culture, and more connections between friends in their home and host cultures (Mok, Morris, Benet-Martínez, & Karakitapoglu-Aygun, 2007). Among international students, research demonstrates that BII is associated with improved satisfaction with life (Huynh, 2009) and academic outcomes, such that individuals who have integrated identities have better sociocultural adjustment (e.g., academic achievement, career success, and social skills; Nguyen & Benet-Martínez, 2013).
Social Class Bicultural Identity Integration
Although a wide variety of theories exist regarding which factors predict outcomes for FGC students, few of them incorporate the cultural transition to the university as a predictor. Given that different social class contexts have divergent values, norms, and practices, individuals moving between social class settings (e.g., FGC students) face similar dilemmas to those moving between other types of cultural contexts. Thus, different ways of relating to working- and middle-class identities should predict outcomes for social class biculturals, as they do for ethnic biculturals. We propose that FGC students who perceive their working- and middle-class identities as harmonious and compatible should experience improved health, well-being, and academic performance, compared with those who perceive their identities as incompatible.
In four studies, we examined whether integrated social class culture identities reduce the acculturative stress that FGC students experience, thereby leading to improved academic outcomes, health, and well-being. Study 1 examined a foundational assumption of social class BII: whether FGC and CGC students identify as social class bicultural and whether they experience dissonance in values between home and school contexts. Study 2 provided an initial test of whether social class BII relates to academic performance and satisfaction with life among FGC students. Study 3 assessed whether the positive effects of integrated social class identities generalize to life and work satisfaction among FGC graduates. Finally, in Study 4, we tested whether the effect of integrated social class identities on well-being, health, and academic performance was mediated by reduced acculturative stress.
Study 1
Past research on ethnic biculturalism has primarily studied individuals who self-identify as bicultural. Study 1 sought to investigate a key theoretical foundation of social class BII: that FGC students identify as social class bicultural and experience normative differences and dissonance between home and school cultures. We predicted that FGC students would be more likely to identify as social class bicultural, identify with working-class culture, and experience differences in norms and greater dissonance between home and school contexts, compared with CGC students. However, FGC students may not differ in their identification with working-class and middle-class cultures; as such, we may observe little difference between FGC and CGC students in identification with middle-class culture.
Method
Participants
Participants included 2,116 students (1,097 male; M age = 19.3, SD = 2.87) from an introductory psychology course. FGC students were defined as students for whom neither parent had attained a bachelor’s degree (35.44% FGC). The sample was 58% European American, 13.9% Latinx, 18.3% Asian/Asian American, 4.2% African/African American, 2.2% Middle Eastern/Arab-American, 1% Native American, 2.5% Multiracial/Other, and 0.1% missing. Participation took place at the outset of the semester as part of the prescreening battery.
Materials and procedure
Home–school dissonance
To assess dissonance between one’s family and the university culture, participants completed an adapted four-item Home–School Dissonance Scale (Arunkumar, Midgley, & Urdan, 1999), where they indicated their agreement on a 5-point scale. Items included “I feel like my family understands what the college experience is about” (reverse coded), “I feel like the values of my family are compatible with the values at [university name]” (reverse coded), “The culture of [university name] is different from the culture at home,” and “I have a hard time integrating my family culture and life with my culture and life at [university name]” (α = .65).
Perceived normative differences
Participants answered one item assessing perceived differences in norms and values between home and school contexts from 1 (strongly disagree) to 6 (strongly agree). The item was “The environment I grew up in has different norms and values than the university environment.”
Social class biculturalism
In addition, participants indicated their social class biculturalism by responding to the item “If people from different countries are considered bicultural, do you think of yourself as being ‘social class bicultural’?” from 1 (strongly disagree) to 6 (strongly agree).
Identification with working- and middle-class cultures
Participants completed two separate items to indicate their identification with American working- and middle-class cultures from 1 (very weakly) to 6 (very strongly). The first item was “How much do you identify with American working-class culture?” The second item was “How much do you identify with American middle-class culture?”
Demographics
Participants indicated parental education (e.g., mother and father education) from 1 (less than high school) to 6 (graduate or professional degree). First-generation participants were those for whom neither parent had attained a bachelor’s degree. Finally, participants indicated social class from 1 (working-class) to 5 (upper-class) and family income from 1 (less than US$11,000) to 9 (US$250,000 or above), and completed the MacArthur Scale of subjective SES (Adler et al., 2000), where they were given a drawing of a ladder representing people with different levels of money, education, and jobs in the United States, and chose where on the ladder they would stand, from 1 (lowest) to 10 (highest).
Results
Power analysis using G*Power (Faul, Erdfelder, Buchner, & Lang, 2009) indicated a greater than 99% chance of detecting a small (d = .2), medium (d = .5), or large effect size (d = .8) between the two groups as significant at the 5% level (one-tailed; R. M. Cohen, 1998). An independent-samples t test revealed differences by CGS on Home–School Dissonance, t(2101) = 7.98, p < .001, d = .35, 95% confidence interval (CI) = [–.42, –.29]; FGC students had significantly higher levels of dissonance (M = 3.42, SD = 0.85) than CGC students (M = 3.12, SD = 0.97). To examine whether these effects persist independent of ethnicity and gender, which may also affect Home–School Dissonance, an ANCOVA was used to examine differences in Home–School Dissonance by CGS, controlling for ethnicity and gender. The significant difference in Home–School Dissonance for FGC and CGC students persisted, F(1, 2084) = 57.33, p < .001,
Independent-samples t tests revealed significant differences by CGS in perceived normative differences between home and school contexts, assessed using the item “The environment I grew up in has different norms and values than the university environment,” t(2101) = 2.65, p = .008, d = .12, 95% CI = [.049, .329]; FGC students had higher agreement (M = 4.98, SD = 1.54) compared with CGC students (M = 4.79, SD = 1.57). In addition, an ANCOVA was used to examine differences in perceived normative differences by CGS, controlling for ethnicity and gender. There was a significant difference in perceived normative differences for FGC and CGC students after controlling for ethnicity and gender, F(1, 2084) = 7.15, p = .008,
There was also a significant difference in social class biculturalism by CGS, t(2100) = 3.42, p = .001, d = .15, 95% CI = [.097, .357]. FGC students were more likely to identify as social class bicultural (M = 4.36, SD = 1.44) than CGC students (M = 4.13, SD = 1.46; see Figure 1). Because we may observe differences in self-identified biculturalism by demographic variables such as ethnicity and gender, an ANCOVA was used to examine differences in social class biculturalism by CGS, controlling for ethnicity and gender. There was a significant difference in social class biculturalism for FGC and CGC students after controlling for ethnicity and gender, F(1, 2083) = 8.49, p = .004,
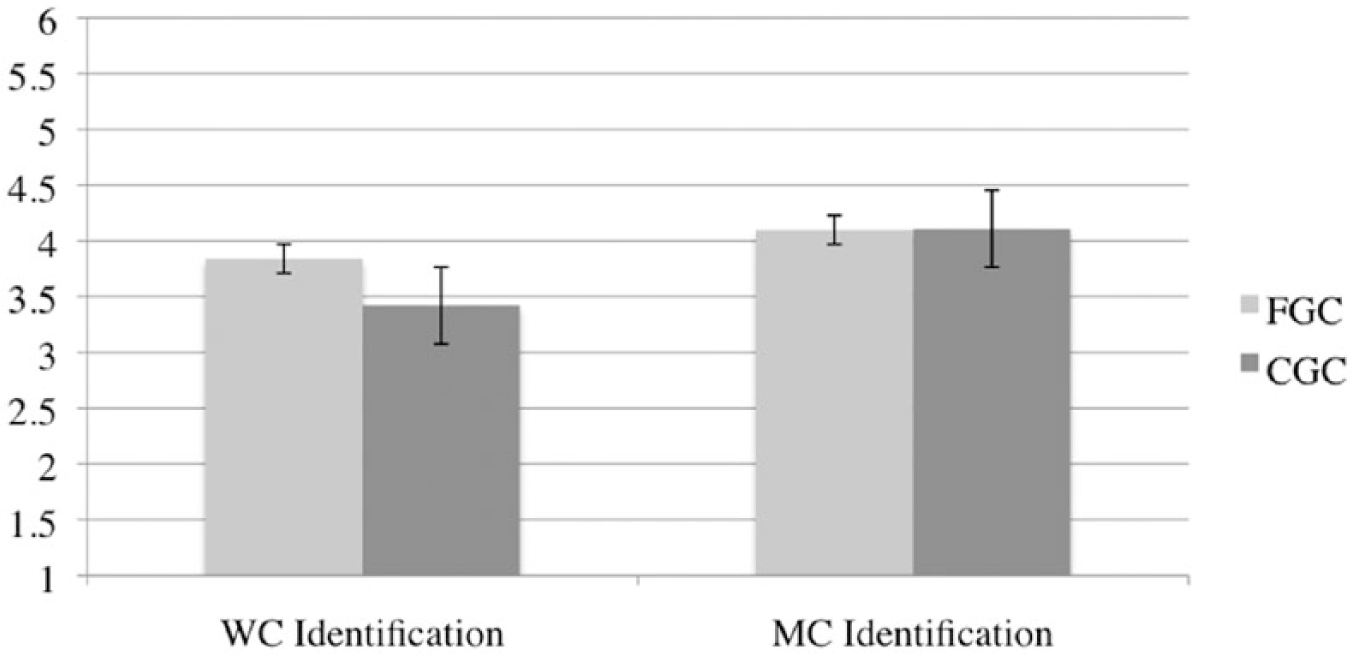
Working- and middle-class identification by college generation status.
First-generation students also had significantly higher identification with working-class culture, t(2097) = 7.83, p < .001, d = .34, 95% CI = [.316, .528] (M = 3.84, SD = 1.16) compared with CGC students (M = 3.42, SD = 1.19). Because identification with the American working-class may vary by ethnicity and gender, an ANCOVA was used to examine differences in working-class identification by CGS, controlling for ethnicity and gender. There remained a significant difference in working-class identification for FGC and CGC students, F(1, 2080) = 60.70, p < .001,
There was no difference in identification with middle-class culture, t(2095) = .39, p = .69. Specifically, FGC students had similar identification with middle-class culture (M = 4.10, SD = 1.06) compared with CGC students (M = 4.11, SD = 1.06). An ANCOVA was used to examine differences in middle-class identification by CGS, controlling for ethnicity and gender, which may be related to middle-class identification. There was no significant difference in middle-class identification for FGC and CGC students after controlling for ethnicity and gender, F(1, 2078) = 0.04, p = .84. In addition, a separate ANCOVA was conducted to examine an interaction of CGS and ethnicity (European American vs. non-European American) on middle-class identification. There was no interaction of ethnicity and CGS on middle-class identification, F(1, 2093) = 2.53, p = .11, suggesting that the European American and non-European American participants were similarly identified with middle-class culture.
Another question was whether FGC and CGC students would differ in their identification with working- and middle-class cultures. A repeated-measures ANOVA with working-class and middle-class identification as a within-subjects variable and CGS as a between-subjects variable was used to examine differences in working- and middle-class identification, and whether there was an interaction with CGS. There was a significant main effect of class identification, F(1, 2094) = 263.61, p < .001,
A second repeated-measures ANOVA examined differences in working-class and middle-class identification by CGS, with ethnicity and gender as covariates; after controlling for the demographic variables, the significant main effect of class identification remained, F(1, 2084) = 33.10, p < .001,
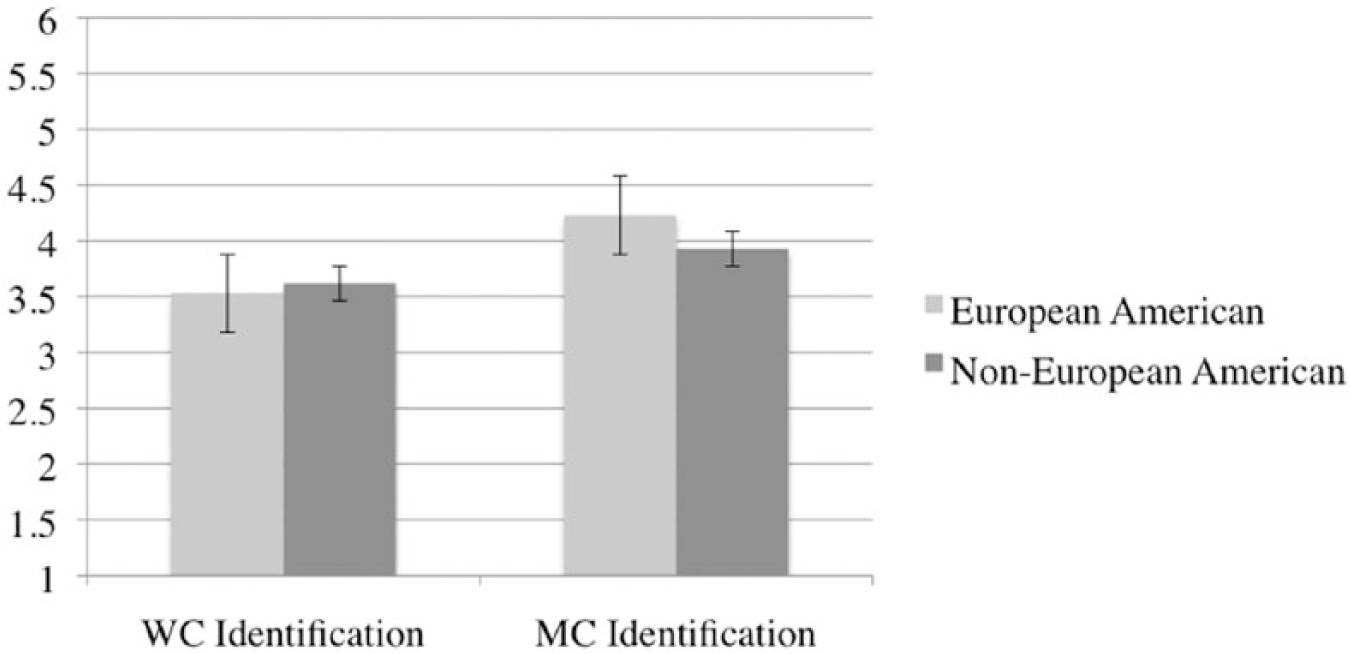
Working- and middle-class identification by ethnicity.
Discussion
Study 1 demonstrated that FGC students think of themselves as bicultural and that they perceive a disconnect between the values and culture of their home and the university. These effects remained significant after controlling for ethnicity and gender. While FGC students had significantly higher identification with working-class culture, compared with CGC students, both FGC and CGC students had similar identification with middle-class culture. This is consistent with the notion that FGC students are bicultural. However, this study does not address whether identity integration predicts key outcomes for FGC students.
Study 2
Study 1 demonstrated that FGC students are more likely to think of themselves as social class bicultural and to perceive greater dissonance between home and school contexts than CGC students. Study 2 aimed to extend these findings by examining the relationship between integrated social class identities (Social Class Bicultural Identity Integration [SES-BII]) and academic performance and satisfaction with life. Specifically, we adapted the Bicultural Identity Integration Scale (BIIS-2; Huynh, 2009) for social class and explored its relationship with academic performance and satisfaction with life for FGC students. We predicted that participants with more integrated social class identities would have higher academic performance and satisfaction with life compared with those with less integrated identities.
Method
Participants
At the outset of the semester, 362 FGC students (180 male; M age = 20.27, SD = 4.15) from an introductory psychology course participated as part of the prescreening battery online using Qualtrics survey software. 1 The sample was 48.6% European American, 25.4% Latinx, 13.5% Asian/Asian American, 6.9%African/African American, 1.7% Middle Eastern/Arab-American, 1.7% Native American, and 2.2% Multiracial/Other.
Materials and Procedure
Satisfaction with life
FGC students completed the five-item SWL scale (Diener, Emmons, Larsen, & Griffin, 1985), where they rated their agreement from 1 (strongly disagree) to 5 (strongly agree). Example items include “In most ways my life is close to my ideal” and “If I could live my life over, I would change almost nothing” (α = .86).
Social class BII
Participants completed an adapted 19-item Social Class BIIS-2 (Huynh, 2009), indicating their agreement on a 5-point scale from 1 (strongly disagree) to 5 (strongly agree). Example items include “I find it easy to harmonize working-class and middle-class cultures” and “I feel torn between working-class and middle-class cultures” (reverse coded). The full text of the scale is available in the appendix.
Finally, participants indicated their social class, family income, and subjective SES (Adler et al., 2000), and reported their high school (M = 3.47, SD = 0.49) and college grade point averages (i.e., GPA).
Results
Exploratory factor analysis and reliability analysis
Exploratory factor analysis was conducted using principal axis factoring extraction with a promax rotation to examine the factor structure of the 19 SES-BII items. A Kaiser–Meyer–Olkin (KMO) value of .85 demonstrates that the sampling is adequate. Bartlett’s test of sphericity had an approximate chi-square of 1463.77 (df = 171, p < .001). Two factors had eigenvalues greater than 1.00 and accounted for 46.56% of the cumulative variance explained. However, all 10 negatively worded items loaded on the first factor, and all the positively worded items loaded on the second factor (see Table 1). This suggests that the negative wording created an artifactual factor (Roszkowski & Soven, 2010; Schmitt & Stults, 1985; Spector, Van Katwyk, Brannick, & Chen, 1997). In other words, the positive and negative wording may have produced two factors where there is only one. Thus, we ran a principal axis factoring analysis testing for one factor.
Factorial Structure of the SES-BII.
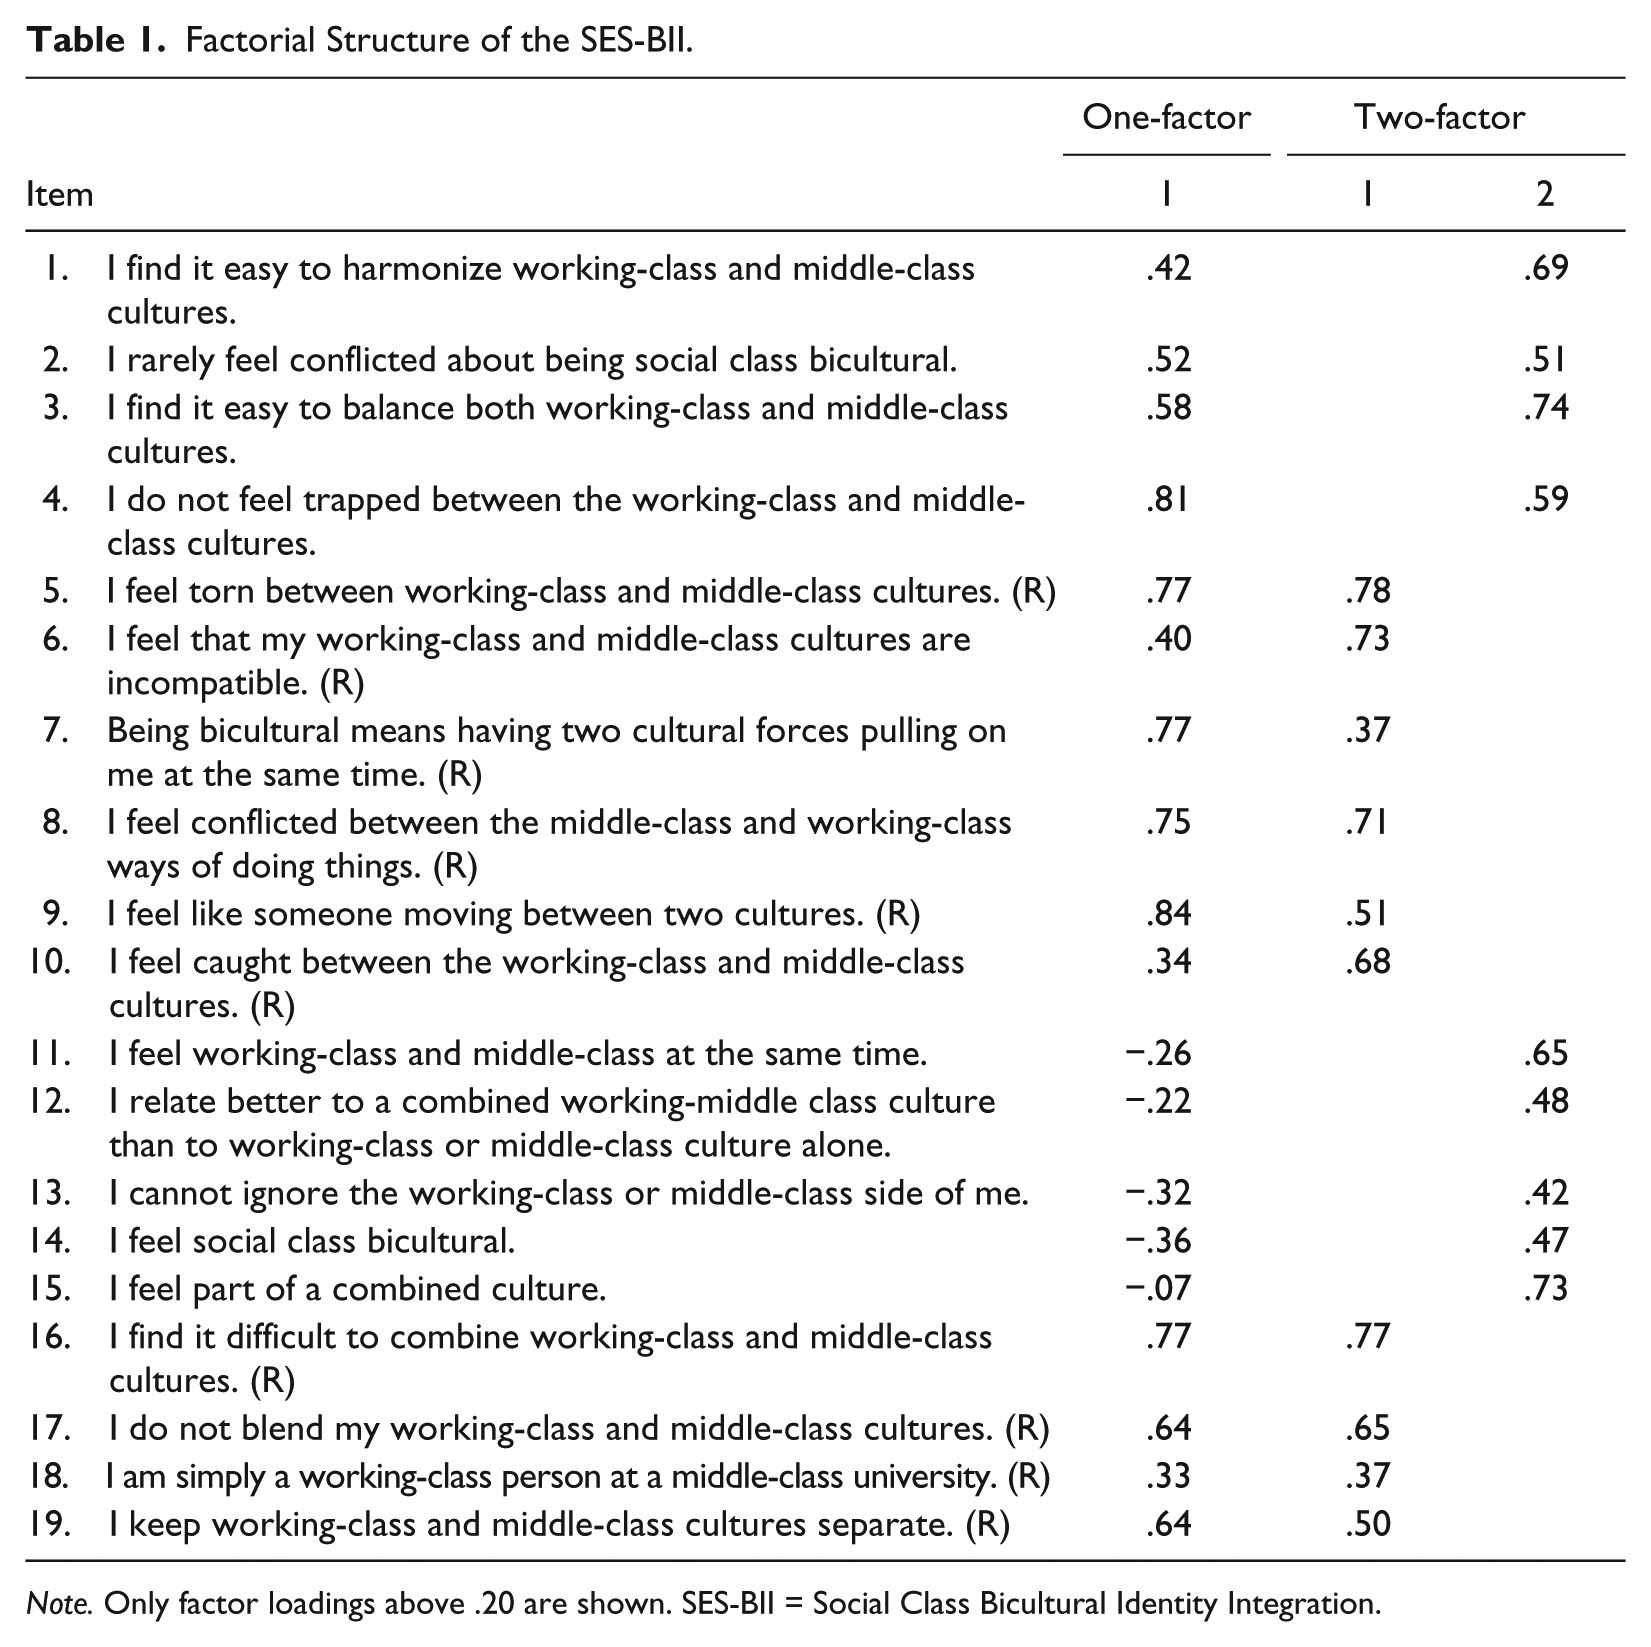
Note. Only factor loadings above .20 are shown. SES-BII = Social Class Bicultural Identity Integration.
The 19 items were again subjected to principal axis factoring. The first factor had an eigenvalue of 6.04, accounting for 31.76% of cumulative variance explained. 2 All items but one (“I feel part of a combined culture”) loaded onto the single factor (this factor was retained because scale reliability was sufficient). This suggests that, unlike the BIIS-2, for social class BII, the scale is unitary. The scale demonstrated high internal consistency reliability (α = .81).
Effect of SES-BII on SWL and GPA
Descriptive statistics and correlations are shown in Table 2. A series of regressions were used to test the relationship between identity integration, SWL, and self-reported GPA. In addition, we conducted a regression examining the relationship of identity integration on SWL, controlling for social class, family income, subjective SES, ethnicity, age, and gender. A second regression analysis probed the effect of identity integration on college GPA, controlling for demographic variables and high school GPA, to test whether the effects persisted beyond demographic variables (Table 3). For all regression models, tolerance levels ranged from .49 to .95 (i.e., variance inflation factor [VIF] ranged from 1.00 to 2.00), which indicate low multicollinearity.
Descriptive Statistics and Bivariate Correlations (Study 2).
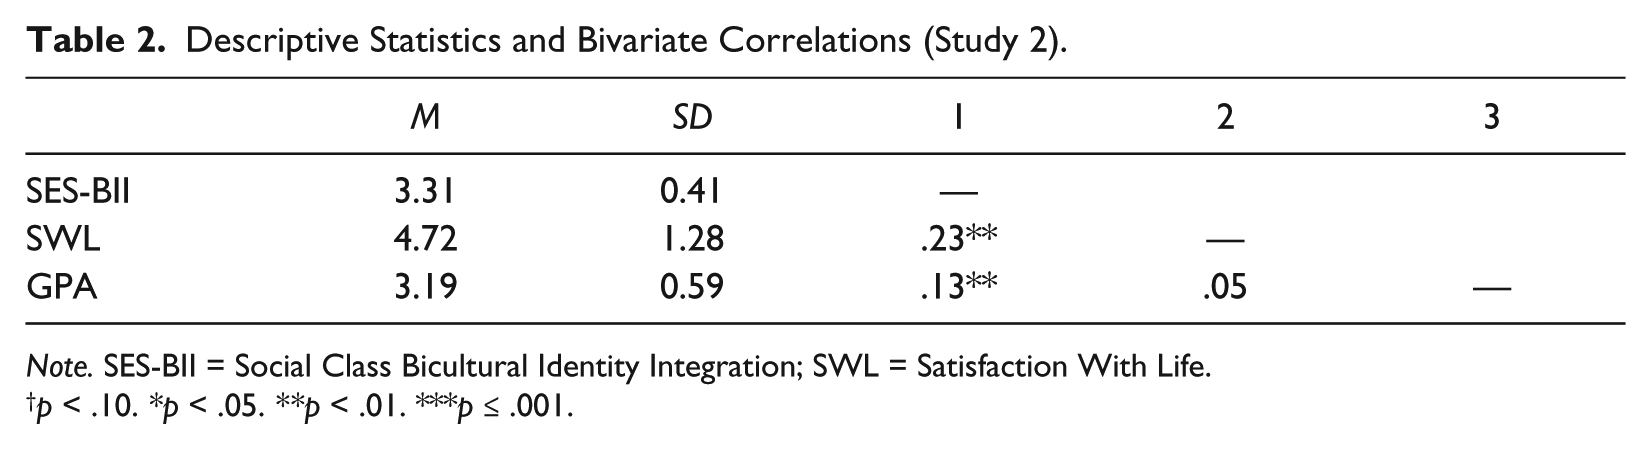
Note. SES-BII = Social Class Bicultural Identity Integration; SWL = Satisfaction With Life.
p < .10. *p < .05. **p < .01. ***p ≤ .001.
Regression Analyses Assessing Effects of SES-BII Including Analysis With Control Variables (Study 2).
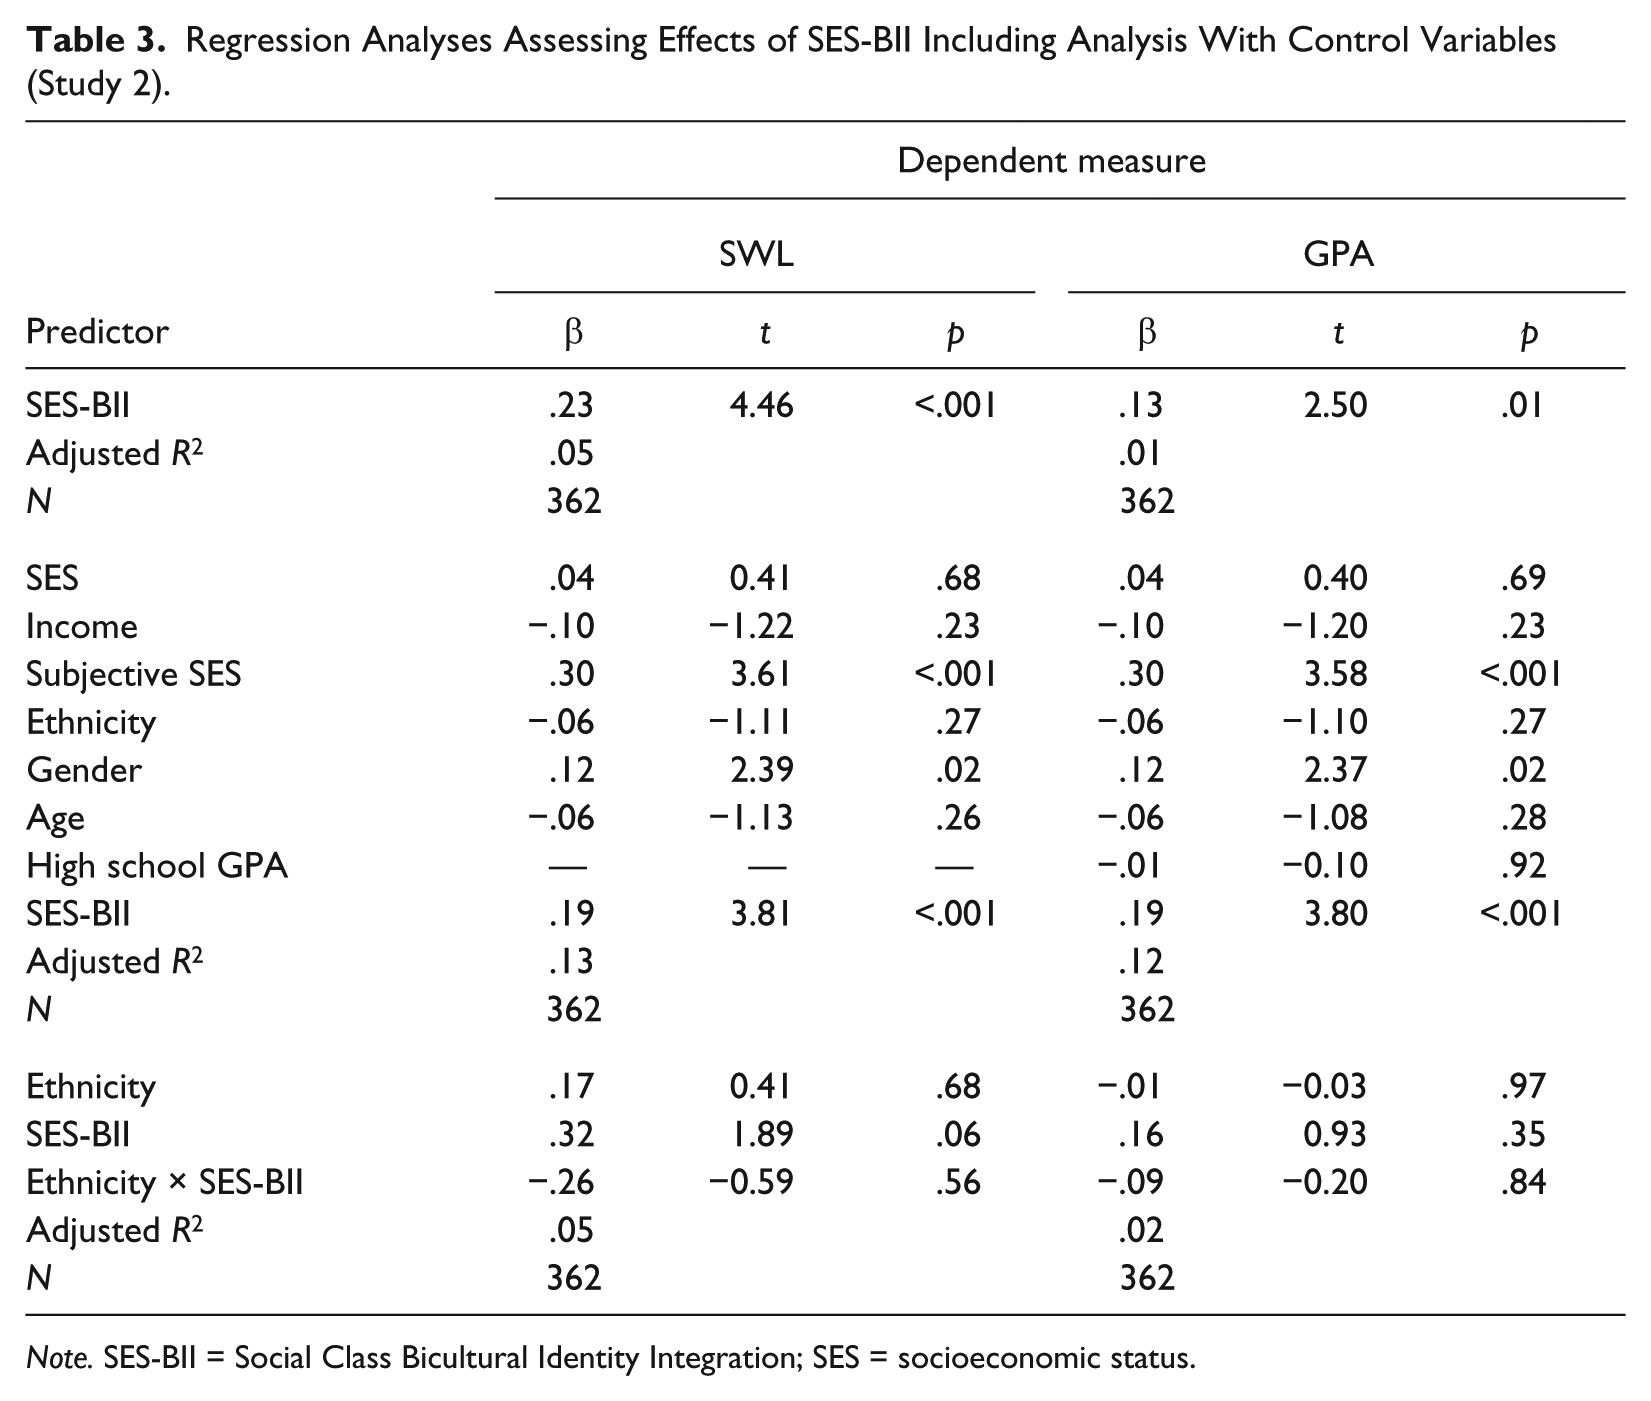
Note. SES-BII = Social Class Bicultural Identity Integration; SES = socioeconomic status.
Results were consistent with our hypotheses; identity integration significantly positively predicted SWL and self-reported college GPA, such that participants with higher identity integration had higher SWL and college GPA. After controlling for demographic and performance variables, the effect remained: SES-BII significantly positively predicted SWL and college GPA. In addition, a separate regression analysis examined a model including the main effects of SES-BII, ethnicity, and interactions of SES-BII and ethnicity on SWL and GPA. Interactions of SES-BII and ethnicity (i.e., European American vs. non-European American) were not significant (all ps > .05, see Table 3).
Discussion
Consistent with past research on BII, Study 2 revealed that identity integration was related to improved self-reported academic performance and higher SWL among FGC students. These effects remained significant when controlling simultaneously for a number of demographic factors and do not appear to be due to a confounding of class and ethnicity. Thus, Study 2 provides the first evidence that identity integration is linked to academic performance and well-being.
However, unlike past research (i.e., BIIS-2, Huynh, 2009), where items loaded onto two factors (i.e., harmony and blendedness), in the present research, the items did not load separately. This suggests that our scale does not appear to have harmony and blendedness as separate components. This may be because blendedness items have different connotations for ethnic biculturals than they do for social class biculturals. Specifically, unlike ethnicity, social class is malleable. Implicit in existing research on FGC students, and in the present research, is that the experience of attending college itself can transform one’s social class identity (Kraus & Stephens, 2012; K. A. Miller, Kohn, & Schooler, 1986; Newcomb, 1943). As such, unlike blendedness for ethnic biculturals, adapted items such as “I do not blend my working- and middle-class cultures” may relate more closely to harmony for FGC students.
Study 3
The results of Study 2 demonstrated that FGC students with integrated identities experience greater well-being and better academic performance compared with their counterparts with lower social class BII. Study 3 tested whether such effects might also be found after college among a sample of FGC graduates. We examined the relationship between identity integration, SWL, work engagement, and job satisfaction among FGC graduates. We predicted that FGC graduates with more integrated social class identities would have greater SWL, job satisfaction, and work engagement than participants with less integrated identities.
Method
Participants
Participants included 132 FGC graduates (i.e., those who graduated from college, but for whom neither parent had a bachelor’s degree) living in the United States, recruited through Amazon’s Mechanical Turk (MTurk) survey site (75 male). 3 Participants were invited to complete a survey on workplace fit and SWL. The survey, which was administered using Qualtrics survey software, took approximately 10 minutes, and participants were compensated US$1 for their participation. Participants’ mean annual income was US$62,682 (SD = US$62,564; Mdn = US$49,500). The sample was 74.2% European American, 11.4% Asian/Asian American, 3.8% Latinx, 3.8% African/African American, 0.8% Middle Eastern/Arab-American, and 6.1% Multiracial/Other.
Materials and procedure
Work engagement
Participants’ work engagement was assessed using the 17-item Utrecht Work and Well-Being Survey (UWES; Schaufeli & Bakker, 2003), indicating frequency from 1 (never) to 7 (always). An example item includes “At my work, I feel bursting with energy” (α = .96).
Job satisfaction
Participants completed the four-item Brief Index of Job Satisfaction (BIAJS; Thompson & Phua, 2012), where they rated their agreement on a 5-point scale from 1 (completely disagree) to 5 (completely agree) to items such as “I find real enjoyment in my job” (α = .78).
SWL
SWL was assessed using the five-item SWL scale (Diener et al., 1985; α = .91).
Social class BII
Finally, participants completed the 19-item SES-BII scale (α = .77). The scale was identical to the one used in Study 2 with one exception: one item was adjusted to read, “I am simply a working-class person at a middle-class job.”
Demographics
Participants indicated their gender, ethnicity, education, parental education, immigration status, childhood and current social class, childhood and current annual income, and childhood and current subjective SES (Adler et al., 2000).
Results
Descriptive statistics and correlations are shown in Table 4. A series of regressions tested the relationship between identity integration, work engagement, job satisfaction, and SWL. In addition, we conducted regressions examining the relationship between identity integration and work engagement, job satisfaction, and SWL, controlling for current income, social class, subjective SES, ethnicity, and gender (Table 5). For all regression models, tolerance levels ranged from .49 to .95 (i.e., VIF ranged from 1.00 to 2.00), which indicate low multicollinearity. Results were largely consistent with our hypotheses; identity integration was significantly positively related to work engagement and job satisfaction, and marginally related to SWL. Specifically, participants with higher identity integration had higher work engagement and job satisfaction. After controlling for demographic variables, identity integration was significantly positively related to work engagement and job satisfaction, but not significantly related to SWL. Interactions of SES-BII and ethnicity (i.e., European American vs. non-European American) were not significant (all ps > .05, see Table 5).
Descriptive Statistics and Bivariate Correlations (Study 3).
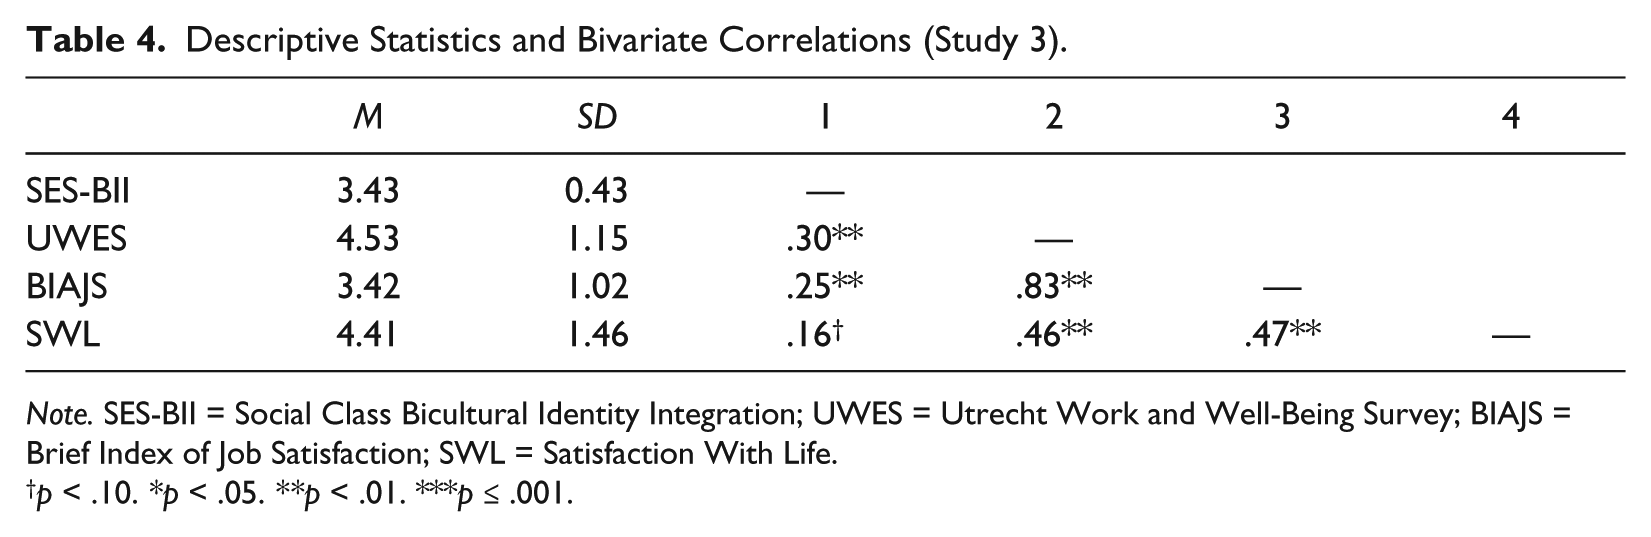
Note. SES-BII = Social Class Bicultural Identity Integration; UWES = Utrecht Work and Well-Being Survey; BIAJS = Brief Index of Job Satisfaction; SWL = Satisfaction With Life.
p < .10. *p < .05. **p < .01. ***p ≤ .001.
Regression Analyses Assessing Effects of SES-BII Including Analysis With Control Variables (Study 3).
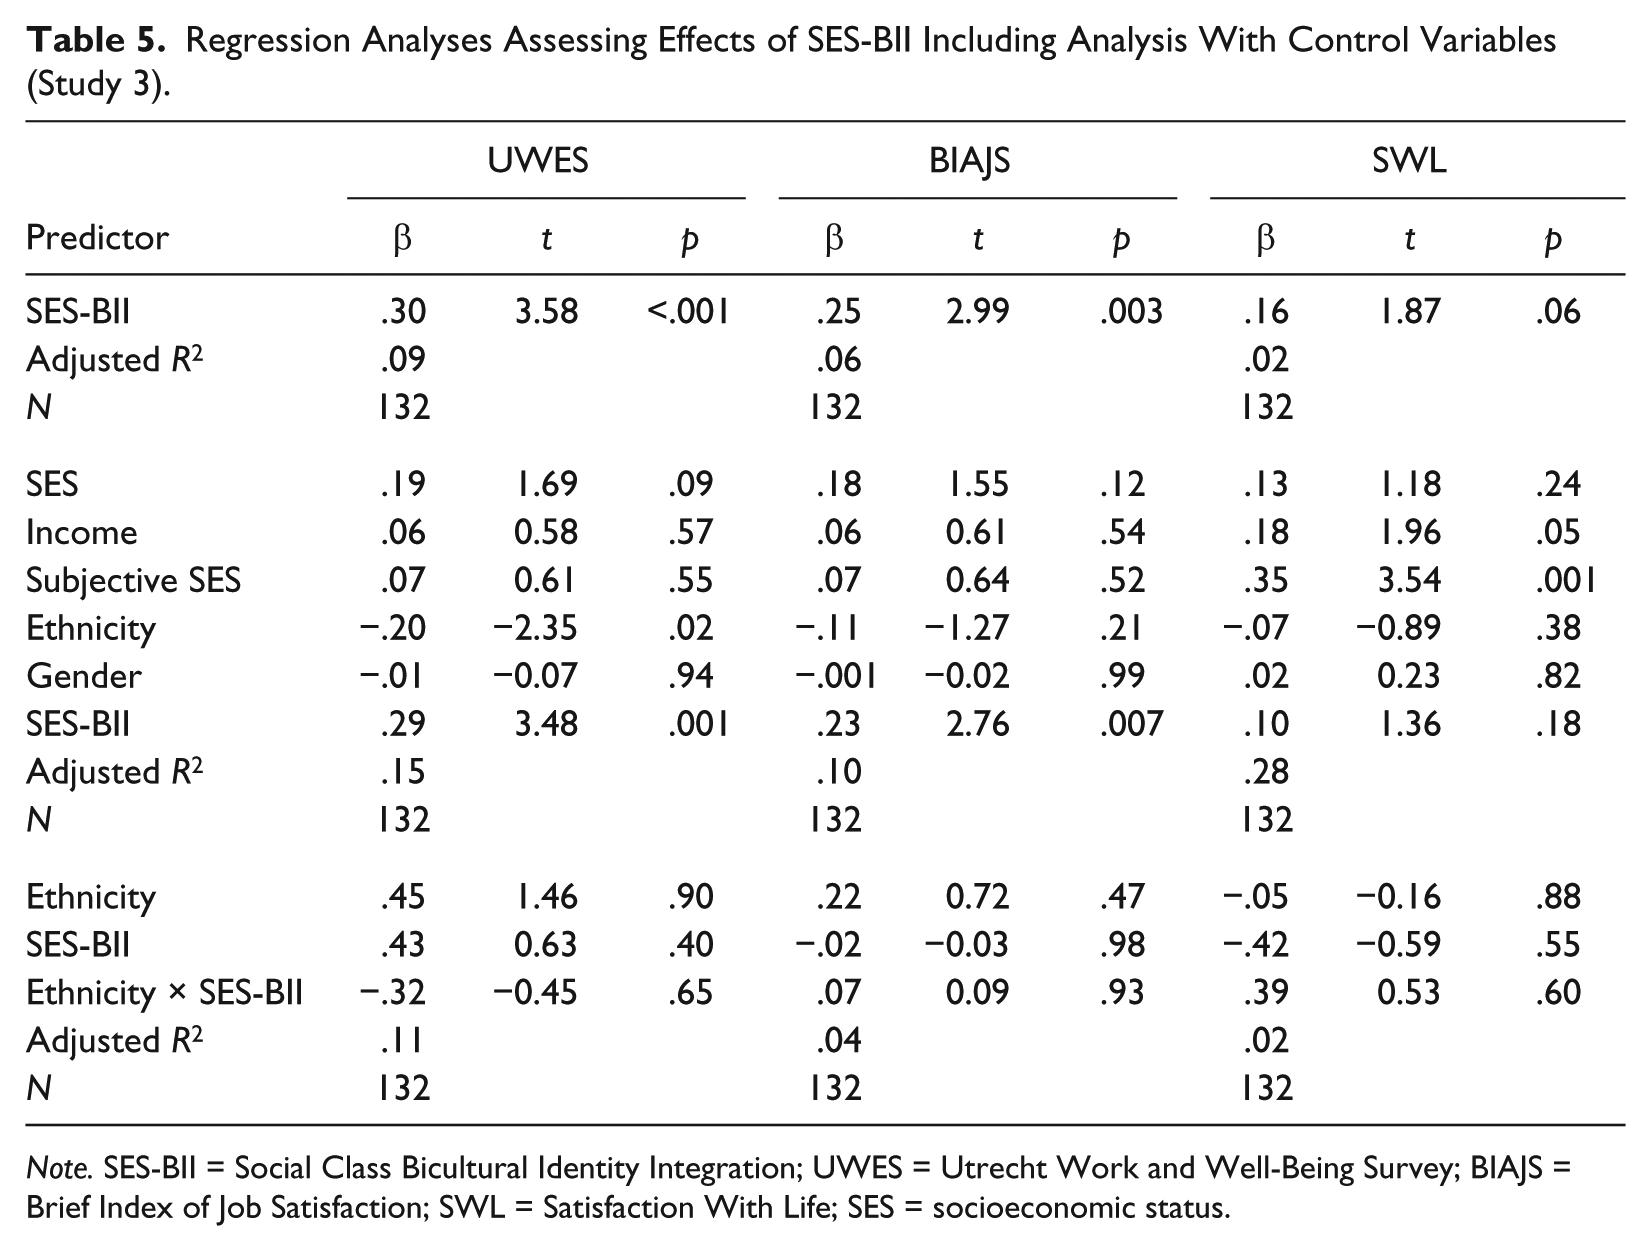
Note. SES-BII = Social Class Bicultural Identity Integration; UWES = Utrecht Work and Well-Being Survey; BIAJS = Brief Index of Job Satisfaction; SWL = Satisfaction With Life; SES = socioeconomic status.
Discussion
Study 3 demonstrated that identity integration was related to increased work engagement and satisfaction among FGC graduates. The relationship between identity integration, work engagement, and job satisfaction held after controlling for a variety of demographic variables. However, unlike Study 2, identity integration did not significantly predict SWL. It may be that among FGC graduates, as compared with FGC students, there are stronger predictors of SWL, such as subjective SES (i.e., social rank relative to one’s peers). The SWL variable also differs from work engagement and job satisfaction in that it assesses global well-being, rather than a domain-specific focus on work. This study extended the initial findings to a community sample of FGC graduates and suggests that integrated social class identities may have positive effects beyond college. However, it remains to be seen what variables underlie the relationship between identity integration and outcomes for FGC students. In Study 4, we tested acculturative stress as a potential mechanism of the relationships between identity integration and health, well-being, and performance among FGC students.
Study 4
Studies 2 and 3 demonstrated that identity integration is related to outcomes for FGC students and graduates. In Study 4, we investigated whether the relationships between identity integration and health, well-being, and objective academic performance were mediated by reduced acculturative stress. Past research demonstrates that increased BII is related to reduced acculturative stress (Benet-Martínez & Haritatos, 2005; Chen et al., 2008; Huynh, 2009). When individuals feel that their identities are harmonious and compatible, it reduces feelings of stress associated with acculturation to a new environment, thereby improving outcomes. Acculturative stress (Sandhu & Asrabadi, 1994) has been shown to mediate the effects of adjustment variables on outcomes related to health and well-being for ethnic biculturals (J. Kim, 2013; Yakunina, Weigold, Weigold, Hercegovac, & Elsayed, 2013; Zamboanga, Schwartz, Jarvis, & Van Tyne, 2009). The present study examined the relationship between identity integration, acculturative stress, depression, perceived stress, mental health, physical health, overall health, and objective measures of academic performance. We hypothesized that FGC students with integrated identities would have better well-being, health, and academic performance as a function of reduced acculturative stress; in other words, participants with integrated identities should have less acculturative stress, which should contribute to improved well-being, health, and academic performance. 4
Method
Participants
Participants included 249 FGC students (94 male; M age = 19.63, SD = 3.14) from an introductory psychology course. 5 The sample was 41.8% European American, 26.1% Latinx, 19.7% Asian/Asian American, 2.4% Middle Eastern/Arab-American, 1.2% African/African American, 0.8% Native American, and 8% Multiracial/Other. Participants completed the survey online using Qualtrics survey software.
Materials and procedure
SWL
Participants completed the five-item SWL scale (Diener et al., 1985; α = .87).
Depression
Next, participants completed the Center for Epidemiological Studies Depression scale (CES-D; Radloff, 1977), where they rated the frequency of 20 depressive symptoms (e.g., “I felt lonely”) in the past week from 1 (rarely or none of the time) to 4 (most or all of the time; α = .92).
Perceived stress
Perceived stress was assessed using the 10-item Perceived Stress Scale (PSS; S. Cohen, Kamarck, & Mermelstein, 1983). Participants rated the frequency of stressful experiences (e.g., “In the last month, how often have you felt that you were unable to control the important things in your life?”) from 0 (never) to 4 (always; α = .88).
Physical, mental, and overall health
Participants then completed the Short Form–12 Health Survey (SF-12; Ware, Kosinski, & Keller, 1996), which contains questions about global, physical, and mental health and was scored using standard scoring procedures (Ware, Kosinski, & Keller, 1994).
Acculturative stress
Participants then completed an adapted version of the Acculturative Stress Scale for International Students (ASSIS; Sandhu & Asrabadi, 1994; α = .95), indicating their agreement on 35 items from 1 (strongly disagree) to 5 (strongly agree), such as “Others don’t appreciate my values” and “I don’t like to talk to others about my life when I was growing up.”
Social class BII
Participants completed the adapted 19-item SES-BII scale (α = .77).
Demographics
Finally, participants reported their gender, ethnicity, parental education, family’s annual income, and subjective SES (Adler et al., 2000). At the end of the semester, with participants’ permission, official PSY 101 course grades, term GPA, and cumulative GPA were collected from the university’s Office of Institutional Analysis.
Results
Descriptive statistics and correlations are shown in Table 6. We conducted a series of regressions examining the relationship between identity integration, SWL, mental health, physical health, overall health, acculturative stress, depression, perceived stress, PSY 101 course grade, term GPA, and cumulative GPA. To determine whether the effects of identity integration made a unique contribution over the effects of other predictor variables, we conducted regressions examining the effect of identity integration on health and well-being variables, controlling for demographic variables including social class, family income, subjective SES, ethnicity, gender, and age. We conducted separate regressions examining the effect of identity integration on performance variables, controlling for demographic variables and high school GPA (Table 7). For all regression models, tolerance levels ranged from .49 to .95 (i.e., VIF ranged from 1.00 to 2.00), which indicate low multicollinearity.
Descriptive Statistics and Bivariate Correlations (Study 4).
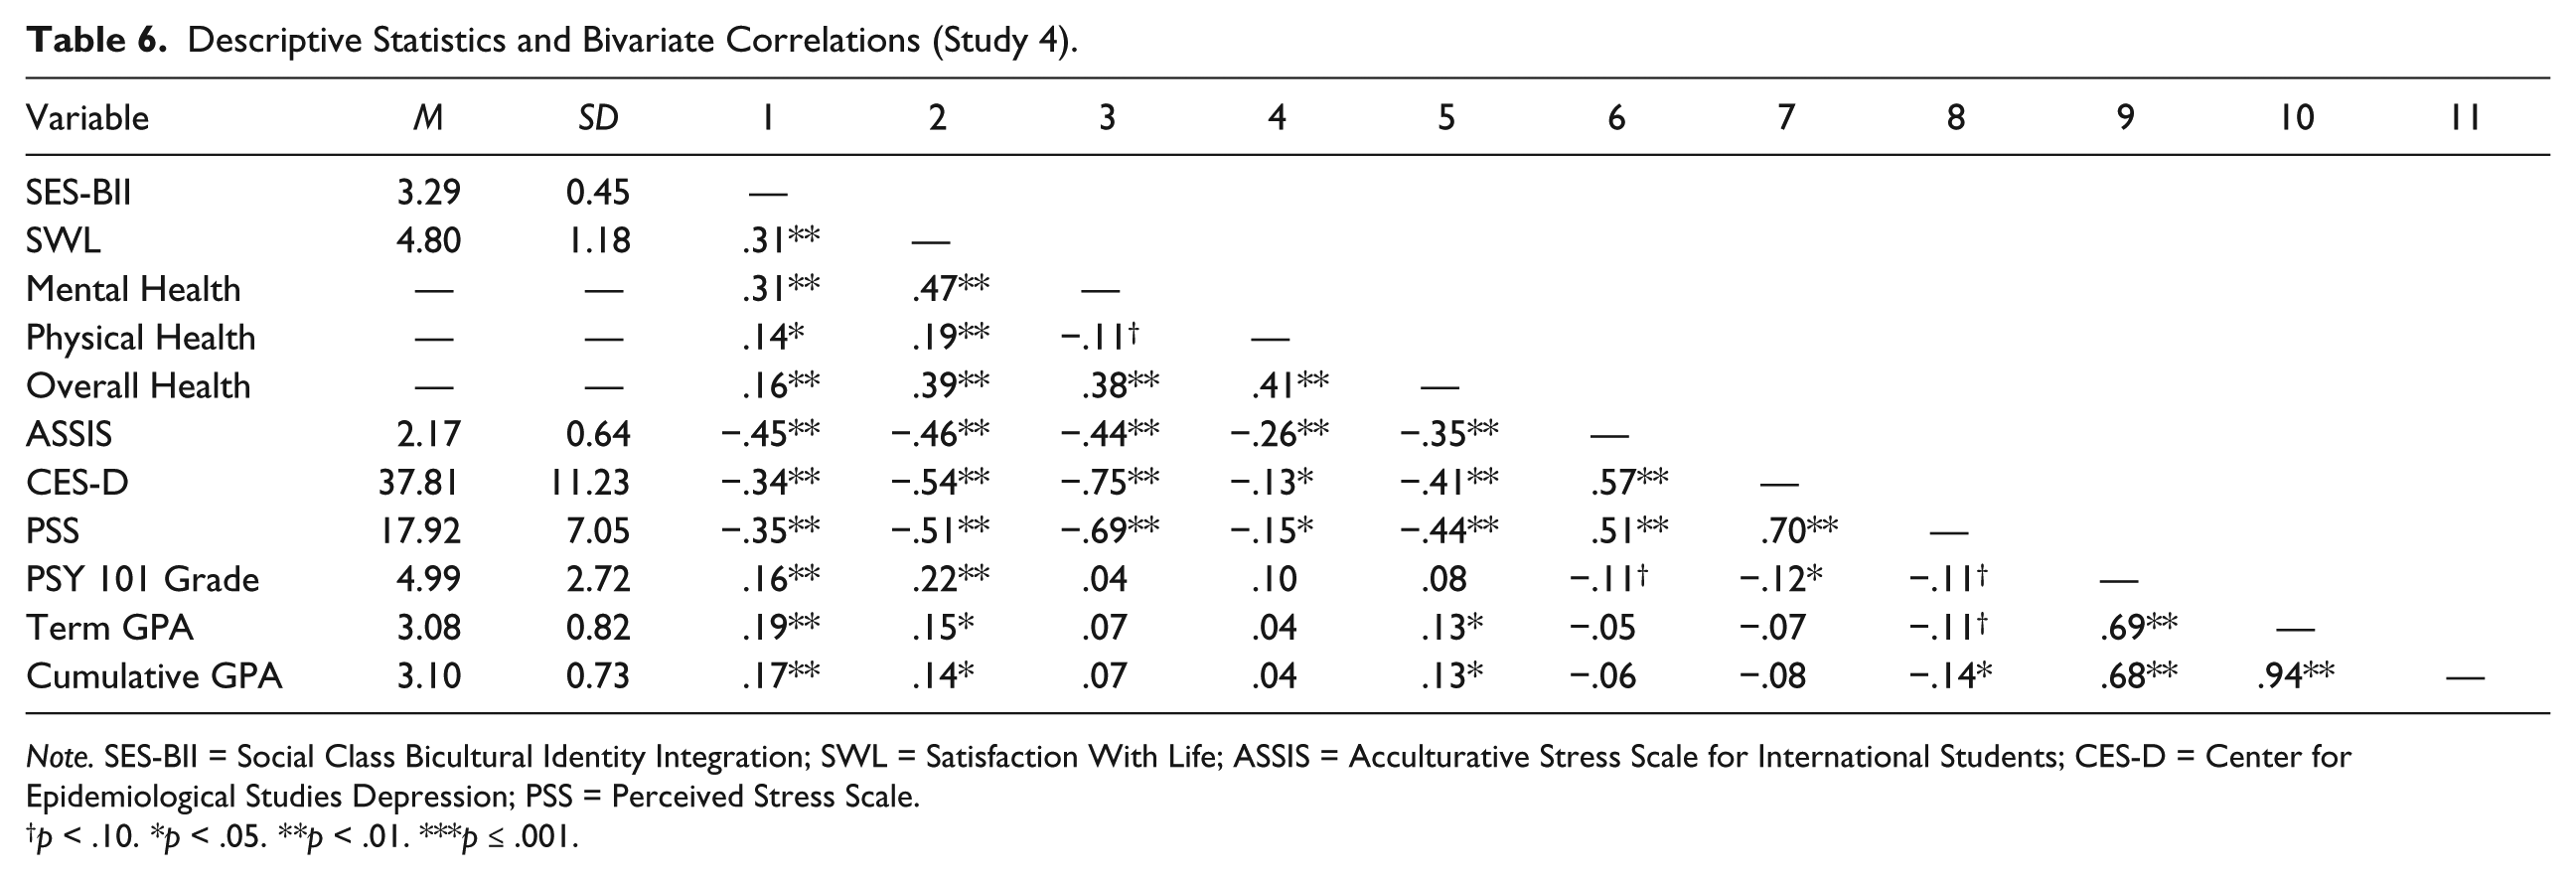
Note. SES-BII = Social Class Bicultural Identity Integration; SWL = Satisfaction With Life; ASSIS = Acculturative Stress Scale for International Students; CES-D = Center for Epidemiological Studies Depression; PSS = Perceived Stress Scale.
p < .10. *p < .05. **p < .01. ***p ≤ .001.
Regression Analyses Assessing Effects of SES-BII Including Analysis With Control Variables (Study 4).
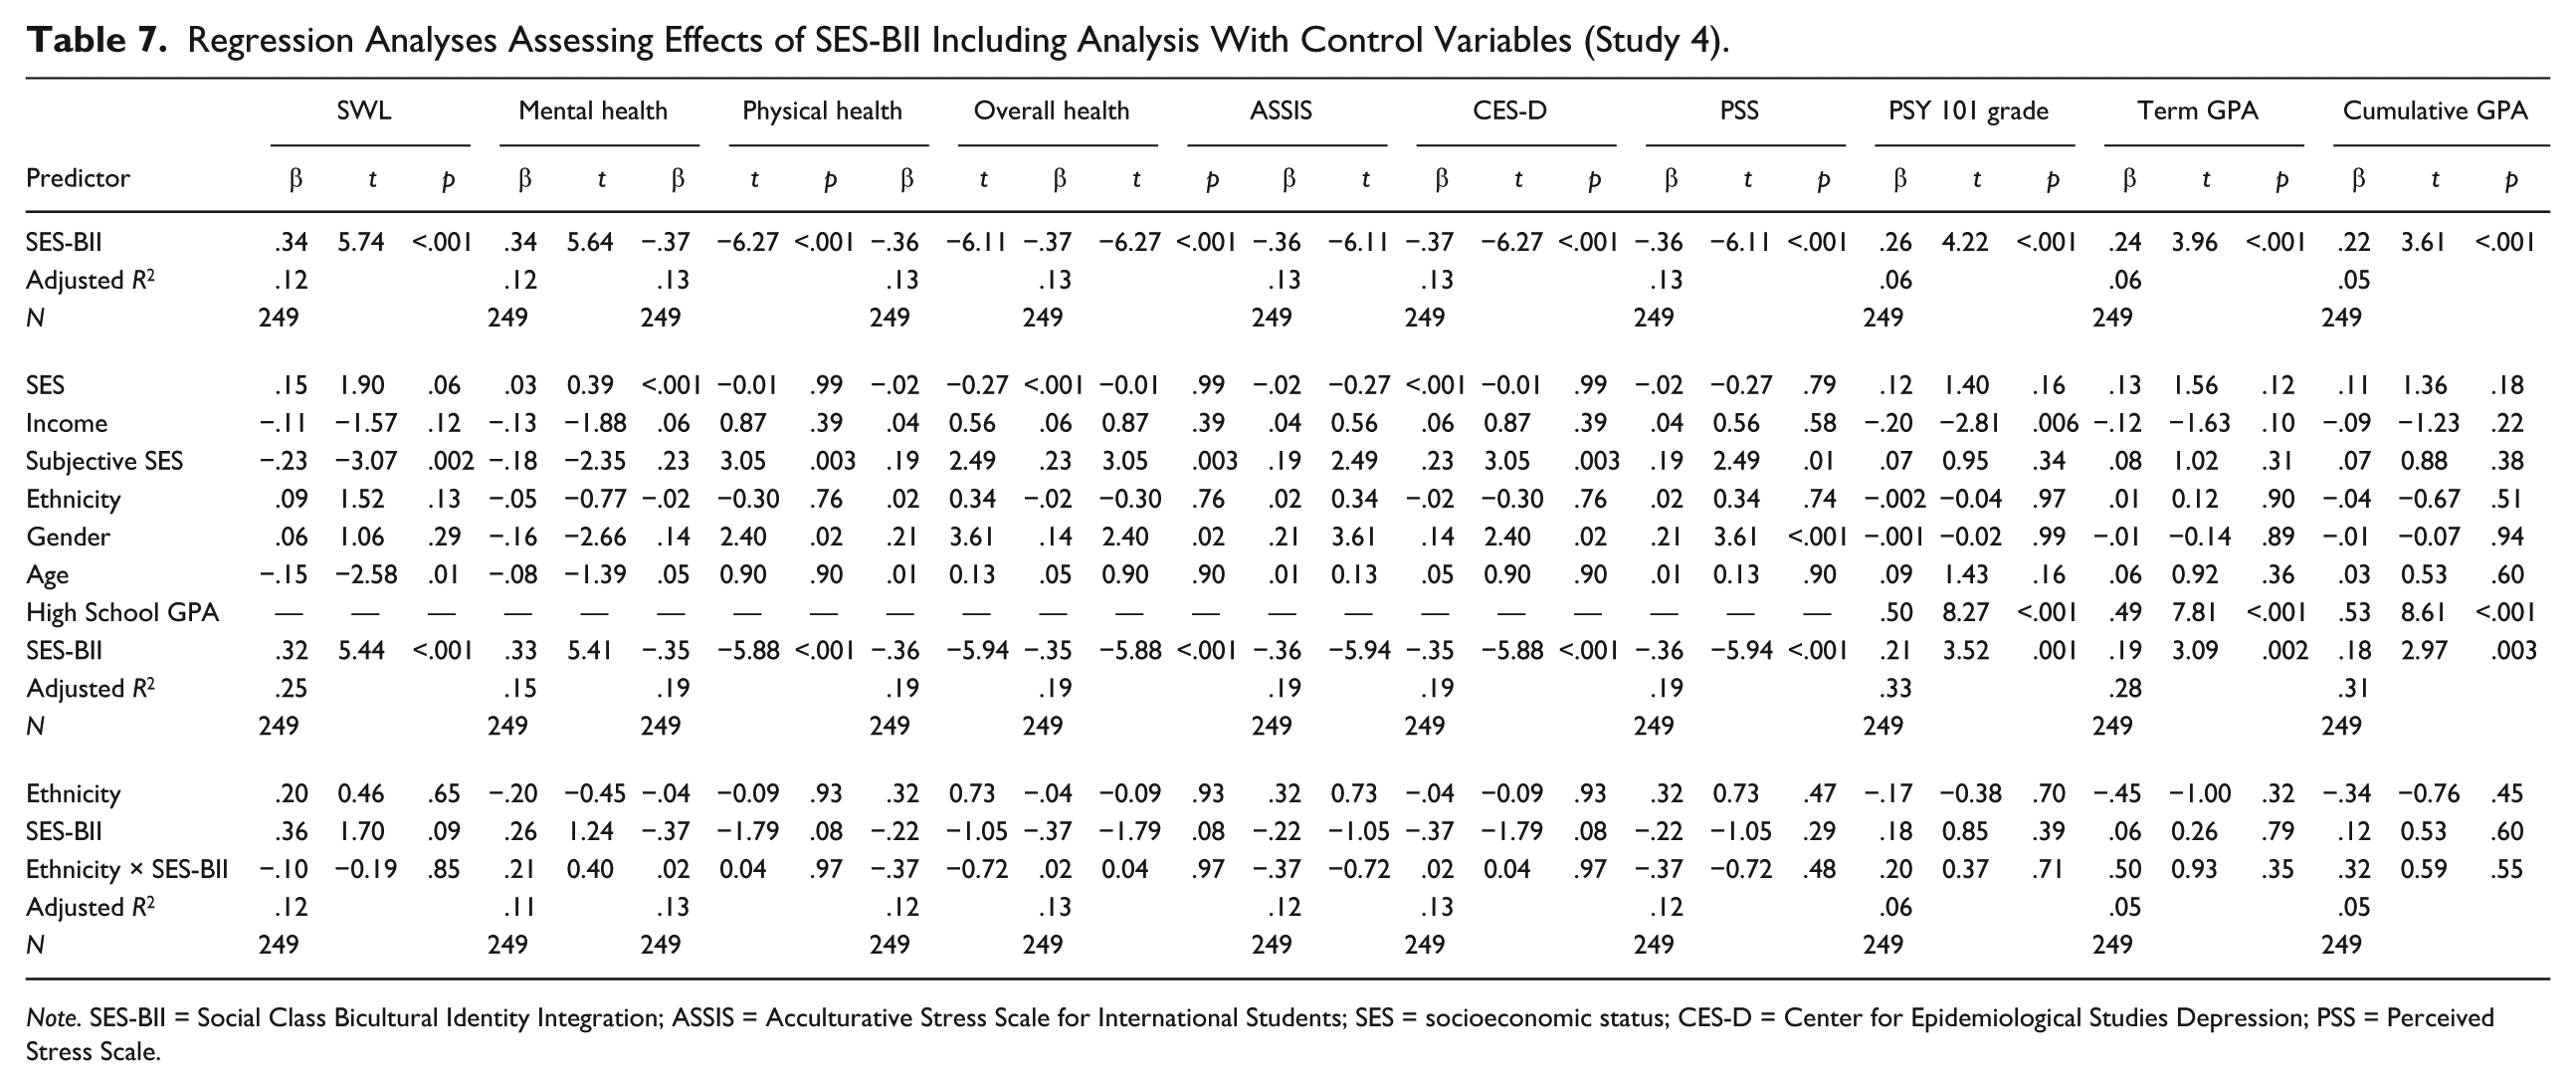
Note. SES-BII = Social Class Bicultural Identity Integration; ASSIS = Acculturative Stress Scale for International Students; SES = socioeconomic status; CES-D = Center for Epidemiological Studies Depression; PSS = Perceived Stress Scale.
Results were consistent with our hypotheses; identity integration was significantly related to all variables. Specifically, identity integration was significantly positively related to SWL, mental health, physical health, overall health, PSY 101 course grade, term GPA, and cumulative GPA, and significantly negatively related to acculturative stress, depression, and perceived stress. After controlling for demographic and performance variables, the relationship between identity integration and all dependent variables remained significant. Interactions of SES-BII and ethnicity (i.e., European American vs. non-European American) were not significant (all ps > .05, see Table 7).
To examine whether the relationships between identity integration and SWL, mental health, physical health, overall health, depression, and perceived stress were explained by reduced acculturative stress, a bootstrapping procedure using 5,000 resamples was tested (Preacher & Hayes, 2004). Figure 3 shows the results; the relationship of identity integration with health and well-being variables (i.e., SWL, mental health, physical health, overall health, depression, and perceived stress) was significantly mediated by acculturative stress. 6 Specifically, participants high in identity integration had reduced acculturative stress, which was positively related to SWL, mental health, physical health, and overall health, and negatively related to depression and perceived stress. A Sobel test demonstrated that the indirect effects of identity integration on SWL (z = 5.03, p < .001), mental health (z = 5.19, p < .001), physical health (z = 3.52, p < .001), overall health (z = 4.48, p < .001), depression (z = −6.13, p < .001), and perceived stress (z = −5.29, p < .001) were partially mediated by acculturative stress.
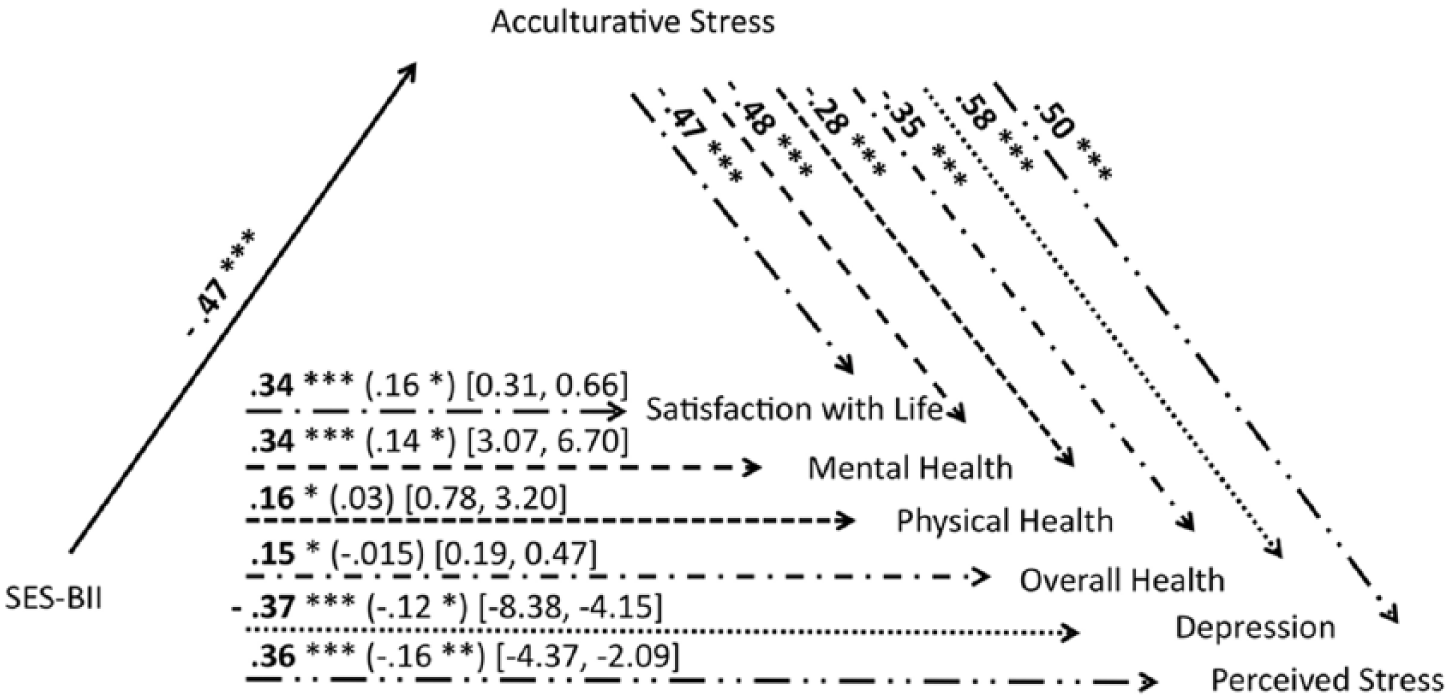
Mediation of the effect of SES-BII on mental health, physical health, and well-being by acculturative stress (Study 4).
In addition, we used the same procedure to test whether the effects of identity integration on course grade, term GPA, and cumulative GPA were mediated by reduced acculturative stress. However, the effects of identity integration on performance were not mediated by acculturative stress. 7
Discussion
Study 4 replicated and extended our previous findings; identity integration was significantly related to SWL, mental and physical health, acculturative stress, depression, and perceived stress, and significantly predicted official course grade, term GPA, and cumulative GPA. The academic performance findings replicated those observed with self-report (Study 2), with hard measures of academic performance taken at a later time-point, thereby suggesting the directionality of the relationship between identity integration and performance. The relationships between identity integration and the health and well-being variables were mediated by reduced acculturative stress; this suggests that FGC students with integrated identities have lower acculturative stress, which accounts for improved health and well-being, relative to FGC students low in social class BII. However, the effects of identity integration on academic performance variables were not mediated by acculturative stress. This suggests that while identity integration is beneficial for academic performance, the effects do not depend on acculturative stress. It may be that another variable that is more closely linked to academic performance (e.g., social integration, belonging, and academic self-efficacy) better explains the relationship between identity integration and performance.
General Discussion
Past research demonstrates that FGC students have poorer performance and persistence compared with CGC students. We argue that difficulty acculturating to college accounts in part for these differences. The present research examined the ways that social class BII predicts outcomes related to health, well-being, and performance for FGC students and graduates. We found that integrated social class identities were strongly related to health, well-being, and performance. In addition, the relationship between identity integration, health, and well-being appear to be related to reduced stress associated with acculturating to college.
Study 1 provided an initial test of the idea that people may feel bicultural as a function of social class, demonstrating that FGC students are more likely to identify as social class bicultural and experience greater home–school dissonance than CGC students. Study 2 demonstrated that the adapted SES-BII scale was reliable and positively correlated with GPA and SWL. Study 3 demonstrated that integrated social class identities were significantly positively related to work engagement and job satisfaction for FGC graduates. Study 4 revealed that integrated social class identities were positively related to SWL, physical health, mental health, overall health, and objective measures of academic outcomes (i.e., course grade, GPA), and negatively related to acculturative stress, depression, and perceived stress. The relationships between integrated social class identities, health, and well-being were mediated by reduced acculturative stress. In summary, there is robust evidence across different studies, samples, and outcome measures that integrated social class identities are linked to positive outcomes for FGC students. 8
Using biculturalism as a framework to understand FGC students may potentially shed light on other previous findings regarding factors that help versus hinder FGC students’ adaptation to college environments. For example, research by Rheinschmidt and Mendoza-Denton (2014) demonstrates that FGC students who endorse a growth mindset are less concerned about being discriminated against on the basis of their social class (e.g., RS class). It may be that this effect is mediated by social class BII, such that integrated social class identities buffer these students against concerns about rejection. In addition, research on the detrimental effects of cultural mismatch on academic performance for FGC students may similarly be explained by social class BII. Specifically, the experience of cultural mismatch (e.g., Stephens, Fryberg, et al., 2012) may reflect difficulty integrating one’s social class identities, whereas having integrated social class identities may diminish the experience of cultural mismatch, which in turn may enhance academic performance. Furthermore, recent work has shown that low SES college students who perceive the college environment as unwelcoming or “chilly” have lower academic self-efficacy (Browman & Destin, 2016). This effect may also be mediated by social class BII, such that FGC students who perceive the university environment as chilly may have less integrated social class identities, thereby reducing their belief that they can succeed in college. In addition, social class BII may be a mechanism by which previous interventions have had their effects. In other words, these interventions may have succeeded because they helped FGC students to integrate social class identities (e.g., Stephens, Hamedani, & Destin, 2014; Stephens, Townsend, Hamedani, Destin, & Manzo, 2015). Thus, we suggest that identity integration may be an important mechanism that explains why a variety of variables help versus hinder FGC students. Testing these possibilities will provide a more nuanced account of how and why cultural factors may affect the performance of FGC students.
Limitations and Future Directions
One limitation of the present research is that the data presented here are correlational in nature. Although the relationship between SES-BII and SWL, mental and physical health, overall health, depression, and perceived stress was related in Studies 2 to 4, and mediated by reduced acculturative stress in Study 4, the relationship between variables was assessed concurrently. This may have been influenced by state differences such as emotion or feelings of stress. This issue may be attended to in the future by collecting survey responses across a period of time, such as with ecological momentary assessment, which would have the added benefit of allowing us to probe the relationship of these variables across the semester. This would be especially helpful in determining whether there is a sensitive window that contributes to the higher rates of dropout among FGC students, which is most likely to occur in their first semester or first year of college (Engle & Tinto, 2008).
The FGC students who participated in these studies were not a homogeneous group; indeed, in Studies 2 and 4, more than half of the participants were not European American. Research on cultural models suggests that individuals are constantly engaging with multiple cultural contexts related to different facets of identity (e.g., social class, ethnicity, gender, sexual orientation). Being low status in any one of these identities (e.g., stigmatized ethnic minority) may have similar implications for outcomes (Boykin, Jagers, Ellison, & Albury, 1997; Croizet & Claire, 1998; Cross & Madson, 1997). However, there are also important differences between these different types of identities. Namely, social class is a concealable identity, meaning it can be hidden from others (Crocker, Major, & Steele, 1998; Goffman, 1963; Quinn & Earnshaw, 2013). While some research demonstrates that social class can be detected through visual cues (Kraus & Keltner, 2009), other evidence suggests that FGC students perceive CGS as concealable (e.g., Orbe, 2004; Stephens, Fryberg, et al., 2012). For example, Steinmetz (2008) found that the FGC participants in a longitudinal study were adept at “passing” by hiding cues that would indicate their social class.
Other sociocultural identity variables (e.g., ethnicity, gender, sexual orientation) also influence FGC students’ experiences in college. Having multiple relevant identities (e.g., gender, ethnicity, social class, sexual orientation, religion, ability) in a given context is referred to as intersectionality. It is especially impactful if people have multiple underrepresented or stigmatized identities, such that individuals may face additional challenges in the form of stereotyping and discrimination (Cole, 2009; Collins, 1998; Stirratt, Meyer, Ouellette, & Gara, 2008; Warner, 2008). The importance of one’s identity as a FGC student, versus other competing sociocultural identities, may be an important determinant of the way that FGC students experience the college setting. This may depend on the salience of CGS, and the salience of other identities, in different situations (e.g., at home vs. at school; Hecht & Faulkner, 2000; Orbe, 2004). For example, one study with nontraditional FGC students, who were older (i.e., a nonconcealable identity), found that they were more likely to attribute feelings of not belonging to their age, rather than their CGS (Orbe, 2004). Thus, the impact of social class BII may depend on whether one’s social class identity is most salient.
Potentially, effects of social class identity integration for FGC students who are also ethnic minorities may be attenuated as these students may attribute challenges primarily to their racial or ethnic identity. Interactions of class and ethnic identities will likely depend on several factors: first, concealability of race (e.g., multiracial individuals, “passing”), such that FGC students who are members of a visible minority group may be more likely to attribute challenges to the ethnic identity than to CGS. Second, the interaction may depend on whether the racial or ethnic identity is stigmatized in academic contexts, such that FGC students who have a stigmatized ethnic identity (e.g., African American, Native American, Latinx) may be less likely to attribute challenges to CGS, compared with someone who does not have a stigmatized ethnic identity (e.g., Asian Americans).
However, in the present study, we found only weak evidence of differences in the effects of social class BII by ethnicity. Importantly, there were no significant interactions between SES-BII and ethnicity. There are two possibilities for this pattern of results: first, because these studies were explicitly assessing social class, as indicated in recruitment materials, consent forms, and the SES-BII scale itself, it is possible that social class identity (as opposed to other identities) was primed or made salient. This may have reduced the contribution of BII associated with other social identities to the outcome variables of interest. The second possibility is that the effects associated with social class integration are actually stronger than those associated with ethnicity as they pertain to health, well-being, and academic performance. In general, future research would do well to investigate integration of other social identities such as ethnicity, gender, and sexual orientation and to examine the ways that they relate to social class identities.
Future research may also shed additional light on the mechanisms by which integrated social class identities affect performance. In the present research, the relationship between integrated social class identities and health and well-being was mediated by reduced acculturative stress. Specifically, FGC students who were high in social class BII had less stress associated with acculturating to the university and increased health and well-being. However, acculturative stress did not mediate the effects of social class BII on academic performance. Hence, there may be another mechanism at play that relates more to academic performance, such as social integration, belonging, or academic self-efficacy.
FGC students have lower social integration in college, meaning that they have fewer social interactions with other students and faculty, and what interactions they do have are poorer quality. While social integration is important for all students, it may be especially necessary for FGC students, who receive less social and informational support from their families and friends (Billson & Terry, 1982; Bryan & Simmons, 2009; Collier & Morgan, 2008; Elkins, Braxton, & James, 2000; Lehmann, 2009; Lynch & O’Riordan, 1998; Malecki & Demaray, 2006; Rubin, 2012; York-Anderson & Bowman, 1991). A meta-analysis of 35 studies by Rubin (2012) found that working-class students are less socially integrated than middle-class students in college contexts, which may adversely affect academic performance. The effects of social class BII on academic performance may be mediated in part by social integration, such that FGC students high in social class BII should report greater social integration, thereby improving performance.
Another potential mediator of the effects of identity integration on academic performance is belonging. Belonging is linked to improved academic performance (Rubin, 2012; Walton & Cohen, 2011). FGC students are at increased risk for belonging uncertainty and underperformance in the college context (Ostrove & Long, 2007; Rubin, 2012; Stephens, Fryberg, et al., 2012; Walpole, 2003). However, students high in social class BII may have increased feelings of belonging in the college context, or may be buffered from the effects of identity threat by increased belonging related to social class BII, which may account for improved performance (S. E. Johnson, Richeson, & Finkel, 2011; Ostrove & Long, 2007; Rubin, 2012; Walton & Cohen, 2007). Specifically, this may be due to reduced concerns about whether “someone like me” can belong and succeed in college, thereby alleviating social identity threat.
Another important predictor of performance in the college context is academic self-efficacy, or the belief that one is capable of succeeding in the academic context (Chemers, Hu, & Garcia, 2001; Zimmerman, Bandura, & Martinez-Pons, 1992). Academic self-efficacy is a robust predictor of academic performance and persistence (Kahn & Nauta, 2001; Pascarella, Wolniak, & Pierson, 2003; Rayle, Arredondo, & Robinson-Kurpius, 2005; Richardson, Abraham, & Bond, 2012; Robbins et al., 2004; Zimmerman et al., 1992). Students who have traditionally been marginalized in higher education contexts have been shown to have low academic self-efficacy, which may contribute to lower grades and persistence (Rice, Lopez, Richardson, & Stinson, 2013; Yosso, 2006). In addition, research by Browman and Destin (2016) demonstrates that when university environments are framed as unwelcoming or inconsiderate (i.e., “chilly”) for low SES students, they have significantly lower academic self-efficacy, compared with students for whom the university was framed as welcoming (i.e., “warm”). There were no differences among high SES students (Browman & Destin, 2016). Social class BII may increase academic self-efficacy, or the sense that an individual is capable of succeeding academically, as a function of reducing concerns about fulfilling stereotypes of low-income and FGC students as unintelligent or less able (Hattie, 1993; Zimmerman et al., 1992).
The present studies are the first to extend research on biculturalism to the context of social class, demonstrating that people can feel bicultural as a function of social class. Furthermore, this research provides the first demonstration of the relationship between integrated social class identities and health, well-being, and performance for FGC students and graduates. These findings advance our understanding of psychological factors that impact FGC students’ performance and well-being. We believe this work serves as a bridge between the emerging cultural psychological approach to social class and research on biculturalism, extending the concept of what it means to be bicultural, as well as shedding light on the nuanced cultural experiences of FGC students. More broadly, the present work is consistent with the notion that there are many forms of culture and suggests that more people than one might imagine are effectively bicultural.
Supplemental Material
Online_Appendix – Supplemental material for Integrated Social Class Identities Improve Academic Performance, Well-Being, and Workplace Satisfaction
Supplemental material, Online_Appendix for Integrated Social Class Identities Improve Academic Performance, Well-Being, and Workplace Satisfaction by Sarah D. Herrmann and Michael E. W. Varnum in Journal of Cross-Cultural Psychology
Footnotes
Appendix
Declaration of Conflicting Interests
The author(s) declared no potential conflicts of interest with respect to the research, authorship, and/or publication of this article.
Funding
The author(s) received no financial support for the research, authorship, and/or publication of this article.
Supplemental Material
Supplementary material for this article is available online.
Notes
References
Supplementary Material
Please find the following supplemental material available below.
For Open Access articles published under a Creative Commons License, all supplemental material carries the same license as the article it is associated with.
For non-Open Access articles published, all supplemental material carries a non-exclusive license, and permission requests for re-use of supplemental material or any part of supplemental material shall be sent directly to the copyright owner as specified in the copyright notice associated with the article.