
Abstract
Previous research has discussed cultural differences in moderacy vs extremity response styles. The present research found that cultural differences in response styles were more complex than previously speculated. We investigated cross-cultural variations in extreme rejecting versus affirming response biases. Although research has indicated that overall Chinese have less extreme responses than Westerners, the difference may be mainly driven by extreme rejecting responses because respondents consider answering survey questions as a way of interacting with researchers, and extreme rejecting responses may disrupt harmony in relationships, which is valued more in Chinese collectivistic culture than in Western individualistic cultures. Studies 1 and 2 revealed that Chinese had less extreme rejecting response style than did British, whereas they did not differ in extreme affirming response style. Study 2 further revealed that the cross-cultural asymmetry in extreme rejecting versus affirming response styles was partially accounted for by individualism orientation at the individual level. Consistently, Study 3 revealed that at the country level, individualism was positively associated with extreme rejecting response style, but was not associated with extreme affirming response style, suggesting that individualism accounted for the asymmetric cultural variation in extreme rejecting versus affirming response styles.
Keywords
Rating scales are widely used in social sciences and related areas. One presumption of using rating scales is that people’s responses are solely based on the content of items (Harzing, 2006). That is, an observed response would only be determined by a respondent’s latent evaluation of the item content. However, in addition to latent evaluation, the observed response may also be affected by response styles, which refer to systematic tendencies that people have when they rate scale items, regardless of their content (Baumgartner & Steenkamp, 2001). Thus, an observed response can result from a combination of a latent evaluation and a systematic response style.
Response styles can potentially make cross-cultural comparisons based on mean scores questionable, because people from different cultures may differ systematically in their response styles. Although researchers are usually interested in the comparison of the latent evaluation means across cultures, the comparison has to be based on observed responses. Given that observed responses can be affected by response styles, which can vary systematically across cultures, the comparison based on observed ratings becomes inconclusive (Harzing, 2006), which may lead to measurement errors (Boer, Hanke, & He, 2018) and puzzling cross-cultural differences (Mõttus et al., 2012).
One of the most frequently studied response styles is the moderacy versus extremity response style, which refers to the tendency to respond with the middle point versus the end points on a scale, regardless of the item content. Typically, in the study of moderacy versus extremity response style, respondents rate a large number of heterogeneous items. Heterogeneous items are items with various kinds of different content (e.g., attitudes toward a variety of topics). The observed responses on the middle point on the scales are regarded as an indicator of moderacy response style, and the observed responses on the two end points are regarded as extremity response style (Chen, Lee, & Stevenson, 1995; Hamamura, Heine, & Paulhus, 2008; Harzing, 2006; Johnson, Kulesa, Cho, & Shavitt, 2005). Smith and Fischer (2008) adopted a different method to measure extremity response styles where all the points except the middle point on a 5-point scale were weighted in calculating the extremity response styles. Such research has shown that East Asians had greater moderacy response style and smaller extremity response style than did Westerners (Chen et al., 1995; Hamamura et al., 2008; Harzing, Köster, & Zhao, 2012; Shiomi & Loo, 1999). For example, in one study, Chen et al. (1995) administered a questionnaire that covered a broader range of topics to participants from Japan, Taiwan, United States, and Canada. They found that Japanese and Chinese participants selected the middle points on the scale more frequently than American and Canadian participants did, and that Americans selected the extreme points more frequently than the other three cultural groups.
Researchers have developed a few procedures to deal with the influences of response styles in cross-cultural comparisons. For example, Fischer (2004) and Fischer and Milfont (2010) provided a standardization procedure to account for the impacts of responses styles in cross-cultural comparisons. In other research, He and colleagues proposed using a general response style factor to account for these response styles (He, Bartram, Inceoglu, & Van de Vijver, 2014; He & Van de Vijver, 2013, 2015a, 2015b; He, Van de Vijver, Espinosa, & Mui, 2014). He and others also proposed using anchoring vignettes to reduce the influence of response styles in cross-cultural comparison studies (He, Buchholz, & Klieme, 2017). Recently, He and colleagues compared a number of procedures dealing with response styles and concluded that anchoring vignettes, parceling, and treating data as ordered categories are promising (He, Van de Vijver, et al., 2017).
Asymmetry in Extremity Response Styles
In the study of extremity response styles, some studies combined the two end points on a scale (Chen et al., 1995; Hamamura et al., 2008). Although this is valid for their specific research purposes, combining the responses on the two end points prevents researchers from examining if the cultural variations in responding with the two end points are symmetric or not, which is the main focus of the present study.
In the present study, we examined the extreme rejecting response style and the extreme affirming response style. Extreme rejecting (affirming) style refers to the tendency to respond with the most negative (positive) point on a scale, regardless of the contents of the items they are evaluating. The most negative (positive) point on a scale refers to the point on a scale to which when people select, it can potentially harm (enhance) the feelings of others. For example, saying strongly disagree or strongly dislike to a neutral item, such as when being asked to evaluate a recently seen film, may make a person be perceived as not easy-going or even quarrelsome, which can potentially harm the feeling of others.
Note that the most negative (positive) point on a scale is not necessarily the lowest (highest) point on a rating scale. For example, on a scale ranging from 1 (strongly agree) to 7 (strongly disagree), the lowest point (1) is not the extreme negative point and the highest point (7) is not the extreme positive point. Also note that some rating scales do not have extreme negative or positive points. For example, the two end points on a frequency rating scale, that is, 1 (never) and 7 (very often), for neutral behaviors do not contain positive or negative meanings, which would not potentially enhance or harm others’ feelings.
Extreme rejecting and affirming response styles differ from previously identified response styles. Compared with extremity response style, extreme rejecting and affirming response styles are more informative because together they can provide a more detailed picture on where the extremity response style comes from. Extreme rejecting and affirming response styles are related to acquiescence response style and disacquiescence response style, which refers to the tendency to agree or disagree with a scale item regardless of its content. However, compared to the latter two, extreme rejecting and affirming response styles are likely to be more sensitive to cultural influences because they are more extreme; that is, only the most extreme points are considered. In addition, the extreme rejecting and affirming styles can be generalized to scales where agree/disagree labels are not used, as long as the extreme labels contain negative and positive meanings in relation to maintaining harmony/avoiding conflict with others.
Interestingly, research has shown that participants consider answering survey questions as a way of interacting or having conversations with researchers (Schwarz, 2007; Sudman, Bradburn, & Schwarz, 1996). Consequently, the norms governing everyday interaction and conversation are applicable to answering survey questions (Haberstroh, Oyserman, Schwarz, Kühnen, & Ji, 2002; Schwarz, Strack, & Mai, 1991). For example, the rule of avoiding redundancy in everyday conversations is applicable to responding to survey questions. When rating an item, people keep in mind what has been asked before and exclude the information provided previously, which leads to lower correlation between ratings on specific questions (e.g., satisfaction about academic life) and ratings on general questions (e.g., general life satisfaction) when the general questions follow the specific questions (Haberstroh et al., 2002). As a second example, research on social desirability (where people answer questions in a manner to make researchers view them positively) and on demand characteristics (where people behave in a manner trying to please experimenters) also indicate that people consider answering survey questions as a way of interacting with researchers.
East Asians are relatively collectivistic, emphasizing interpersonal connections and relationship harmony more than Westerners (Hofstede, Hofstede, & Minkov, 2010; Ji, Lee, & Guo, 2010; Markus & Kitayama, 1991). When interacting with others, East Asian respondents may feel that extreme rejecting responses could potentially hurt the feelings of interaction partners, and harm relationship harmony. They may then generalize this response style to answering survey questions.
Thus, we predicted that Chinese would have less extreme rejecting response styles than would British. Similarly, because relationship harmony is more important in collectivistic societies than in individualistic societies, we predicted that individualism would positively associate with extreme rejecting response style at both the individual level and the country level. In contrast, because extreme affirming responding usually would not damage the feelings of the interaction partner or relationship harmony, we predicted that Chinese and British would not differ in extreme affirming response style. Similarly, individualism would not be associated with extreme affirming response style.
The Present Study
The main purpose of the present study was to investigate whether there was an asymmetric cultural variation in extreme rejecting response style versus extreme affirming response style, and whether such cultural variation was accounted for by individualism orientation. The asymmetry in response style was investigated using a variety of scale forms, scale anchors, and contents of questions.
Study 1—Brand Names
Previous research used observed responses on heterogeneous items as indicators of response styles (Baumgartner & Steenkamp, 2001; Chen et al., 1995; De Beuckelaer, Weijters, & Rutten, 2010; Greenleaf, 1992). This method may have potential limitations because respondents from different nations may differ systematically in their latent evaluations of the heterogeneous items. Instead, we adopted a different method, that is, trying to make the latent evaluations equivalent across cultures. It is complimentary to previous methods because although cultures may differ systematically in a large number of heterogeneous items, one would still be able to identify certain domains/items in which cultures are less likely to differ. Although it is almost impossible for any researcher to be completely sure that their items are culturally equivalent in latent evaluations, this method has important advantages in knowledge accumulation when more researchers generate their own equivalent items independently. We have included further discussion on this method and the heterogeneous method in the general discussion.
Participants
Because this is the first study to examine the cross-cultural variation in extreme rejecting and extreme affirming response styles, we were not able to estimate the effect size and calculate the required sample size. Given that our sample pools have only a moderate number of British participants, we decided to recruit as many British participants as possible within one semester. We also decided to have at least an equal number of Chinese participants as British participants. Thus, we first estimated the maximum number of British participants we could possibly get. Then we targeted that number for Chinese participants. Consequently, we had a moderate number of participants from each culture, with slightly more Chinese than British participants. Specifically, 85 British students (19 males and 66 females) from a university in United Kingdom and 135 Chinese students (64 males and 71 females) from a university in Macao, S.A.R., China, participated in the study. British participants (M = 22.18, SD = 6.91) were older than their Chinese counterparts (M = 18.95, SD = 1.11), t = 4.28, p < .001, 95% confidence interval (CI) of the difference [1.73, 4.73]. Age and gender had no influence on the results, so their effects were not reported. Participants received course credit for their participation.
Materials and Procedure
British and Chinese participants rated nonsense syllables. Because nonsense syllables are meaningless, latent evaluations on these syllables are less likely to vary systematically across cultures. Thus, the observed responses were good indicators of response styles.
We created 10 nonsense syllables for this Study. They are caxy, vanax, higow, larern, dacep, keneno, fimzug, motyob, sogfap, and buphib. These syllables can be pronounced but have no real meaning. Chinese and British participants read a cover story that a company had invented a new medicine but had not chosen a brand name for it yet. The company was considering a few options for brand names for the new medicine and wanted to learn how much people liked or disliked each brand name option. The 10 nonsense syllables were presented as the optional brand names. Participants rated their liking of the optional brand names on a 5-point scale ranging from −2 (strongly dislike) to 2 (strongly like) with a middle point 0 (neutral).
The questionnaire was first created in English, and then it was translated into traditional Chinese for Chinese participants by a bilingual research assistant. The first author, who was also a bilingual, discussed the translation with the translator and verified the translation. Chinese participants completed the questionnaire in Chinese. The same translation procedure was also used in Study 2.
The nonsense syllables were not translated because they have no real meanings. The Chinese participants were from an English teaching university, where English is used on a daily basis in their learning. Thus, they would not be surprised to see brand names in English.
Results
Overall, Chinese evaluated the brand names more positively (M = −0.01, SD = 0.39) than did British (M = −0.24, SD = 0.54), t = −3.43, p = .001, 95% CI of the difference [−0.37, −0.10], Cohen’s d = 0.49. Note that although Chinese and British participants differed in mean ratings, such a difference might be a result of the differences in response styles, especially the extreme rejecting response style. Indeed, when extreme rejecting responses, that is, −2, were excluded from the analysis, Chinese (M = 0.13, SD = 0.40) and British (M = 0.10, SD = 0.40) participants did not differ in their evaluations of the brand names any longer, t = −0.47, p = .64.
The frequencies of extreme rejecting responding (i.e., −2) and extreme affirming responding (i.e., 2) were counted. See Figure 1 for the frequencies. A 2 (culture: British vs. Chinese) × 2 (responding: extreme rejecting vs. extreme affirming responding) repeated-measure analysis of variance (ANOVA) was conducted. The main effect of responding was significant, F(1, 218) = 30.42, p < .001,
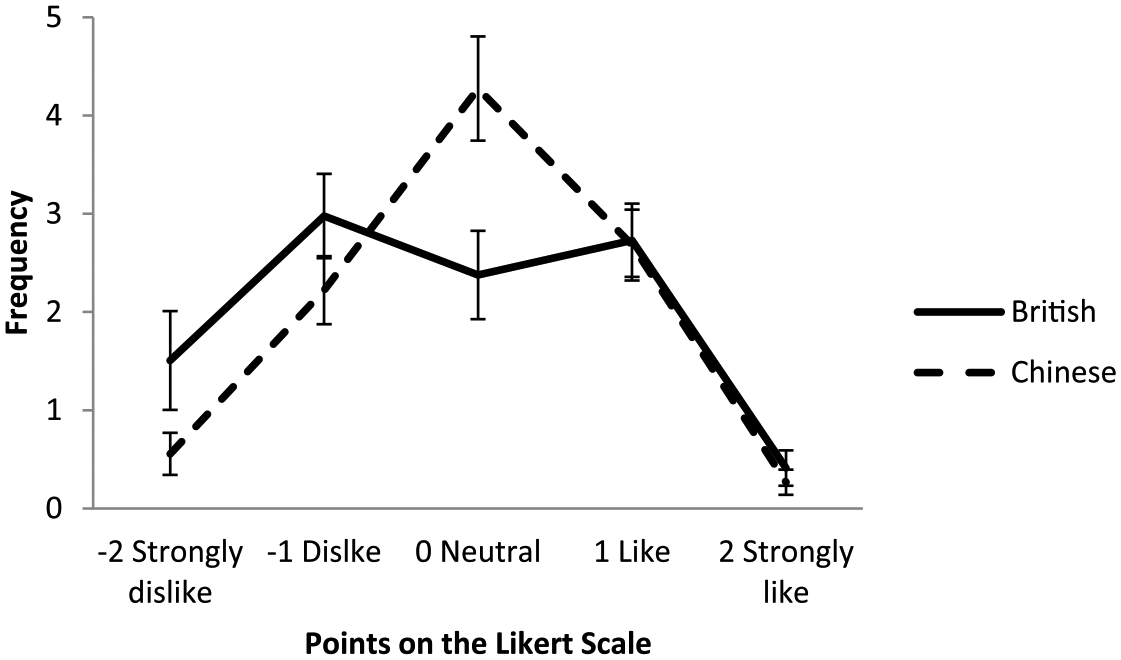
British and Chinese participants’ response frequency for each point in the nonsense syllables rating scale.
To readers’ interest, we also counted the frequencies of choosing the middle point. Chinese participants (M = 4.27, SD = 3.12) had more moderate responding than did British participants (M = 2.38, SD = 2.09), t = −5.41, p < .001, 95% CI of the difference [−2.59, −1.21], Cohen’s d = 0.72. Consistent with previous literature, Chinese had a greater moderacy response style than did British.
Study 2—Describe Yourself
Instead of using culturally equivalent stimuli as rating items, we adopted a different method in Study 2, namely balancing items. Specifically, Chinese and British participants rated pairs of items. The two items in each pair were worded in opposite directions. Consequently, although participants in the two cultures possibly differ in latent evaluations of these items, the potential influence of latent evaluations would be canceled out by each other. In addition, we included a measure of individualism orientation, and examined whether the cross-cultural variation in extreme rejecting versus affirming response styles was accounted for by individualism orientation.
Method
Participants
Based on the effect sizes obtained in Study 1, we would need 62 participants from each culture to have 80% of chance to find the expected cultural difference in extreme rejecting response style in this study at α = .05. To examine whether individualism orientation accounts for the expected results, we further assumed that both the effect from culture to individualism and the effect from individualism to extreme rejecting responding were between small and medium, that is, βs = .26. To have 80% of chance to find the expected mediation effect at α = .05, we would need 81 participants from each culture. Thus, we aimed to get 81 participants or more from each culture (Fritz & MacKinnon, 2007). Specifically, 92 Caucasian British students (16 males and 76 females) from a university in United Kingdom and 128 Chinese students (47 males and 81 females) from a University in Macao, S.A.R., China, participated in the study. British participants (M = 23.16, SD = 8.35) were older than their Chinese counterparts (M = 19.52, SD = 1.35), t = 4.14, p < .001. Age and gender had no influence on the results and so their effects were not reported. Participants received course credit for their participation.
Procedure
Participants first completed an individualism orientation measure. Then they rated themselves on a scale with balanced items about the self.
Individualism orientation
We created a scale to measure individualism orientation. Individualism influences people’s thinking, attitudes, and behaviors in various domains. Instead of trying to develop a scale that measures individualism in all domains systematically, we aimed at capturing the core elements of individualism most relevant to our hypotheses, namely being independent and unique, or interdependent and maintaining harmony. The scale has 14 items. Eight items were adapted from Yao, Ramirez-Marin, Brett, Aslani, and Semnani-Azad (2017). Then based on four of these items, we generated another four items, which had opposite meanings. We also created two additional items. Sample items include “My personal identity, independent of others, is very important to me,” “I enjoy being unique and different from other people,” “My personal identity is intertwined with important others around me (reversed item),” and “I try to maintain harmony in any group I belong to (reversed item).” Participants rated their agreement level on each statement on a scale ranging from 1 (strongly disagree) to 7 (strongly agree).
Balanced items about the self
Participants rated four pairs of statements about themselves. Each pair describes individuals on one attribute but in opposite directions (e.g., “I talk faster than most of my friends” and “I talk slower than most of my friends”; or “Usually I have lots of energy in the evening” and “Usually I have little energy in the evening”). Therefore, any potential influence of the latent evaluations on extreme rejecting and extreme affirming response styles would cancel each other out. In addition, to generalize the findings in Study 1 to other type of scales, we adopted a 7-point scale ranging from 1 (strongly disagree) to 7 (strongly agree).
Results
Explorative factor analyses of the individualism orientation items using both British and Chinese data with principal components method revealed a two-factor solution. To examine measurement invariance, similar explorative factor analyses with British or Chinese data separately were conducted. Similar factor structures were obtained, except that one item had low loadings on both factors for Chinese participants, and multiple loadings on both factors for British participants. After excluding this item, the factor loading structures for British data, those for Chinese data, and those for British and Chinese data combined were similar indicating a successful achievement of measurement invariance. The final scale had 13 items on two factors. The first factor had eight items about independence and uniqueness. The second factor had five items about interdependence and harmony. See Table 1 for factor loadings. The internal reliabilities of the two factors/subscales for British were .82 and .71, respectively. And for Chinese, they were .78 and .68, respectively. The overall individualism orientation scale had acceptable reliabilities, stratified alphas for British and Chinese were .78 and .75, respectively (Kamata, Turhan, & Darandari, 2003). We calculated the mean individualism orientation score for further analysis. Higher scores indicate higher individualism orientation. Similar results were obtained when the excluded item was included in calculating the mean score. As expected, British participants (M = 4.44, SD = 0.65) had higher individualism orientation than Chinese participants (M = 4.15, SD = 0.45), t = 3.79, p < .001, 95% CI of the difference [0.14, 0.45], Cohen’s d = 0.53.
Factor Loadings of the Individualism Scale.
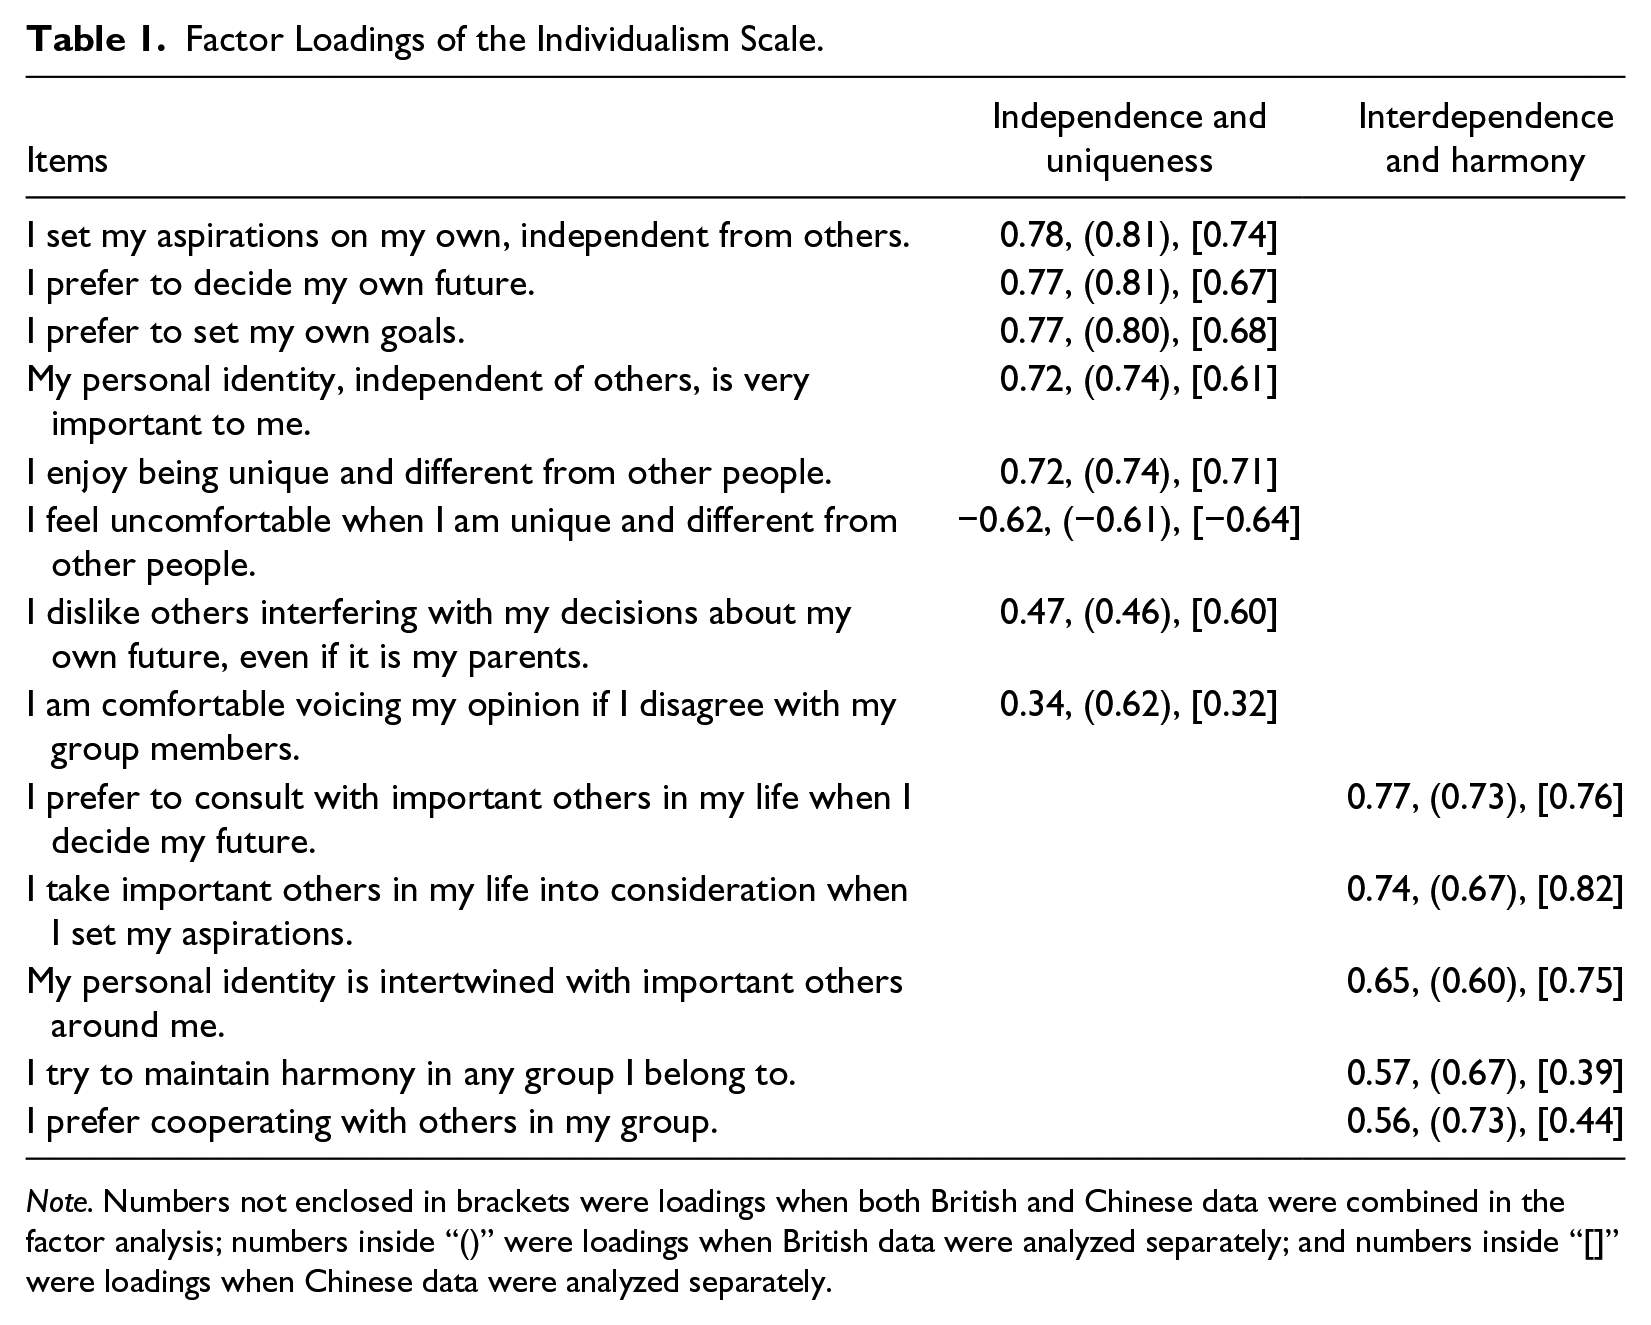
Note. Numbers not enclosed in brackets were loadings when both British and Chinese data were combined in the factor analysis; numbers inside “()” were loadings when British data were analyzed separately; and numbers inside “[]” were loadings when Chinese data were analyzed separately.
Similar to Study 1, the frequencies of extreme rejecting responding (i.e., 1) and extreme affirming responding (i.e., 7) were counted. See Figure 2 for the frequencies. A 2 (culture: British vs. Chinese) × 2 (responding: extreme rejecting vs. extreme affirming responding) repeated-measure ANOVA was conducted. The main effect of responding was significant, F(1, 218) = 4.27, p = .04,
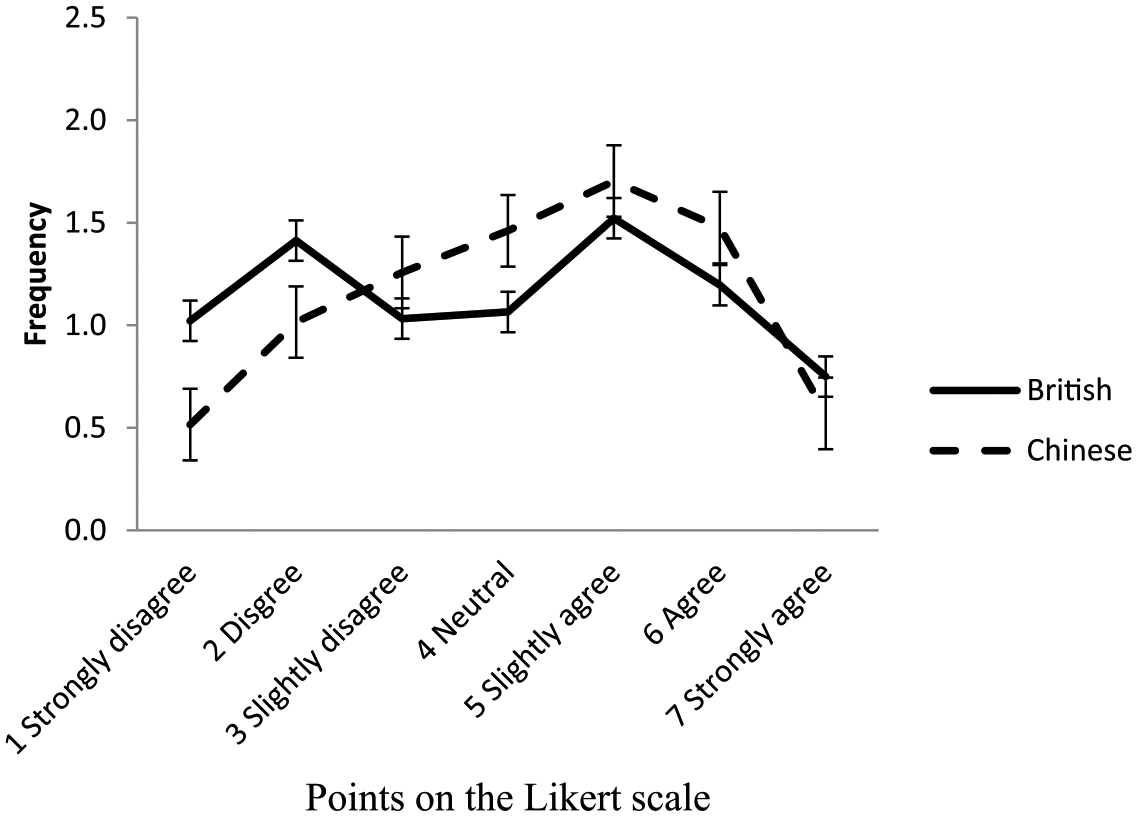
British and Chinese participants’ response frequency for each point on the rating scale in rating themselves.
To readers’ interest, we again counted the frequencies of choosing the middle point. Chinese participants had more moderate responding (M = 1.46, SD = 1.45) than did British participants (M = 1.07, SD = 1.36), t = −2.05, p = .04, 95% CI of the difference [−0.78, −0.02], Cohen’s d = 0.28. However, note that this moderate responding may be less informative for moderacy response style because the latent evaluations on the rating items may differ across cultures.
Furthermore, we hypothesized that the observed cross-cultural differences in extreme rejecting responding would be accounted for by individualism orientation. A bootstrapping mediation analysis (Hayes, 2013) with culture (British = 0, Chinese = 1) as the predictor, individualism score as the mediator, and the extreme rejecting responding frequency as the outcome was conducted. As expected, culture negatively predicted individualism score, β = −.30, t = −4.01, p < .001, 95% CI [−0.44, −0.15]. Chinese scored lower on individualism than their British counterparts. More importantly, individualism score positively predicted extreme rejecting responding after controlling culture, β = .51, t = 4.11, p < .001, 95% CI [0.26, 0.75]. The indirect effect of culture on extreme rejecting responding through individualism was also significant, β = −.15, 95% CI [−0.29, −0.05]. Meanwhile, culture negatively predicted extreme rejecting responding after controlling individualism score, β = −.36, t = −2.56, p = .011, 95% CI [−0.63, −0.08], indicating that the individualism partially mediated for the impacts of culture on extreme rejecting responding. See Figure 3. Similar results were obtained when the discrepancy score between extreme rejecting responding and extreme affirming responding was used as the outcome variable in the analysis (Judd, Kenny, & McClelland, 2001). Together, the results showed that individualism partially accounted for the cross-cultural differences in extreme rejecting responding.
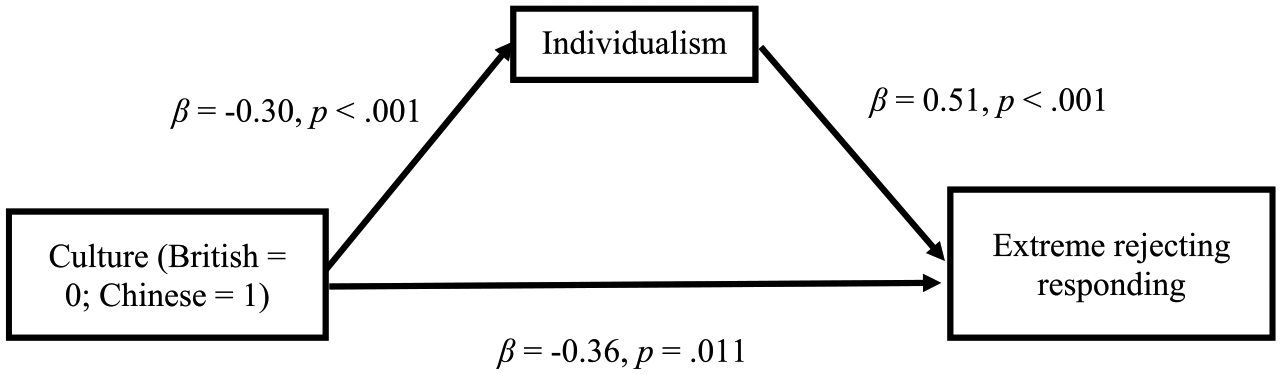
Individualism mediated the cultural asymmetry in extreme rejecting responding style.
Study 3—Attitudes Toward Science and Technology
Method
World Values Survey
We analyzed data from the World Values Survey (WVS) to explore if the asymmetric cultural variation in extreme rejecting and extreme affirming response styles holds true for more representative samples and beyond British and Chinese cultures. The WVS data were collected mainly through face-to-face interviews rather than in a psychology lab, which could increase the ecological validity of the findings in previous studies. In addition, the WVS is conducted in many countries around the world, which covers the majority of the world’s population. Thus, it would allow us to systematically examine cultural variation in extreme rejecting and extreme affirming response styles, and to further explore the underlying mechanisms of the response styles.
Countries/regions
The latest wave of WVS data (Wave 6) was analyzed (Inglehart et al., 2014). The Wave 6 WVS data were collected from 2010 to 2014, and include responses from more than 85,000 respondents across 57 countries/regions around the world.
Items selection
Although the Wave 6 WVS contains many items, most of them are not balance-worded. Because the latent evaluations are likely to vary across countries, responses on these items could be problematic as indicators of response styles in this context. Fortunately, the WVS survey does include a scale on attitudes toward science and technology, which is the only scale in the survey that has equal number of balance-worded items with extreme negative and positive rating points. Specifically, the attitude scale contains six items. Three items were worded such that higher scores indicate positive attitudes toward science and technology, and the other three items were reverse worded, that is, higher scores indicate negative attitudes toward science and technology. The first 5 items were rated on a scale ranging from 1 (completely disagree) to 10 (completely agree), and the sixth item was rated using different scale anchors, ranging from 1 (a lot worse off) to 10 (a lot better off). For each country/region, mean frequencies of extreme rejecting responding and extreme affirming responding were calculated as in Studies 1 and 2, 1 respectively.
Individualism index
Previous cross-cultural studies have provided us with country/region scores on individualism and collectivism. Since the 1960s, Hofstede et al. (2010) conducted a series of surveys with IBM employees worldwide. Based on the IBM studies with different international populations, other published reports, observations, and so on, Hofstede estimated the individualism scores for 76 countries and regions around the world. Notwithstanding its significance and popularity, Hofstede’s individualism index was criticized on the ground of being less representative in their survey respondents and assuming temporal stability of the scores (Beugelsdijk & Welzel, 2018). However, Hofstede’s individualism index was the only index that provides individualism scores for the vast majority of countries included in the Wave 6 WVS data at the country level at the time of our study. Furthermore, Hofstede’s individualism index has been used by other researchers as an indicator of a country/region’s individualism level (Harzing, 2006). Thus, we adopted Hofstede’s individualism score as the individualism index. Hofstede’s individualism scores were retrieved from his published book, Cultures and Organizations (Hofstede et al., 2010), and the Hofstede-Insights (n.d.) website. Higher scores on this index indicate higher levels of individualism.
GDP per capita, PPP (purchasing power parity)
Previous research has shown that individualism positively correlated with economic development (Gorodnichenko & Roland, 2011a, 2011b). Thus, we obtained GDP per capita, PPP data for each country and region from the World Bank website (International Comparison Program Database, 2018). The WVS Wave 6 was conducted in five different years across the countries and regions. Thus we adopted the GDP per capita, PPP data for each specific country or region in the years when the WVS data were collected. The GDP per capita, PPP was not available for one region (Taiwan), and thus was entered as a missing value.
Results
The analyses were thus based on 43 countries/regions where both Hofstede’s individualism index and the Wave 6 WVS data were available. See Table 2 for extreme rejecting and affirming responding, as well as GDP data for the 43 countries/regions. We predicted that countries/regions with higher individualism scores would have more extreme rejecting responding on the scale (i.e., 1) than those with lower individualism scores, whereas individualism would not be associated with extreme affirming responding (i.e., 10). Following the procedure outlined by Judd et al. (2001), we examined the moderation effect of individualism on frequencies of extreme rejecting responding versus extreme affirming responding. Specifically, we calculated the discrepancy between extreme rejecting responding and extreme affirming responding, that is, extreme rejecting responding frequency minus extreme affirming responding frequency at the country level. Then the discrepancy was regressed onto individualism and GDP per capita, PPP. The results showed that at the country level, GDP per capita, PPP positively predicted the discrepancy, that is, extreme rejecting over extreme affirming responding, at a marginally significant level, standardized β = .30, t = 1.99, p = .054. More importantly, as expected, after controlling GDP, individualism scores positively predicted extreme rejecting over extreme positive responding, standardized β = .32, t = 2.09, p = .04. The higher a country/region’s score on individualism, the more extreme negative over extreme positive responding they had. To further explore the moderation effect, extreme rejecting responding frequency was regressed onto individualism score and GDP data. The results showed that GDP per capita, PPP did not predict extreme rejecting responding, p = .30. As expected, individualism score positively predicted extreme rejecting responding after controlling GDP per capita, PPP, standardized β = .40, t = 2.42, p = .02. Similar analysis with extreme affirming responding frequency as the outcome variable revealed that GDP per capita, PPP negatively predicted extreme affirming responding at a marginally significant level, standardized β = −.33, t = −1.98, p = .054. Importantly, as expected, individualism score did not predict extreme affirming responding, p = .79. That is, at the country level, individualism was positively associated with extreme rejecting responding, but not associated with extreme affirming responding, after controlling GDP per capita, PPP. Thus, the results supported the hypothesis, and suggested that the asymmetric cross-cultural variation in extreme rejecting and extreme affirming response styles was accounted for by individualism orientation.
Extreme Rejecting/Affirming Responding Frequencies and GDP Per Capita, PPP for the 43 Countries/Regions.

Note. PPP = purchasing power parity.
To examine the extent to which the cultural differences in extreme rejecting response style can be applied to the countries/regions included in our dataset, we created a scatter plot with a fitted regression line where individualism score was on the x axis and extreme rejecting responding frequency on the y axis (see Figure 4). The scatter plot shows that three countries (Brazil, Libya, and South Africa) were located far from the fitted regression line, indicating that the identified cultural differences in extreme rejecting response style do not apply to these three countries. After excluding these three countries, individualism score and extreme rejecting responding were positively associated with each other for the remaining countries, indicating relatively more individualistic countries used a more extreme rejecting response style.
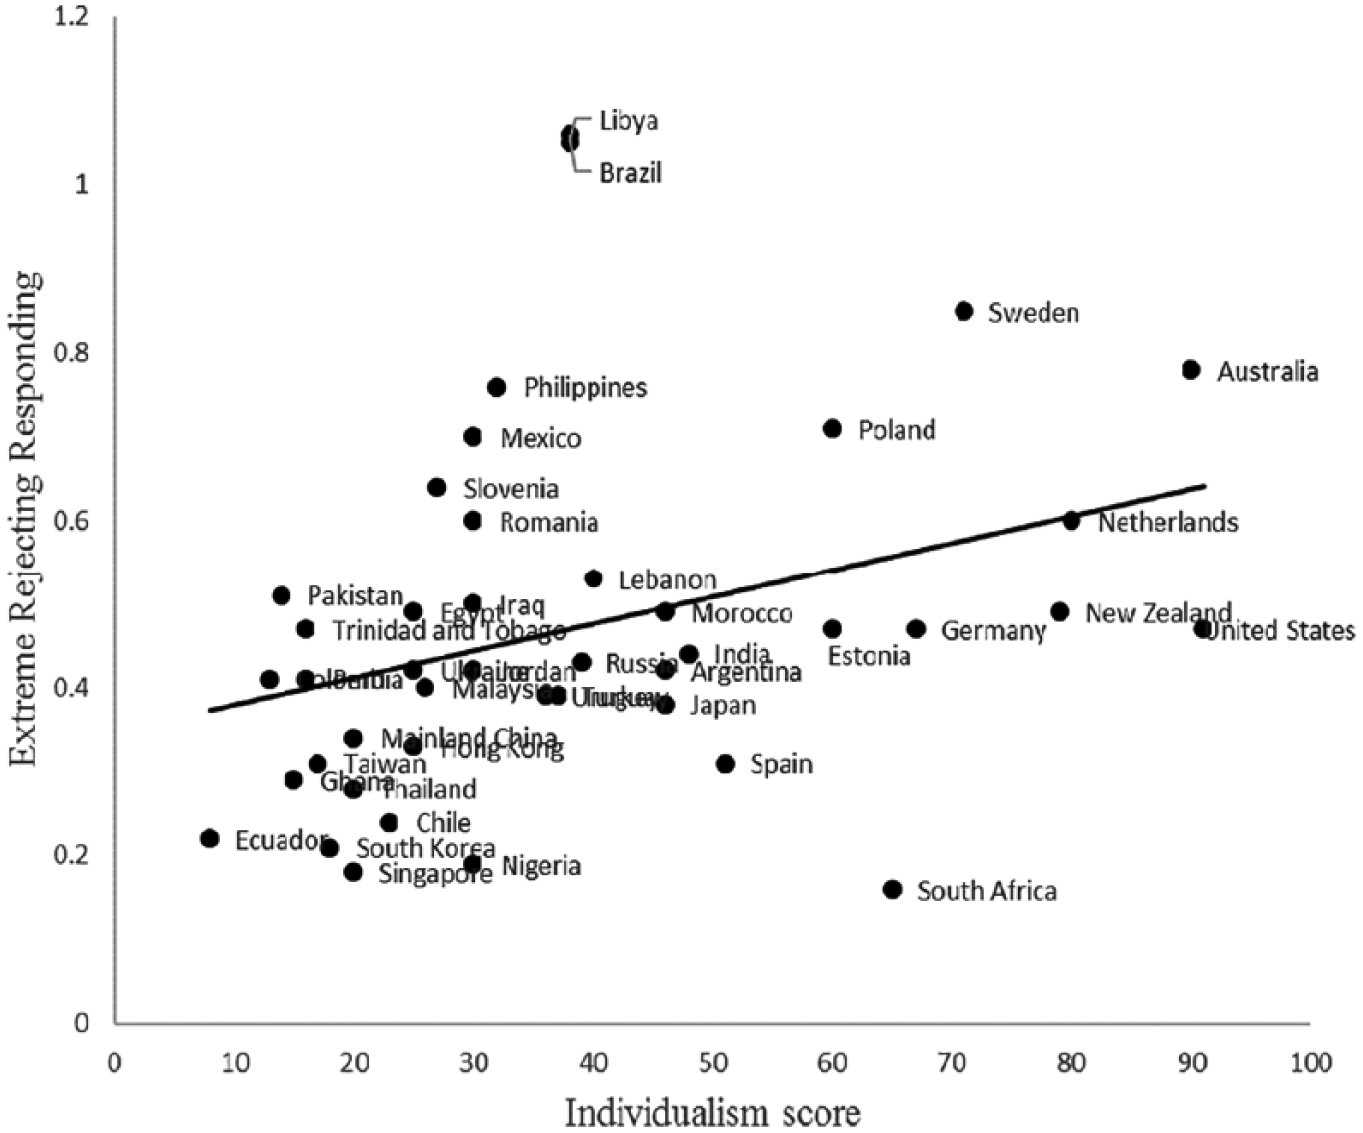
Individualism and extreme rejecting responding across the countries.
To further examine whether the cultural differences in extreme rejecting response style in the remaining countries/regions (after the exclusion of Brazil, Libya, and South Africa) were mainly driven by East Asian countries/regions where China has had a large influence, and whether the effect can be generalized beyond East Asian countries/regions, we further excluded data from the five East Asian countries/regions in the dataset, namely Mainland China, Hong Kong, Taiwan, Japan, and South Korea. We also excluded data from Singapore because though Singapore is not located in East Asia, it has been greatly influenced by traditional Chinese culture. The dataset included 34 countries/regions after the exclusion. Again, following Judd et al. (2001), the discrepancy between extreme rejecting responding and extreme affirming responding was regressed onto individualism and GDP per capita, PPP. GDP did not predict the discrepancy, p = .42. Importantly, after controlling GDP, individualism scores positively predicted extreme rejecting over extreme affirming responding, standardized β = .47, t = 2.11, p = .04. Countries/regions with relatively higher individualism levels used more extreme rejecting over extreme affirming responding. Again, to further explore the moderation effect, extreme rejecting responding frequency was regressed onto individualism score and GDP per capita, PPP. The results showed that GDP did not predict extreme rejecting responding, p = .86. Importantly, after controlling GDP, individualism positively predicted extreme rejecting responding at a marginally significant level, standardized β = .43, t = 1.71, p = .097. The marginal effect may partly result from a relatively smaller sample size after excluding the nine relevant countries/regions in the dataset. A second possible reason is that the association between individualism and extreme rejecting response style is smaller in the remaining countries. Importantly, additional analysis revealed that the standardized regression coefficient of individualism (β = .43) in the remaining countries/regions was not significantly different from the standardized regression coefficient of individualism (β = .61) when data from the five East Asian countries/regions and Singapore were re-included in the analysis, p = .45, indicating that exclusion of these countries/regions did not significantly change the results, that is, the previously observed cultural differences in extreme rejecting responding was not mainly driven by East Asian countries/regions, and therefore, the cultural differences apply to the remaining countries around the world included in the dataset. Last, extreme affirming responding frequency was regressed onto individualism and GDP per capita, PPP. Both GDP and individualism score did not predict extreme affirming responding, ps > .40. To conclude, individualism was positively associated with extreme rejecting responding at a marginally significant level across the countries (with the exception of Brazil, Libya, and South Africa), but not associated with extreme affirming responding, after controlling GDP. In addition, the exclusion of the five East Asian countries/regions and Singapore did not significantly change the results. Overall, the results suggest that the cultural differences in extreme rejecting response style can be generalized beyond East Asian countries/regions, although the association between individualism and extreme rejecting responding might be smaller in those countries/regions. The only countries that the cultural differences in extreme rejecting responding may not generalize to are Brazil, Libya, and South Africa. Future research is needed to investigate the reasons behind this.
General Discussion
Observed scores can result from a combination of latent evaluations and response styles, and can therefore complicate cross-national comparisons. Consequently, response styles have received a lot of attention from researchers who are interested in cross-national comparisons. To examine cross-national differences in response styles, previous research has adopted various methods, such as using a large number of heterogeneous items (Baumgartner & Steenkamp, 2001; Chen et al., 1995; De Beuckelaer et al., 2010; Greenleaf, 1992). It was assumed that across heterogeneous items, different nations do not differ systematically. Thus, the cross-national variation in latent evaluations on single items would cancel out each other. Consequently, the confounding effect of latent evaluations on response styles would be removed. However, this assumption may not hold true in certain situations. Respondents across different nations may differ systematically on a large amount of the heterogeneous items. For example, cross-cultural research has shown that traditional Chinese culture emphasizes the role of midway thinking, or doctrine of the mean, in guiding people’s behaviors, emotions, and attitudes in most situations (Ji et al., 2010; Yang, 2010). The midway thinking states that people should avoid going to extremes in their behaviors, emotions, attitudes, and so on, and that maintaining harmony should be emphasized (Wu & Lin, 2005). Thus, it is likely that compared with other populations, Chinese may have more moderate and less extreme latent evaluations on a large number of the heterogeneous items, which would violate the presumption associated with using such items.
As the first contribution in Study 1, we provided a complimentary method, namely generating and testing culturally equivalent items. Researchers can rely on theories and previous findings to generate culturally equivalent items. As previously mentioned, culture can potentially have a systematic influence on a large number of heterogeneous items. Compared with random heterogeneous items, carefully generated items are more likely to be culturally equivalent, and are less likely to differ systematically across cultures. Thus, this method can reduce the contamination of latent evaluations in response style research. Although it is almost impossible for researchers to be completely sure that their lists are culturally equivalent, the validity and power of this method would increase quickly when more lists are generated, validated, and tested by researchers independently, because the independently generated lists across studies are likely to be heterogeneous. With more studies, the evidence would be built on a large number of heterogeneous, yet likely to be culturally equivalent items, which would not be achieved with multi-studies using random heterogeneous items. Thus, this method has an important advantage in evidence accumulation.
With the new method and balancing items method, we identified an asymmetric cultural variation in the extreme rejecting versus affirming response styles, which is the most important contribution of the article. Specifically, we found that Chinese had a less extreme rejecting response style than did British, whereas they did not differ in extreme affirming response style. Therefore, we provide a more nuanced picture of response style beyond a simple extreme response style on both ends of scales for Westerners compared with Easterners. Furthermore, the asymmetric cross-cultural variation in extreme rejecting versus affirming response styles was accounted for by individualism orientation at the individual level. Relatively individualistic individuals are more likely to choose extreme rejecting responses (e.g., strongly disagree/dislike) than less individualistic individuals. Similarly, at the country level, individualism positively associated with extreme rejecting response style, but not with extreme affirming response style, again suggesting that the cultural variation in extreme rejecting response style is accounted for by individualism. This is consistent with the idea that when interacting with others, extreme rejecting responses may hurt the feelings of the interacting partners, and disrupt relation harmony, which is valued more in collectivistic cultures than in individualistic cultures.
The asymmetric cultural variation in extreme rejecting versus extreme affirming response styles is robust. The effect sizes (Cohen’s d) of the cultural variation in extreme rejecting response style were 0.51 and 0.50 in Studies 1 and 2, respectively. The asymmetry appeared in studies with different methods (i.e., the new proposed method and the balanced item method), with different categories of stimuli (i.e., nonsense syllables, attributes of the self, and attitudes toward science and technology), with different rating scales (5-point bipolar scale ranging from −2 [strongly dislike] to 2 [strongly like] with a middle point 0 [neutral], 7-point scale ranging from 1 [strongly disagree] to 7 [strongly agree], and 10-point scale with different labels and without a middle point), and at both the individual level and the country level.
The current findings have important theoretical and practical implications. Theoretically, the asymmetric cultural variation in extreme rejecting versus extreme affirming response styles suggests that the concept of extremity response style may be too simplistic. It cannot capture where the extremity response style comes from. In addition, the finding suggests that the response style associated with the two end points differs in nature. Combining them together may lead to inappropriate conclusions. Furthermore, the findings can provide practical guides for cross-national comparisons. In cross-cultural comparison studies, we may want to be more cautious with the extreme rejecting responding, rather than focusing on the extreme affirming responding.
Researchers may need to be cautious when generalizing the findings to rating scales where the two end points do not contain positive or negative meanings. For example, unlike rating scales on agreement and liking, rating scales on frequency of behavior, likelihood of events, and so on contain neither negative nor positive meanings. That is, saying that one rarely does something, or that an event is extremely unlikely to happen is not necessarily extreme rejecting responding, because it may not hurt the feelings of the conversation partner. Consequently, the cross-cultural asymmetry in extreme rejecting versus affirming responding should disappear on those scales. This also suggests that labeling the end points in scales with words or phrases that do not contain negative or positive meanings may act to reduce the influence of asymmetric extreme rejecting and affirming response styles in cross-cultural studies. Further research is required to test such hypotheses.
Besides adopting appropriate labels, the methods identified previously in dealing with other response styles, namely standardizing the scores (Fischer, 2004; Fischer & Milfont, 2010), using a general response style factor (He, Bartram, et al., 2014; He & Van de Vijver, 2013, 2015a, 2015b; He, Van de Vijver, et al., 2014), and using anchoring vignettes (He, Buchholz, & Klieme, 2017), are also promising in controlling the impacts of extreme rejecting response style. Future studies can compare the effectiveness of all such methods in dealing with extreme rejecting response style in cross-cultural comparisons.
Footnotes
Declaration of Conflicting Interests
The author(s) declared no potential conflicts of interest with respect to the research, authorship, and/or publication of this article.
Funding
The author(s) received no financial support for the research, authorship, and/or publication of this article.