



Abstract
There are concerns about the meaning of self-rated health (SRH) and the factors individuals consider. To illustrate how SRH is contextualized, we examine how the obesity–SRH association varies across age, periods, and cohorts. We decompose SRH into subjective and objective components and use a mechanism-based age–period–cohort model approach with four decades (1970s to 2000s) and five birth cohorts of National Health and Nutrition Examination Survey data (N = 26,184). Obese adults rate their health more negatively than non-obese when using overall SRH with little variation by age, period, or cohort. However, when we decomposed SRH into objective and subjective components, the obesity gap widened with increasing age in objective SRH but narrowed in subjective SRH. Additionally, the gap narrowed for more recently born cohorts for objective SRH but widened for subjective SRH. The results provide indirect evidence that the relationship between obesity and SRH is socially patterned according to exposure to information about obesity and the availability of resources to manage it.
Self-rated health (SRH) is the mostly widely used validated, single-item indicator of health status across social science research that independently predicts morbidity and mortality (Idler and Angel 1990; Idler and Benyamini 1997). The association between SRH and health has been examined extensively (Ferraro and Yu 1995; Manderbacka, Lundberg, and Martikainen 1999; Tessler and Mechanic 1978).
Nonetheless, there are concerns about the meaning of SRH (Au and Johnston 2014). Prior research demonstrates that respondents place themselves into different SRH response categories despite having similar health conditions (Krause and Jay 1994; Prosper, Moczulski, and Qureshi 2009). In other words, different groups factor conditions into their SRH assessments differently.
We argue that weight status is a condition that tends to be interpreted differently and may have a variable relationship with SRH. Weight status is important for understanding SRH because of the increasing prevalence of obesity (defined as a body mass index [BMI] at or above 30) in the United States for both genders, all race-ethnicity groups, and all levels of socioeconomic status (Flegal, Caroll, and Ogden 2010; Zhang and Wang 2004) and because overweight and obese adults report poorer health compared to normal-weight adults (Ferraro and Yu 1995; Okosun et al. 2001; Prosper et al. 2009).
Yet, it is unclear whether weight status should be treated as a subjective or objective health indicator. Researchers often dichotomize weight status as obese (versus normal or overweight) and interpret it as an objective dimension of health (Singh-Manoux et al. 2006). Other researchers classify it as a lifestyle factor (Prosper et al. 2009). The lack of consensus may be a result of multiple factors. First, obesity and severe obesity (BMI > 35) are associated with chronic comorbidities and diseases, but being overweight (i.e., BMI 25 to 29.9) is not consistently associated with health risks (Campos et al. 2006; Masters, Powers, and Link 2013). Second, obesity’s comorbidities are diffuse and may be related to social stigma, making it difficult to pinpoint excess weight as the source of ill health (Brewis 2014).
Another hint of the variable meanings of SRH and obesity comes from evidence that the obesity–SRH relationship may be changing over time or across birth cohorts. Poor health ratings have not followed in lockstep with increasing obesity. Despite the dramatic increase in obesity, individuals’ SRH has improved during the past few decades (Liu and Hummer 2008; Martin et al. 2007), except among young adults (Salomon et al. 2009; Zack et al. 2004). If one interprets SRH as an objective indicator of health, these trends may seem perplexing and lead to speculations that obesity has become more harmful for young adults’ health than in the past, possibly because of their earlier-age onset of obesity (Juhaeri et al. 2003; Keyes et al. 2010; Reither, Hauser, and Yang 2009). However, an alternative possibility—tested here—is that the way people interpret obesity has changed or varies by age.
We explore the association between obesity and SRH for adults ages 25 to 64 using multiple waves of the National Health and Nutrition Examination Survey (NHANES). We empirically assess obesity’s relationship with both the subjective and objective health components of SRH. Thus, we build on a burgeoning literature that recognizes the multidimensionality of SRH (Ferraro, Farmer, and Wybraniec 1997; Hardy, Acciai, and Reyes 2014; Kaplan and Baron-Epel 2003). To illustrate this multidimensionality, we examine how the obesity–SRH relationship has changed over time and across age groups. Prior research has examined trends in obesity and SRH across age, cohorts, and periods (e.g., Martin et al. 2007; Salomon et al. 2009) but not how the obesity–SRH relationship is modified by age, period, and cohort. This article thus helps to clarify the health implications of the obesity epidemic in the United States while conceptually and methodologically contributing to the understanding of SRH.
Background
Life course theory (Alwin, McCammon, and Hofer 2006; Elder 1998) and cumulative disadvantage theory help to frame why the obesity–SRH relationship is likely to vary by age and across birth cohorts. This framework focuses on how early life events and the accumulation of disadvantage over the life course serve to widen health disparities for individuals and groups as they age (DiPrete and Eirich 2006; Ross and Wu 1996). Age, cohort, and period variations in health outcomes (Ferraro and Kelley-Moore 2003; Willson, Shuey, and Elder 2007) are viewed as the result of shifts and variations in early life (dis)advantages and social contexts (Ross and Wu 1996; Zajacova and Burgard 2010).
Past research shows clear associations between weight and poor physical health, including the acquisition of chronic conditions (Bray 2004; Lavie, Milani, and Ventura 2009; Must et al. 1999; Stein and Colditz 2004), greater reliance on prescription drugs to manage health conditions (Chang and Lauderdale 2009; Egan, Zhao, and Axon 2010), and lower life expectancy (Chang, Pollack, and Colditz 2013). However, the linkage between obesity and poor physical health is likely to vary by age, birth cohort, and time period. The health consequences of obesity likely increase with age as the physical wear and tear of obesity accumulates across the life course (Abdullah et al. 2011; Ferraro and Kelley-Moore 2003; Zajacova and Burgard 2010).
For similar reasons, the health consequences of obesity may be particularly detrimental for cohorts born after the rise in childhood obesity. More recent birth cohorts experienced a higher prevalence of obesity in childhood and adolescence (Juhaeri et al. 2003), and obesity in childhood increases the likelihood of adult obesity and its associated health problems (Dietz 1998; Ferraro and Kelley-Moore 2003; Reilly and Kelly 2011). The 1980s birth cohort faces a particularly high risk. These individuals were born during a period of rapid gains in obesity, and their mothers (i.e., women of the late 1950s and 1960s birth cohorts) experienced rapid increases in obesity during their young adulthood, exposing them to maternal obesity in utero (Allman-Farinelli et al. 2007; Robinson et al. 2012).
However, it is possible that the obesity–SRH relationship may be weakening over time or across birth cohorts as recent medical advances may have helped to better manage weight-related conditions, such as hypertension, diabetes, and high cholesterol, and may also reduce the obesity–SRH relationship (Egan et al. 2010). For instance, as of 2010, nearly one fourth of American adults over the age of 20 were taking statins compared to only 5% around 1990 (Kuklina et al. 2013). This increase has contributed to the substantial decline of high cholesterol (Carroll et al. 2005). This may be particularly true for the most recently born cohorts, since these new treatments were available to them for longer portions of their lives.
Apart from its effects on physical health, obesity may be associated with how people respond to the SRH question. Due to the social stigma associated with obesity (Brewis 2014) and public health or medical messages about the negative health impacts of obesity (Brownell 2005), obese people may rate their health more negatively than a non-obese person with identical health conditions. We refer to this as the “subjective” component to SRH.
The link between obesity and this subjective component of SRH may be particularly strong among young adults. Older adults consider different factors than younger adults when self-assessing their health. Older adults factor functional ability more heavily, while younger adults consider lifestyle factors like physical activity, diet, and obesity more heavily (Krause and Jay 1994). One possible explanation is that younger adults have fewer chronic health conditions than older adults, so obese young adults may focus more singularly on their weight when rating their health. Older adults may have several conditions that directly impact their quality of life, so they give their weight comparably less attention.
Additionally, the tendency for obese people to rate their health negatively (even after adjusting for physical health) may have increased over time due to more messages about the negative health consequences of obesity. For example, mainstream and scientific interest (and therefore, messaging) in obesity has grown substantially over the past two decades (Saguy and Almeling 2008). Messaging and stigma may have had a particularly large impact on recently born cohorts. Life course theory suggests that adolescent and young adult experiences are particularly impactful (Elder 1998), and it has been argued that today’s young adults have had especially negative experiences with obesity. These birth cohorts were exposed to messages about the health risks of obesity during particularly impressionable life stages (Reither et al. 2009) and are more likely to report facing obesity-related discrimination and stigma than older cohorts. As a consequence, they may be particularly likely to incorporate their weight status into their ratings of their own health, over and above expectations based on their physical health conditions. Indeed, among adults who were ages 25 to 39 in the early 1980s, those having a high BMI in early adulthood had steeper declines in SRH that were not fully explained by baseline health or medical conditions (Zajacova and Burgard 2010).
Research Expectations and Methodological Approach
The research above suggests that the obesity–SRH association depends on whether we are predicting the objective or subjective component of SRH. Obesity is likely to be negatively associated with the objective component of SRH, and this relationship is likely to be stronger for older adults and persons living in earlier time periods. We have less clear expectations about birth cohorts. The association could be stronger among recent birth cohorts due to their earlier onset of obesity; alternatively, it could be weaker due to greater availability of treatments for obesity-related conditions. We expect obesity to be negatively associated with the subjective component of SRH, and we expect this association to be stronger for younger adults and persons living in more recent time periods. Additionally, we expect the association to be stronger for recent birth cohorts due to greater media focus on obesity and earlier onset of obesity.
Assessing these ideas requires measures of both objective and subjective SRH. To accomplish this, we follow the recent work of Hardy and colleagues (2014), who decomposed SRH into two additive parts: (1) an indicator of physical functioning as a function of objective health indicators and (2) a residual subjective component. We predicted SRH as a function of health conditions and then generated predicted values of SRH, which we interpreted as the objective component of SRH. We interpreted the difference between the observed and predicted SRH (i.e., the residual) as the subjective component, which indicates the extent that people report better or worse health compared to others with the same constellation of health conditions.
Our research also requires us to disentangle age, period, and cohort effects. While age (A), period (P), and cohort (C) are conceptually distinct concepts (Ryder 1965), including all three in a single model is empirically challenging due to linear dependency (P = C + A). Mechanical approaches for teasing apart APC effects have been developed (Yang and Land 2013), and all—implicitly or explicitly—impose a constraint on at least one of the APC variables to identify the model, which influences the results (Bell and Jones 2014; Harding 2009; Pelzer et al. 2015). Rather than employing a mechanical solution, we use Winship and Harding’s (2008) mechanism-based approach for identifying APC models. This approach constrains at least one of the APC variables (cohort in our case) as affecting the outcome through a set of theoretically informed mechanisms. Observed nonlinearities in the relationship between cohort and the cohort mechanisms make it possible to identify the model.
We implemented this approach by estimating the path model shown in Figure 1 using Stata’s sem package. Age, time period, and the control variables have direct effects on both components of SRH. Cohort operates indirectly through mechanisms that vary systematically across cohorts and that are likely to influence physical health and/or how people report their health: educational attainment, ever having smoked, BMI at age 25, media focus on obesity at age 25, and the availability of pharmaceuticals for obesity-related conditions at age 25. Paths shown in gray vary by weight status, thus allowing the relationship between weight status and SRH to vary by age, period, and the cohort mechanisms. The cohort effect is the sum of the paths linking cohort with SRH through each mechanism.

Mechanism-Based Age–Period–Cohort Path Model.
Data and Methods
We pooled the NHANES II (1976–1980), NHANES III (1990–1994), and the continuous NHANES (1999/2000, 2001/2002, 2003/2004, 2005/2006, 2007/2008, 2009/2010, and 2011/2012). The NHANES is a nationally representative study of health and nutrition of children and adults in the United States conducted by the National Center for Health Statistics since the early 1970s. The NHANES has a complex, multistage probability sample design and collects demographic, socioeconomic, health, and anthropometric data though interviews and examinations. Our pooled NHANES sample encompasses 36 years and five birth cohorts. We did not use data from earlier years even though NHANES were conducted in the 1960s and early 1970s because they do not contain full information on SRH or they focused on specific subsamples.
The analysis was restricted to non-Hispanic white and non-Hispanic black adults ages 25 to 64 who completed both the questionnaire and examination portions of the survey, hereafter referred to as whites and blacks. We focused on the working-age population because of concerns regarding changes in health that may induce illness and weight loss in older adults. We excluded adults younger than 25 because we relied on an NHANES question on weight at age 25 (not asked to persons younger than 25). We excluded foreign-born adults (n = 2,122) to ensure that when we follow birth cohorts over time across cross-sectional surveys, they represent the same (U.S.-born) cohorts rather than groups whose compositions change due to immigration. Pregnant women were dropped (n = 801) due to the confounding between BMI and pregnancy. Underweight adults (BMI < 18.5; n = 758) and severely obese adults (BMI > 50; n = 535) were dropped from the sample. The final analytic sample included 26,184 adults after listwise deletion. Sample descriptives are shown in Table 1.
Descriptive Statistics: Non-Hispanic White and Black Nonpregnant Adults, Ages 25 to 64 (NHANES II, III, and Continuous; N = 26,184).

Note: NHANES = National Health and Nutrition Examination Survey; SRH = self-rated health; APC = age–period–cohort; BMI = body mass index.
SRH
The dependent variable was a response to a single item that asked the respondent to rate their general health (1 = poor, 2 = fair, 3 = good, 4 = very good, 5 = excellent). SHR is decomposed into objective and subjective components. The objective component indicated the respondent’s physical health. Using an ordinary least squares model, SRH is predicted by a series of indicators of the following respondent-reported health conditions: asthma, anemia, congestive heart failure, heart attack, stroke, bronchitis, emphysema, cancer, hypertension, and diabetes. The Stata “predict” command was used to generate the respondents’ predicted value of SRH. The subjective component of SRH indicates the tendency for respondents to report better or worse health independent of these health conditions. The subjective component is the arithmetic difference between the respondent’s reported and predicted SRH (i.e., the objective and subjective SRH sum to the reported SRH value).
Weight Status
During the NHANES examination, technicians measured the respondent’s height and weight using standardized equipment and procedures. These measures were used to calculate BMI (BMI = weight in kilograms / [height in meters]2), which we categorized into three groups: non-obese (18.5 ≤ BMI < 30.0), obese I (30 ≤ BMI < 35), and obese II (BMI ≥ 35). We combined obese I and obese II into a single obese category (BMI ≥ 30) for some descriptive analyses.
Age, Period, and Birth Cohort
We treated age, period, and cohort as categorical to allow for nonlinear effects. We coded age into 10-year categories (25–34, 35–44, 45–54, 55–64), period into intervals that corresponded with the NHANES survey years (1976–1977, 1978–1981, 1990–1992, 1993–1994, 1999–2002, 2003–2006, and 2007–2012), and five birth cohorts: the Greatest Generation (1907–1927), Silent Generation (1928–1945), Baby Boomers (1946–1964), Generation X (1965–1979), and Millennials (1980 or later) (Taylor et al. 2014). Five-year age and cohort categories produced substantively identical results with less precision due to smaller cell sizes.
Cohort Mechanisms
Cohort mechanisms are the cohort-specific experiences, behaviors, and/or resources that lead to cohort differences in SRH. Cohort effects on the obesity–SRH association likely operate indirectly through these mechanisms. Some cohort mechanisms are likely to influence SRH for all weight categories. Specifically, rising educational levels (Mirowsky and Ross 2008) and declines in smoking (Preston and Wang 2006) are likely to have improved SRH for more recently born cohorts, but increasing weight in young adulthood is likely to have reduced it. Other cohort mechanisms likely have greater effects on SRH among obese than among non-obese people. Media focus on obesity and drug treatments for obesity-related conditions has been increasing, which may have influenced cohort changes in how obese people subjectively rate their own health (in the case of media focus on obesity) and the degree to which obesity contributes to worse physical health (in the case of treatments).
Education in years is approximated from reported categories (less than high school = 10, high school graduate = 12, some college = 14, college graduate = 16), and centered at 12 years. A dummy variable for smoking indicated whether the respondent ever smoked. We obtained similar results when we distinguished between current and former smokers. We measured weight in young adulthood with BMI at age 25 (centered at 30), based on self-reported weight at age 25 and measured height at the time of the interview. Before calculating BMI at age 25, we adjusted weight at age 25 for reporting error based on a model that related the respondent’s current measured weight to current reported weight and all other analytical variables. We substituted the respondent’s reported weight at age 25 into this model (in place of current reported weight) to obtain a predicted value of his or her measured weight at age 25.
Media focus on obesity was measured as the number of articles published in The New York Times about obesity in the year when the respondent was age 25. We selected The New York Times because it ranks third in circulation among U.S. newspapers with wide readership (Audit Bureau of Circulation 2012), its news service delivers over 200 articles daily to more than two dozen other papers, and its syndicate service provides articles worldwide (The New York Times Syndicate 2012). We systematically reviewed newspaper articles published by The New York Times from 1970 to 2007 using ProQuest fully digitized archives. The search was limited to English-language articles, excluding advertisements, classified advertisements, stock reports, tables of contents, obituaries, marriage announcements, images, credits, reviews, and legal notices using the terms United States, obesity or overweight, or body mass index or BMI. We display the number of articles by year in Figure 2 (gray line), showing that media attention on obesity increased slowly during the late 1980s and 1990s and then rose in the 2000s.
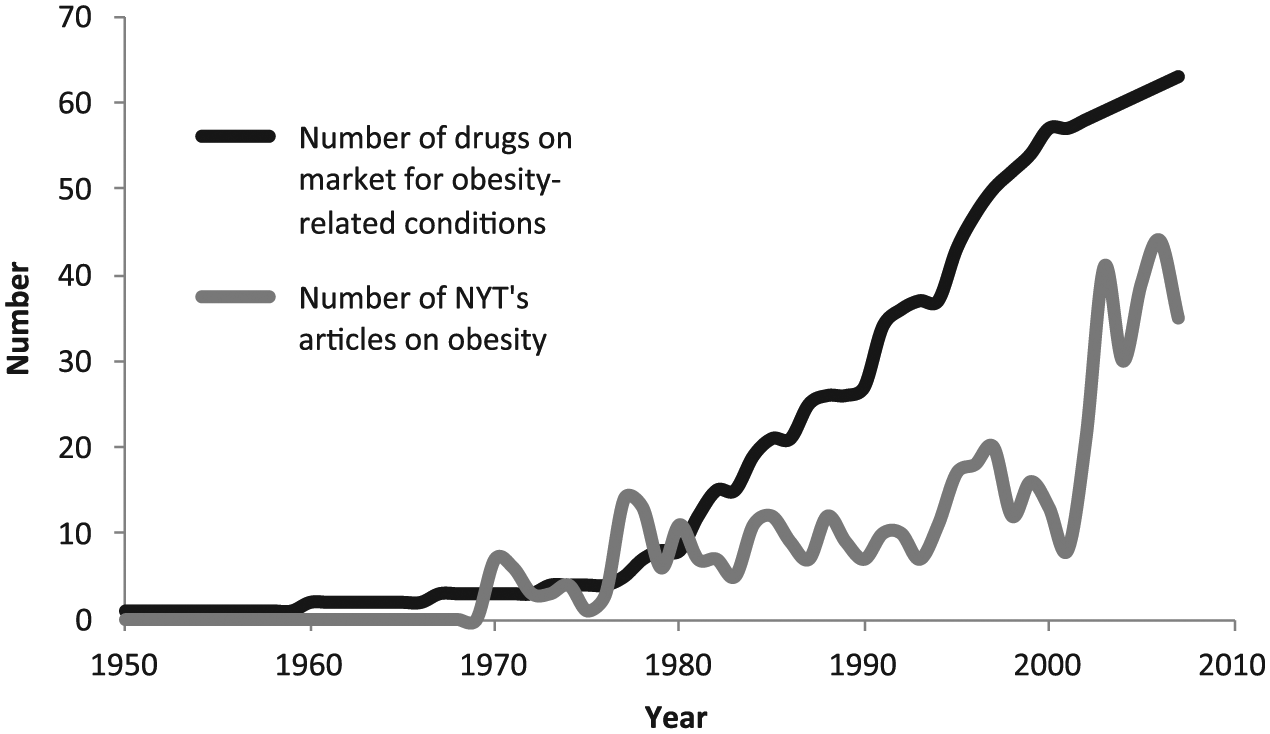
Drugs on the U.S. Market for Obesity-related Conditions and Annual Number of New York Times Articles on Obesity, by Year.
Treatment for obesity-related conditions was measured as the number of drugs on the market when the respondent was age 25. We used mayoclinic.org and medicinenet.com to determine the most common classes of pharmacotherapy approaches to treating type 2 diabetes, high cholesterol, and hypertension; the specific drugs in each class; and the U.S. market-entry date (available from authors). We display the number of these drugs on the market by year in Figure 2 (black line), which shows that these kinds of treatments increased steadily since the late 1980s.
The effects of media focus on obesity and the availability of drugs are likely to be stronger among people with higher levels of education because they more often follow the news and have the resources to take advantage of new treatments (Phelan and Link 2005). To account for this possibility, we included interactions between education and the media and drugs variables.
The cohort mechanisms vary across cohorts but change little by age or period within cohorts. For example, among respondents ages 25 to 34, BMI at age 25, education, exposure to media about obesity, and treatments of obesity-related conditions increased rapidly across cohorts, and the percentage that ever smoked declined (Table 2). By contrast, these indicators changed only slightly by age among the Silent Generation and much less than the observed cohort changes. A small amount of change is to be expected as cohort members die over time and because cohorts but not individuals are followed across the NHANES data sets. We see similar patterns for the other birth cohorts (not shown).
Cohort Mechanisms (Mean or Percentage) by Birth Cohort (Ages 25–34) or Age (Silent Generation) (NHANES II, III, and Continuous; N = 26,184).
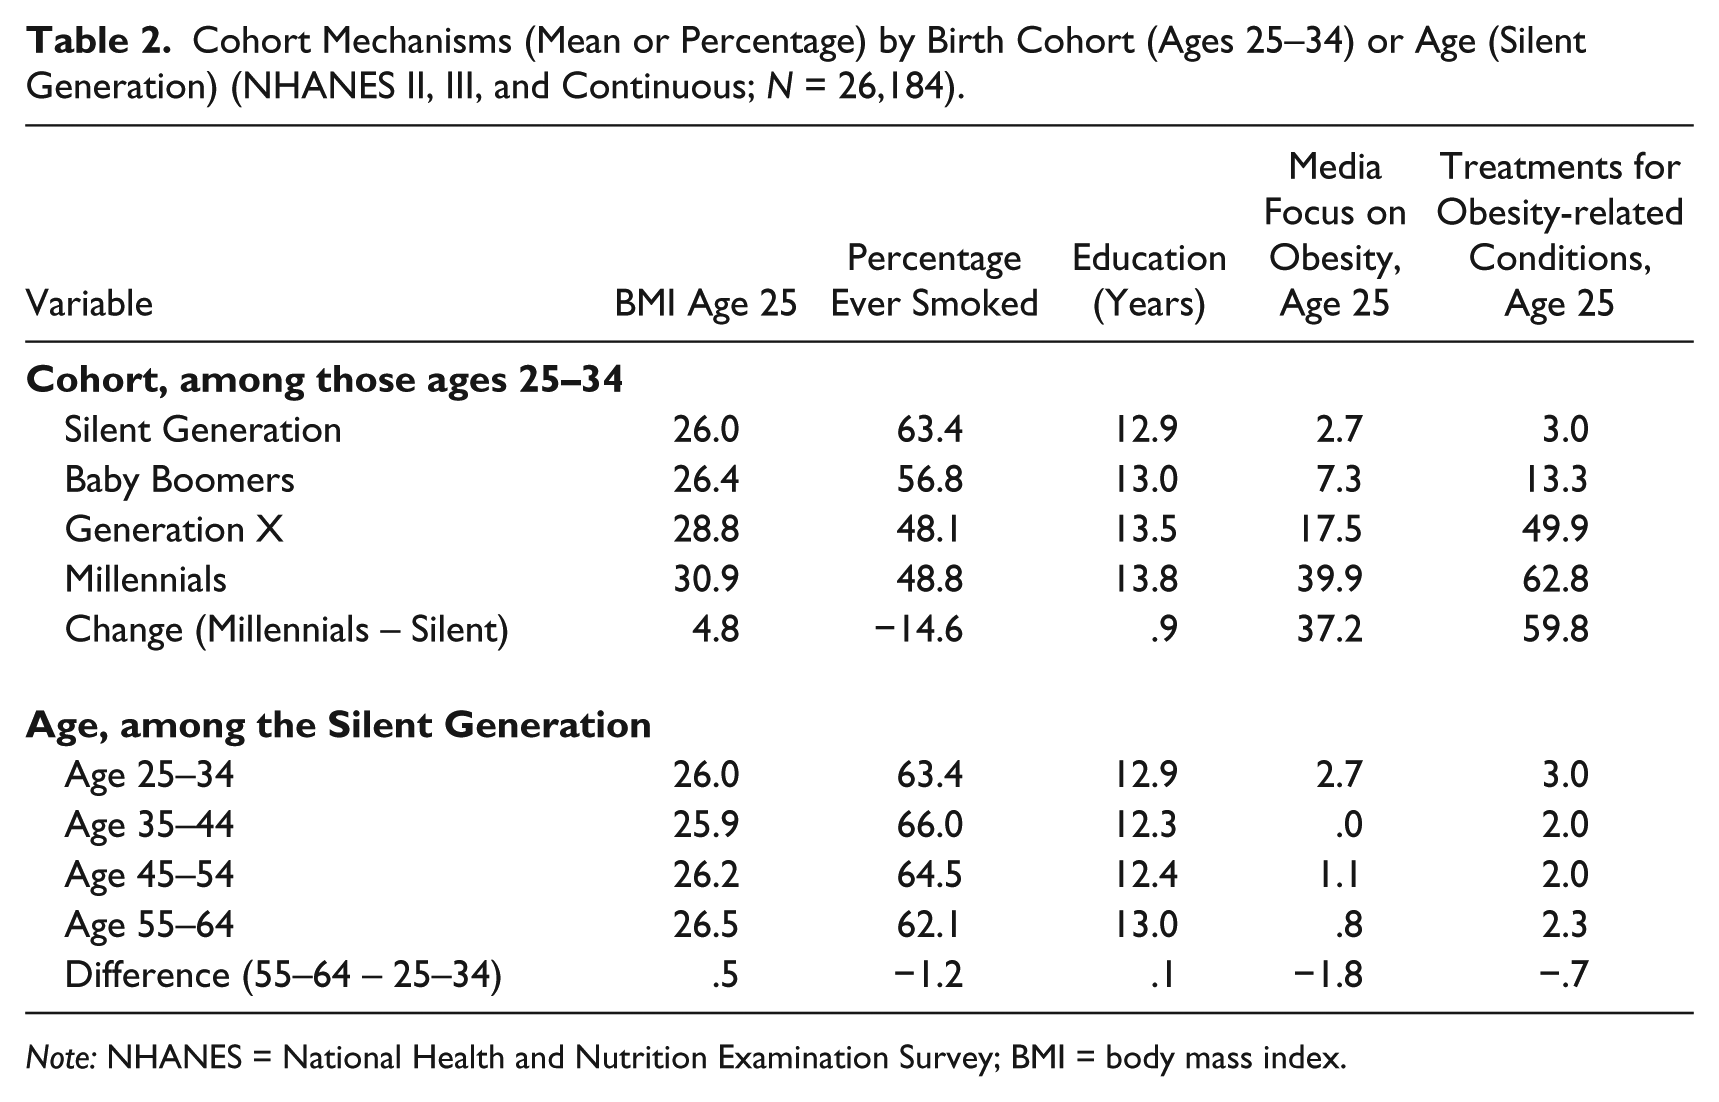
Note: NHANES = National Health and Nutrition Examination Survey; BMI = body mass index.
Controls
We controlled for sociodemographic characteristics, including race-ethnicity (non-Hispanic black = 1), gender (male = 1), and marital status (married = 1). Although our model specified separate intercepts and age, period, and cohort slopes for each of the three weight categories, we controlled for BMI (centered at the mean of each weight category) to account for variations in weight within the three weight categories.
Results
Descriptive Analysis
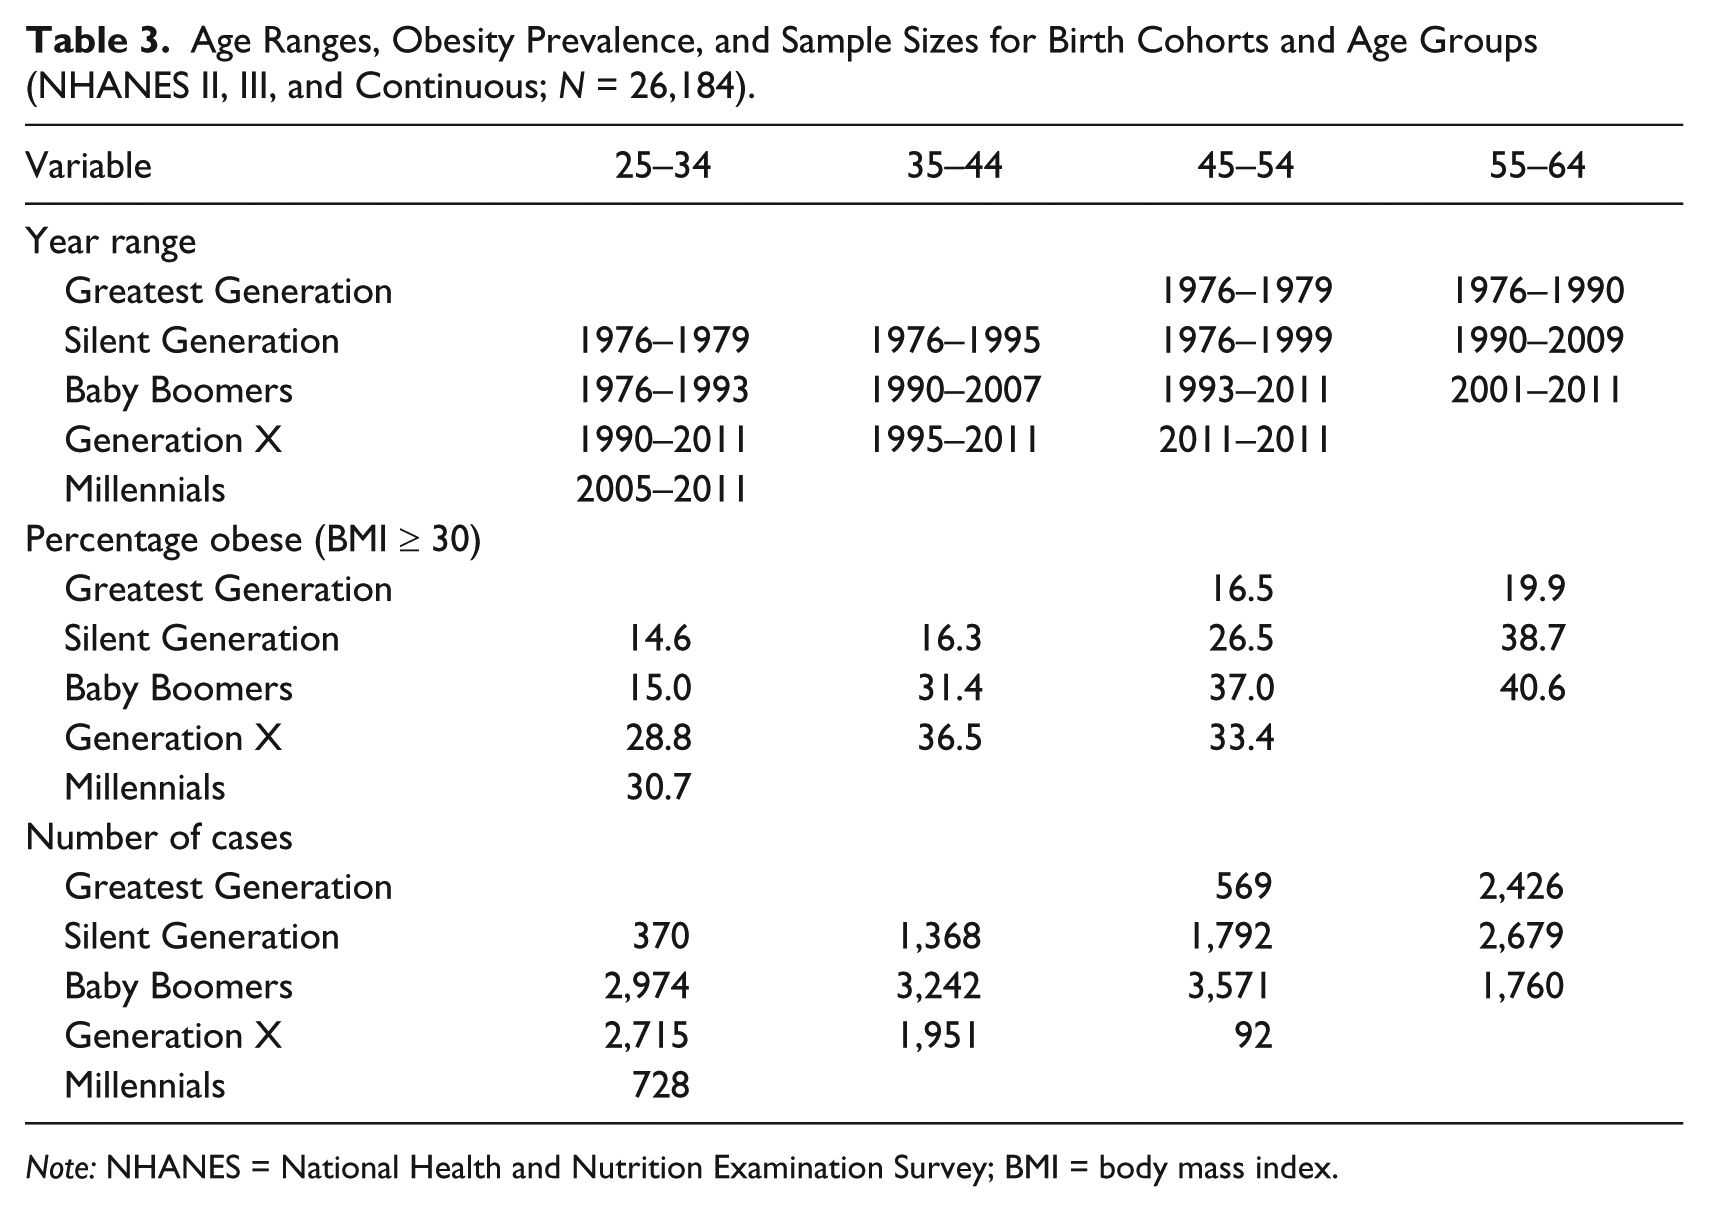
We first examined obesity prevalence among all age groups, birth cohorts, and time periods available for analysis in our data. As shown in Table 3, all of the generations are observed across multiple years and at varying ages. The Greatest Generation is observed in the earliest years of data when those individuals are in the 45-to-54 age range and older. We observe the Silent Generation and Baby Boomers in all years and across all age ranges. Generation X respondents are included from 1990 to 2009 from the youngest to the 45-to-54 age range. Millennials are included in the most recent years in the 25-to-34 age range.
Age Ranges, Obesity Prevalence, and Sample Sizes for Birth Cohorts and Age Groups (NHANES II, III, and Continuous; N = 26,184).
Note: NHANES = National Health and Nutrition Examination Survey; BMI = body mass index.
Examining the percentage obese (BMI ≥ 30) confirms previous research (Allman-Farinelli et al. 2007; Keyes et al. 2010; Reither et al. 2009; Robinson et al. 2012). First, within each age group, the percentage obese increased across cohorts, with the most recently born cohorts (i.e., Generation X and Millennials) having the highest prevalence. For example, among respondents ages 45 to 54, 16.5% of the Greatest Generation were obese compared to 26.5% of the Silent Generation, 37.0% of Baby Boomers, and 33.4% of Generation X. Second, within each generation, the percentage of members who are obese increased with age. For instance, 15.0% of Baby Boomers were obese at ages 25 to 34 compared to 40.6% by ages 55 to 64.
We next explored how these trends are related to SRH. Table 4 presents mean SRH by age, period, and birth cohort and by weight status. Lower mean values indicate worse health. As expected, obese people report worse health than non-obese people, regardless of age, period, or cohort (shown in the first three columns of Table 4, across the rows). Additionally, within weight categories, older people and those born earlier report worse health than younger people and those born more recently.
Mean Self-reported Health (SRH) by Weight Category, Age, Period, and Cohort (NHANES II, III, and Continuous; N = 26,184).

Note: NHANES = National Health and Nutrition Examination Survey.
We observe only modest age, period, and cohort patterns in the gap in SRH between non-obese and obese people (shown in the last two columns of Table 4). The SRH gap between the obese (I and II) and non-obese respondents varies little by age, and the SRH gap between non-obese and obese I narrows only slightly over time and across birth cohorts.
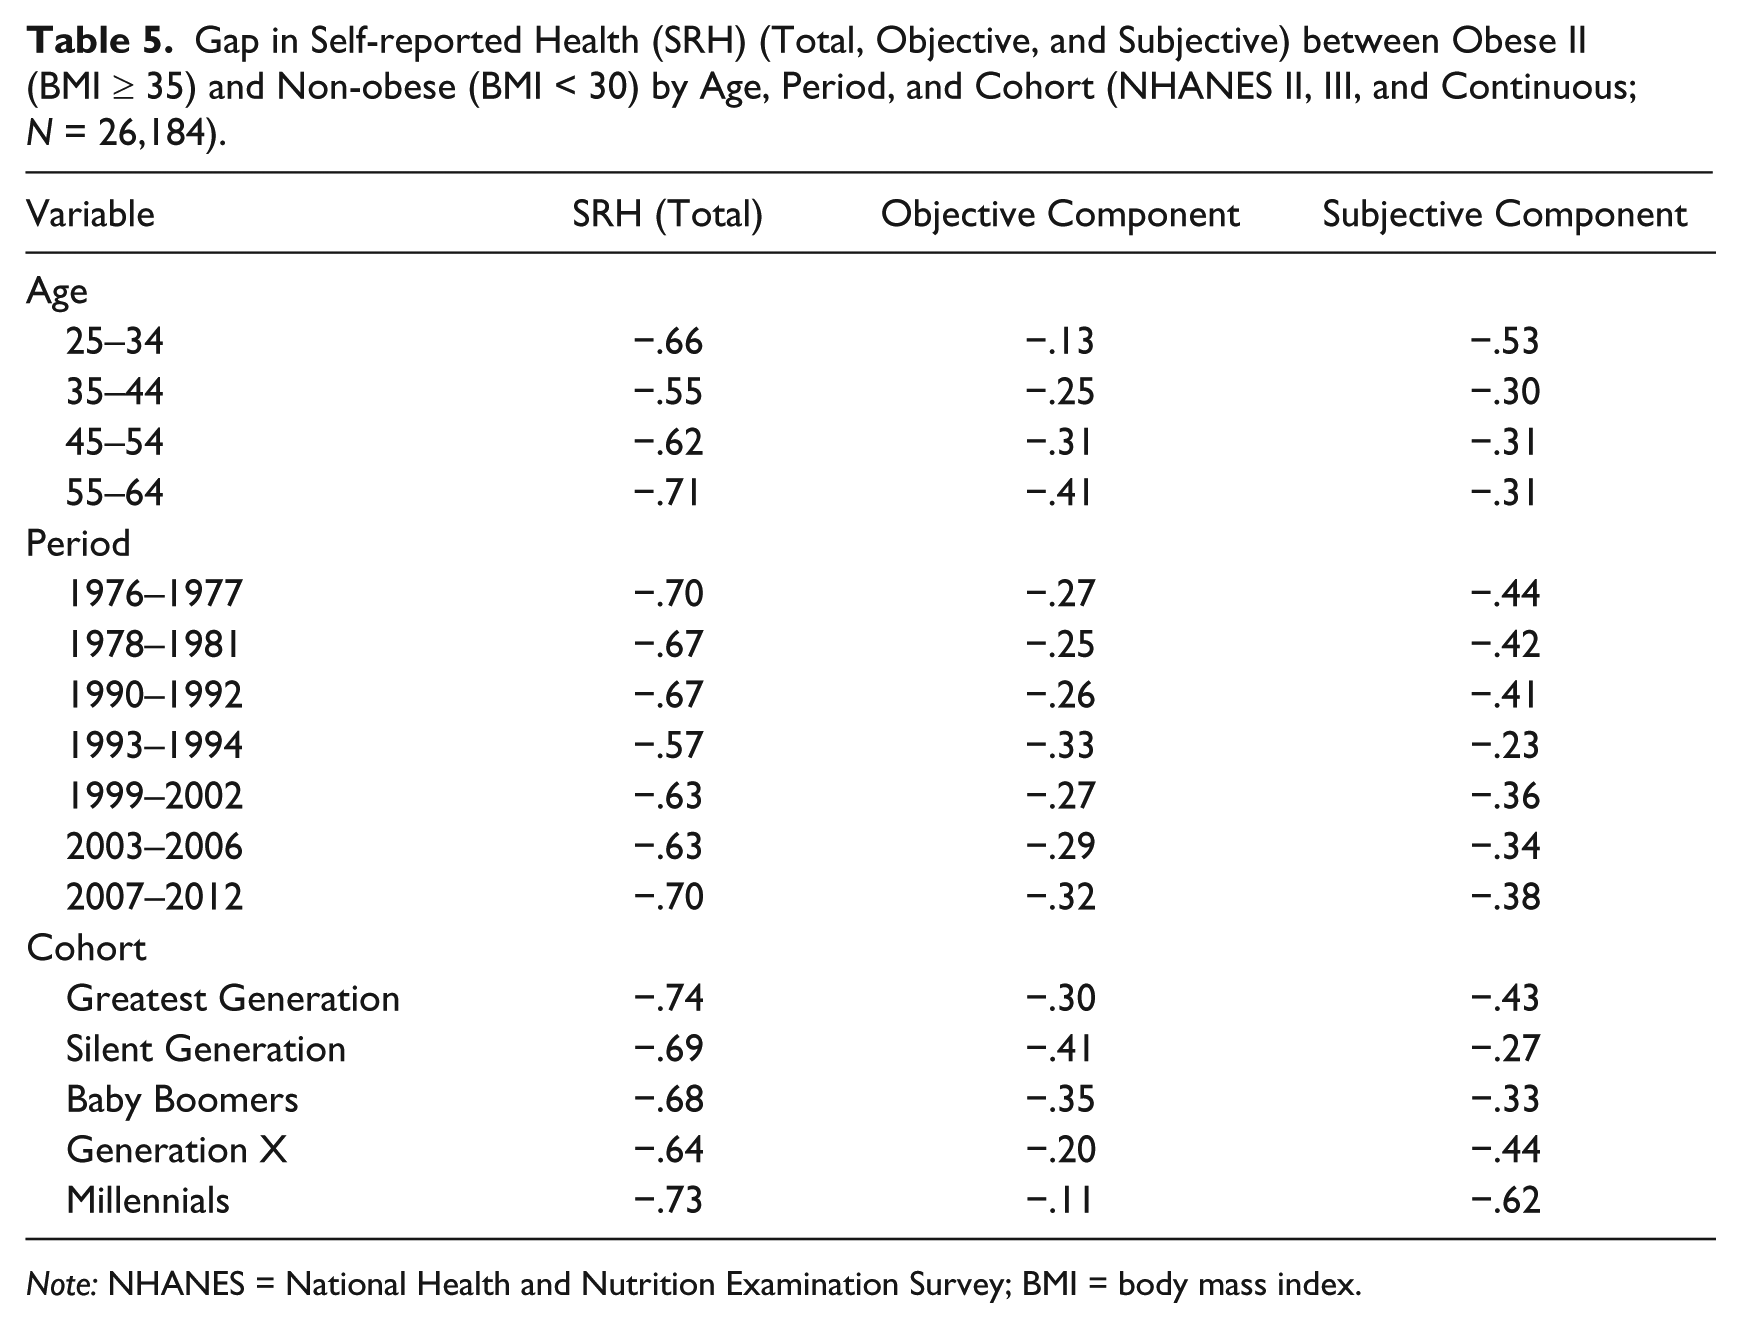
However, these weak age, period, and cohort relationships mask offsetting patterns in objective versus subjective SRH. We repeated the descriptive analysis from Table 4, separately for our measures of the subjective and objective components of SRH. For simplicity, we show only the SRH gap between the non-obese and obese II respondents (full results are available upon request). The first column in Table 5 shows the gap in SRH (repeated from the last column of Table 4), and the second and third columns present the gap in the objective and subjective components of SRH, respectively. Note that the gap in SRH is the sum of the gaps in the objective and subjective components.
Gap in Self-reported Health (SRH) (Total, Objective, and Subjective) between Obese II (BMI ≥ 35) and Non-obese (BMI < 30) by Age, Period, and Cohort (NHANES II, III, and Continuous; N = 26,184).
Note: NHANES = National Health and Nutrition Examination Survey; BMI = body mass index.
The gap in objective SRH between non-obese and obese II respondents steadily widens with age, consistent with the notion that the health impact of obesity worsens with age. Additionally, the gap narrows across birth cohorts and is close to zero for the Millennial Generation, consistent with the expectation that the effects of obesity on physical health have weakened among more recent cohorts due to greater availability of treatments for obesity-related conditions. Unexpectedly, we observed no consistent period effects in the gap in objective SRH.
We see different patterns in subjective SRH. While the gap widens with age for objective SRH, it narrows for subjective SRH. This suggests that younger adults give greater importance to obesity when rating their own health. Also, whereas the gap narrows across cohorts for objective SRH, it widens for subjective SRH, which is consistent with our expectation that recently born cohorts would be particularly likely to consider their weight when rating their own health. Finally, the gap in subjective SRH unexpectedly narrows slightly over time and is particularly narrow in the 1990s, which is the time period when negative messages about obesity were starting to penetrate U.S. media and public health discussions (Saguy 2013).
Multivariate Analysis
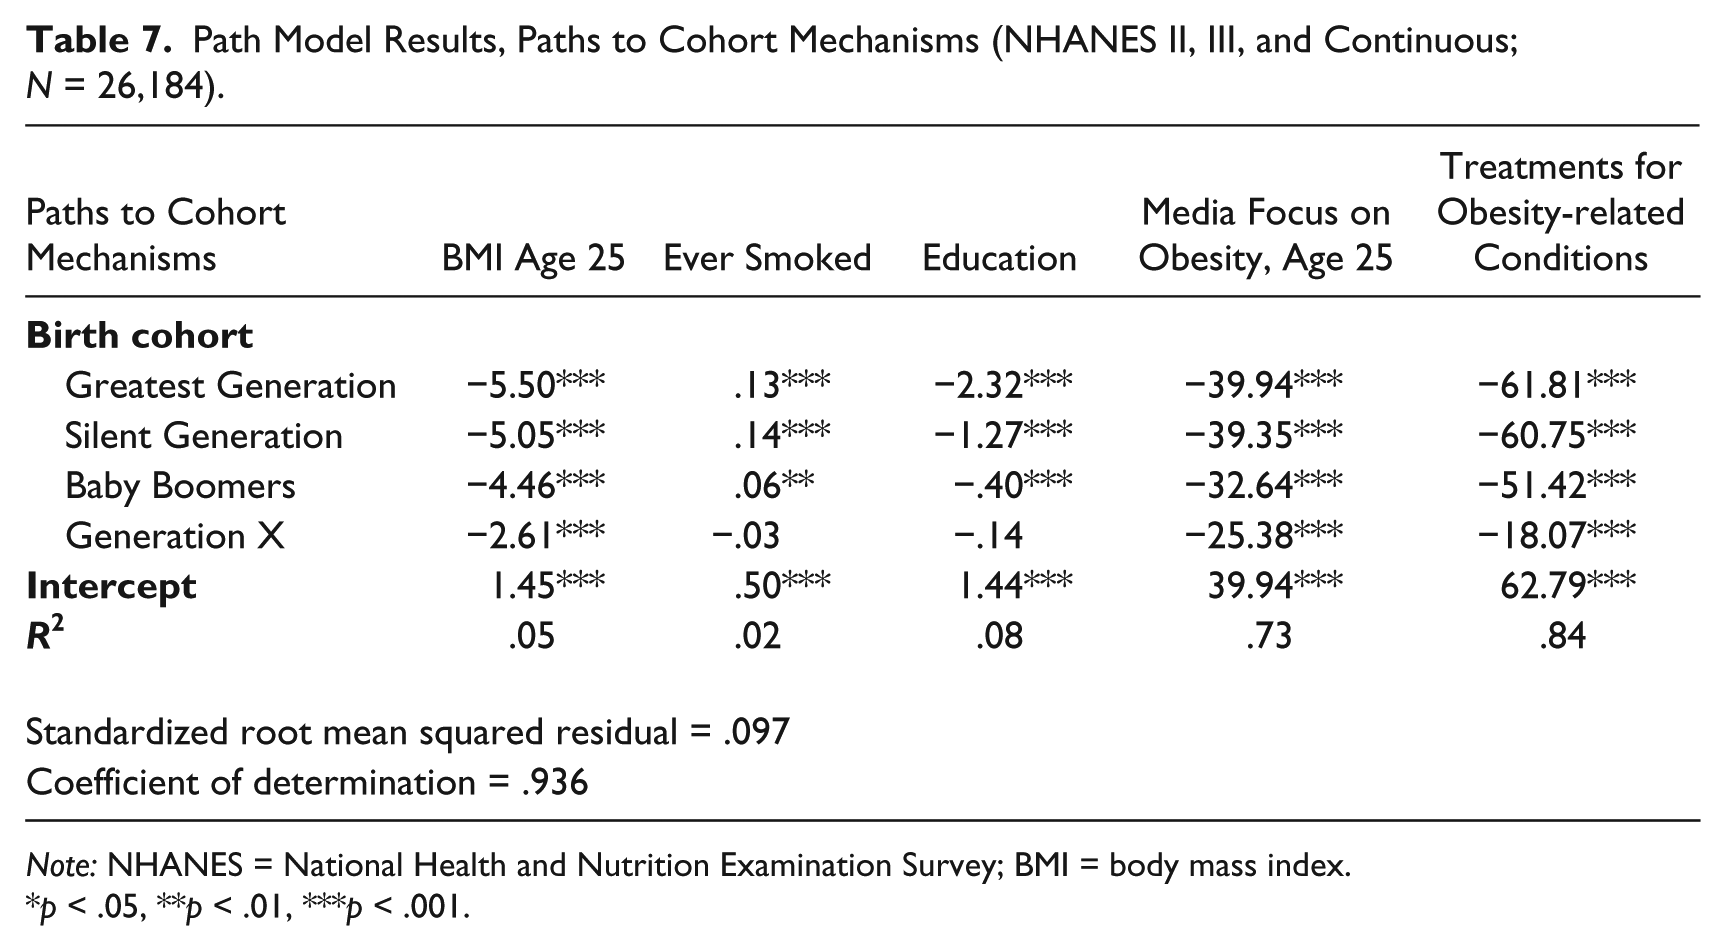
Age, period, and cohort are highly correlated, so it is possible that the descriptive patterns for the gaps in objective and subjective SRH from Table 5 are spurious or suppressed. To refine our analysis, we estimated the mechanism-based path model shown in Figure 1. The model coefficients are shown in Tables 6 and 7. The overall model fits well, with a standardize root square residual less than .1 and a coefficient of determination close to 1.0 (Bentler and Raykov 2000). Also, the coefficients for most of the age, period, and cohort mechanism variables differ significantly by weight category, indicated with the dagger in Table 6. Though one specification is presented, variations of the model produced substantively consistent results. In these sensitivity tests, we varied the detail of the age, period, and cohort categories; altered the set of cohort mechanisms (e.g., with only education and BMI at age 25 as mechanisms, without education and education interactions, with marital status as a mechanism, and with greater detail for smoking behaviors); excluded BMI as a control; and allowed all paths to vary by weight category. Weighted models produced nearly identical results.
Path Model Results, Paths to Self-rated Health (SRH) (NHANES II, III, and Continuous; N = 26,184).

Note: NHANES = National Health and Nutrition Examination Survey; BMI = body mass index.
p < .05, **p < .01, ***p < .001.
Coefficients significantly differ by weight category p < .05.
Path Model Results, Paths to Cohort Mechanisms (NHANES II, III, and Continuous; N = 26,184).
Note: NHANES = National Health and Nutrition Examination Survey; BMI = body mass index.
p < .05, **p < .01, ***p < .001.
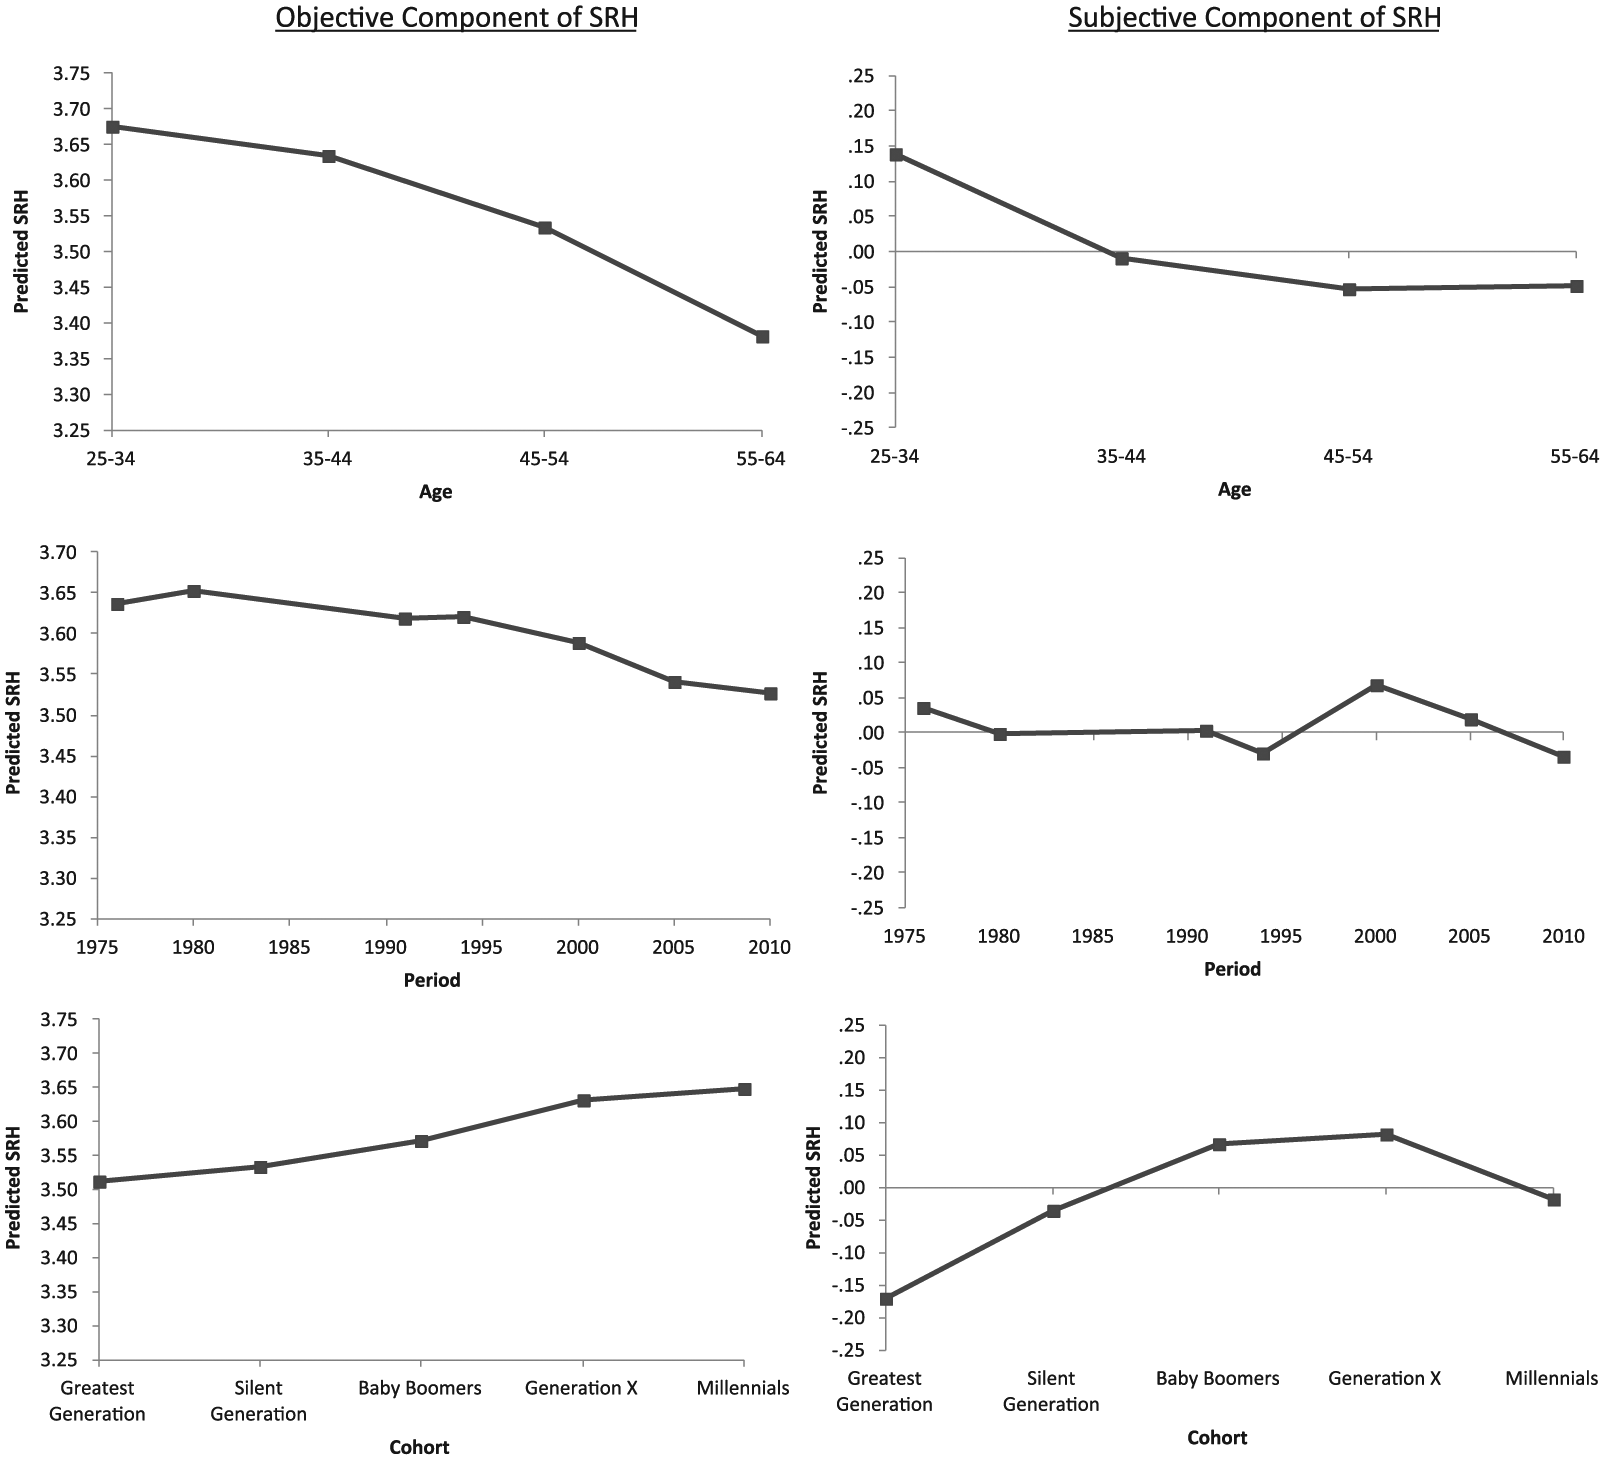
Because the intercepts and coefficients for age, period, and the cohort mechanisms vary by weight category, it is difficult to interpret the results directly. Therefore, we use predicted values generated from the model by substituting mean values for all controls and the other APC variables into the full structural equation model while varying age, period, or cohort, and weight category.
The predicted relationships for non-obese persons provide a baseline for comparison with obese persons in Figure 3. The first column of Table 8 also displays the age, period, and cohort effects along with their significance level (i.e., difference between the first and last age, period, and cohort categories) for non-obese persons. For example, the age effect on objective SRH for the non-obese is –.295 (p < .001), meaning that objective SRH is nearly one third of a point lower for 55- to 64-year-olds compared to those in the 25-to-34 age group. Both subjective and objective SRH declined significantly with age, but the association was stronger for objective SRH (see top panel of Figure 3). Over time, objective and subjective SRH declined significantly, although the change was small in magnitude compared to age differences. Finally, both objective and subjective SRH increased significantly across cohorts (lower panel of Figure 3).

Note: NHANES = National Health and Nutrition Examination Survey; BMI = body mass index; SRH = self-rated health.
p < .10, *p < .05, **p < .01, ***p < .001.
The predicted values in Figure 4 depict the predicted gap in SRH between obese I and obese II and non-obese persons by age, period, and cohort. It is important to understand that negative values in Figure 4 indicate worse health for the obese compared with the non-obese. The x-axis intersects at zero at the top of the charts, so health gaps appear as values dipping below the axis. Additionally, the second and third columns of Table 8 display the age, period, and cohort effects on SRH for those in the obese I and obese II weight categories, and the fourth and fifth columns display the gap from non-obese persons. In general, negative gaps indicate divergence from the non-obese, and positive gaps indicate convergence. For example, the period effect on objective SRH for those in the obese II group is –.332, meaning that SRH declined by about a third of a point from 1976 to 2010. The gap from non-obese (last column) is –.223, meaning that it declined more (by .223 points) for obese II than for non-obese respondents.

The age patterns were consistent with our expectations (top panel of Figure 4). Independent of changes over time or in the cohort mechanisms, the gap in objective SRH widened steadily from the youngest to the oldest age group but was significant only for those in the obese I category and was modest in size, only .091 points. In other words, physical health worsened with age for all three weight groups but slightly more rapidly among those in the heavier weight categories. In contrast, the gap in subjective SRH between non-obese respondents and those in both of the obese weight categories significantly narrowed with age. This is consistent with the notion that young adults, compared with older adults, are more likely to consider obesity when rating their own health net of their actual physical health conditions.
The patterns by time period were inconsistent with our expectations (middle panel of Figure 4) that the gap would narrow for objective SRH and widen for subjective SRH. Instead, the gap in objective SRH widened significantly. Physical health declined faster over time among obese than among non-obese persons. Additionally, the gap in subjective SRH narrowed slightly but significantly only for the obese I group.
Independent of these age and period effects, the results (based on the relationship of the cohort mechanisms with the outcomes) suggested that objective SRH converged across cohorts (lower panel of Figure 4). As shown in Table 8, this convergence is due to the fact that, although objective SRH increased across birth cohorts for all weight categories, it increased more among the obese such that they reached parity with the non-obese among the most recently born cohorts. In contrast, subjective SRH worsened more among the obese II category relative to the non-obese (difference is marginally significant, p = .08). This is consistent with the idea that recently born cohorts are more likely to consider their weight when rating their own health compared with earlier cohorts.
To help interpret the cohort effects, we estimated all indirect paths connecting cohort to SRH through each of the cohort mechanisms (shown in Table 8). The increasing availability of treatments for obesity-related conditions accounts for most of the convergence in objective SRH between obese II and non-obese respondents. This factor was associated with better objective SRH for all weight categories, and the effect was much greater for heavier people, as would be expected. It increased SRH by .435 points among those in the obese II group compared to .152 among the non-obese.
Surprisingly, BMI at age 25 did not play a role in explaining cohort differences in objective SRH. BMI at age 25 increased across birth cohorts, and it was related to worse objective SRH, but the effects were no worse for respondents who were currently obese than for non-obese respondents. Moreover, its negative effects were overshadowed by the positive effects of rising education and the availability of treatments for obesity-related conditions. Estimating the model separately by weight status or dummy coding BMI at age 25 to indicate obesity status did not change the results.
In contrast to the objective component of SRH, the gap in subjective SRH widened across cohorts due to educational attainment. Education increased across cohorts and was associated with better health ratings for all weight groups. However, the association was stronger for the leaner weight groups than for those in the heaviest weight category. Media focus on obesity was also associated with worse subjective SRH among obese II respondents but did not contribute significantly to the growing gap in subjective SRH.
Discussion
Despite the strengths of SRH as a measure of health, there are concerns about the factors individuals consider when rating their health. In this study we examine how the obesity–SRH association varies across age groups, periods, and cohorts while using a mechanism-based approach to estimate APC models.
Our results highlighted the multidimensionality of SRH. By decomposing SRH into objective (physical health) and subjective (evaluative) components (Hardy et al. 2014), patterns emerged that were obscured by the overall SRH measure. Specifically, when assessing the difference in overall SRH between non-obese and obese adults, we found that obese adults rate their health more negatively than non-obese adults. Additionally, there was little variation in the difference in overall SRH between non-obese and obese adults by age, period, or cohort. But when we examined the SRH gap using the objective and subjective dimensions of SRH, the gap widened with increasing age for objective SRH but narrowed in the case of subjective SRH. Additionally, the gap narrowed for more recently born cohorts in the case of objective SRH but widened in the case of subjective SRH. Overall, the results suggest that the link between obesity and objective SRH is stronger among older adults and those born in earlier time periods, and the link between obesity and subjective SRH is stronger for younger adults and more recently born cohorts. These results bolster research supporting the multidimensionality of SRH (Jylha 2009; Layes, Asada, and Kephart 2012) as “subjective and evaluative” (Kaplan and Baron-Epel 2003; Shields and Shooshtari 2001; Singh-Manoux et al. 2006). In our sample, different cohorts and people at various ages emphasized obesity differently.
These results also show that the relationship between obesity and objective and subjective SRH is socially patterned. With the exception of our expectations about time period, the results confirmed many of our expectations. In the case of objective health, obesity was a more important predictor for older than for younger adults (who have accumulated health problems over years of exposure to obesity) and for earlier-born cohorts than for younger cohorts (more adept at managing obesity-related health conditions). Interestingly, recently born cohorts do not suffer the greatest health risks of obesity due to greater prevalence of childhood and early adult obesity: BMI at age 25 did not significantly mediate cohort effects on objective SRH. Instead, widespread availability of pharmaceutical treatment options for obesity-related conditions accounted for much of the convergence in objective SRH across birth cohorts, although we caution that unmeasured factors associated with the introduction of new drugs may have also contributed to the convergence. In the case of subjective health, obesity was more important for younger than for older adults (who may focus more singularly on this condition) and for recent than for earlier cohorts. This cohort effect operated through rising levels of education.
The fundamental-causes-of-disease (FC) theory provides a framework for understanding the emergence of a health risk, like obesity. FC theory suggests that health gradients emerge as knowledge about health risks and treatment increases but flatten when treatment options saturate the population (Link et al. 2008; Omran 1971; Phelan et al. 2004). Arguably, the accessibility of treatment options for obesity-related diseases has reached a threshold, minimizing the impact of obesity on objective SRH across cohorts. With more pharmaceutical treatment options, recently born cohorts are able to manage the comorbidities associated with obesity that impact their objective SRH.
FC theory also suggests that those with the most resources (i.e., education) or social status will be the most likely to adopt new health-related ideas (Link 2008). In other words, the definition of a condition as a health risk is likely to instigate differential responses, with the highest status being early adopters of new ideas. Consistent with this idea, our results show that more recently born, highly educated cohorts are more likely to emphasize the role of obesity on their subjective SRH than earlier cohorts.
The contribution of this study to the literature on SRH and obesity should be considered within its limitations. First, we singularly measure SRH based on one set of conditions. Nevertheless, objective SRH includes the range of chronic health conditions consistently available across the data. Sensitivity tests including additional predictors of SRH (smoking behaviors and medications) obtained nearly identical results but do not preclude the importance of potentially omitted conditions, such as mental health. Though objective health indicators are often the strongest predictors, SRH captures dimensions of a respondent’s mental well-being that may be objective (clinically diagnosed) or subjective (Shields and Shooshtari 2001; Singh-Manoux et al. 2006). Because mental illness is not included in the prediction of SRH, it is treated as a subjective component. Future decompositions of SRH may consider mental health as a third component. Similarly, because different groups base their SRH on different criteria and the meaning attributed to conditions varies (Hardy et al. 2014; Krause and Jay 1994; Lindeboom and Van Doorslaer 2004; Shmueli 2003), decomposing SRH on the same conditions across age, period, or cohorts raises concerns of reporting heterogeneity (Dowd and Zajacova 2010). The reporting heterogeneity may then be reflected as measurement error in subjective SRH. To alleviate these concerns, we included respondent death within five years of the NHANES survey in the SRH prediction model, as mortality arguably has the same meaning across groups. The substantive findings remain unchanged.
Additionally, despite 36 years of cross-sectional data, ideally we would follow adults longitudinally to assess how SRH assessments change over time and across cohorts as obesity increases. Also, BMI, a reliable body fatness tool (Centers for Disease Control and Prevention 2011), may be less precise than measures strongly associated with objective health, such as waist-to-hip ratios. Nevertheless, respondents generally know their body weight, so BMI category may be more readily factored into SRH evaluations.
Finally, population heterogeneity adds complexity to the obesity–SRH association. The prevalence of obesity and SRH vary by subpopulations; therefore, the obesity–SRH association likely varies. Blacks have higher BMIs (Ogden et al. 2006) and report poorer health than whites (Cagney, Browning, and Wen 2005; Farmer and Ferraro 2005); and women typically assess their health status more negatively than men, and obesity has more negative implications for women’s SRH than for men’s (Katz, McHorney, and Atkinson 2000; Okosun et al. 2001). However, we are unable to test the role of population heterogeneity on our findings due to limited sample sizes when the data are divided by cohort, BMI, and gender or race.
Our findings on the obesity–SRH association remain noteworthy. Prior SRH research highlighted the need “to both be clear about what kind of health we are talking about, and be ready for the possibility that different types of health behave in very different ways” (Apouey and Clark 2014:22). By separating subjective from objective SRH and considering age, period, and cohort effects, we illustrated these complexities. Indeed, the association between obesity and SRH’s subjective and objective components are distinct and operate differently by age and cohorts, suggesting important shifts in U.S. adults’ conceptualizations of health over the past four decades. Future research on the obesity–SRH association must account for the differential role of treatments and educational attainment for various age groups and birth cohorts.
Footnotes
Funding
This research was partially supported by the National Institutes of Health, which provides infrastructure support funding to the Population Research Institute at the Pennsylvania State University (R24 HD041025).