
Abstract
The onset of disability is believed to undermine social connectedness and raise the risk of social isolation, yet spatial environments are seldom considered in this process. This study examines whether unruly home and neighborhood conditions intensify the association between disability onset and several dimensions of social connectedness. I incorporate longitudinal data from the National Social Life, Health, and Aging Project, which contains environmental evaluations conducted by trained observers (N = 1,558). Results from Poisson, ordinal logistic, and linear regression models reveal heterogeneous consequences of disablement: disability onset was associated with reduced core network size, fewer friends, lower likelihood of social interaction, and less overall social connectedness—though mainly when accompanied by higher levels of household disorder. There was limited evidence that neighborhood disorder moderated consequences of disability. Findings point to the importance of the home as an environmental resource and underscore important contextual contingencies in the isolating consequences of disability.
Social connection is at the heart of successful aging. Older adults with strong social networks rate their health more favorably, are at lower risk of depression, and live longer lives than their more isolated peers (Cornwell and Waite 2009; Litwin and Shiovitz-Ezra 2006; Matt and Dean 1993; Vanderhorst and McLaren 2005). Yet for many seniors, functional decline poses a significant challenge to preserving social connection. Recent research, for instance, indicates that disabled seniors are about 30% more likely be inactive in social organizations and nearly twice as likely to see friends and relatives only infrequently relative to their mobile, nondisabled peers (Rosso et al. 2013). Still, longitudinal studies that capture the onset of disability are surprisingly rare, especially those using representative samples of American adults (Janke, Davey, and Kleiber 2006).
Existing research on disablement and social connectedness has also yet to address how residential, contextual factors shape the consequences of disability onset. This is a significant oversight because localized social spaces—their physical characteristics in particular—constrain or promote seniors’ social interaction (Cornwell 2016; Krause 1993). The salience of material environments is only magnified, moreover, amid diminished physical capacity (Lawton and Nahemow 1973). A context-blind analysis on the consequences of functional decline has no way of observing potentially divergent pathways in the disablement process. Indeed, home and neighborhood are environmental resources that likely alter the consequences of disability. If conducive to social connectedness, spatial characteristics can cushion the otherwise detrimental effects of functional decline. Further, home and neighborhood are the very spaces in which older people spend much of their time, particularly once they have exited the labor force, occupy fewer other social roles, and experience mobility problems. A context-attuned analysis recognizes the importance of these environments as both resources for and the setting of a socially connected life.
There are various ways to conceptualize an environment’s suitability for social connectedness in its role as a moderator of the association between disablement and social network–related outcomes. This article focuses on environmental disorder, the sense in which physical conditions appear chaotic, unpredictable, and threatening (Ross and Jang 2000; Ross, Mirowsky, and Pribesh 2001). Such states of deterioration are thought to reflect a lack of social cohesion/control and to foster mistrust of others (Ross and Jang 2000; Sampson and Raudenbush 1999). Neighborhood physical disorder, reflected by features such as rundown buildings, conspicuous trash, and foul smells, is an emblematic construct from the early Chicago school of sociology (see Sampson 2009), revived more recently by scholars of health and social behavior who argue for the deleterious mental health consequence of living in chaotic conditions (Ross et al. 2001; Ross and Jang 2000). Recent research has extended the analysis of environmental disorder to the household context, indicating that physical features such as clutter, poor lighting, and filth likewise induce stress, create interpersonal strains, and can lead to a resident’s withdrawing from the outside world (Cornwell 2014, 2016). Studies that compare the relative importance of home and neighborhood disorder find that the former seems especially important for the well-being of older adults (e.g., Schafer and Upenieks 2015).
The main research question for this study is whether the onset of disability has its most pronounced consequences for social connectedness amid conditions of high home and/or neighborhood disorder. Exposure to disorderly conditions can hasten and intensify the disablement process (Clarke et al. 2008), but it remains unclear whether environmental conditions interact with disability onset to influence seniors’ social relationships and activity. Residential placement is directly shaped by the dynamics of social stratification, and so I examine the role of environmental disorder while accounting for factors such as race-ethnicity and socioeconomic position.
Recognizing the multidimensionality of connectedness, I also examine three distinct aspects of social connectedness in addition to a more global assessment of the construct. The size of one’s close social networks reflects access to a set of intimate confidants who can be counted on for emotional support and who exert normative influence (Marsden 1987). This core set of ties is also the most durable and would be more likely to withstand the challenges of health limitations than weaker types of ties. A person’s broader set of friends captures access to some durable, emotionally close associates but also those social ties that are outside the core network and that connect people to social resources beyond their own close confidants. At least in the U.S. context, having friends appears to confer unique advantages for well-being that older adults cannot capture from having only kin-based network ties (Fiori, Antonucci, and Cortina 2006; Park, Smith, and Dunkle 2014). Indeed, nonfamily relationships are based primarily on shared interests and rewarding activity, factors that enhance people’s sense of enjoyment and life meaning (Larson, Mannell, and Zuzanek 1986). Finally, frequency of socializing denotes the extent to which people actually connect with those people they identify as part of their social circle. Though there appears to be some benefit to merely perceiving that one has available relational resources (Uchino 2009), supports such as instrumental assistance and companionship require person-to-person interaction. Likewise, the self-esteem and identity-enhancing benefits of social relationships may be stronger if those roles are more actively maintained. Taken together, these three aspects of social connectedness allow a comprehensive assessment of whether—and where—the onset of disability leads to isolation.
Background
Functional Health and Connectedness
A wealth of research investigates the link between functional health and social connectedness, most of it examining whether and how social relationships protect people from functional limitations and slow the progression of disability (e.g., Mendes de Leon et al. 2001; Mendes de Leon, Glass, and Berkman 2003). Complementing such studies where functional health is the dependent variable, researchers have become increasingly attuned to how health problems challenge people’s ability to form and maintain social relationships (Cornwell 2009; Haas, Schaefer, and Kornienko 2010). Such is the approach of this article.
There are at least three theoretical reasons why functional health decline, in particular, would curb social connectedness. First, functional limitations make it difficult to get out and about. A recently disabled person may want to maintain his or her previous level of social connectedness but have to scale back efforts to visit friends, entertain guests in his or her home, go to church, or volunteer in the community. Most existing studies reporting that functional health problems restrict social activity are guided by this reasoning (e.g., Janke et al. 2006; Rosso et al. 2013). Second, functional decline may signal the onset of frailty and an accelerating nearness to death (Guralnik et al. 1991), the realization of which could circumscribe people’s social priorities. Indeed, socioemotional selectivity theory proposes that when people have limited time horizons, they tend to prioritize strong, emotionally fulfilling relationships and discount the value of other social contacts, ultimately winnowing down their social networks (Carstensen, Fung, and Charles 2003). Third, some component of people’s social connectedness is out of their own hands. Status-oriented theories emphasize how health problems can be stigmatizing and unappealing to would-be confidants and friends (Haas et al. 2010). In the case of disablement, relatively healthy friends or relatives also must often make “downward adjustments” to accommodate the routines or specialized needs of the less healthy party (Schafer 2015:101). Some members of a newly disabled person’s network may be disinclined to make these efforts—and, sensing that such dynamics were underway, the focal individual may withdraw to avoid the strain of an unreciprocated tie. It is important to note that these three explanations cannot be disentangled in most empirical studies, including the current research. But neither are these mutually exclusive processes. All else equal, each theoretical mechanism would yield a net reduction in network size and overall contact with friends and relatives.
Neighborhood and Home
Ecological theory extends the foregoing discussion by suggesting that the effects of disablement on social connectedness cannot be understood without reference to the home and neighborhood environments in which people live. Broadly speaking, ecological theories of aging propose that well-being is a function of people’s competencies, their physical environment, and the interaction between these two factors (Lawton and Nahemow 1973). In this so-called competence-press model, aging well is optimized when the level of environmental “press” (i.e., demandingness) fits a person’s physical and cognitive ability; demands that exceed capacity are stressful and disempowering, while too little environmental stimulation frustrates those with high competence. The current study draws out several insights from ecological theory in testing whether environmental disorder moderates the association between disablement and social connectedness.
Most importantly, ecological theory depicts environment as a resource, albeit one inextricably intertwined with personal attributes, such as functional health (Wahl, Iwarsson, and Oswald 2012). Environmental resources offset or magnify the effects of low competence. Taking the case of the neighborhood, we can assume that someone with a functional limitation would find it more challenging to venture out of his or her home and visit others if the block seemed chaotic than if it conveyed an orderly appearance (see Abramson 2015:57). Conditions in the neighborhood that may have once been mildly unpleasant—uneven sidewalks, heavy traffic, scattered litter—can become full-blown environmental hazards that less competent people purposefully avoid. This would ultimately deter neighborly contact and community participation. Just as crucially, the mobility problems associated with disability likely affect where people can go to socialize (Rosso et al. 2013) and thereby govern who goes to see whom in a network of relations. A newly disabled senior who wished to stay socially connected would now depend more heavily on visits from friends and relatives than when she could move about relatively freely. If hers was an orderly neighborhood, barriers to dropping in would be relatively low. The recently disabled resident of a more disorderly block, however, would have to draw her social ties into a comparatively unpleasant environment. In the orderly neighborhood scenario, the block is a resource that minimizes the challenges of functional decline; for the latter, it is a liability that exacerbates them. The environment-as-resource perspective can also be applied to the household. All else equal, becoming disabled should decrease the ability to go visit others and increase one’s reliance on his or her living space to sustain a connected life. Though potentially serving as a signal that one needs increased assistance or support, disorganized home conditions could well be a deterrent to inviting people inside. And from the perspective of friends and relatives, odor, dirt, and disarray are unlikely to incentivize a visit.
In these ways, local environments are more than mere resource to be deployed; they are themselves the very setting of most social interaction. Accordingly, different layers of the immediate environment may have implications for different forms of social interaction. Interior home spaces, in particular, represent the “backdrop for some of the most long-standing and meaningful relationships in individual’s lives” (Cornwell 2016:871). The home can function as a general hub for social interaction, yet as a private space it can also conceal that which is indecorous or awkward from the outside world (see Dyck et al. 2005). Weaker social ties (nonresidential ties, especially) have the least access to this intimate area and would therefore be especially unlikely to withstand combined conditions of disablement and disorder. Close friends and family represent the convoy of relations most motivated to sustain interaction with a disabled adult—disorderly home (and/or neighborhood) or not. Yet in so doing, these ties would inevitably be confronted with interior household conditions. Depending on the extent of its disorganization, home conditions could ultimately trim down even the size of people’s intimate networks to its most central core. In some cases, it could even threaten relationships among co-residents jointly producing household (dis)order. Prior research hints at these processes, indicating that household disorder simultaneously decreases the proportion of nonkin members within seniors’ core networks and produces tension in existing family relationships (Cornwell 2016). For these reasons, I expect that household disorder will magnify the isolating consequences of disability; this should be reflected in people’s overall friendship network size, their total extent of socializing with a broad range of people, and even the size of their core networks.
Neighborhoods are another important setting for informal social support, in large part by connecting seniors to the weaker ties who fill out their broader network of friends and who provide the satisfying daily encounters that foster a sense of place (Gardner 2011). In distinction to private spaces, such as the home, neighborhoods represent an archetypal “third place,” neutral grounds on which people can talk casually and informally congregate (Oldenburg 1989). Block conditions, in turn, may be more important for meeting new acquaintances and forming and maintaining varied friendships through shared activity than for sustaining core network ties after disability onset. Further, the neighborhood is in many ways a more public extension of the home, especially in the so-called threshold spaces, such as patios, backyards, and porches, that connect private dwellings to the outside world (Peace, Holland, and Kellaher 2005). A disorderly neighborhood could make less functional or appealing these settings of day-to-day social contact that otherwise facilitate interaction with broader friendship networks. And again, these spaces should become all the more significant when mobility limitations circumscribe one’s spatial radii. Disorderly neighborhoods, apart from disability, are associated cross-sectionally with smaller core networks (Cornwell and Behler 2015), and so block conditions could magnify the effects of disability onset for this outcome. At the same time, the durability and intimacy of existing core network ties imply a shared history and the familiarity and willingness to interact with someone on their “home turf.” The incidence of disability may not make the neighborhood a suddenly salient factor, at least not when household conditions are relatively well ordered. Therefore, it is possible that disorderly neighborhood conditions matter more for size of global friendship network and the overall extent to which people socialize with others than they do for core network size.
A final and important consideration for home and neighborhood contexts is their connection to social stratification. As with other resources that help people cope with unfavorable life events, environmental contexts are unequally distributed. Whether due to discrimination in home lending practices, political marginalization, a sense of powerlessness derived from exposure to chronic stress, or other factors, racial minorities and those in low socioeconomic standing are disproportionately exposed to both neighborhood and household disorder (Cornwell 2014; Frumkin 2005). For these reasons, it is important to account for race and socioeconomic position when examining the interactive association between disablement, environmental disorder, and social connectedness.
Summary of Hypotheses
Drawing from past research on functional decline and social connectedness, I first hypothesize that disability onset is associated with a decrease in the size of older adults’ core networks, fewer friends, and less interaction shared with social contacts (Hypothesis 1). The central hypotheses, however, incorporate perspectives from ecological theory and lead me to anticipate that home and neighborhood conditions will moderate the consequences of disablement. I anticipate that disorderly neighborhoods and disorderly homes will magnify the effects of disability on each aspect of social connectedness (Hypothesis 2).
Though the hypotheses could be framed as theoretically informed causal assertions, it is important to recognize that the current study cannot identify cause-and-effect relationships. One basic analytic assumption is that environmental conditions (proposed moderating variables) are exogenous factors, not themselves outcomes produced by disability. This assumption fits with the classic competence-press theoretical framework, which emphasizes how people adapt to external environments. But in reality, the environment may be endogenous to the disablement process because people have a role in shaping their space—at least for the home, over which they have some direct control. If disability is conceptualized as difficulty with tasks of everyday life (Katz and Stroud 1989), then it stands to reason that disabled people would have trouble tending to their household and producing an orderly space. Thus it may be that disablement would trigger increased household disorder over time. Whether environmental conditions are fully exogenous or to some extent endogenous, the expectation is that disability will be less isolating in the most orderly environments. In any event, analyses will scrutinize the extent to which disablement appears to shape changes in household disorder.
Data and Methods
Sample
The National Social Life, Health, and Aging Project (NSHAP) is a fitting source of data for the current study. As a nationally representative study of about 3,000 adults initially ages 57 to 84, the NSHAP provides an opportunity to study several hundred men and women who experienced the onset of disability. Further, the NSHAP includes multiple measures of social connectedness and unique interviewer-based environmental assessments.
NSHAP participants were recruited through a multistage area probability design. Respondents were first surveyed in 2005/2006 (hereafter, Wave 1) and living participants were recontacted in 2010/ 2011 for follow-up interviews (Wave 2). Total response rate for Wave 1 was 75.5%. For respondents who completed Wave 1, 2,261 (75.2%) participated at Wave 2. The NSHAP incorporated two modes of data collection, an in-home interview and a leave-behind self-administered questionnaire (SAQ). Most data used in the current study were derived from the in-person interview, though one dependent variable and one covariate were measured in the SAQ. 1 The analytic sample for the current study included those respondents who reported no difficulty with activities of daily living (ADLs) at Wave 1 (n = 1,558), as the aim is to document how social connectedness changes after disability onset. The majority of analyses, then, focused on that sample subset “at risk” of disablement. Number of cases used in final analyses varied slightly depending on extent of missing data for the relevant dependent variable (n = 1,552, 1,532, 1,532, and 1,558 for analyses of core network size, total number of friends, overall social interaction, and social connectedness summary scale, respectively).
Dependent Variables
Each dependent variable was measured identically at Wave 1 and Wave 2. Core discussion networks (core networks for short) were measured with a standard name-generator technique in which participants were asked to list the people with whom they discussed important matters. If a spouse or partner did not appear on this initial list, respondents were asked about their partnership status. Spouses or romantic partners were then added to the network roster. Finally, participants were asked if there was “anyone (else) who is very important to you.” Individuals identified were then added to the roster. Core network size is a summary measure of how many alters the respondent named during this procedure. Number of friends was proxied by the following question: “About how many friends would you say that you have?” Response categories included none, one, two to three, four to nine, 10 to 20, and 20+. Overall social interaction was measured by the following question: “In the past 12 months, how often did you get together socially with friends or relatives,” for which the possible responses were (reverse-coded to) never, less than once a year, about once or twice a year, several times a year, about once a month, every week, and several times a week. Additional analyses ascertained whether moderation patterns held when social connectedness was operationalized by a summary scale that captured multiple dimensions of social relationships and social activity. Following Cornwell and Waite (2009), I standardized and averaged the following variables: (1) core network size; (2) network range, that is, how many distinct social roles are captured in the core network; (3) proportion of core network that resides with the respondent (reverse-scored); (4) number of friends; (5) frequency of volunteering; (6) frequency of attending religious services; and (7) frequency of interacting with friends and family. 2
Independent Variable
NSHAP respondents were asked at both waves whether they had “no” or at least “some” difficulty with seven ADLs (Katz and Stroud 1989). Respondents who at Wave 1 reported no difficulty walking a block, walking across a room, dressing, bathing/showering, eating, getting in our out of bed, or using the toilet were considered “at risk” of experiencing disablement by Wave 2. Such participants who indicated that they had some level of difficulty or were unable to do any of the seven activities were denoted with a score of 1 for “disability onset” (all others scored 0).
Disorder
Home and neighborhood disorder was measured by trained observers following the principles of systematic social observation as developed in the Project on Human Development in Chicago Neighborhoods (Sampson and Raudenbush 1999). Strengths of this method include not having to rely on respondent self-reports and the minimization of response burden for study participants. At the end of each in-home questionnaire, interviewers completed a field interviewer questionnaire (FIQ) to capture the environmental context of the interview. Household evaluations were conducted at both NSHAP waves, though neighborhood ratings were introduced at Wave 2. To facilitate use of both environmental observations, the analysis focused on Wave 2 FIQ data (though supplementary analyses used both waves of household FIQ ratings; see note 9).
For the household, interviewers were first asked, “How well kept is the building in which the respondent lives?” Response options ranged from 1 = “very poorly kept (needs major repairs)” to 4 = “very well kept.” The responses were reverse-coded so that higher scores indicate more disorder. Next, interviewers evaluated a series of four contrasts anchored by antonymous adjectives describing the room(s) in which the interview occurred and were asked to provide a score based on a five-point scale. The four contrasts are, from one point to five points, as follows: quiet–noisy, no smell/pleasant smell–unpleasant smell, clean–dirty, and neat and tidy–messy. The Disordered Living Conditions scale, as developed by Cornwell (2014), standardizes the five scores within each observer (there were 124 observers at Wave 2; number of interviews conducted ranges from 1 to 80, M = 18.53, SD = 11.54). I created an average score so that z-score values above zero indicate higher-than-average levels of disorder for a given observer (α = .82). Interviewer standardization deals with potential biases due to unobserved heterogeneity between field interviewers. Interviewer standardization shrinks some of these measures’ variability and is thus somewhat of a conservative “fix” (see Cornwell and Cagney 2014:5); analyses using unstandardized disorder scores produced substantively similar results. 3
Neighborhood evaluations followed a similar logic. First, interviewers were asked to assess “how well kept are most of the buildings on the street (one block, both sides) where the respondent lives.” Response options were identical to the home-based evaluations from Wave 1 and were reverse-coded. Next, interviewers were instructed to “describe the street (one block, both sides) where the respondent lives” with a similar five-point scoring metric to the one used for household evaluations. Four dimensions were evaluated in this way, from one point to five points: clean–full of litter or rubble, quiet–noisy, no traffic on the street–heavy traffic on the street, and no smell or air pollution–strong smell or air pollution. The neighborhood disorder scale, as formulated by Cornwell and Cagney (2014), again averages the five interviewer reports after standardizing them to reduce possible interviewer-specific biases (α = .76). 4 Using interviewers’ observations of specific and immediate neighborhood parameters (one block, both sides) minimizes some potential biases that would be introduced by relying upon participants’ reports of their own neighborhoods (e.g., social desirability, inconsistent neighborhood boundaries, reports of one’s neighborhood affected by health difficulties).
Covariates
Additional covariates measured at Wave 1 included age, gender, race-ethnicity (white non-Hispanic vs. nonwhite), partnership status (married/in marriagelike relationship vs. nonpartnered), 5 education status (bachelor’s degree vs. otherwise), logged total household assets (those who initially refused to answer or did not know the amount were given a series of categories to narrow down the amount, e.g., >$50,000 but <$100,000, and were coded at the relevant midpoint value), depressive symptoms as assessed by the Center for Epidemiological Studies Depression scale (11 items, α = .79), and a count of seven possible chronic diseases as diagnosed by a physician (cancer, arthritis, lung disease, stroke, hypertension, diabetes, heart problem). Three covariates were included from Wave 2 to control for features of home and neighborhood that may be correlated with environmental disorder (itself measured at Wave 2). One dummy variable differentiated respondents who recently moved (within the past five years) to longer-term residents, while another denoted those respondents who lived in a detached single-family house from other housing structures. A final FIQ-based measure adjusted for respondents’ block density; interviewers scored respondents’ block from 1 (buildings/houses close together) to 5 (buildings/houses far apart).
Analysis
The key hypothesis for this study is that environmental disorder moderates the association between disability and several indicators of social connectedness. This hypothesis was tested with a series of interactions in multivariable regression models. Core network size was a count variable, and I estimated models for this outcome with Poisson regression. Models for number of friends and overall social interaction used ordered logistic regression. Brant tests examined the parallel lines assumption, and none of the main study variables indicated any problem. Finally, the summary social connectedness scale was assessed with linear regression. Robust standard errors were used to adjust for the complex survey design, and NSHAP-provided weights account for attrition and allow generalization to the broader non-institutionalized U.S. population. Preliminary analyses also employed a propensity score weighting scheme to correct for potential sample selection bias due to the fact that respondents already disabled at Wave 1 were not included in the analytic sample. Results (available upon request) were consistent with those presented below. All regression analyses used multiple imputation with chained equations (m = 10) to account for missing data. Dependent variables were used in the imputation procedure, but missing Ys were removed prior to regression estimation. Analyses were conducted with Stata 12.
Results
Descriptive Statistics and Preliminary Analyses
Just over 20% (n = 315) of the 1,558 NSHAP respondents who were not initially disabled and who received a follow-up interview had at least one ADL difficulty by Wave 2 (see Table 1). Compared to those who remained nondisabled, respondents who experienced disability onset tended to be older, to suffer from more chronic conditions and depressive symptoms, to have fewer household assets, and to be disproportionately female, nonpartnered, and less educated. They also had smaller core networks and tended to live in more disorderly homes and neighborhoods.
Descriptive Statistics for Respondents Not Disabled at Wave 1 (n = 1,558).

Source: National Social Life Health and Aging Project (2005/2006, 2010/2011).
p < .05 (difference between not-disabled and disabled respondents).
Preliminary analyses examined whether initially disabled participants differed from those included in the analytic sample. Consistent with Table 1, people with Wave 1 ADL difficulties had smaller initial core networks. In addition to being older, disproportionately female, and less educated, healthy, and wealthy, they also tended to reside in more disorderly Wave 1 homes. Preliminary analyses considered whether initial disability led to an increase in household disorder from Wave 1 to Wave 2 and whether the incidence of disability between Wave 1 and Wave 2 predicted more household disorder than was observed for those who remained nondisabled. In each analysis, the association between disability and household change was small and nonsignificant. Thus, although disability and disorder seem intertwined—both at Wave 1 and in the Wave 2 changes shown in Table 1—there is no compelling evidence that becoming disabled increases disorder. Hence, disorder would not appear to be an outcome of disability in the same way that social connectedness is hypothesized to be.
Does Environmental Disorder Moderate the Disablement–Connectedness Association?
Tables 2 through 5 present the regression findings corresponding to the main research questions. Across each table, Model 1 presents the noninteractive associations between disablement and connectedness, while subsequent models add interaction terms.
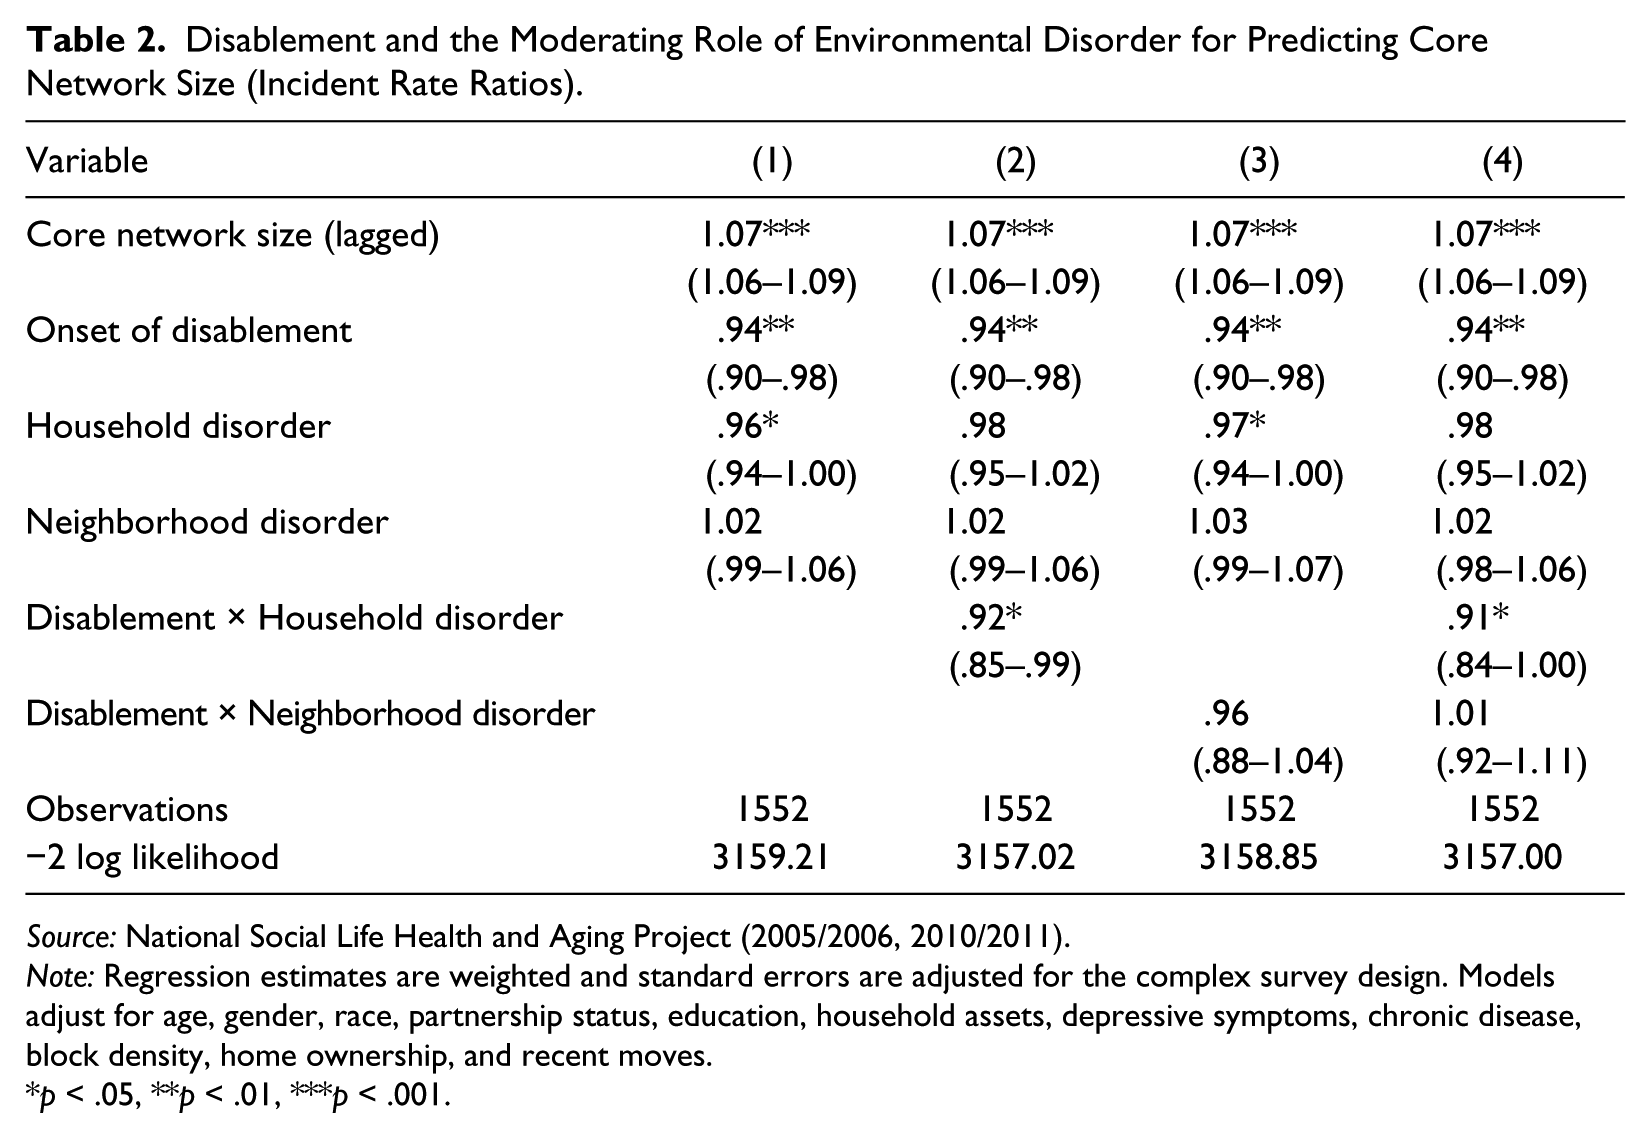
Disablement and the Moderating Role of Environmental Disorder for Predicting Core Network Size (Incident Rate Ratios).
Source: National Social Life Health and Aging Project (2005/2006, 2010/2011).
Note: Regression estimates are weighted and standard errors are adjusted for the complex survey design. Models adjust for age, gender, race, partnership status, education, household assets, depressive symptoms, chronic disease, block density, home ownership, and recent moves.
p < .05, **p < .01, ***p < .001.
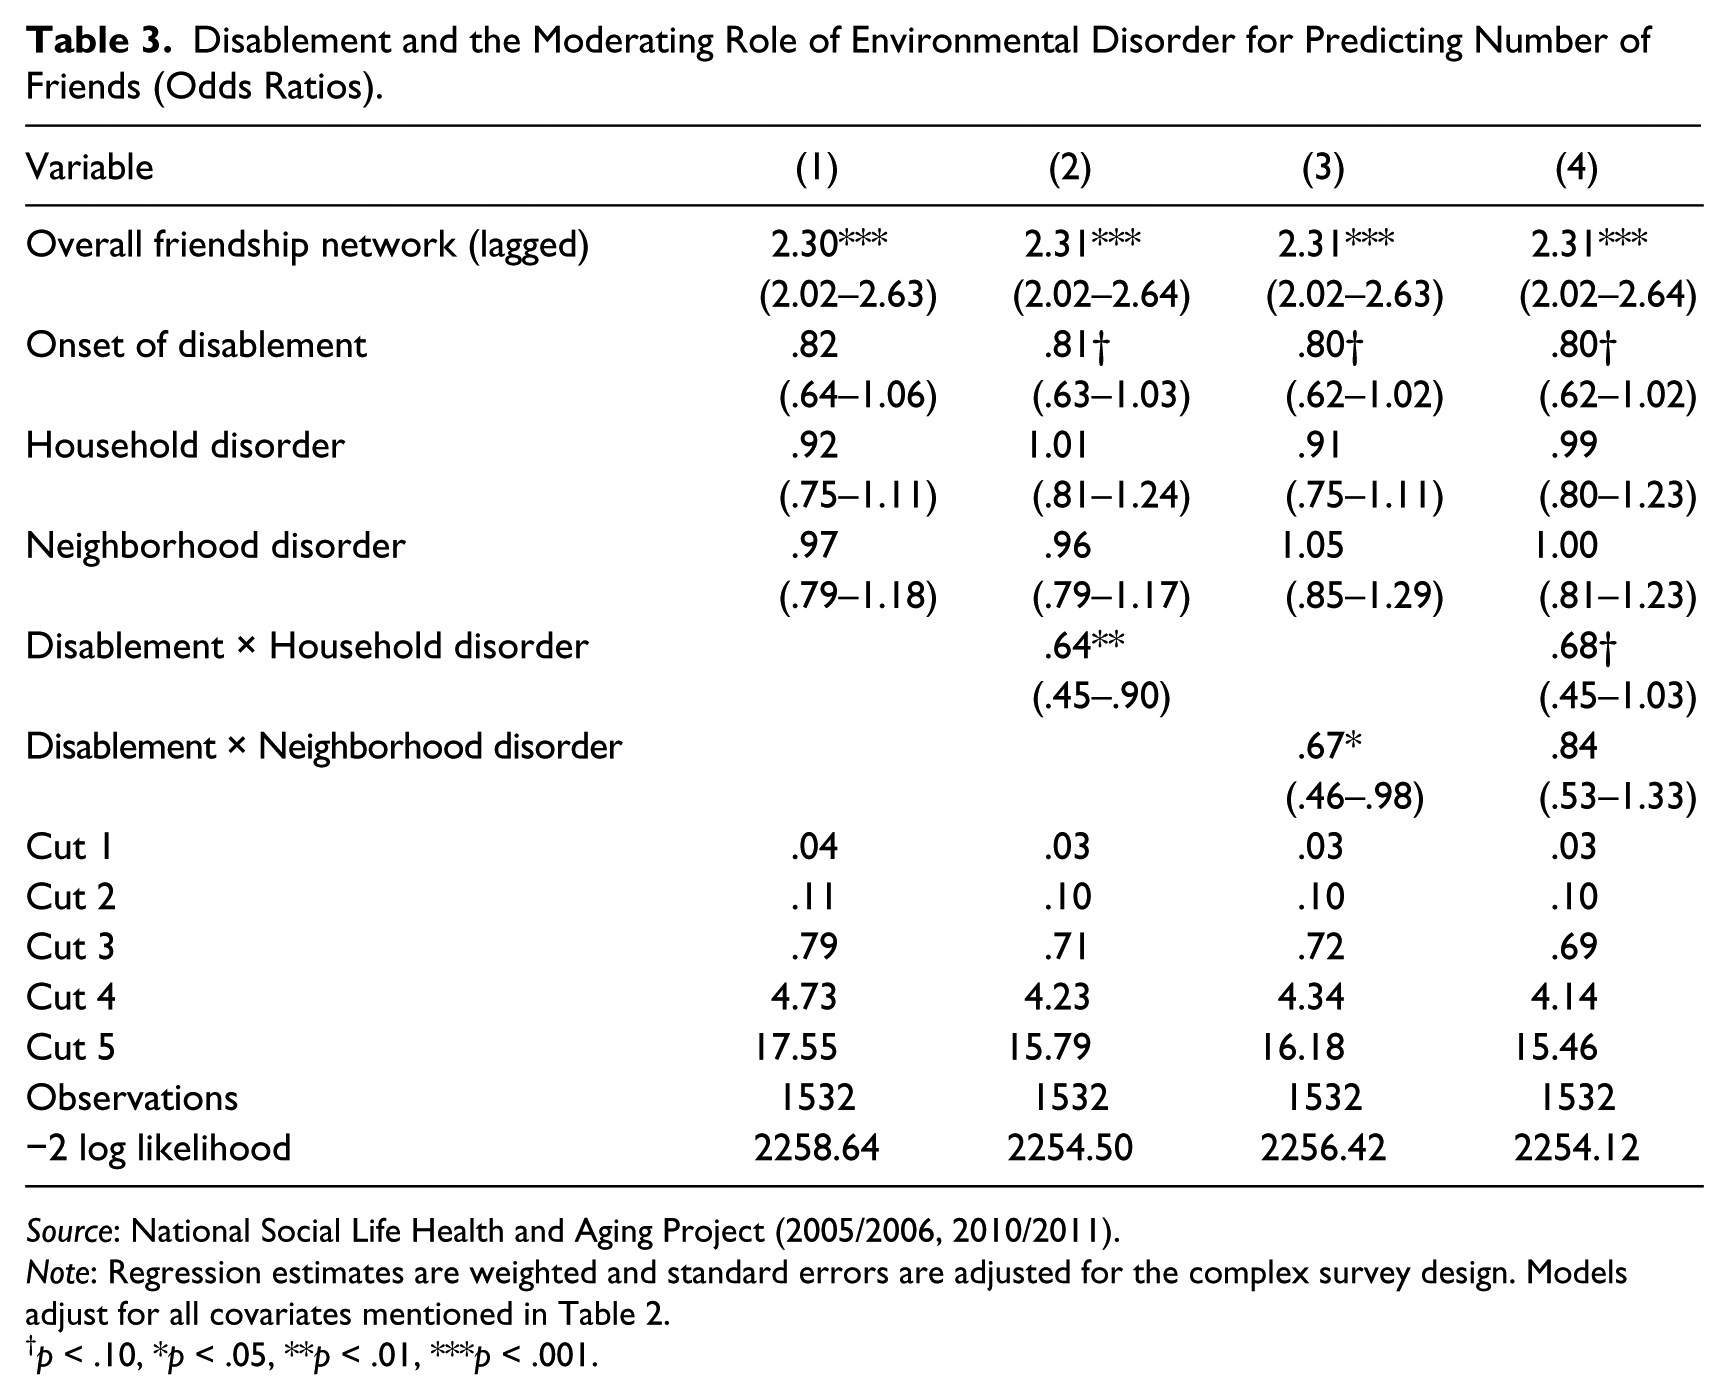
Disablement and the Moderating Role of Environmental Disorder for Predicting Number of Friends (Odds Ratios).
Source: National Social Life Health and Aging Project (2005/2006, 2010/2011).
Note: Regression estimates are weighted and standard errors are adjusted for the complex survey design. Models adjust for all covariates mentioned in Table 2.
p < .10, *p < .05, **p < .01, ***p < .001.
Disablement and the Moderating Role of Environmental Disorder for Predicting Overall Social Interaction (Odds Ratios).

Source: National Social Life Health and Aging Project (2005/2006, 2010/2011).
Note: Regression estimates are weighted and standard errors are adjusted for the complex survey design. Models adjust for all covariates mentioned in Table 2.
p < .10, *p < .05, **p < .01, ***p < .001.
Disablement and the Moderating Role of Environmental Disorder for Predicting Social Connectedness Summary Scale (Unstandardized Regression Coefficients).

Source: National Social Life Health and Aging Project (2005/2006, 2010/2011).
Note: Regression estimates are weighted and standard errors are adjusted for the complex survey design. Models adjust for all covariates mentioned in Table 2.
p < .10, *p < .05, **p < .01, ***p < .001.
Starting with core network size (Table 2), disability onset is associated with a 6% reduction in the expected number of close discussion partners, holding constant earlier core network size and all other variables (incidence rate ratio = .94, p < .01). 6 Household disorder is also associated with smaller core networks in the additive model, though the relationship is modest. Each one-unit increase in observer-evaluated disorder decreases the expected number of ties by a factor of .96 (p = .05). Several other factors predict larger core network size, including being female, having a four-year college degree, and having greater wealth.
Models 2 and 3 examine the moderating role of environmental disorder. The results for household conditions (Model 2) align with study hypotheses by indicating that disablement has its strongest negative association with core network size when it is accompanied by greater household disorder. Results were substantively identical when the dependent variable was modified to include only nonresidential core ties and when including a control for proportion of core ties that were co-residential (supplementary analyses available upon request). Figure 1 depicts the interaction pattern with expected count of network size holding all covariates at their mean or mode. Evident from this graph is that individuals who remained nondisabled from Wave 1 to Wave 2 had predicted network sizes > 4.65 and that household disorder had little consequence for that outcome (indeed, none of the predicted counts on the left side of the graph were statistically different from one another). For those who reported a disability at Wave 2, however, household conditions appear to matter a great deal; going from moderate orderliness (–1 standard deviation on the disorder scale) to moderate disorderliness (+1 standard deviation) was associated with .67 fewer predicted core network ties. Neighborhood disorder, on the other hand, did not interact significantly with the onset of disability (p = .33 in Model 3).
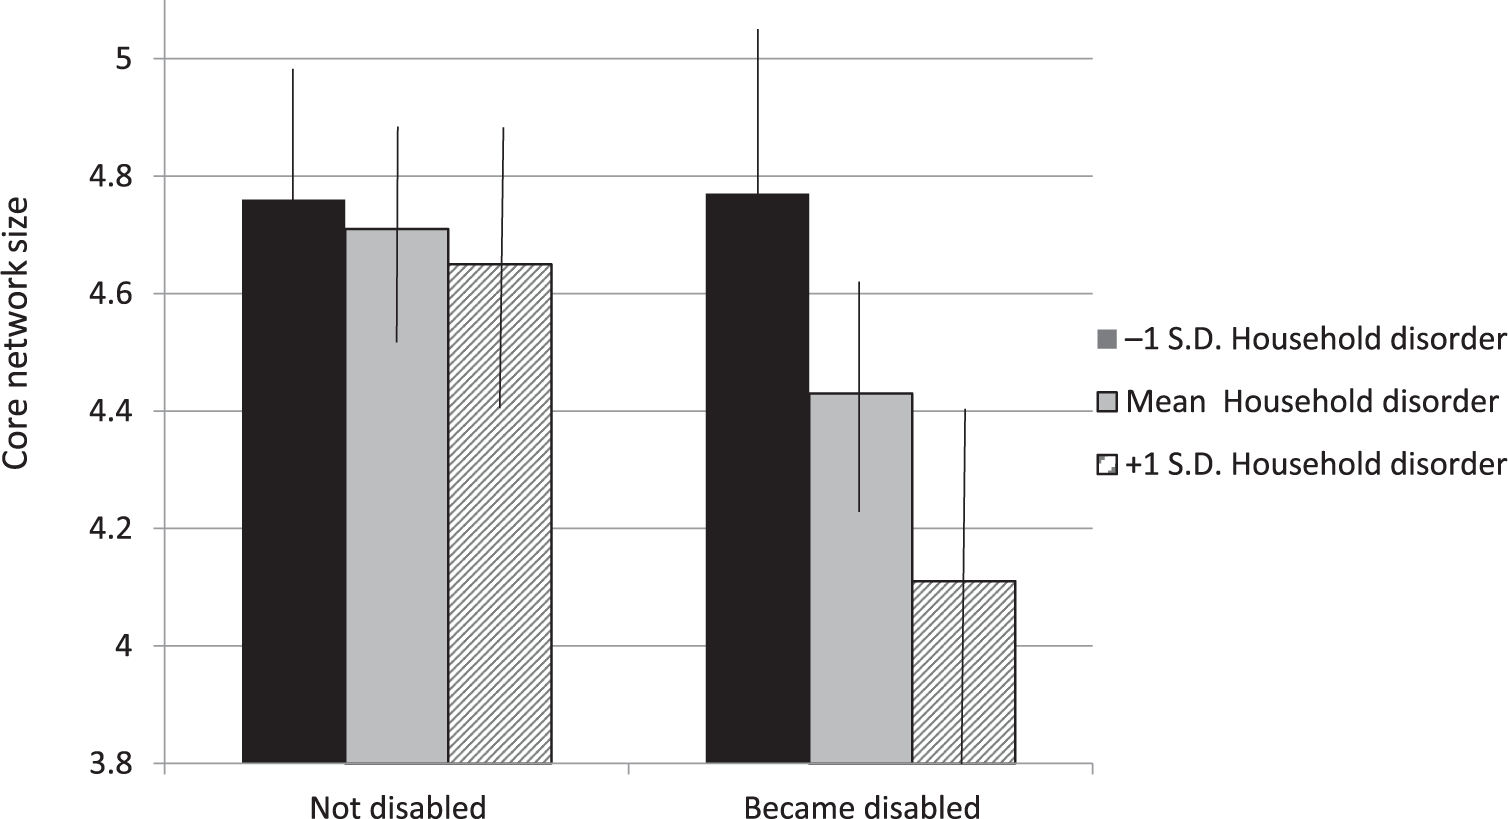
Interaction between Disability Onset and Household Disorder, Core Network Size at Wave 2.
Analyses of number of friends (Table 3) and overall social interaction (Table 4) reiterate that household conditions moderate the longitudinal association between disablement and social connectedness, though there are several points of departure from the analysis of core network ties. Simple associations between disability onset and environmental disorder are less discernable when it comes to number of friends and overall social interaction. Nevertheless, the multiplicative combination of disability onset and household disorder is associated with fewer friends (Table 2) and social interaction (Table 3). At average levels of household disorder, becoming disabled reduces the odds of being in a higher friendship-size category by a factor of .81. This reduction in the odds drops to a factor of .64 for each unit higher in the home disorder scale. Figure 2 presents the predicted probability of landing in the highest friendship-size group (20+ friends) while placing covariates values at their means/modes. The drop-off in connectedness is again apparent only on the right-hand side of the graph, which showcases seniors who became disabled; going from a moderately orderly environment to a moderately disordered one reduces the predicted probability by about .10. A similar pattern also shows up for overall social interaction (Table 4, Model 2). The Disablement × Household Disorder interaction is again statistically significant though somewhat more modest in size. Figure 3 indicates that among recently disabled seniors, the move from relative order to relative disorder is associated with a .06 drop in the probability of interacting several times a week with others.
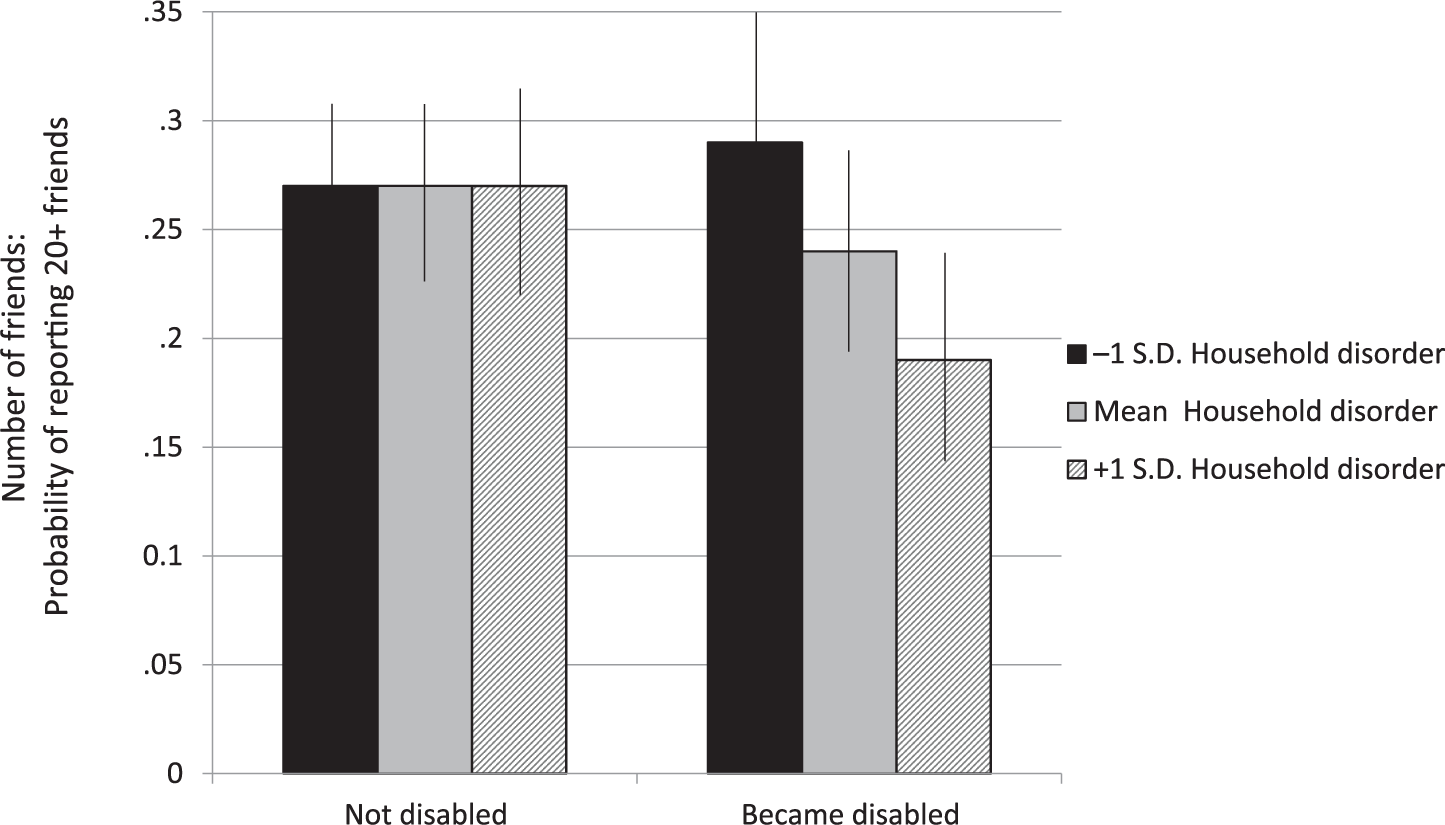
Interaction between Disability Onset and Household Disorder, Number of Friends at Wave 2.

Interaction between Disability Onset and Household Disorder, Overall Social Interaction at Wave 2.
On the whole, there was little evidence that neighborhood disorder moderated the association between disablement and social connectedness. One qualified exception is for number of friends, where neighborhood conditions appear to exacerbate disability’s effects (interaction term odds ratio = .67 in Model 3). In the final model (Model 4), however, which incorporates all interactions from preceding models, the 95% confidence interval for Disablement × Neighborhood interactions stretches well beyond 1, even as the Disablement × Household Disorder interaction remains close in size to its value in Model 2 and remains marginally significant (p = .07). This general pattern applies to all regression tables; estimates of the household disorder interaction pattern were essentially unchanged between Model 2 (household interaction only) and Model 4 (both interactions included) for each outcome studied. 7
Results to this point consistently identify household disorder as a moderator of the association between disability onset and social connection. One criticism of the foregoing analysis, however, is that examining three separate outcomes is a failure to recognize social connectedness in its multidimensional complexity. To address this potential problem, Table 5 shows the results of analyzing the Social Connectedness summary scale using linear regression. Findings indicate that the moderation patterns presented above are not an artefact of arbitrarily chosen outcomes. Instead, the multiplicative combination of disablement and household disorder is robust when using a multidimensional social connectedness outcome (b = −.15, p < .01). And as shown in Figure 4, the substantive conclusion is identical: household disorder makes little difference when people remain free from disability from Wave 1 to Wave 2, but those becoming disabled in a disorderly home see a pronounced drop-off in social connection from one wave to the next. Neighborhood disorder, on the other hand, did not have any discernable moderation effect. 8
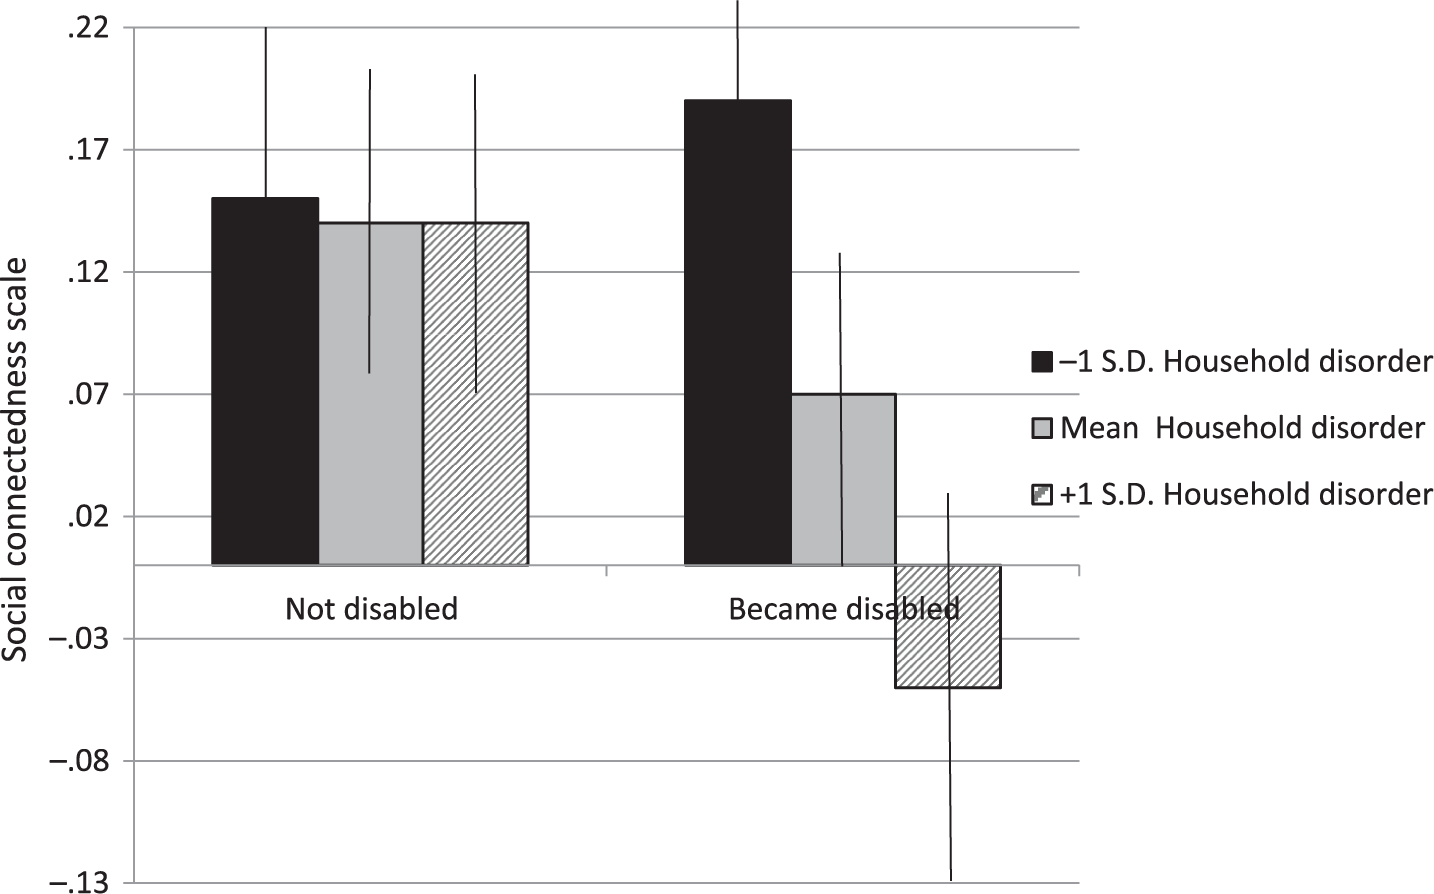
Interaction between Disability Onset and Household Disorder, Social Connectedness Scale at Wave 2.
Additional Robustness Checks
In a set of robustness checks, I considered whether household disorder ratings might actually be a proxy for severe forms of disability, as the disability onset variable used in Tables 2 through 5 does not differentiate between moderate and severe incapacity. I undertook several steps to consider this possibility. Specifically, I added several covariates to the model that may be better able to detect several health problems and physical performance. Addition of dummy variables for specific chronic conditions (e.g., stroke, arthritis)—as opposed to the summary index previously used—and two measures of physical performance (timed tasks for walking three meters and for standing with one’s arms crossed) did not change the previous results.
As a related investigation, I expanded the disability onset indicator to capture varying extents of disability severity. This included a scheme that differentiated seniors with one ADL difficulty from those who had two or more. Another coding configuration distinguished those who reported only moderate disabilities (only “some difficulty” with at least one ADL) from those who experienced more severe disability (“much difficulty” or “unable to do” at least one ADL). Ecological theory would presume that environments are most consequential when physical capacity is lowest (i.e., disability is relatively severe). Consistent with this perspective, coefficients for the interaction between household disorder and disability onset tended to be largest for the indicator of more advanced disability. Splitting disability onset into subcategories did, however, reduce statistical power and produced wider confidence intervals in the majority of models (full results available upon request).
Finally, preliminary analyses had demonstrated the interrelationship between disability, social connectedness, and household disorder spanning back to Wave 1. Might the set of moderation patterns presented above be driven primarily by people most initially isolated—perhaps those disproportionately at risk of disablement and of increased environmental disorder? To consider this question, I again reestimated the models in Tables 2 through 5, this time using only those in the top 50% of each respective social connectedness measure at Wave 1. With the exception of the overall social interaction outcome, results from each subgroup are consistent with those from the larger sample. Disablement is most associated with lowered social connectedness when it occurs in the context of household disorder—even among those who five years earlier were relatively connected.
Discussion
Prior research proposes that functional health helps to preserve social connectedness in later life, ultimately enabling people to age well and to maintain their autonomy (Mollenkopf et al. 1997; Rosso et al. 2013). Still, existing studies on this topic have often decontextualized the disablement process. The current analysis used nationally representative longitudinal data with unique, independent-observer neighborhood and household environmental evaluations to examine whether—and where—the onset of disability shrinks core networks, pares down broader friendship networks, and reduces social interaction.
Results that ignored the environment’s interactive role provided modest evidence that the onset of disability led to decrements in social connectedness. This pattern could reflect the fact that mobility problems limit people’s ability to see others, the way that social priorities are reoriented after the onset of frailty, and/or the inability or unwillingness for social partners to compensate for seniors’ disability-related difficulties. Future research is needed to tease out the relevant mechanisms. Still, this is the rare study that used longitudinal data to observe the onset of disability (Janke et al. 2006).
The key contribution of the current article, however, is in demonstrating how disablement cannot be fully understood without reference to the spatial environment—the home, in particular. Ecological theories of aging propose an inextricable connection between person and environment such that well-being outcomes are determined by an interactive—not additive—relationship between both factors. Starting from this premise, I hypothesized that environmental disorder would exacerbate the isolating effects of disablement. While moderation patterns were subdued when it came to the neighborhood, Hypothesis 2 was strongly supported with respect to the household. Notably, household disorder had no discernable association with social connectedness among seniors who remained free from ADL difficulties over two survey waves. It was only during the process of disablement where home conditions appeared to matter, and in this scenario, the implications of order versus disorder were substantial. I interpret this finding by pointing to the mobility problems brought on by disability (Mollenkopf et al. 1997; Rosso et al. 2013). Namely, functional decline makes it harder for people to get out and about, thereby magnifying the importance of local contexts to sustain social connectedness. By this reasoning, households are environmental resources that become progressively important settings for social interaction after people cannot move about as easily. Even forms of social activity that occur mainly outside the home often rely on household spaces to facilitate contact (e.g., getting a ride to a volunteer event or church service involves some interface with the home, if only in the entryway to pick up or drop off). Still, the NSHAP does not provide fine-grained data about where people socialize, if or how often they invite others to visit their home, or whether they turn down opportunities to socialize because of mobility problems. More detailed data are therefore needed to substantiate the theoretical assumptions and to clarify the relevant mechanisms. Such specific processes are difficult to capture in existing survey projects, so qualitative data would be especially informative. Real-time geographic data on physical mobility matched with daily diary and/or aggregated social connectedness information would also be illuminating.
Order versus disorder—itself but one dimension with which to differentiate environmental contexts—constitutes a rich, sociologically informed aspect of physical space, because on the block or in the home, it is associated with social cohesion and signals conformity or deviance from normative expectations (Cornwell 2014; Sampson and Raudenbush 1999). When disorderly, local places represent an ineffectual environmental resource because they undercut people’s ability to form and maintain social ties (Cornwell 2016; Cornwell and Behler 2015; Krause 1993). Unfortunately, elements of order and disorder are commonly overlooked by environmental gerontologists who apply person–environment fit models and measure “competence” and contextual “press.” The current study integrates ecological perspectives from aging research with those from the Chicago school perspective in sociology. This theoretical blend helpfully extends the concept of environmental “press” by addressing how certain contextual challenges—disorder in particular—are not generic threats to individual well-being but are instead fused with unique and consequential social meanings. As a signal of poor social order and cohesion, physical home spaces perceived as discomfiting or inhospitable have ramifications for the social environment (Cornwell 2016), undermining the very relational resources that are crucial for dealing with the consequences of disablement (Latham, Clarke, and Pavela 2015; Mendes de Leon et al. 2001, 2003). Still, future research should scrutinize how dimensions of the environment other than order and disorder may moderate the association between disablement and social connectedness.
A related consideration is that this study lacked environmental data from any level beyond immediate block. Indeed, neighborhood disorder is in many ways a reflection of broader structural disadvantage located in physical space (Sampson and Raudenbush 1999). Census tract–level records on poverty, residential instability, unemployment, and other characteristics would have therefore yielded a more comprehensive picture of respondents’ communities and the conditions that give rise to order or disorder. Unfortunately, the public-use NSHAP data files do not provide the means to link individual respondents to geocoded information. This limitation may be somewhat offset, however, by the fact that physical features outside home appear far less consequential than those conditions within it. Only in the case of overall friendship network size was there any evidence for the moderating role of neighborhood conditions, yet here, too, the home played a stronger role in exacerbating the effects of disablement. Taken together, the findings point to the salience of the home within older people’s activity set of routine activities and serve as a reminder that the environmental contexts important for health-related processes at earlier stages of the life course (e.g., neighborhoods and peer group exposure during adolescence) may be less so in later life. The current results emphasize the importance of the ultralocal, at least with respect to the outcomes under current consideration. Alternatively, the lack of evidence for neighborhood moderation could reflect some ambiguity in the concept of neighborhood disorder. There are, for instance, clear cases where gentrifying urban neighborhoods populated by high-status residents would nevertheless appear “disorderly” to some onlookers (e.g., Bushwick; Soho, New York, in the 1960s). The neighborhood disorder scale does not differentiate edgy, up-and-coming places from thoroughly threatening, chaotic, or inhospitable ones. It is possible that this underlies the meager evidence for neighborhood moderation. For this reason, it would be ill advised to conclude that neighborhoods simply “don’t matter” for the social connectedness of disabled seniors.
Finally, the current study examines but one aspect of what is undoubtedly a very complex feedback system between disablement, social connectedness, and management of the home environment. Though there is strong rationale for investigating how health problems affect social relationships (Cornwell 2009; Haas et al. 2010; Schafer 2015), an equally strong research consensus points to the health-protective role of social networks and activity (Latham et al. 2015; Mendes de Leon et al. 2001, 2003). Still, by observing those respondents who were not disabled at the initial wave—and, in robustness checks, also those only who were relatively connected—we have some indication that becoming disabled is most isolating chiefly when it occurs in the context of a disorderly home. 9 Further, findings failed to suggest that becoming disabled increased household disorder beyond what was observed at survey baseline. This suggests that though ADL difficulties may make home care a challenging task, many seniors experience disability within a context of preexisting order or disorder. Still, household deterioration may take longer to emerge in the aftermath of disability than what the data currently allow us to observe. All told, the various feedback cycles and causal complexities between the main variables of this study cannot be teased out with two waves of data. Ongoing research is clearly needed. Future research should also include multiwave studies that can examine recovery from disability and that can capture more nuanced trajectories of disability (e.g., from none to mild to severe) as opposed to simply studying the transitions from zero to one or more ADL difficulties.
In conclusion, this research calls attention to the special importance of the home within the disablement process. Beyond its role in accelerating or decelerating the course of functional decline (Verbrugge and Jette 1994), localized environments are crucial for preserving core networks, sustaining a broad set of friendship ties, and engaging with others once disability has set in. These types of informal social resources are critical for helping seniors age autonomously in their communities and overcome the challenges of poor functional health. The findings from this study provide another reminder that problematic household conditions should command the attention of health care professionals, elder advocates, and others interested in seniors’ well-being—this especially in light of the pervasive emphasis on aging-in-place as a policy priority. Indeed, though home-based care is less expensive than institutional alternatives (Chappell et al. 2004), and despite the fact that older adults generally report the highest quality of life when they remain in their own homes (Marek et al. 2005), aging in place requires adequate social resources and support. Many seniors—particularly those already in poor functional health, low in socioeconomic status, and racially marginalized—live in spaces that undermine the meeting of these needs. Failing to safeguard livable spaces for such seniors may therefore contribute to social-support deficits and downward health trajectories in later life. Policy makers could consider expanding tax credits or other mechanisms to support home upkeep and repair for older adults, as financing extensive renovations or relocating from a dilapidated home is not a feasible solution for many seniors who seek to age in place in their own communities.
Footnotes
Acknowledgements
I am grateful to Jason Settels and Laura Upenieks for their comments on a prior draft of this manuscript. Journal of Health and Social Behavior reviewers and editors also offered much constructive feedback. Earlier versions of the paper were presented at the 2016 Gerontological Society Annual Meeting in New Orleans, Louisiana, and at Purdue University’s Center on Aging and the Life Course. Data were made available by the Interuniversity Consortium for Political and Social Research, Ann Arbor, Michigan. The consortium bears no responsibility for the analyses or interpretations presented here.
Funding
The author disclosed receipt of the following financial support for the research, authorship, and/or publication of this article: The National Social Life, Health, and Aging Project is supported by the National Institute on Aging and the National Institutes of Health (R37AG030481; R01AG033903). The content is solely the responsibility of the authors and does not necessarily represent the official views of the National Institutes of Health. This work is supported by the Canadian Social Sciences and Humanities Research Council (Insight Development Grant No. 231615) and the Ontario Ministry of Research and Innovation Early Researcher Award.