



Abstract
We measure gender gaps in long-term earnings and retirement wealth over the 15-year period from 2001 to 2015. Our analysis of data from the Housing, Income, and Labour Dynamics in Australia survey generates new estimates of the effects of education on men’s and women’s long-term earnings. These show that whilst university qualifications improve women’s long-term earnings, university education does not, on average, lift women’s earnings above those attained by men with a high school qualification. The increment in long-term earnings associated with parenthood also shows a large gender gap favouring men. Parenthood is associated with higher long-term earnings for men but on average this factor has a strong negative association with women’s earnings. The article also maps the consequences of the gender gap in long-term earnings for retirement wealth in the form of superannuation. The results show how the large gender gaps in retirement wealth reflect in large part the economic costs arising from the gendered division of roles associated with parenthood in many Australian households.
Introduction
Estimates of long-term earnings commonly use cross-sectional data to measure the average earnings of given groups of employees at different ages and so construct age earnings profiles for different groups of individuals. The approach has been used extensively to explore rates of return to education (see Borland, 2002; Sinning, 2017). It has also been used to measure differences in the relationship between earnings and age across different groups of men and women, with the results sometimes extrapolated to form an analysis of the consequences of the gender distribution of paid and unpaid work for retirement savings (Breusch and Gray, 2004, and Chapman et al., 2001, are Australian examples).
However, the effect of education and unpaid care roles on earnings observed in cross-sectional data may not be unbiased estimates of the longitudinal effect that individuals experience. The data may provide biased estimates of the effects of education on long-term earnings if there are changes over time in the unmeasured dimensions of individuals with and without degrees, such as innate ability (see e.g. Gensowski, 2014). Similarly, cross-sectional data will provide biased estimates of the effects of unpaid care roles on long-term earnings and retirement wealth if there is selectivity in the pattern of workforce absence or part-time work.
The ‘best’ estimates of these effects would, of course, come from longitudinal data. Angelov et al. (2016) used Swedish administrative data for 1986 to 2008 to track the earnings of parents for 15 years following the birth of their child; Cebrián and Moreno (2015) used longitudinal data in Spanish Social Administration records to study the effect of career interruptions on the gender wage gap; and Sinning (2017) used Housing, Income and Labour Dynamics in Australia (HILDA) data to study the effects of education on earnings. However, to date, the availability of extensive panels of data has generally been limited, including in the Australian context. One response has been to use data from different cohorts, whereby samples defined by their birth year are followed over time (Austen and Seymour, 2006; also see Borland, 2002). However, this approach also suffers from the inherent problem that the composition of the sample that is observed in paid work (and thus has earnings data) is affected by selective workforce participation. A further option, relied on in a number of studies, has been to simulate age earnings profiles using stylized biographies of hypothetical individuals (see e.g. Rake, 2000, chapter 3). This produces useful insights into the determinants of lifetime earnings, but is limited by the problems associated with the selection of biographies and the requirement to make large assumptions about future patterns of labour force participation, hours of work and wage rates.
The approach taken in this article is to exploit the longitudinal data that are now available for the 15 years of the HILDA survey. This survey provides data on the individual earnings, education, employment status and other characteristics for the period 2001 to 2015. Whilst this covers a period far short of a standard working life, it is useful for our aims, which are (a) to provide more direct measures of the effect of university qualifications on individuals’ long-term earnings; (b) to assess gender differences in long-term earnings, and their sources, including the division of paid and unpaid work within households; and (c) to assess the consequences of differences in long-term earnings for retirement wealth in the form of superannuation.
The next section provides a brief overview of relevant theory and some policy-relevant applications. Following this the HILDA data are discussed, before proceeding to the initial empirical analysis of long-term earnings and retirement wealth gaps, first as descriptive statistics regarding earnings levels and change and then using multiple regression (econometric) techniques. The analysis examines outcomes across all individuals and those in the sub-set of couple households, with the latter contributing information on how ‘decisions’ about the division of paid and unpaid work in households can affect long-term earnings and, ultimately, retirement wealth. The article closes with a section that summarizes the findings and draws out implications for policy and future research.
The human capital model, age earnings profiles, rates of return to education and predictions of retirement wealth
The human capital model, in the rational choice tradition, conceptualizes an individual who makes decisions by evaluating the full set of information on relevant benefits and costs, including opportunity costs. In the context of decisions about higher education, this individual evaluates the likely sum of lifetime earnings as a graduate and non-graduate, and the costs of the ‘investment’ in education, such as university fees and textbooks. In the context of decisions about paid work, the individual evaluates relevant short- and long-term benefits (such as access to income over the life course) and costs (such as childcare costs and lost home production).
The human capital model has been so extensively used to examine and predict patterns of enrolment in higher education that it is likely to be familiar to most readers. As a recap, the model predicts that differences in individuals’ participation in higher education will emerge if there are differences in individual characteristics that influence either the costs of tertiary study (such as ability or family background) or the stream of earnings that can be attained in the labour market (such as current age, health or expected labour market absence). It has also helped spur numerous studies of the rate of return to education, where an attempt is made to measure and compare the various costs and benefits of university study (see Harmon et al., 2003, for a survey of international evidence). The findings of these studies have had an important influence on policy debates and have, in Australia at least, helped to provide a justification for first the imposition of university fees and then increases in the level of these fees (see Chapman, 2010, for a discussion of the role of economic research on the development of policy on higher education).
Studies of the rate of return to education have typically relied on cross-sectional data for a particular point in time, with simple approaches focusing on the average earnings of, usually, full-time workers of different ages. Cross-sectional data have been used to construct age-earnings profiles for individuals with different educational qualifications, and subsequently to generate measures of the lifetime earnings of individuals who pursue/don’t pursue a degree. However, most of these approaches have relied on the somewhat heroic assumption that the future pattern of earnings across individuals with different levels of education can be gauged by the current pattern of earnings across individuals who are up to 45 years their senior. Numerous studies of this type have also suffered the important limitation of being unable to directly measure differences in work hours and continuous employment across, for example individuals with different levels of education. For this reason, some studies have limited their analysis of the returns to education to male sub-samples (see e.g. Borland, 2002).
A recent study of the rate of return to education by Sinning (2017) is particularly noteworthy because it used the HILDA data and covered a similar time frame to the current study – 2001 to 2014. Sinning first used a cross-sectional approach to estimate the effects of education on earnings from a pooled sample of 25–64-year-old employed people in the HILDA survey. These showed that, on average, a Bachelor’s or Honour’s degree lifted men’s hourly wage rate 37.4% higher than that achieved by men with Year 12 or lower qualifications. Sinning found larger effects of education on women’s hourly wage rates, with female workers with a Bachelor’s or Honour’s degree achieving wages approximately 52.0% higher than their counterparts with Year 12 qualifications or less.
Sinning (2017) subsequently constructed age-earnings profiles from the cross-sectional data and used these to estimate the effects of educational qualifications on lifetime earnings. These indicated that a Bachelor’s or Honour’s degree increases men’s lifetime earnings by 37.4% above those achieved by men with Year 12 qualifications or less. For women, the measured effect was 34.7%.
Acknowledging the limitations of the cross-sectional approach, Sinning (2017) also used life-cycle models to measure the effects of education on current and lifetime earnings. Briefly, these models control for the effect of individual-specific factors by exploiting the longitudinal elements of panel data sets. They also include variables to take account of possible changes in the relationship between age and earnings over time. As Sinning (2017) shows, the models can be adjusted to take into account differences in the employment probabilities of men and women with different educational qualifications. Applying these models to the HILDA data, Sinning (2017) estimated the effect of having a Bachelor’s or Honour’s degree, as compared to Year 12 qualifications or less. For men the measured effect was 51.9%, and for women it was 49.1%.
Age-earnings profiles estimated with cross-sectional data for a single year have played a central role in a number of studies of retirement wealth. For example, Preston and Austen (2001) used data from the 1996 Australian Bureau of Statistics (ABS) Income Distribution Survey to estimate age-earnings profiles for men and women with average educational qualifications. These profiles revealed a gender pay gap at age 20 in the group of full-time workers and a wider gap in older age groups. To account for the broken career patterns of many women, and their relatively high rates of part-time work, synthetic profiles were created to reflect scenarios involving part-time work and/or periods of workforce absence associated with unpaid care roles.
Preston and Austen (2001) subsequently linked the age-earnings profile data to retirement wealth by assuming that savings for retirement through the superannuation system are a given proportion of earnings. Summing annual savings across the assumed working life, and with the addition of assumptions about interest rates and fees, yielded estimates of the stock of superannuation wealth at retirement. By comparing the predicted retirement savings of men and women in the various scenarios, the authors produced estimates of the effects of factors such as education, the gender pay gap, and the gender distribution of unpaid care roles on retirement wealth.
Across a working life of 45 years, the age-earnings profiles estimated by Preston and Austen (2001) implied a 13 % gap between the average lifetime earnings of men and women who were continuously employed on a full-time basis. This translated into a predicted gender gap in retirement wealth by age 65 of 12%. The estimated lifetime earnings and retirement wealth of women who worked part time or had periods of workforce absence were much lower. However, these predictions also relied on a heroic assumption – in this case, that the current pattern of earnings across different individuals of different ages (as measured in the age-earnings profiles) could be used to show the trajectory of particular individual’s earnings across their working life.
Jefferson and Preston (2005) applied a similar approach, but made use of recall data (from the 1997 Negotiating the Life Course Survey) to achieve firmer measures of labour force participation over the life course. In one of their ‘scenarios’, women worked on a part-time basis for an extended period. This translated into an employment experience gap between men and women of 37.3%, ‘an estimated lifetime earnings gap of around 45 percent and an annual private pension gap of around 50 percent’ (Jefferson and Preston, 2005: 93).
Noting the limitations of recall data and the absence of a long panel, Rake (2000) reverted to a simulation approach to estimate the lifetime earnings of UK women and men across a variety of education levels, marital circumstances and fertility. Their analysis yielded estimates of both the gender gap in lifetime earnings and women’s share of family earnings in couple households. The latter ranged from close to 50% in childless households with high levels of skill to only 24% in couple households with two children and low levels of skill (Rake, 2000: 84).
Estimates of lifetime earnings have played an important role in informing policy discussions of the gender impacts of retirement income policy. In the Australian context, they have created arguments for limiting the tax concessions made available to support retirement savings, government-funded superannuation contributions during periods of parental leave, and continued funding of the age pension (Commonwealth of Australia, 2016).
The large policy impacts of research on lifetime earnings behoves researchers and policy makers to check its findings against the ‘real time’ data that are now available in longitudinal collections, such as HILDA.
The HILDA data enables fresh analysis of a number of key research questions:
How large are the differences in long-term earnings between individuals with different levels of education, and how do estimates of the effects of education drawn from longitudinal data compare with cross-sectional estimates? How do the long-term earnings of men and women compare, and how does this affect the gender gap in retirement wealth? What are the sources of variation in long-term earnings and retirement wealth across different groups of men and women? How large are gender gaps in long-term earnings and retirement wealth within heterosexual couple households, and what factors influence these gaps?
The longitudinal data and sample
The HILDA survey began in 2001 as a large nationally representative panel survey. Each year it collects data on the sociodemographic characteristics, education, labour market history, income and geographic location of its participants. However, special modules of the survey collect additional data on a less frequent basis. Every 4 years, starting in 2002, the survey collects self-reported data on wealth, including superannuation.
The basic sample for the current study is individuals who were aged under 65 in 2015, were included in each year’s data collection, and provided 15 years’ data on their employment status and other characteristics. We compare the sum of earnings over the 15 years across the entire sample population (3615) and also across the sub-sample of individuals in couple households (2619). In the latter case we limit the analysis to individuals who had a partner in each of the 15 years between 2001 and 2015. For couple households we also measure the intra-household gap in the sum of earnings. In all cases we also compare superannuation wealth in 2014, using data from the latest HILDA wealth module. As such, we use the longitudinal elements of the HILDA data to achieve direct measures of long-term earnings and superannuation, but our analysis of the patterns in these variables is across different individuals and households.
The definition of the samples limits the representativeness of the study. For one, the sample is relatively old, because individuals who were aged under 21 in 2001 are excluded from the analysis. Furthermore, the sample over-represents those with stable employment, housing and other relationships, because they are relatively more likely to have remained in the HILDA survey for 15 years. 1
The information collected in the HILDA survey includes demographic characteristics, employment status, educational qualifications, earnings and superannuation. The demographic characteristics include gender, age and marital status. The person’s highest educational qualifications are measured. Employment status identifies whether the person is full-time employed, works part time, is unemployed or not in the labour force.
Earnings in the form of wages and salaries are reported on an annual basis, and this enables the measurement of the sum of each individual’s earnings over the 15 years from 2001 to 2015. 2 Superannuation wealth is a stock variable, measured in 2002 and 2014, and refers to the individual’s self-reported estimate of the value of their superannuation funds.
The variables used in the analysis include:
age in 2001 – measured in years; gender – identifies male versus female respondents; marital status – identifies the number of years the person was married or in a de facto relationship between 2001 and 2015; education attainment – dummy variables that identifies whether by 2001 the person had obtained a post-graduate qualification, a Bachelor’s or Honour’s degree, an advanced diploma or diploma, a certificate III or IV, or whether they had left school following completion of Year 12 or beforehand; completion of higher qualification between 2001 and 2015; time since school – the number of years between the completion of the highest qualification and 2001; children – the number of children the person has had by 2001, and the number of children born between 2001 and 2015.
Empirical analysis
This section begins with a discussion of descriptive statistics for the total earnings of individuals with different educational qualifications, and of different ages, over the period from 2001 to 2015. It then proceeds to the multivariate (econometric) analysis of the level and change in earnings. The final part of this analysis comprises a multivariate analysis of superannuation wealth.
Descriptive statistics
Individual gross wages and salaries for 2001 to 2015, by gender and highest educational qualification in 2001, Australia.
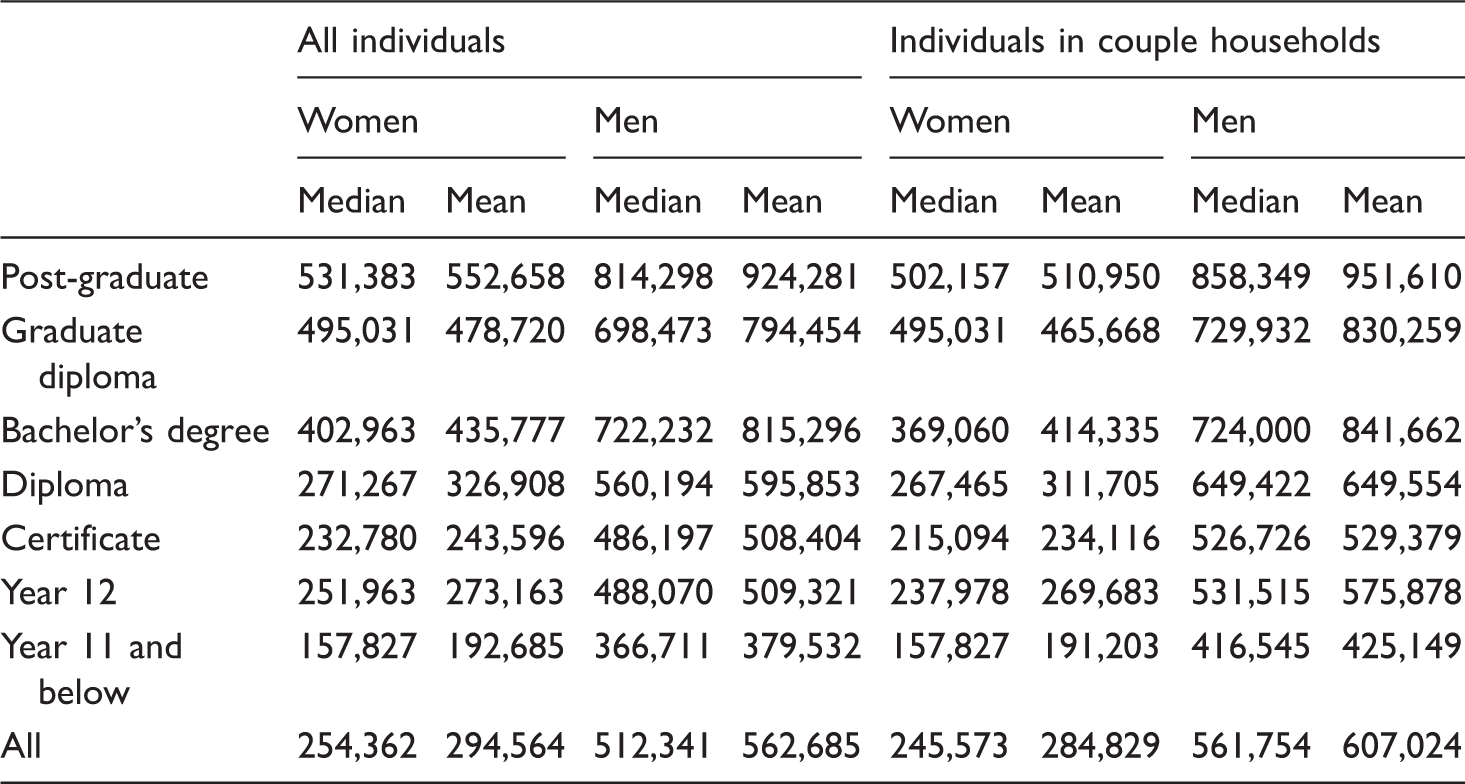
Across the 2116 women and 1741 men in the total sample, the majority (55.3%) had completed some form of post-school education by 2001. Of relevance to research question 1, Table 1 data show that these qualifications were associated with substantially higher gross earnings over the period. The median gross 15-year earnings of men with post-graduate qualifications in 2001 were 66.8% larger than those of men who had a Year 12 qualification. Amongst women, the gap in gross earnings between those with post-graduate versus Year 12 qualifications in 2001 – measured at median values – was 110.9%. Clearly, in the cross-section, educational qualifications are associated with substantial differences in individuals’ long-term earnings.
The men and women who were in a married or de facto relationship during the 15-year study period are included in columns 5–8 of Table 1. Individuals with post-graduate qualifications recorded gross 15-year earnings that were higher still than their counterparts with Year 12 qualifications. Amongst women in couple households, the ‘qualifications’ gap in earnings was 111.0%, similar to the gap measured across all women. Amongst men in couple households, the gap in the gross 15-year earnings of those with post-graduate versus Year 12 was lower at 61.5%, affected by the relatively high median earnings of men with Year 12 qualifications in couple households. These patterns point to the effects of educational qualifications on the gender division of paid and unpaid work in couple households.
Whilst the data in Table 1 show that educational qualifications deliver substantial improvements in long-term earnings for both men and women, they also reveal very large gender gaps (RQ2). Across the sample as a whole, women’s median total gross 15-year earnings were only 49.6% of men’s, and in couple households this ratio fell to 43.7%. Similar patterns apply in each of the sub-groups defined by educational qualifications, and the earnings difference is particularly large between men and women with less than Year 12 qualifications (in this group, women’s total gross 15-year earnings are 43.0% of men’s, and in couple households this ratio is 37.9%).
Comparing the gross earnings of women and men over the 15-year period casts light on the rates of return each group receives from their investments in education. Women with a Bachelor's degree attain much higher long-term earnings than women without post-school qualifications, suggesting a substantial payoff from this investment. However, the long-term earnings of women with a Bachelor's degree fall well short of men with the same qualification, with their median total gross 15-year earnings reaching only 55.7% of that attained by men in the same educational group. It is worth noting that the median total gross 15-year earnings of women with a Bachelor's degree is actually lower than that attained by men with Year 12 qualifications. In the sub-set of individuals living in couple households, the median gross 15-year earnings of women with Bachelor's degrees are lower than those recorded by every group of men, including the group that did not complete high school. Educational qualifications are not lifting most women’s financial outcomes above men’s, and women’s level of earnings in each educational group remains substantially below men’s. This is indicative of the large losses in productivity in the paid economy brought about by women’s interrupted careers, and is especially significant given that women now outnumber men in higher education.
Gross wages and salaries in heterosexual couple households for 2001 to 2015, by qualifications and age characteristics in 2001, Australia.
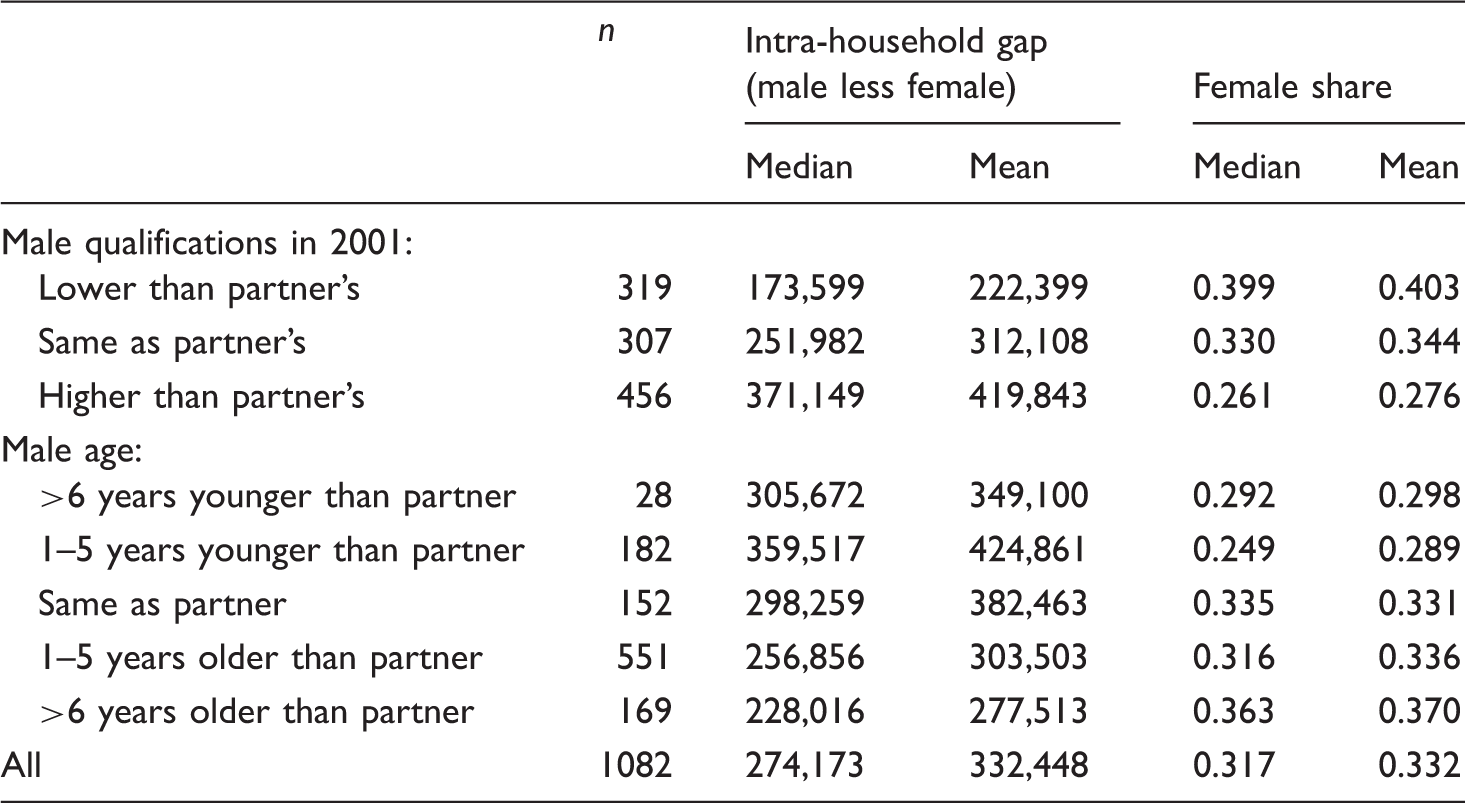
The initial row of data shows the size of the intra-household gap in gross 15-year earnings, and the female share of total household earnings, in households where the male partner’s educational qualifications in 2001 were lower than his partner’s. Although, prima facie, such a gap in qualifications creates conditions conducive to a gap in earnings favouring women, the median female share of their households’ 15-year earnings is only 40.0% in this group of households, equivalent to AU$173,599. Against this, the size of the intra-household gap in earnings increases (and women’s share of total earnings falls) as the gap in qualifications shifts in men’s favour. In the group of households where the man’s educational qualifications in 2001 were higher than his partner’s, the median female share of household 15-year earnings was only 26.1% and the median intra-household gap in earnings was AU$37,114. Educational qualifications appear to influence the distribution of financial resources in couple households, but typically they do not result in outcomes where women’s total earnings exceed their partner’s over the longer term.
The lower set of rows in Table 2 contain data on the size of the intra-household gap in gross 15-year earnings, and the female share of total household earnings, across households categorized according to the age relativity of the male and female partner. This comparison is motivated by human capital theory, which suggests that, ceteris paribus, the female share of earnings will be pushed higher in households where she is older, and vice versa. The data in Table 2 show that the largest group of households (accounting for 50.9% of the total) have a 1- to 5-year age gap between the male and female partner, in line with the traditional age gap in marriage (see Austen, 2016). In such households, the median female share of household 15-year earnings is 31.6% and the median intra-household gap in earnings is AU$256,856. However, contrary to the predictions of a very simple version of human capital theory, the female share of earnings is higher in the group of households where the age gap favouring men is the largest, and is relatively small in the group of households where the age gap favours women. It is also worth noting that comparing women’s share of long-term household earnings across the age groups fails to reveal a group where women’s total 15-year earnings exceed their partner’s.
Multivariate analysis: Long-term earnings
Individual gross wages and salaries for 2001 to 2015, OLS regression coefficients, HILDA survey, Australia.

HILDA: Housing, Income and Labour Dynamics in Australia.
Omitted category is ‘Year 12 or less’.
Omitted category is no children; bracketed terms are standard errors. ***denotes statistically significant at the 1% level. **denotes statistically significant at the 5% level. *denotes statistically significant at the 10% level.
The results presented in column 1 highlight the large earnings gaps that are associated with gender. Across the whole sample, and in the presence of controls for factors such as age, education, marital status and parenthood, men’s 15-year earnings exceed women’s, on average, by 75.2%. This estimate, not surprisingly, is substantially higher than the gender gap in lifetime earnings estimated by Preston and Austen (2001) for men and women who were continuously employed on a full-time basis. It is also much larger than the 45% gender gap in lifetime earnings estimated by Jefferson and Preston (2005) for scenarios involving extended periods of part-time work by women, suggesting that their scenarios under-measured the combined impacts of part-time work, lower wage growth and workforce absence on women’s lifetime earnings.
The results in columns 2 and 3 also confirm the large differences in long-term earnings that are associated with education, and how these vary by gender. For women, greater human capital (in the form of a Bachelor’s or Honour’s degree, as compared to high school qualifications or less) is associated, on average, with an 71.6% increment in long-term earnings. For men, the equivalent ‘effect’ is slightly higher: a 72.1% increment. The attainment of a new – and higher– qualification over the study period is also associated, on average, with higher total 15-year earnings for women (by 23.1%), although this effect is not statistically significant for men.
It is noteworthy that these estimates are substantially higher than those produced by Sinning (2017) using cross-sectional data on current earnings. The difference between the sets of results can be linked to the influence of periods of labour market absence and part-time work on earnings, and how these are inversely correlated with individuals’ level of education. Sinning’s cross-sectional estimates were only based on the earnings of individuals who were either full- or part-time employed and who reported positive annual earnings. Thus, they could not fully capture the effects on lifetime earnings of workforce absence and how these vary across groups characterized by different levels of education.
Returning to the results in Table 3, these show that for men, spending more time in a married or in a de-facto relationship over the study period is positively correlated with long-term earnings (5.4% for each additional year spent married, at mean values). However, this factor is not a statistically significant source of variation in women’s long-term earnings.
Parenthood is also positively correlated with men’s earnings, but it is associated with substantially lower earnings for women. For women, having a child under the age of 2 in 2001 (as compared to no children) is associated with a 77.5% reduction in earnings over the subsequent 15 years. For men, the effect of this factor is not statistically significant. In situations where the youngest child is aged 2–5 in 2001, women’s 15-year earnings are 55.4% lower (than women without children in 2001), whilst the difference between men’s long-term earnings in these situations and those of men without children in 2001 is not statistically significant. Women who had a child between 2001 and 2015 had long-term earnings 29.1% lower than other women, whilst this factor was not a statistically significant source of variation in men’s earnings.
The results in columns 4 and 5, for women and men in the sub-set of heterosexual couple households, largely follow the above patterns. For example, possessing a Bachelor’s or Honour’s degree (rather than a high school or lower qualification) is associated with a 67.2% increment in 15-year earnings for women living in couple households, as compared to a 71.6% increment in the broader group of women. The relativity for men is similar: 64.2% for men in couple households and 72.1% for men in the broader group.
Parenthood is strongly associated with lower long-term earnings for women in couple households, and is positively linked to higher long-term earnings amongst men. However, the negative ‘effects’ of parenthood on women’s long-term earnings are generally smaller in the couple households than in the broader population – which could suggest that single mothers’ long-term earnings are especially low. For example, in couple households, having a child over the age of 19 (as compared to no children) is associated with 15-year earnings that are 36.0% lower, whilst in the broader group of women this factor is associated with long-term earnings that are 45.8% lower. Amongst men in couple households, having a child over the age of 19 (as compared to no children) is associated with higher long-term earnings, by 31.2% at mean values. In the broader group of men this increment is larger, at 42.8%.
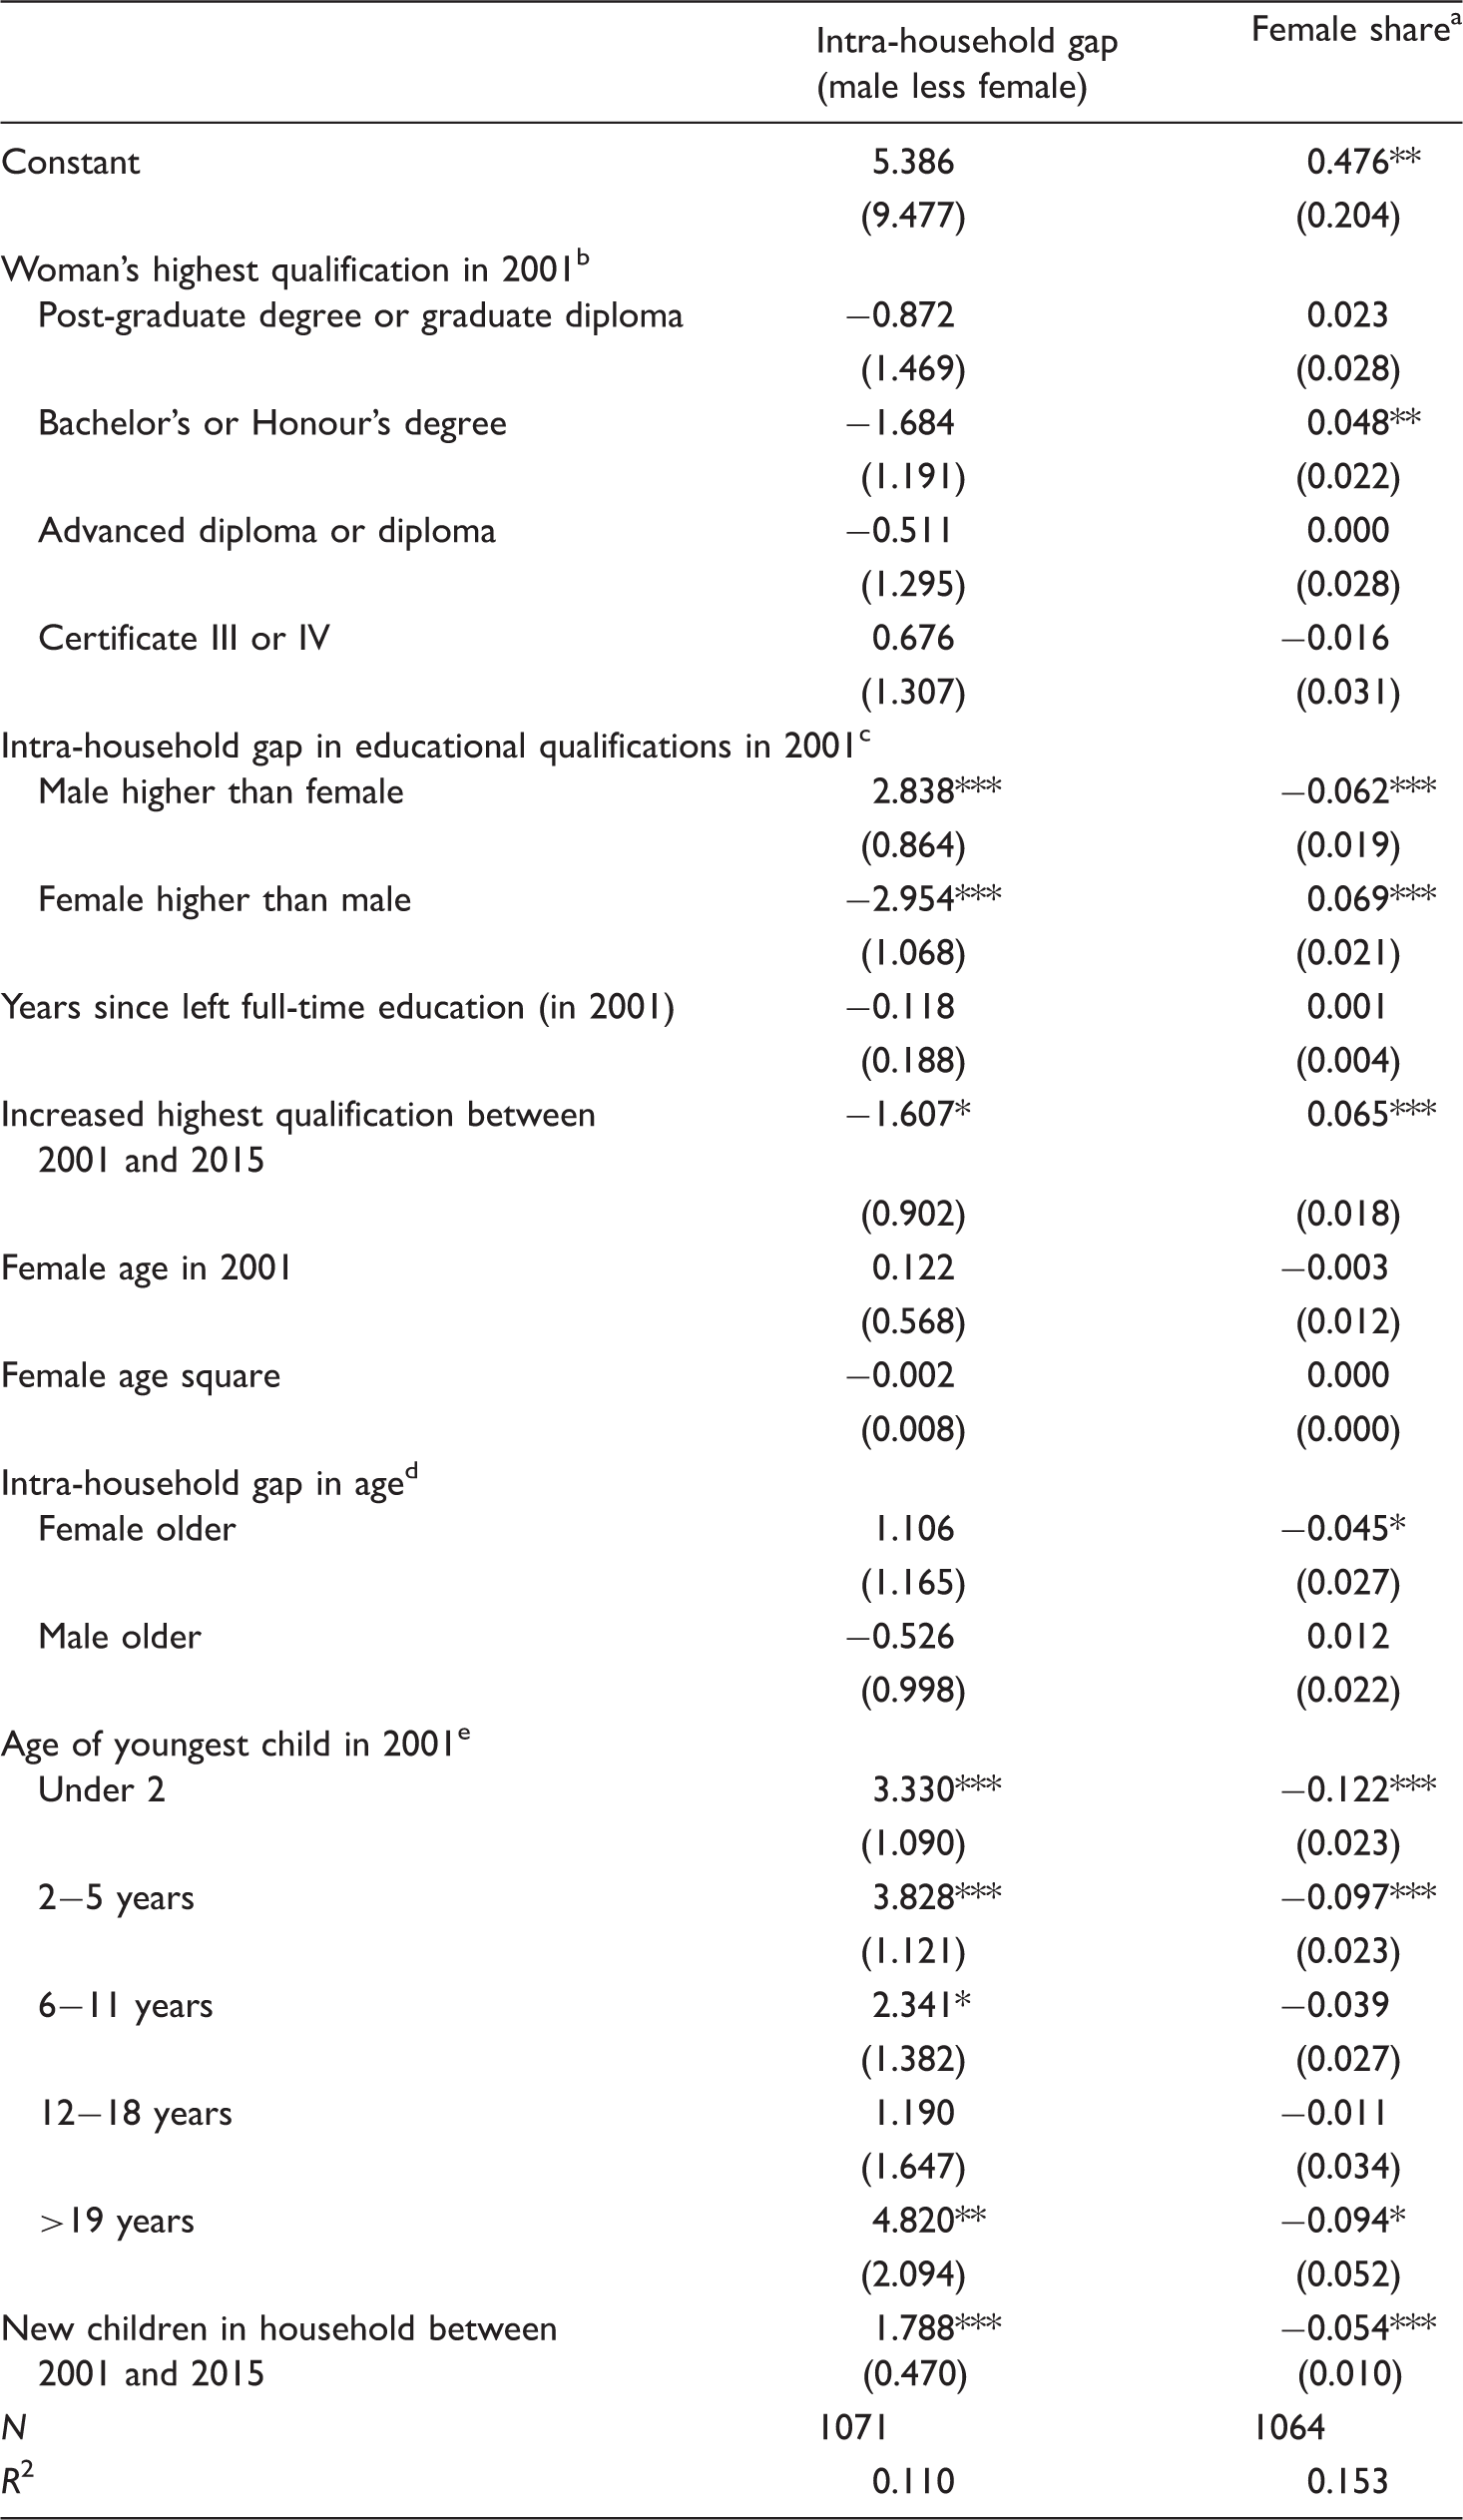
Intra-household gap in gross wages and salaries for 2001 to 2015, and the female share of earnings, OLS regression coefficients, HILDA survey, Australia.
HILDA: Housing, Income and Labour Dynamics in Australia.
A Tobit specification produces coefficients and standard errors that are virtually identical (results available from authors on request).
Omitted category is ‘Year 12 or less’.
Omitted category is ‘same qualifications’.
Omitted category is ‘same age’.
Omitted category is ‘no children in 2001’. Bracketed terms are standard errors. ***denotes statistically significant at the 1% level. **denotes statistically significant at the 5% level. *denotes statistically significant at the 10% level.
The influence of educational qualifications on the intra-household distribution of earnings is discernible in the Table 4 data, with the female share of household 15-year earnings higher in situations where the female partner has a Bachelor’s or Honour’s degree (rather than leaving school at Year 12 or earlier). The female share of 15-year household earnings is larger (by 6.9 percentage points), and the size of the intra-household earnings gap is lower (at mean values), when a woman’s qualifications exceed her partner’s. The intra-household gap increases in the male partner’s favour, in an almost symmetrical fashion, when his qualifications are higher than his partner’s (rather than being equal). Increases in a woman’s qualification over the study are associated with an increase in her share of household long-term earnings (by 6.5 percentage points).
An effect of age on the intra-household distribution of long-term earnings is difficult to discern. The woman’s age is not a statistically significant source of variation in the female share of long-term household earnings or the intra-household gap in earnings. In households where the woman is older than her partner (rather than the same age), her share of long-term earnings is lower – by 4.5%, at mean values.
In contrast, the presence of young children in the household has a clear and substantial effect on both the size of the intra-household gap in long-term household earnings and the female share. Compared to households in 2001 where the woman had never had children, the intra-household gap in long-term household earnings is higher (by 330%) in couple households with a child under the age of 2, and the female share of earnings is lower (by 12.2 percentage points), at mean values. These relativities are very similar for couple households with a child aged between 2 and 5 years. The birth of additional children over the study period also pushes the intra-household gap in 15-year earnings higher – and reduces the female share of earnings (by 178.8 and 5.4 percentage points, respectively).
Multivariate analysis: Long-term earnings and the intra-household gap in superannuation savings
The final part of this analysis addresses the research questions on the links between long-term earnings and retirement wealth, and the sources of variation in intra-household gaps. The median superannuation balance of men in 2014 (the year of the latest HILDA wealth module) was AU$130,000, whilst for women it was AU$61,903. In heterosexual couple households, the median female intra-household share of superannuation wealth in 2014 was 33.3%. For most people, the key determinant of their superannuation balance is their prior earnings.
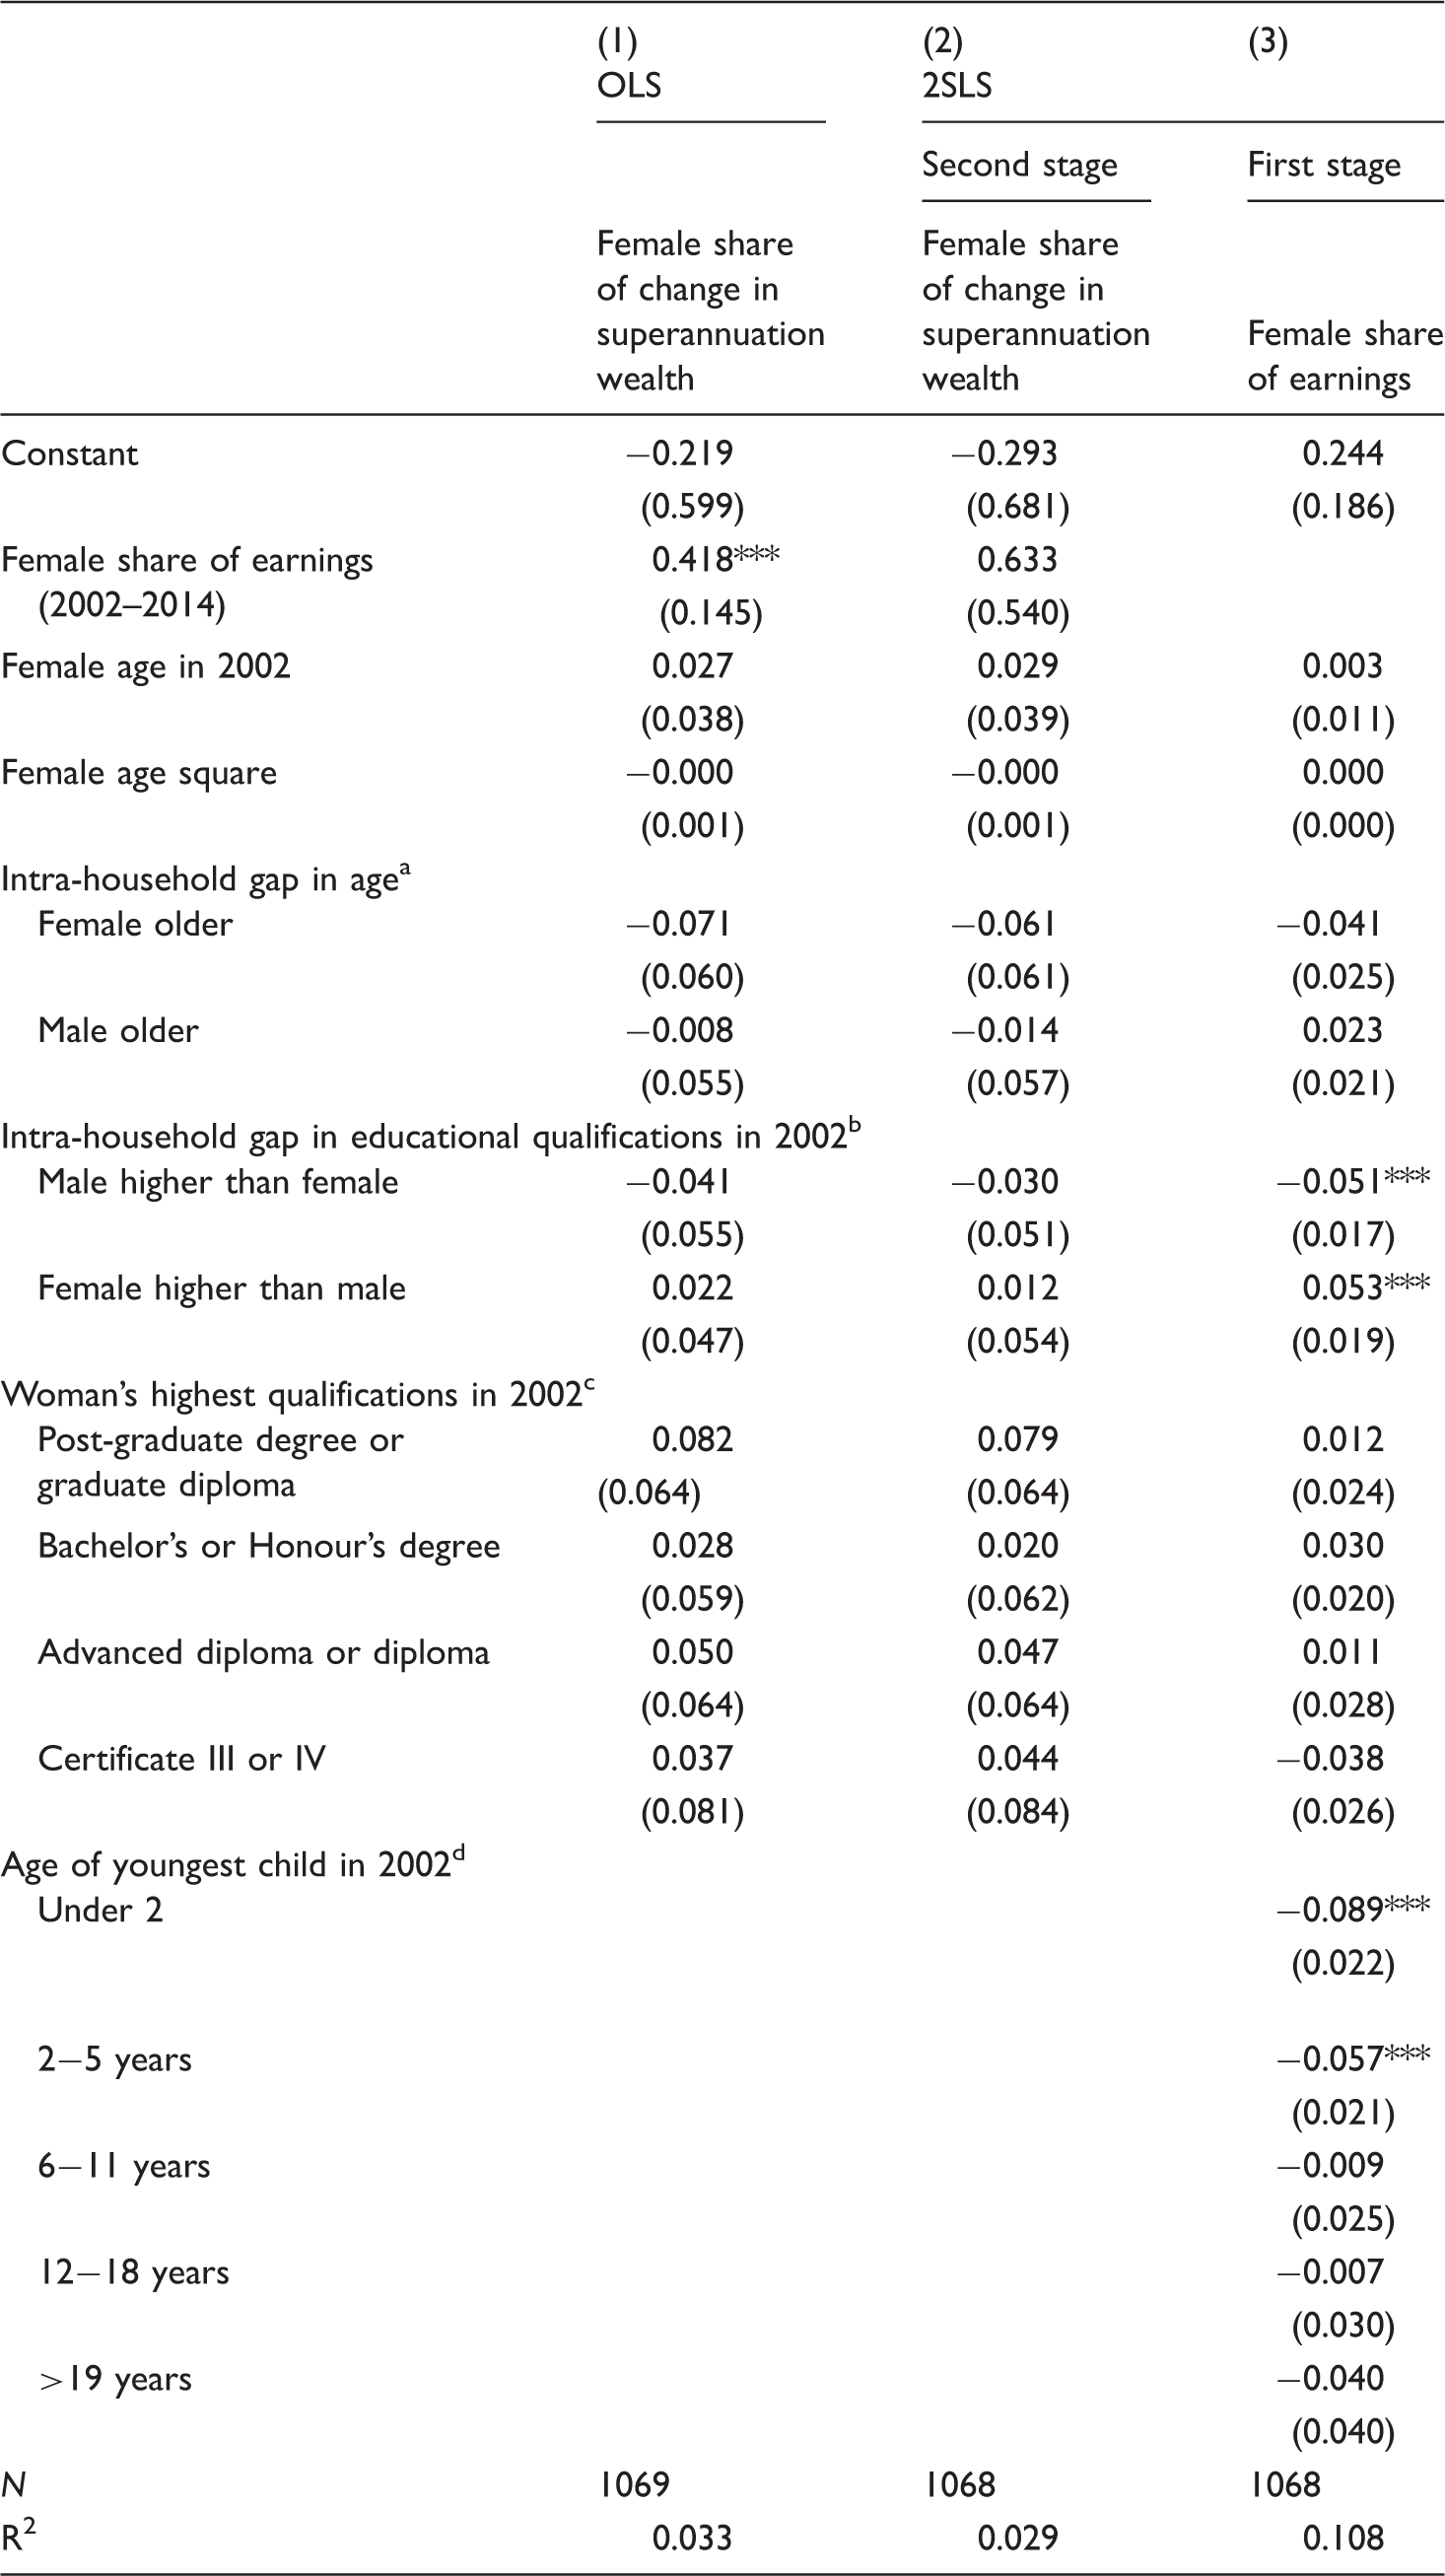
We estimate models of the growth in superannuation wealth between 2002 and 2014 by individuals as well as within a household. To account for the simultaneous determination of superannuation savings and earnings (as well as for possibly omitted variables that are correlated with both superannuation and earnings), we estimate two-stage least squares (2SLS) models in addition to OLS models. To estimate the 2SLS models, we exploit a set of instruments based on the age and the number of individuals’ children, given the evidence in our earlier analysis on the significant effect of these variables on individuals’ earnings (which also becomes apparent in the first stage results of 2SLS regressions). The assumption underlying this exclusion restriction is that individuals’ children affect their superannuation only through affecting their earnings. Following the approach used earlier, the analysis of earnings controls for measures of individuals’ age and education.
Change in superannuation wealth between 2002 and 2014, by gender, OLS and 2SLS regression coefficients, HILDA survey, Australia.

HILDA: Housing, Income and Labour Dynamics in Australia; 2SLS: two-stage least squares.
Omitted category is ‘Year 12 or less’.
Omitted category is ‘no children in 2001’. Bracketed terms are standard errors. ***denotes statistically significant at the 1% level. **denotes statistically significant at the 5% level. *denotes statistically significant at the 10% level.
Both the OLS and 2SLS results on this variable are statistically significant, with the magnitude of the estimated coefficients on long-term earnings substantially higher in the sample of males compared to females. 3 For females, OLS and 2SLS results yield similar results, whereas in the sample of males, the magnitude of the relationship between long-term earnings and growth in superannuation wealth is substantially higher in 2SLS results compared to OLS results, suggesting that OLS results under-estimate the link between the two variables. The difference in the results across the genders is important as it is likely to reflect the relatively high prevalence of women with histories of earnings below the threshold where superannuation needs to be paid (of $450 per month). For this group, although their long-term earnings are higher than women who never participated in paid work, their superannuation savings are likely to show little difference.
Intra-household gap in superannuation wealth, 2002 to 2014, OLS and 2SLS coefficients, HILDA survey, Australia.
HILDA: Housing, Income and Labour Dynamics in Australia; 2SLS: two-stage least squares.
Omitted category is ‘same age’.
Omitted category is ‘same qualifications’.
Omitted category is ‘Year 12 or less’.
Omitted category is ‘no children in 2001’. Bracketed terms are standard errors. ***denotes statistically significant at the 1% level. **denotes statistically significant at the 5% level. *denotes statistically significant at the 10% level.
Summary and conclusions
This article addresses some important limitations in cross-sectional studies of the effects on lifetime earnings of education and the gender distribution of paid and unpaid work roles. Using longitudinal data from the HILDA survey, the study measures the sum of individuals’ earnings over a 15-year period (2001–2015) and uses this to directly measure the difference in long-term earnings between graduates and non-graduates, men and women. It also explores the gender gap in retirement wealth and relates this and differences in long-term earnings to a range of factors associated with age, education and parenthood.
The simple cross-tabulations and econometric analysis show the strong association between educational qualifications and earnings for both men and women. The data show larger effects of education on earnings than those measured in studies of the rate of return to education, based on single-year cross-sectional data. The results of this study also cast light on the large differences in long-term earnings between men and women in each educational category. Whilst Bachelor's degree qualifications improve women’s earnings, they do not on average lift women’s long-term earnings above those attained by men with a high school qualification. This important feature of the relationship between education and earnings is not transparent in other studies, including those reporting that women attain a higher ‘rate of return’ from investing in a degree than men (see e.g. Wei, 2010). The increment in long-term earnings associated with parenthood also shows a large gender gap favouring men. Parenthood is associated with higher long-term earnings for men, but on average this factor has a strong negative association with women’s earnings.
The analysis points to substantial differences in the lifetime earnings of men and women that are consequential for their retirement wealth. Across all individuals, women’s median earnings over the 15-year study period were only 49.6% of men’s; and across individuals in couple households, women’s earnings were only 43.7% of the male median. The median female superannuation balance in 2014 was only 47.6% of the male median. Large gender gaps in earnings persist in groups characterized by high levels of education, indicating the over-riding effects of the gendered patterns of parenthood.
Many previous studies have identified gender gaps in wage rates, hours of work, labour force participation and wealth. This article adds to those findings by contributing a measure of the gap in long-term earnings. This directly captures the combined influence of gender gaps in wage rates, work hours and career disruptions on earnings, and the study has demonstrated the links to superannuation wealth.
The study also has a somewhat unique focus on intra-household gaps in long-term earnings. This helps to highlight the long-term consequences of the gender division of paid and unpaid work in many households. Over the study period substantial gaps can be observed in the intra-household distribution of earnings, with the median female share of earnings reaching only 32.8% and the female share of superannuation wealth only 33.3%. In households where women are more qualified than their partners, the gap in earnings and superannuation falls, but on average parity is not achieved.
A key policy implication of this study relates to the retirement income system. The large gender gaps in long-term earnings indicate the substantial long-term economic consequences of women’s unpaid roles in parenting. Given the current policy emphasis on superannuation, these consequences include being economically dependent in retirement and vulnerable. In couple households there are particular risks because under current policy settings individuals cannot access the age pension if their partner’s income and/or assets exceed eligibility thresholds. As a result, the economic wellbeing of many older women in couple households depends on their ability to negotiate access to a share of their partner’s superannuation savings. Currently there is no requirement for superannuation account holders to share decision-making on the use of accumulated funds or to take account the needs of their spouse. Some argue that couples agree to an implicit contract whereby the partner with superior superannuation contributes more to the couple’s living expenses in retirement than the partner that earns less. 4 However, we perceive that, because such outcomes are not assured and because the economic vulnerabilities are substantial, the role of the state in shaping the intra-household distribution of retirement wealth must be considered. Policies that shift the balance of the retirement system back towards an age pension and increase controls on the use of individual retirement income accounts would help redress the risks posed by the gender gap in long-term earnings and thus could represent positive change.
These findings have been limited by the HILDA’s coverage of, to date, only a third of a traditional working career (of 45 years) and by bias in the sample towards individuals and households characterized by relative stability. Yet they do show patterns of long-term earnings across gender, education, marital status and parenthood that are substantial and likely to persist through to retirement.
Keeping these limitations in mind, the findings reported in this article suggest that there is substantial research potential from longitudinal data on earnings, as these can address some of the important limitations of cross-sectional studies of returns to education and the determinants of retirement wealth. Our study indicates that there are substantial differences between estimates of the effects of education and unpaid care roles on lifetime earnings drawn from cross-sectional data for a single year and those based on long-term earnings measured using longitudinal data. As such, our article confirms the empirical case for using longitudinal data and is of particular significance given the range of important policy-related research topics that rely on estimates of lifetime earnings.
Footnotes
Acknowledgements
The authors wish to acknowledge the contributions of Rhonda Sharp, Monica Costa, Susan Himmelweit, Helen Hodgson, Ross Taplin and Alison Preston.
Declaration of conflicting interests
The author(s) declared no potential conflicts of interest with respect to the research, authorship, and/or publication of this article.
Funding
The author(s) disclosed receipt of the following financial support for the research, authorship and/or publication of this article: This work was supported by the Australian Research Council Discovery Program (Grant DP 170103297).