
Abstract
This article provides an overview of the measurement of, and trends in, the prevalence of non-standard employment in Australia. Using the most recent data from the Household, Income and Labour Dynamics in Australia Survey (2001–2017), the share of non-standard employment in total employment is estimated to have been 54.9% in 2001. In the most recent data (for 2017) the share is only slightly higher – 55.6%. Still, the intervening period was marked by significant changes, with the share of non-standard workers declining until 2008, and increasing again since then. Within the broad group of non-standard employment, the prevalence of individual employment types has developed in different directions. While casual employment has followed the overall trend of an initial decline followed by a recent increase, the shares of permanent part-time work and fixed-term contracts in total employment have increased throughout most of the period, and the reverse is true of self-employment. These trends can only to a limited degree be explained by changes in worker and job characteristics, leading to the conclusion that these changes are primarily due to changed job selection behaviour of workers and/or changed hiring practices of employers.
Introduction
Recent decades have seen increased concern about rising levels of non-standard employment and what this implies for the quality of jobs (e.g., Australian Council of Trade Unions (ACTU), 2018; Green et al., 2010; Kalleberg et al., 2000; McGovern et al., 2004; Watson, 2005). In particular, non-standard employment – a term that is usually used to describe any form of employment other than permanent full-time dependent jobs – is typically seen as ‘precarious’, with adverse consequences for workers flowing from greater economic insecurity (e.g., Campbell and Burgess, 2018; Markey and McIvor, 2018; Rogers, 1989; Tweedie, 2013). Such concerns have received added impetus in recent years from fears about the impact of new digital technology and its potential to facilitate greater use of ‘gig work’ (Healy et al., 2017).
Evidence suggests the incidence of non-standard employment is on the rise in many Western countries. Hipp et al. (2015), for example, report European Labour Force Survey (LFS) data spanning the period 1996/1997 to 2011 that show the main forms of non-standard employment (which they list as temporary, part-time and solo self-employment) as a proportion of the working-age population rising in 19 out of 21 countries.
In Australia, the incidence of non-standard employment rose dramatically during the last three decades of the 20th century, driven mainly by growth in both part-time and casual employment. Wooden (2002), for example, estimated that employees in non-standard jobs accounted for 47% of all employed in 2000 compared with 34% in 1984 and 24% in 1971. 1 Further, Australian levels of non-standard employment are very high by international standards; in 2013, Australia ranked third highest in the OECD (2015: 140).
The ACTU (2011a) has long described these levels of non-standard employment as having reached ‘crisis’ proportions. In their view, the proliferation of non-standard employment is an attack on worker rights that must be dealt with through labour law reform. In response, they have mounted a succession of public campaigns aimed at securing improved rights for workers on casual and fixed-term contracts. In contrast, the Productivity Commission, in its 2015 report on Australia's workplace relations framework, recommended that clauses in enterprise agreements restricting the use of casual workers, labour hire workers or contractors be made unlawful (Productivity Commission, 2015). To date the ACTU case seems to have gained traction. This is most obviously reflected in a Fair Work Commission (FWC, 2017) decision emanating out of a four-yearly review of modern awards that gave special consideration to casual and part-time employment. As a result of that decision, commencing October 2018, all casual employees covered by awards who can demonstrate regular employment over the preceding 12 months have the right to request conversion to permanent employment.
But has the share of non-standard employment continued to rise in 21st century Australia? The evidence on this point is unclear. To many this might seem surprising given reports of ongoing growth in casual and part-time employment and in insecure work more generally (e.g., ACTU, 2018; Carney and Stanford, 2018). Nevertheless, there has been very little research that has systematically quantified the different types of employment in Australia and how the mix of employment types has changed in recent years. Further, the evidence that does exist provides both a mixed and incomplete picture. Shomos et al. (2013), for example, drawing on data from both Household, Income and Labour Dynamics in Australia (HILDA) Survey and surveys conducted by the Australian Bureau of Statistics (ABS), report that the share of permanent employees in total employment actually increased over the decade to 2011. However, they also report that the growth in permanent employment was disproportionately concentrated in part-time jobs, and thus the net effect on the overall non-standard employment share is unclear. Unfortunately, they do not provide estimates of the overall level of non-standard employment. Gilfillan (2018) presents more recent ABS LFS data suggesting that the non-standard employment share continues to rise, albeit at a much slower pace than previously. His analysis, however, is restricted to employees only, and additionally cannot consider fixed-term contract workers.
The principal aim of this article is to provide a comprehensive picture of the prevalence of, and recent trends in, non-standard employment in Australia. We begin by discussing definitions and measurement of the different forms of employment and showing how they can be operationalised using Australian household survey data. We then report estimates of the prevalence of non-standard employment in Australia, broken down into its main components, and show how levels have changed since 2001. We also report changes in the composition of the workforce by selected worker and firm characteristics. Following this, the study breaks new ground by using multivariate decomposition analysis to determine the extent to which changes in the prevalence of employment types over the 2001–2017 period are due to these compositional changes or to other factors, such as changes in the job search behaviour of workers and/or hiring practices of employers.
Defining and measuring non-standard employment in Australia
Definition and meanings
Non-standard employment, or what has been referred to elsewhere as ‘atypical work’, ‘alternative work arrangements’ or ‘flexible employment/contracts’, has, as already noted, most commonly been defined as any job that ‘differs from full-time, permanent, wage and salary employment’ (Polivka and Nardone, 1989: 10). This covers a disparate array of employment arrangements, including self-employment, part-time work, and any job where there is no commitment on the part of the employer to a long-term relationship (e.g., fixed-term contracts, casual employment, and temporary agency work).
Use of the term can be traced back to the mid-1980s (e.g., Córdova, 1986; Mückenberger, 1985), and reflected an emerging realisation in the Western world that labour markets were rapidly changing. In particular, concerns emerged that the traditional employment model, involving full-time employment, highly stable career patterns, and relatively homogenous types of employment contracts, was breaking down (Eichhorst and Marx, 2015). The extent to which this stylised view was an accurate description of the post-war labour force is questionable, but what was clear was that employment arrangements in the 1970s and 1980s were becoming less standardised. This was reflected most obviously in the growth in part-time employment, but also in greater use of temporary employment arrangements.
As observed by the OECD (2015), this division of jobs into two broad categories – standard and non-standard employment – is a convention that is now widely accepted and used, both by researchers (e.g., de Grip et al., 1997; Delsen, 1991; Kalleberg et al., 2000) and by relevant international agencies (e.g., Eurofound, the International Labour Organization (ILO), and the OECD). However, with fewer workers employed in permanent full-time jobs, it may be questioned whether this employment type should still be referred to as the ‘standard’, and, consequently, others labelled non-standard. We would argue that use of the standard/non-standard terminology is still warranted, regardless of the actual prevalence in the workforce, given permanent full-time waged employment remains the reference point when it comes to employment protection, benefits and career development. This is particularly obvious when compared with casual work, which is explicitly excluded from most benefits and entitlements attached to permanent work, and when contrasted with fixed-term contracts, given the finite nature of these contracts. Even permanent part-time work, which comes with similar entitlements and levels of protection as permanent full-time employment, is often seen as a deviation from the ‘norm of the ideal worker’ (Campbell et al., 2011: 161), and has been shown to be associated with disadvantages in terms of job content, work-related training and career advancement (e.g., Campbell et al., 2011; Charlesworth and Whittenbury, 2007; McDonald et al., 2009). Further, the reduced earnings that come with part-time work have implications for individual economic independence, household income and superannuation balances.
An advantage of the concept of non-standard employment is also ease of measurement: Identifying non-standard workers in survey data is relatively straightforward compared with alternative approaches aimed, for example, at trying to identify workers in precarious or insecure jobs. Consequently, non-standard employment can only be considered a crude proxy measure for precarious or insecure jobs. As the OECD (2015: 138) notes, while many jobs covered by this definition (e.g., short-term casual and temporary jobs) will have characteristics associated with precariousness, there will be others that do not (notably many permanent part-time positions). Relatedly, this distinction between standard and non-standard work has relatively little to do with worker preferences. While many workers may be forced to accept non-standard jobs due to a lack of acceptable alternatives, there will be others for whom a non-standard job, and especially part-time hours, is the preferred outcome.
Measurement
In Australia, as in most other industrial countries, the identification and measurement of employment begins with the ILO labour force framework. Accordingly, individuals are considered employed if they have engaged in paid employment for at least 1 hour during a one-week reference period. It is then conventional to distinguish between different types of job holders based on the relationship between the worker and the enterprise they work for; that is, between employees and the self-employed. One problematic subgroup is owner-managers of incorporated businesses, whom the ABS treats as employees of their own business. But while the legal status of a business has implications for who is held responsible in the event of insolvency, it has no bearing on the employment relationship – the owner of a firm is fundamentally different to other persons employed in that firm, not least because of the power the owner has over hiring and firing decisions and the allocation of tasks among workers. In this analysis, therefore, we treat all owner-managers, regardless of the legal status of their businesses, as self-employed.
There is a third category of employed persons – contributing family workers – who do not fit neatly into either the employee or self-employed groups. Workers in this category clearly fit the definition of non-standard employment but are relatively few.
Within the employee group, we next categorise workers according to the nature of their employment contract. In Australia, these take three main forms: (i) fixed-term contracts; (ii) casual employment; and (iii) permanent or ongoing contracts.
Fixed-term contracts cover all employment contracts that specify a date or event when employment will be terminated. In Australia, fixed-term contracts generally come with the same entitlements as permanent contracts (e.g., with respect to paid leave and paid holidays). Further, fixed-term contract workers have a general expectation of being employed at least for the duration of their current contract.
Less straightforward is the identification of casual employment. While a dictionary definition would suggest that casual employees are hired for very short periods, with each engagement of work constituting a separate contract of employment, it is generally accepted that many casual employees work regular hours for the same employer over long periods (Owens, 2001), a view that is supported by survey data (e.g., Markey and McIvor, 2018). 2 Ultimately, the key defining feature of casual employment is the absence of any advance commitment on the part of the employer to both the continuity of employment and the number of days or hours to be worked (Creighton and Stewart, 2010: 198). It might therefore seem difficult to distinguish between casual employees and permanent (or ongoing) employees given both have open-ended employment contracts and only rarely are employment contracts truly permanent. Casual employment in Australia, however, is (and has long been) the subject of extensive regulation (see FWC, 2017: 21–45). It is specifically provided for in industry awards, with casual employees singled out as not having any legal entitlement to many forms of paid leave (notably annual leave and sick leave), paid public holidays, minimum periods of notice of termination, or severance pay. At the same time, a long-standing feature of award regulation is the requirement of the payment of a substantial hourly wage premium to casual workers, which helps to compensate for the loss of other benefits. Thus, while there is no unambiguous definition of casual employment that is applied in awards, and while we recognise that there has been debate about this issue (cf. Campbell and Burgess, 2001; Murtough and Waite, 2001), our contention is that most casual employees in Australia should be able to recognise that they are employed on a casual basis.
An alternative, and longer-standing, approach is to infer casual employment status from survey data on leave entitlements, with employees reporting receiving neither paid annual leave nor paid sick leave entitlements being classified as casual workers. As noted by Dawkins and Norris (1990), use of this approach was both driven by the absence of any alternative data source and encouraged by the ABS. Commencing 1984 the ABS began collecting data on leave entitlements as part of a household survey conducted as a supplement to the August round of the monthly LFS that was specifically focussed on employment benefits. With the release of estimates for 1988 the ABS then defined casual employees to be those employees ‘who were not entitled to either annual leave or sick leave in their main job’ (ABS, 1989: 27). Subsequently, the ABS abandoned this definition, but using leave entitlements to identify casual employment in Australia remains common practice, perhaps because it is the only method for providing a roughly comparable long-running annual time series (extending back to 1984). 3
In this analysis, we rely mostly on data using the self-classification method, but also discuss how sensitive estimates of the level of casual employment are to these definitional differences.
The final dimension we use to identify non-standard employees is usual working hours. That is, among employees on permanent contracts we distinguish between full-time and part-time workers. There is, however, no internationally accepted definition of part-time work. Definitions used by official national statistics agencies, for example, vary in terms of: (i) whether a weekly hours threshold is used or whether part-time is self-defined; (ii) if a weekly hours threshold is used, which threshold is chosen (usually either 30 or 35 hours); (iii) whether usual or actual hours are used (or a combination of both); and (iv) whether the hours cover all jobs or just the main job (van Bastelaer et al., 1997). In Australia, the ABS in its monthly LFS defines part-time workers as employed persons ‘who usually worked less than 35 hours a week (in all jobs) and either did so during the reference week, or were not at work in the reference week.’ The reference to hours worked in all jobs, however, is problematic for identifying workers in standard and non-standard employment. Most obviously, there are persons holding multiple part-time jobs who will be classified as full-time workers, and hence as being in standard employment, when none of the jobs they hold meet the full-time criterion. Indeed, in supplements to the LFS (notably the Characteristics of Employment (CoE) Survey), the ABS distinguishes between part-time workers in all jobs and part-time workers in the main job. We thus define part-time jobs based on the number of hours worked in the main job and, in line with ABS practice, use a 35 weekly hours threshold to identify full-time work.
The classification system described above is summarised in Figure 1. Workers in standard employment are those in the box in the bottom left corner – permanent full-time employees. All other workers (those in the shaded boxes) have non-standard jobs.
Classification of employment types.
Employees could also be classified according to whether or not they are employed through an intermediary or agency. Such workers are generally thought of as having a non-standard employment relationship since the employing organisation is not the organisation for which the labour services are performed. However, given such positions are often the result of a short-term need to meet some temporary peak in demand or to cover absences of regular employees, most agency workers will be employed on a fixed-term or casual basis and so already covered by the typology in Figure 1. Nevertheless, there will be a minority of agency workers (e.g., those with highly valuable but specialised skills) who are employed on an ongoing contract with the agency who arguably should be classified as being in non-standard jobs due to the peculiar, tripartite nature of the employer–employee relationship. In this analysis, however, we treat these agency workers on permanent contracts as being in standard employment.
The prevalence of non-standard employment in Australia: ABS and HILDA Survey estimates compared
Estimates of the prevalence of non-standard employment (% of all employed persons), 2016.

Includes a small number of cases (about 0.3% of all employed persons) who selected the option ‘other’ when asked about their employment contract type and who could not be back-coded to one of the three main contract types. While the contract type of these employees cannot be determined, they are very likely to be in a non-standard relationship.
Persons reporting that they ‘don't know’ whether they have entitlements to paid annual leave and/or paid sick leave are treated as not having any entitlements.
The CoE Survey also excludes all persons living in non-private dwellings. The HILDA Survey also excluded such persons at the first wave (but not students living in boarding schools and university colleges) but not at subsequent waves. Given the focus on employment, however, these exclusions and differences should have a negligible impact on the estimates.
According to both sources, less than half of the employed Australian workforce was in a standard employment relationship (i.e., had a permanent full-time job) in 2016 – 47.9% when using the CoE Survey and 45.1% when using the HILDA Survey. And both surveys indicate that the most prevalent form of non-standard employment is casual employment, accounting for almost one in every five workers (19.5% or 19.6%) when using a self-classified measure. Further, using the alternative proxy measure of casual employment based on the absence of leave entitlements also produces two reasonably similar, but larger, estimates – 20.8% of all employed persons when using the CoE Survey and 22.4% when using the HILDA Survey. The difference in estimates produced by the two alternative methods is most marked in the HILDA Survey data and can be explained in part by the treatment of fixed-term contract workers. When using the self-definition method, HILDA Survey respondents cannot select both casual employment and fixed-term contract employment, yet around 17% of persons selecting fixed-term contract employment in 2016 also reported that they did not receive either paid sick or paid annual leave. 4
The two data sources also produce similar estimates of the prevalence of permanent part-time work – 12.8% of all employed in the CoE Survey and 12.1% in the HILDA Survey.
The lower standard employment share in the HILDA Survey is driven mainly by a much larger estimate of fixed-term contract employment – 8.7% compared with just 2.8% in the CoE Survey (though the latter percentage rises to 3.4% if all persons reporting to be employed on both a casual basis and on a fixed-term contract are counted as fixed-term contract workers). This marked difference in the shares of fixed-term contract workers between ABS surveys and the HILDA Survey has also been found in previous years and discussed by the Productivity Commission (2006: 131–132). They pointed to the administration of the LFS (and its supplements) on an ‘any responsible adult’ basis and the use of a two-part question that first requires respondents to indicate whether their employment has a set end date or event as potential sources of underestimation within the ABS surveys. However, the absence of any clear definition of a fixed-term contract in the HILDA Survey will likely lead to inconsistencies in reporting across individuals in that dataset.
There is also a marked divergence in the two surveys in their estimates of self-employment – the CoE Survey suggests that the self-employed accounted for 17% of total employment, whereas the HILDA Survey estimate is just 13.9%. Differences here could reflect: (i) relatively high rates of non-response among the self-employed in the HILDA Survey that may have not been adequately corrected for by the weighting procedure; (ii) potential classification errors in the CoE Survey stemming from interviewing one responsible adult in the household rather than every adult; and (iii) potential classification errors in the HILDA Survey stemming from a less well-trained interviewer workforce.
Recent trends
Figure 2 uses data from the HILDA Survey to show how the share of standard and non-standard forms of employment, and its composition by employment type, has evolved since the beginning of the millennium. The overall share of non-standard employment in the most recent figures – 55.6% – is as high as it has ever been over this period. Nevertheless, this proportion is only slightly higher than the level at the start of the century. Significant changes, however, occurred in the intervening period, with the share falling markedly during the first half of the period – from 54.9% in 2001 to 51.2% in 2008. Since then, and perhaps influenced by the Global Financial Crisis (GFC), the trend has reversed, and by 2014 the non-standard employment share had returned to its 2001 level.
Trends in employment arrangements, 2001–2017 (% of all employed persons). Notes: n = 160,174. Data weighted using responding person weights. Source: HILDA Survey (Department of Social Services / Melbourne Institute of Applied Economic and Social Research, 2018).
This pattern of first decline and then increase is not, however, mirrored in the trends for each of the different sub-types of non-standard employment. The permanent part-time employment share has exhibited close to constant growth over much of the period, rising from 9% in 2001 to 12.7% by 2013, before subsiding slightly (12.1% in 2017). There has also been a clear upward trend in the fixed-term contract employment share, which has risen from 7.2% in 2001 to 9.1% in 2017 (though growth has been very uneven over the period). In contrast, the self-employment share has moved in the opposite direction, falling from 17.5% in 2001 to 14.0% by 2013, before stabilising in recent years. Only the casual employment share has exhibited a pattern of first declining (from 20.3% in 2001 to 17.9% by 2010) and then rising (to 20.2% by 2015) so that the share in 2017 (19.9%) is similar to the level of 2001.
Rising workforce casualisation?
At first glance the trend in casual employment depicted in Figure 2 appears to contrast with the often-heard claim that work in Australia is becoming increasingly casualised (e.g., ACTU, 2011b; Carney and Stanford, 2018). Indeed, arguably the most striking feature of the trend in the casual employment share is how little has changed since 2001. The conclusion that trends in casual employment have been relatively flat for a long time receives added support from ABS LFS data where casual employment is proxied by the absence of paid leave entitlements. As shown in Figure 3, the proportion of employed persons who are employees without paid leave entitlements is only slightly higher in 2018 than in 2000 – 20.6% versus 20.0%. Indeed, the ABS data on the share of workers without paid leave entitlements exhibit far more stability over the past two decades than the comparable measure from the HILDA Survey (possibly reflecting lesser sampling variability in the LFS). More importantly, the ABS data show that most of the growth in the casual employment share occurred in earlier decades, and especially in the 1980s and the first half of the 1990s. Nevertheless, both the ABS and HILDA Survey do show that in recent years (since 2008 in the ABS data and since 2010 in the HILDA Survey) the share of casual employment has been rising, albeit modestly.
Trends in casual employment using a leave-entitlements-based definition (% of all employed). Notes: ABS estimates are determined by dividing the number of employees identified as having no paid leave entitlements in the August supplement to the LFS by the number of all employed persons as measured in the main LFS. The estimates for earlier years (ABS I) include owner-managers of incorporated enterprises in the numerator. For later years (ABS II) this is not the case. Sources: ABS 1984–1987 – Dawkins and Norris (1990); ABS 1988–1991 – ABS, Weekly Earnings of Employees (Distribution), Australia (ABS cat. no. 6310.0); ABS 1992–2013 – ABS, Employee Earnings, Benefits and Trade Union Membership, Australia (ABS cat. no. 6310.0); ABS 2014–2018: ABS, Labour Force, Australia, Detailed, Quarterly (ABS cat. no. 6291.0.55.003), Data Cube EQ04; ABS, Labour Force Australia (cat. no. 6202.0), Table 01; HILDA Survey, Department of Social Services / Melbourne Institute of Applied Economic and Social Research (2018).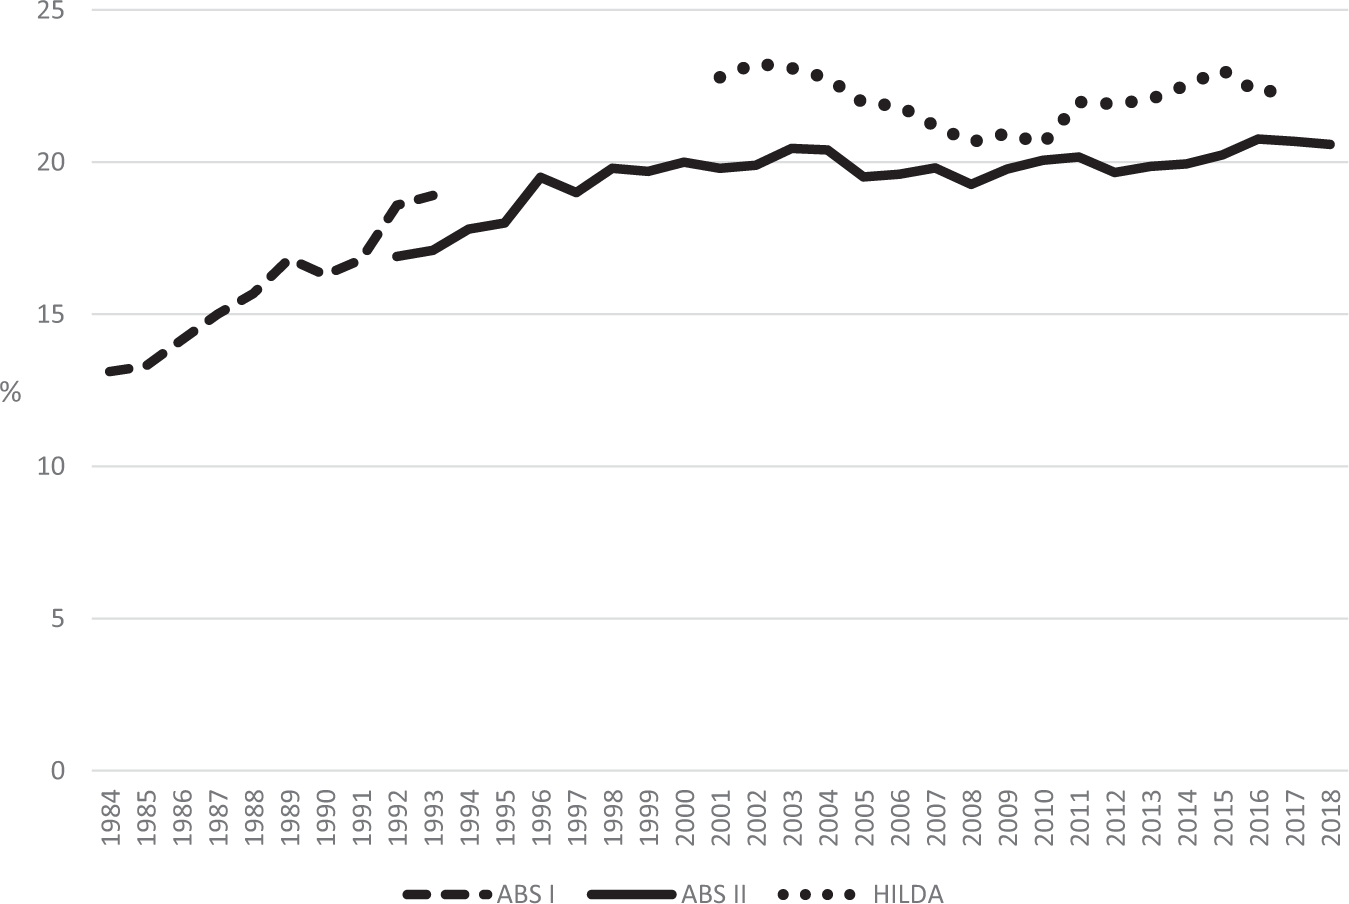
Spread of temporary agency work?
The HILDA Survey also provides information on the prevalence of workers employed through a labour hire firm or temporary employment agency. Overall, only a minority of workers are employed under such arrangements. More importantly, and perhaps counter to a view held by many, the share of temporary agency workers in total employment has declined in Australia, from 3.1% in 2001 to 2.4% in 2010 and 2.2% in 2017.
ABS data from the 2016 CoE Survey suggest the incidence of agency work is even smaller, with just 1.1% of employed reporting that they both found their job through a labour hire firm or temporary employment agency and were paid by that firm. Nevertheless, the ABS data also point to a decline in the incidence of this form of employment, with the comparable share in the November 2001 FoE Survey being 1.8%.
What about independent workers?
Another trend depicted in Figure 2, and one that again flies in the face of popular perceptions, is the decline in the self-employment share. Given the widespread concerns with both the level of outsourcing by firms (e.g., Goldschmidt and Schmieder, 2017; Weil, 2014) and the emergence of the ‘gig economy’ (e.g., Friedman, 2014; Stanford, 2017), one could be excused for believing that the number of self-employed workers must be growing rapidly. The reality, however, is that self-employment growth is well behind growth rates in other forms of employment. Further, this is not an artefact of some weakness in the HILDA Survey sample – it is a pattern also present in LFS data. LFS data show that the number of self-employed has, since 2001, been growing by just 0.8% per annum, well below the average annual growth rate in overall employment over the same period (2.0%).
As shown in Figure 4, however, this relative decline in self-employment is largely concentrated on full-time workers. Indeed, the proportion of employed persons who work part-time hours in their own business without any employees has been slowly but steadily rising – from about 3% of employment to around 4% – which may reflect growth in gig work. We suspect that sole trader status and part-time hours are characteristics of many new gig jobs, especially those where digital platforms play a central role in connecting workers with customers (such as Uber drivers and food delivery couriers). It must also be borne in mind that employment status is based on the main job, whereas many of the new gig jobs may be second jobs and hence not captured by the trends displayed in Figure 4. McDonald et al. (2019), for example, report results from an online survey conducted in early 2019 revealing that around 7% of all Australians aged 18 to 74 had earned income from digital platform work in the preceding 12 months. However, very few – less than 3% of persons doing any digital platform work – indicated that they were engaged in this activity full-time.
Trends in self-employment (% of all employed) by employer status and working hours. Source: HILDA Survey (Department of Social Services/Melbourne Institute of Applied Economic and Social Research, 2018).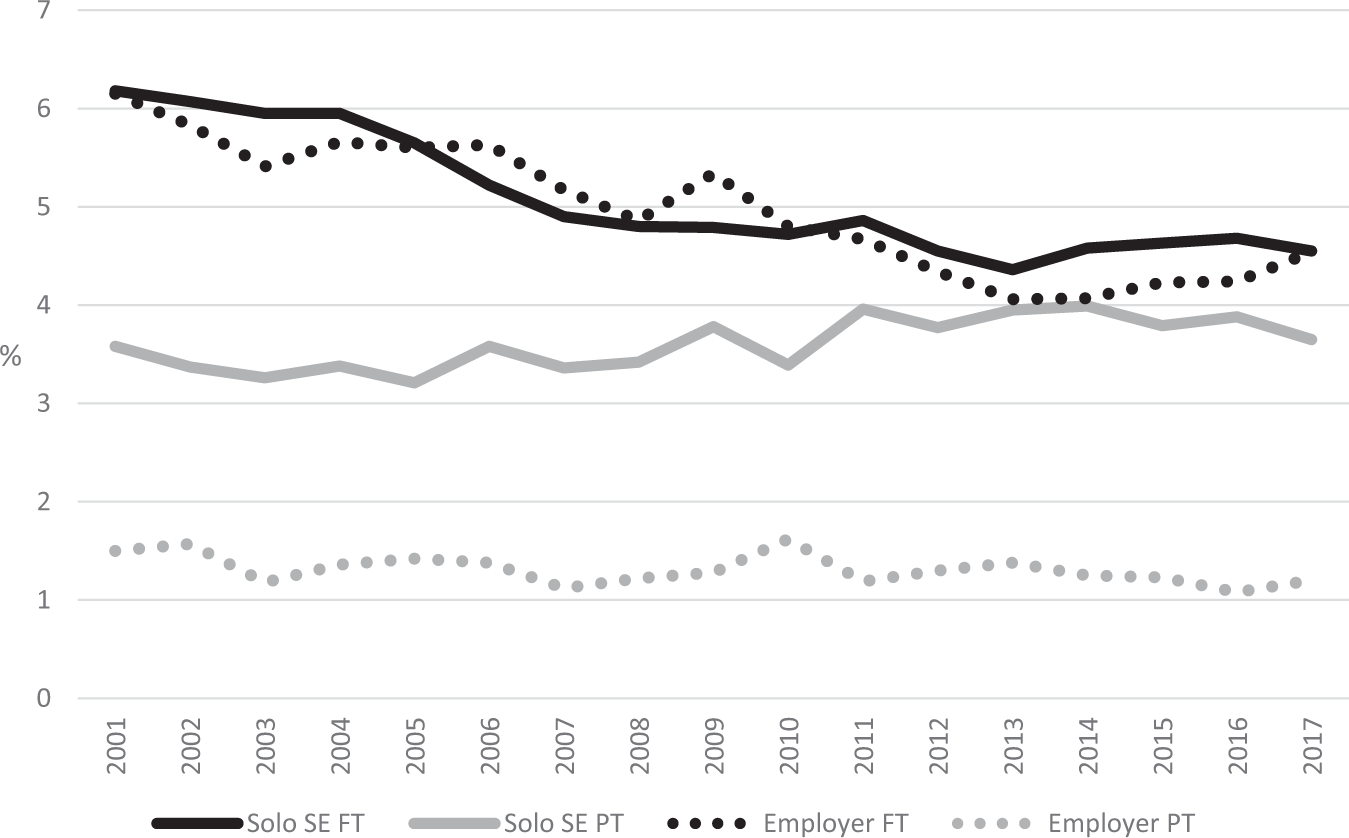
The role of changing workforce composition
Composition of the workforce by selected characteristics, 2001, 2008 and 2017 (% unless stated otherwise).
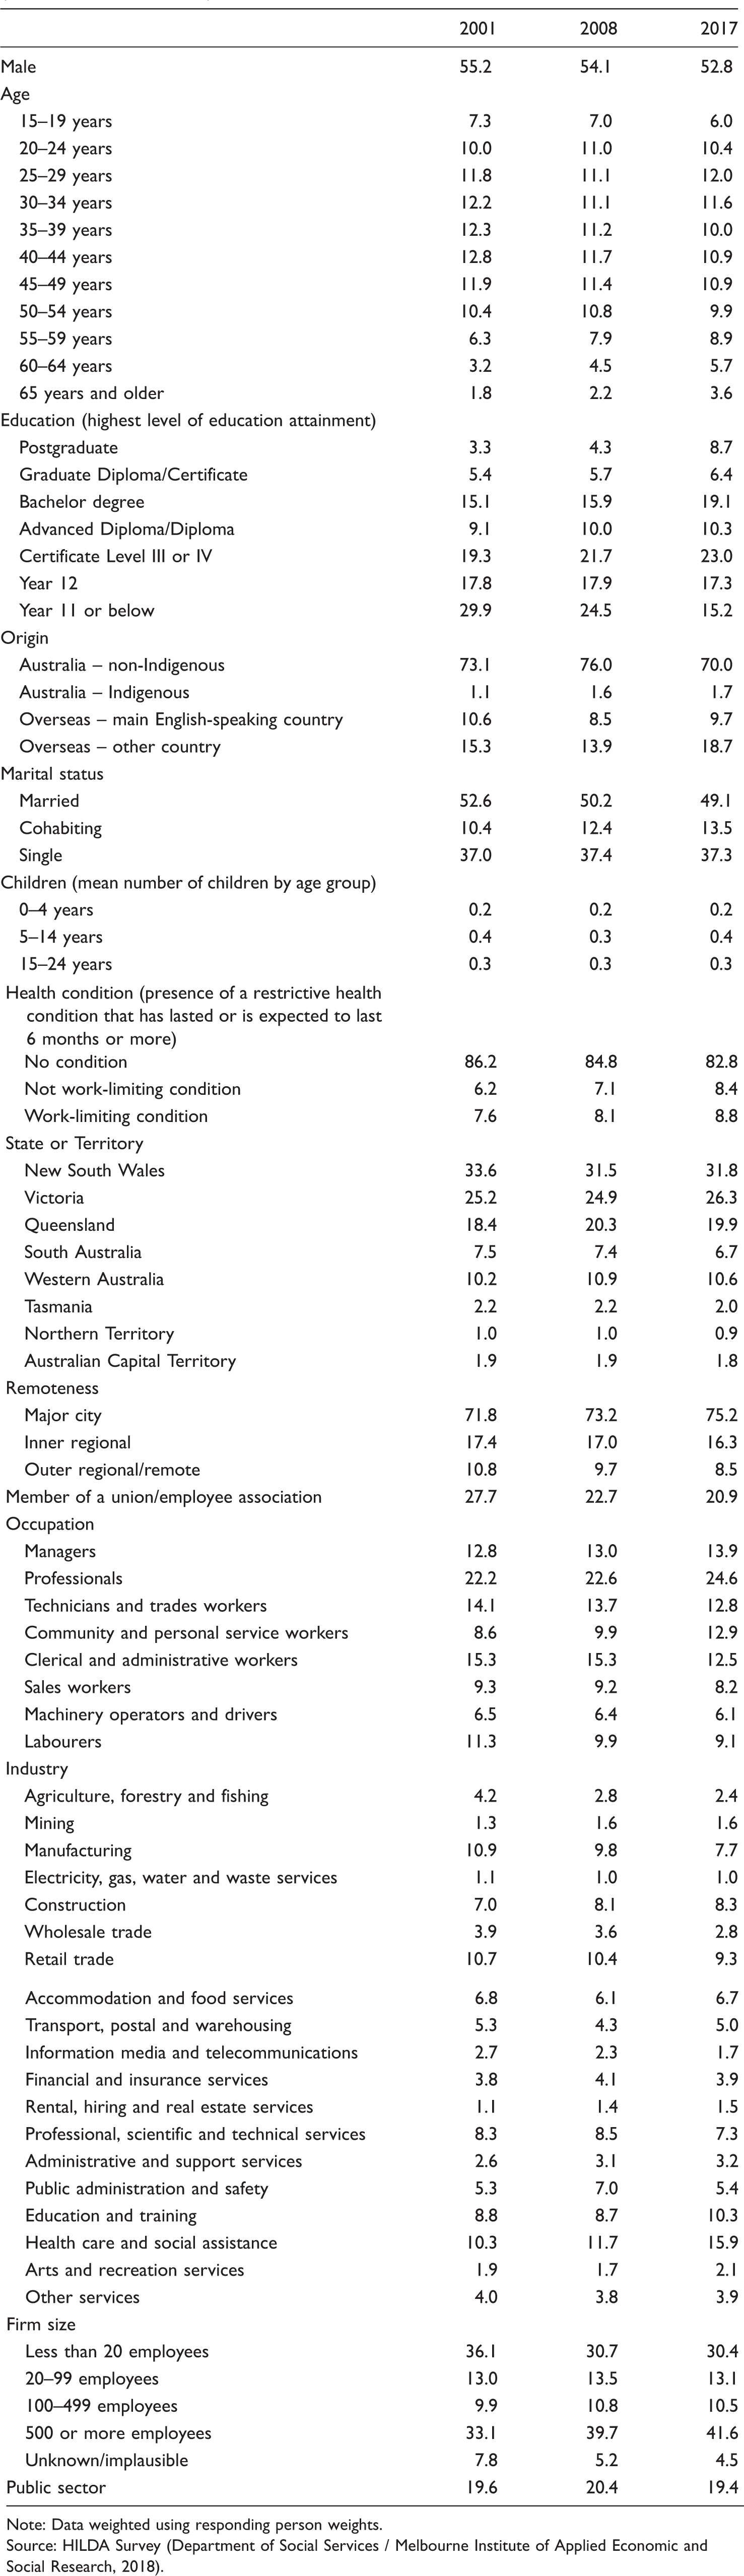
Note: Data weighted using responding person weights.
We now turn to Oaxaca-Blinder style decompositions (Blinder, 1973; Oaxaca, 1973) to analyse to what extent these compositional changes in the workforce can explain the changes in the prevalence of different employment types between 2001 and 2017. This regression-based method allows decomposing the difference in the share of each employment type between two selected years into one part that is due to differences in worker and job characteristics (the ‘explained’ part) and one part that is due to differences in the impact of these worker and job characteristics on the prevalence of each employment type (the ‘unexplained’ part, or what could also be described as behavioural change).
Decomposition analysis is a long-established method that has most frequently been used to study wage differentials between groups of individuals, especially between the genders (for a meta-analysis, see Weichselbaumer and Winter-Ebmer, 2005). While less common, the method is also suited to the investigation of differences in labour market outcomes between time points rather than groups (e.g., Bachmann and Sinning, 2016; Fairlie and Sundstrom, 1999). Nevertheless, previous studies on the drivers of change in the prevalence of particular employment types in Australia have relied on shift-share analysis (e.g., de Ruyter, 1997; Sadler and Aungles, 1990; Shomos et al., 2013). Shift-share analysis is usually based on macro-data and can only be used to investigate the role of one explanatory factor at a time. In contrast, decomposition approaches based on multiple regression analysis allow exploration of the role of one factor while holding other factors constant.
We use the ‘oaxaca’ command in Stata, developed by Jann (2008), with the pooled option, which utilises the coefficients of a joint regression model of both years (including a year dummy) as reference coefficients. While decomposition analysis was originally developed for use in conjunction with linear regression, a non-linear regression model is required in our case given the outcome variable is categorical. We therefore estimate a series of binary logistic regression models where the outcome is the likelihood of working in one of the employment types relative to working in any of the other employment types, 5 and apply the decomposition methodology for non-linear models proposed by Yun (2004). Given the non-linear trend in the prevalence of different employment types over the 17-year period, we present three decomposition models for each employment type: The first model analyses changes over the entire period by comparing 2001 with 2017, and the second and third models look at changes within sub-periods by comparing 2001 with 2008 and 2008 with 2017, respectively. The analysis is weighted using cross-section responding person weights, and standard errors are clustered on the individual. The models include all worker and job characteristics presented in Table 2, but to avoid potential collinearity, neither firm size nor public sector are included in the model for self-employed workers. We apply the deviation contrast transform to the categorical predictor variables in our models to ensure the results are not dependent on the choice of reference category (Jann, 2008). When presenting results, the contribution of sets of variables is summarised in a single coefficient. However, when discussing our results, we also make use of the estimated coefficients on the individual variables.
Impact of changing workforce composition on trends in standard employment, 2001–2017 (Oaxaca-Blinder decomposition).
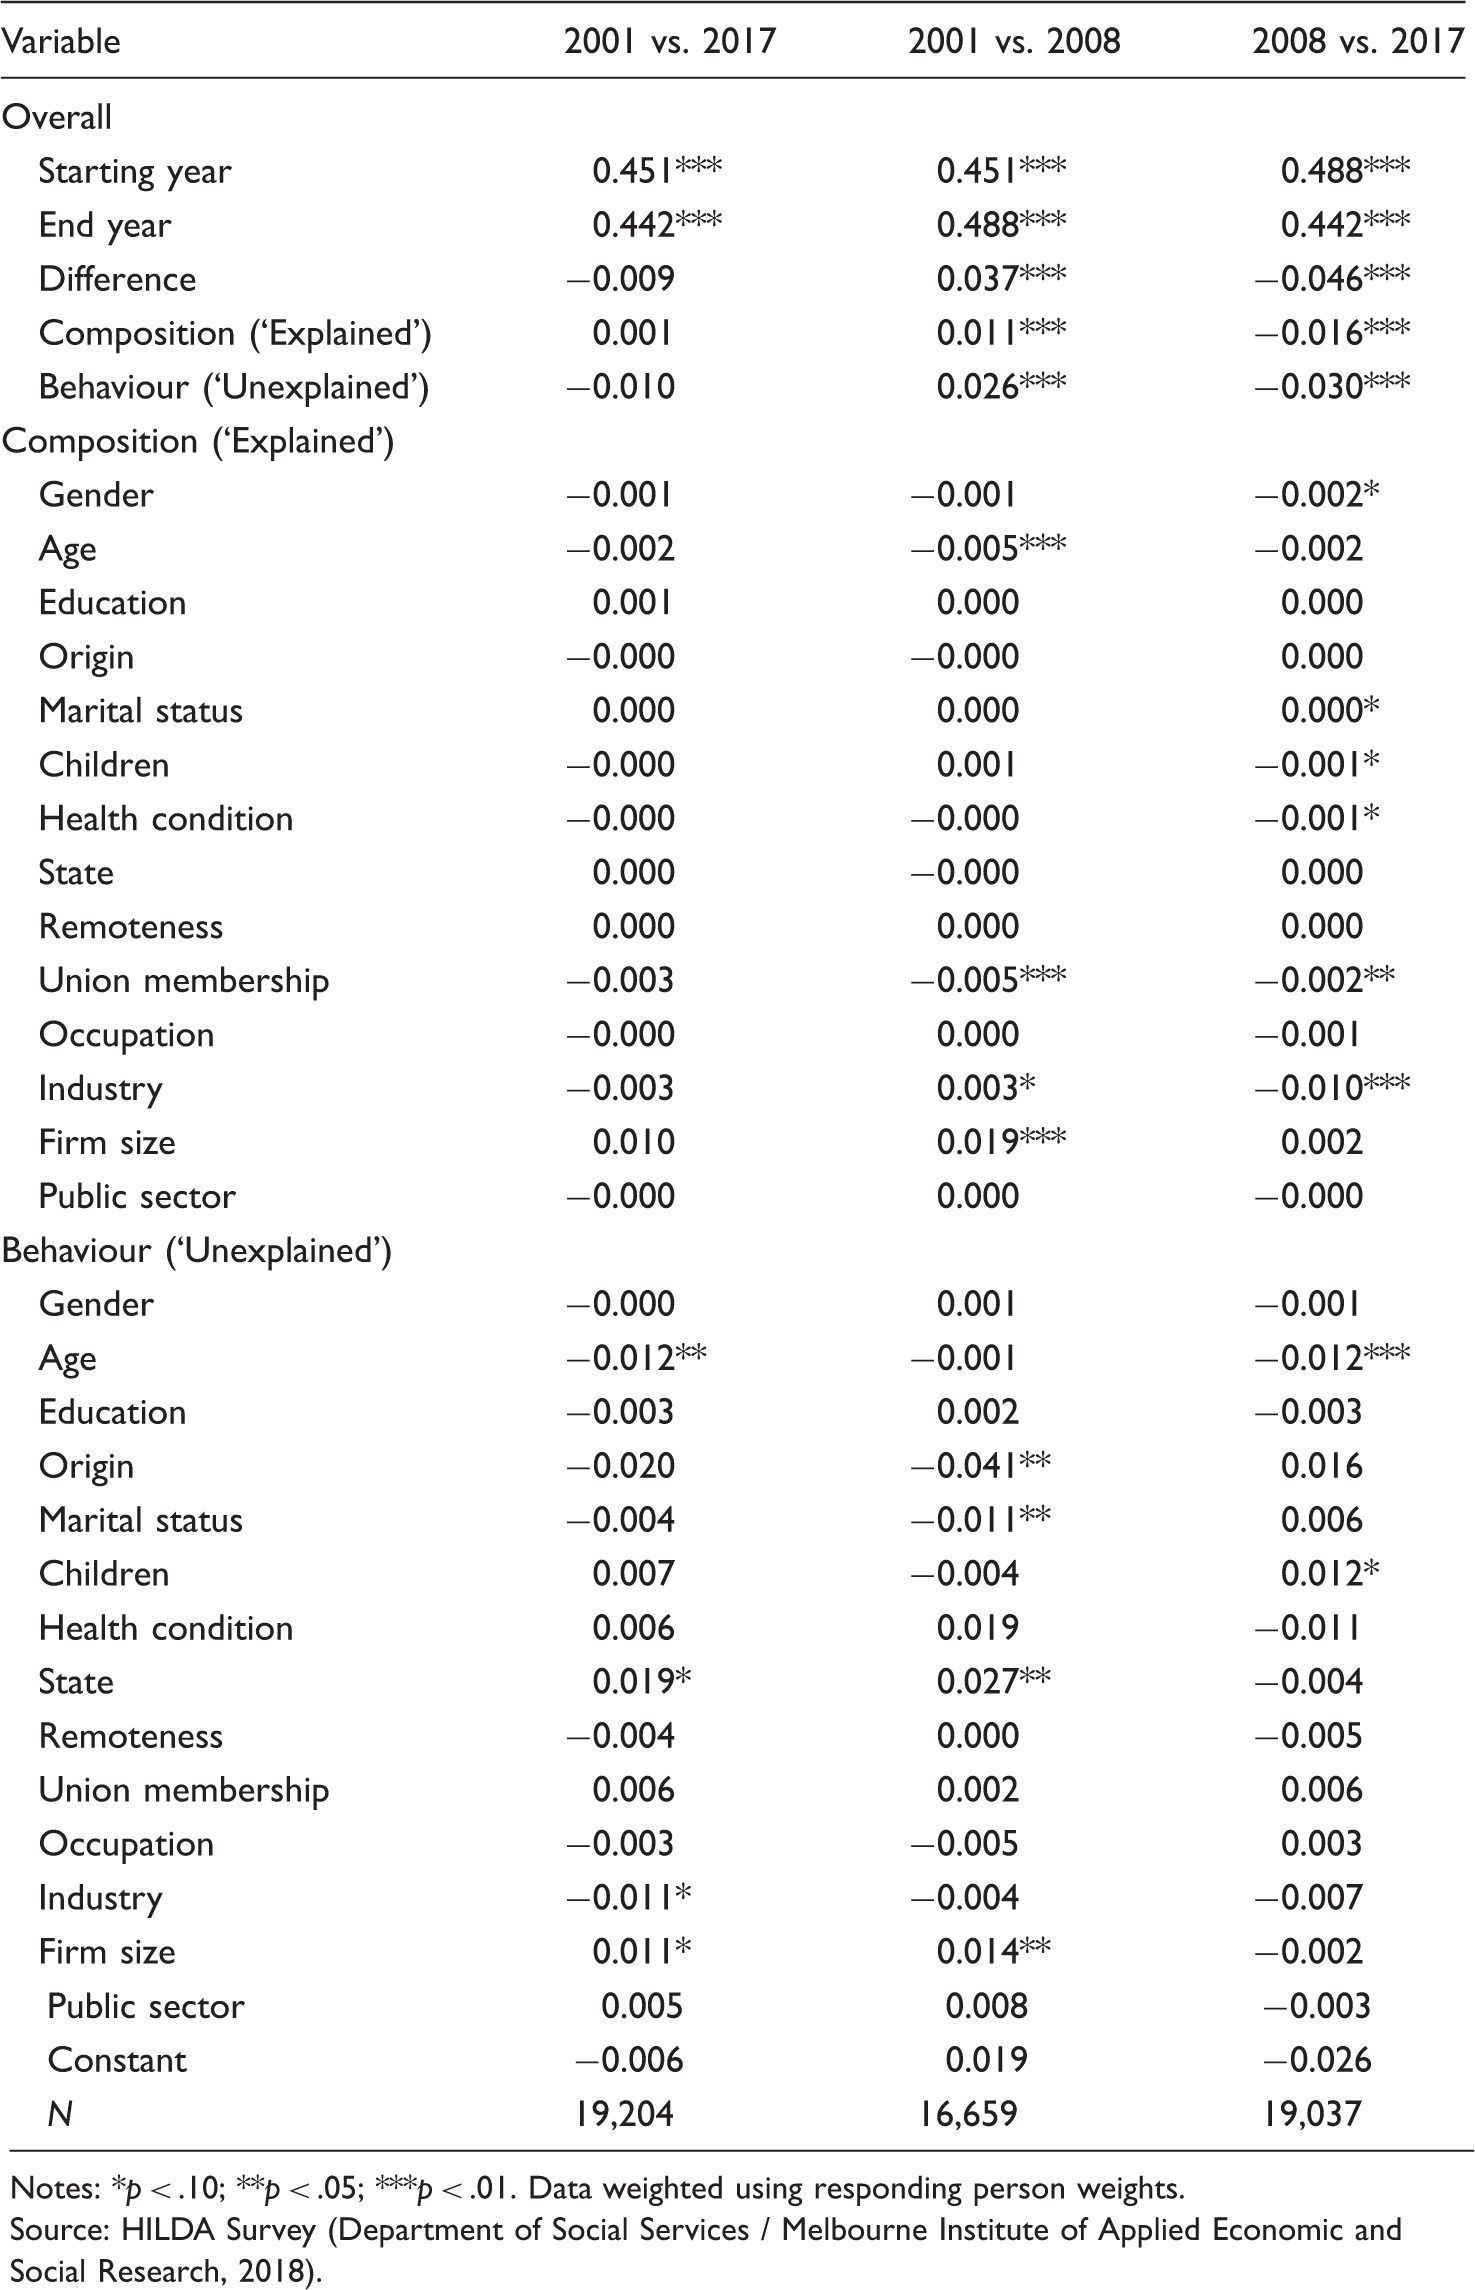
Notes: *p < .10; **p < .05; ***p < .01. Data weighted using responding person weights.
The top panel of the leftmost model, covering the entire 2001–2017 period, shows that the share of standard employment in 2017 is, as previously noted, slightly smaller than the share in 2001: it was 45.1% in 2001 but only 44.2% in 2017 (a gap of just 0.9 percentage points). More importantly, the net effects of both compositional change (the ‘explained’ part) and behavioural change (the ‘unexplained’ part) are statistically insignificant, and hence we do not comment on the detailed results of this model (presented in the two bottom panels).
We see greater dynamics, however, when we split the period and compare 2001 with 2008 (centre model) and 2008 with 2017 (rightmost model). In both sub-periods, the trend in standard employment was driven by both compositional and behavioural changes, but with behavioural changes being more important. For example, in the first sub-period, 1.1 percentage points of the 3.7 percentage points increase in the standard employment share can be explained by compositional changes, while 2.6 percentage points remain unexplained, suggesting behavioural changes are more important. When we look at the second panel of the table, we see that changes in the firm size and industry mix contributed to the increase in the standard employment share in the first sub-period. Specifically, had the firm size mix and the industry mix remained at their 2001 levels, the share of standard workers in 2008 would have been 1.9 and 0.3 percentage points lower, respectively. Declining union membership rates, however, have partly offset these trends, reducing the standard employment share by half a percentage point.
In the second sub-period, 1.6 percentage of the 4.6 percentage point decrease in standard employment can be explained by compositional changes and most importantly by the increasing share of female workers, declining union membership, and further changes in the industry mix. Driving forces behind the industry effect were the relative decline in employment in manufacturing, which has above-average rates of standard employment, and the relative increase in employment in education and training and in health care and social assistance, both with below-average rates of standard employment. The largest fraction (3 percentage points) of the decrease in the standard employment share, however, cannot be explained by structural changes, which is again suggestive of behavioural changes on behalf of the workers and/or employers. Among these, changes in the age-specific likelihood of working in standard employment are particularly important, with workers between the ages of 20 and 39 becoming less likely to work in standard employment over this sub-period.
Impact of changing workforce composition on trends in permanent part-time and fixed-term contract employment, 2001–2017 (Oaxaca-Blinder decomposition).
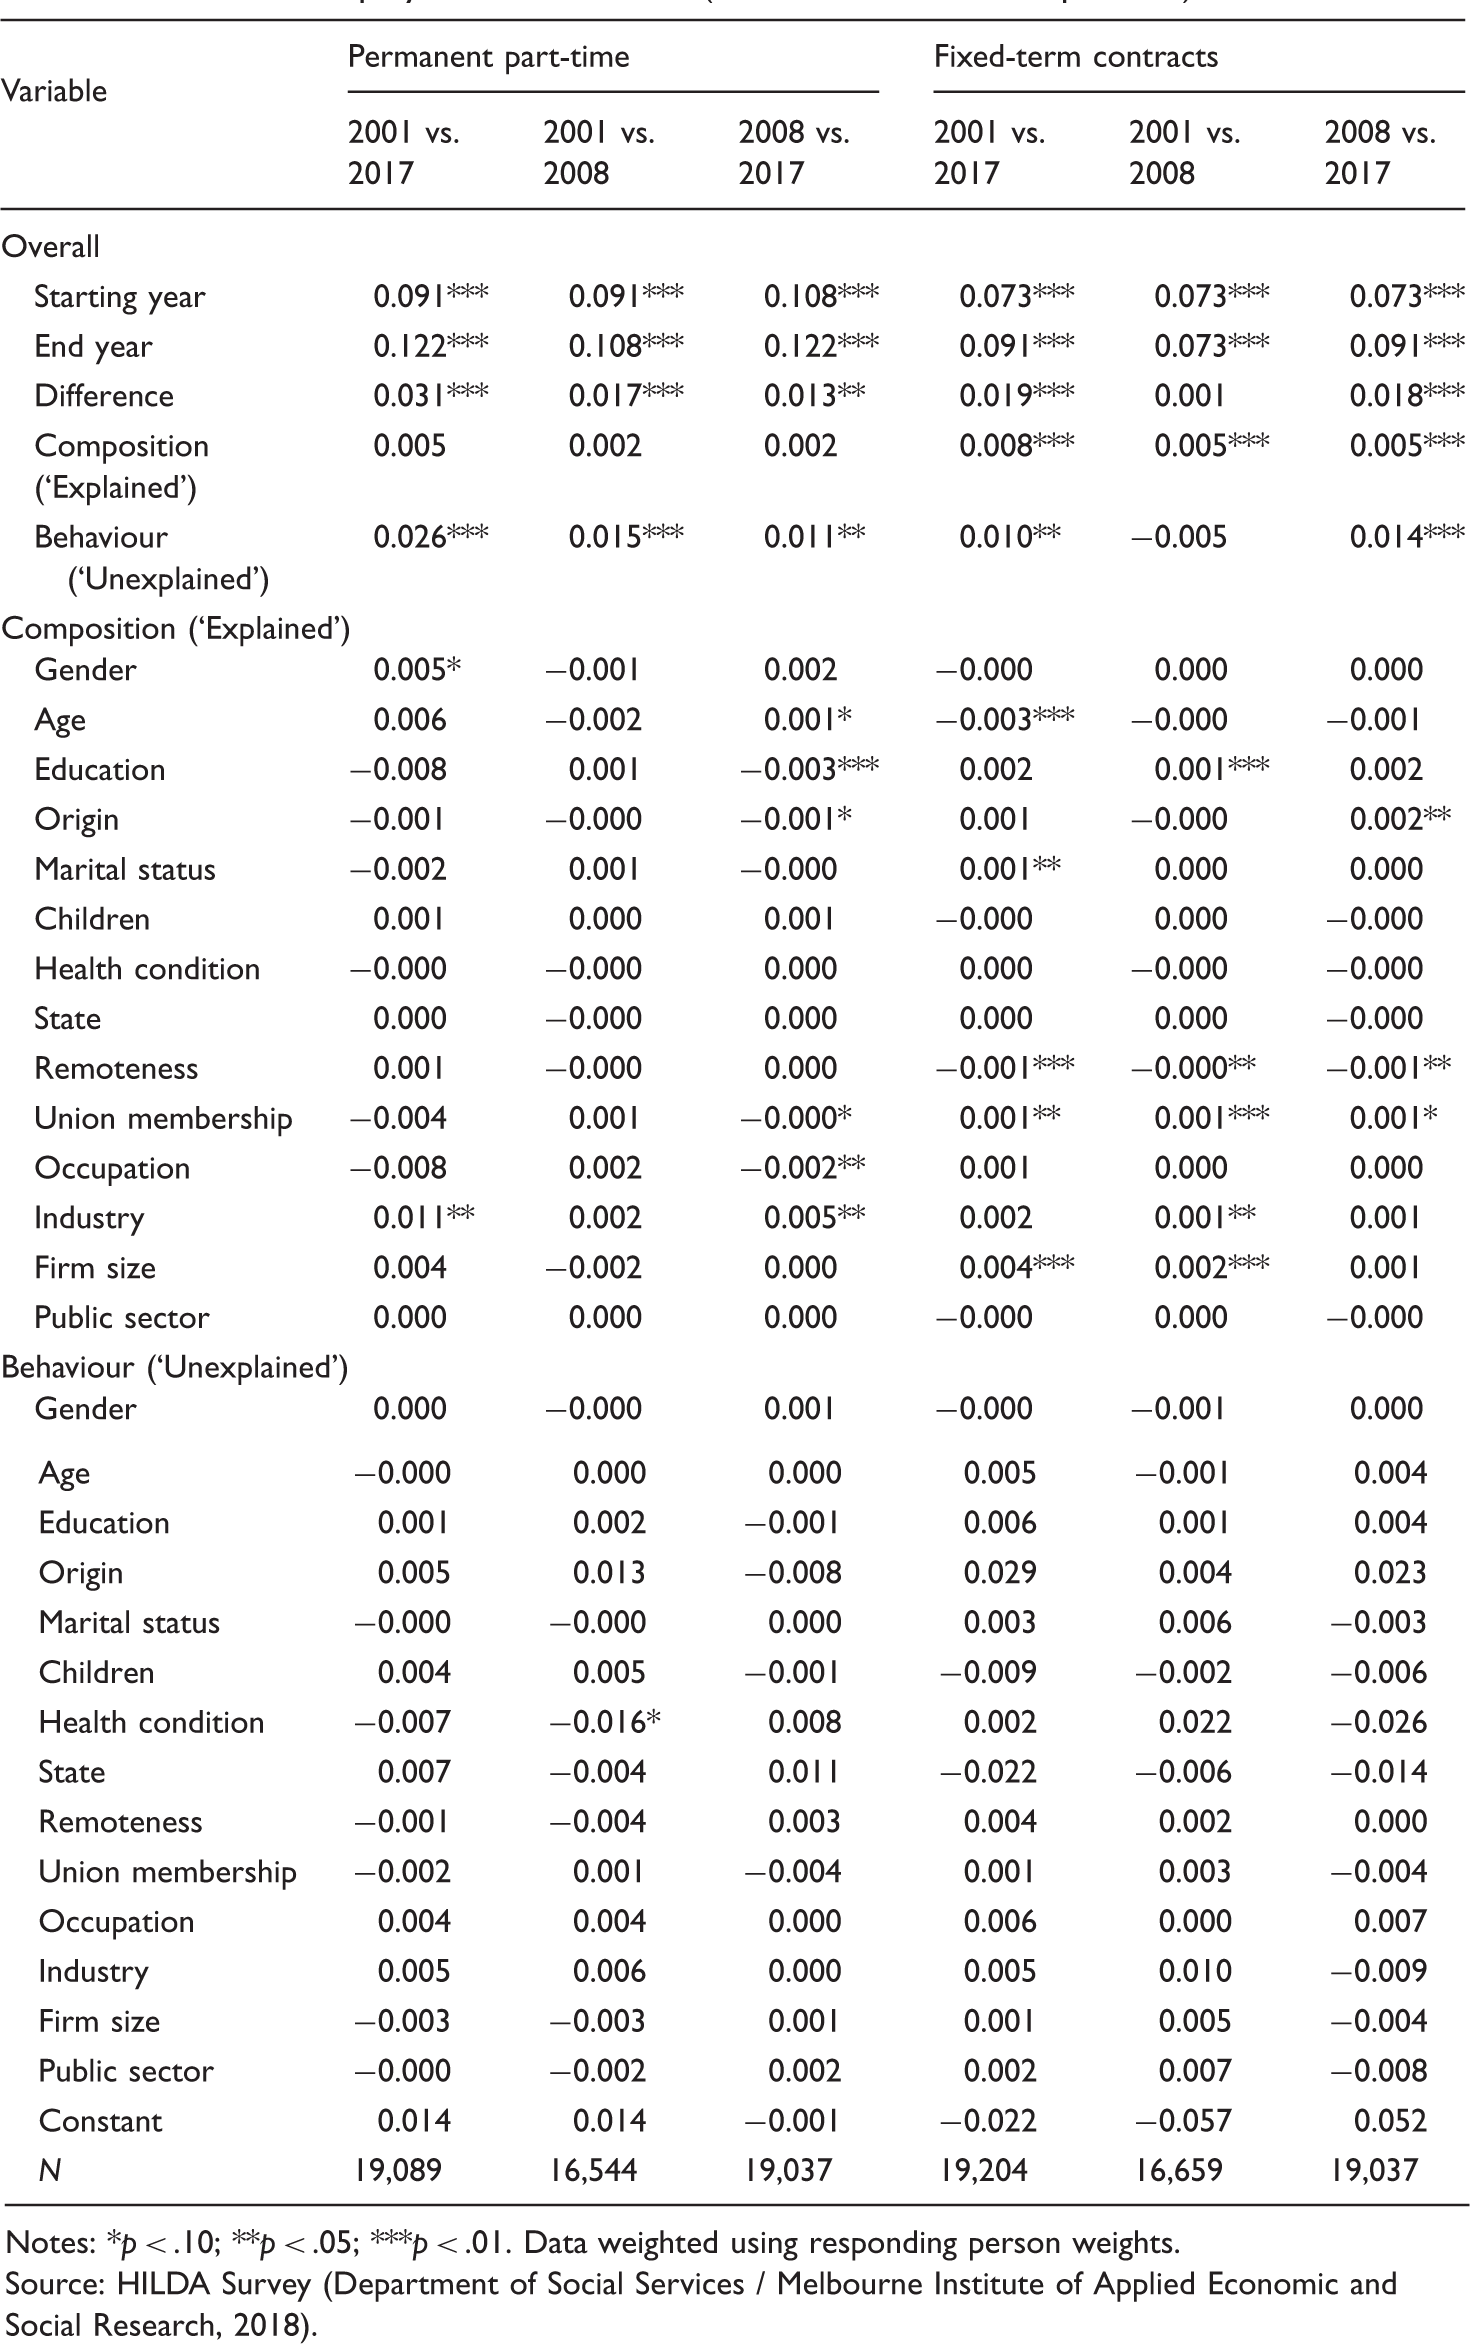
Notes: *p < .10; **p < .05; ***p < .01. Data weighted using responding person weights.
Impact of changing workforce composition on trends in casual and self-employment, 2001–2017 (Oaxaca-Blinder decomposition).
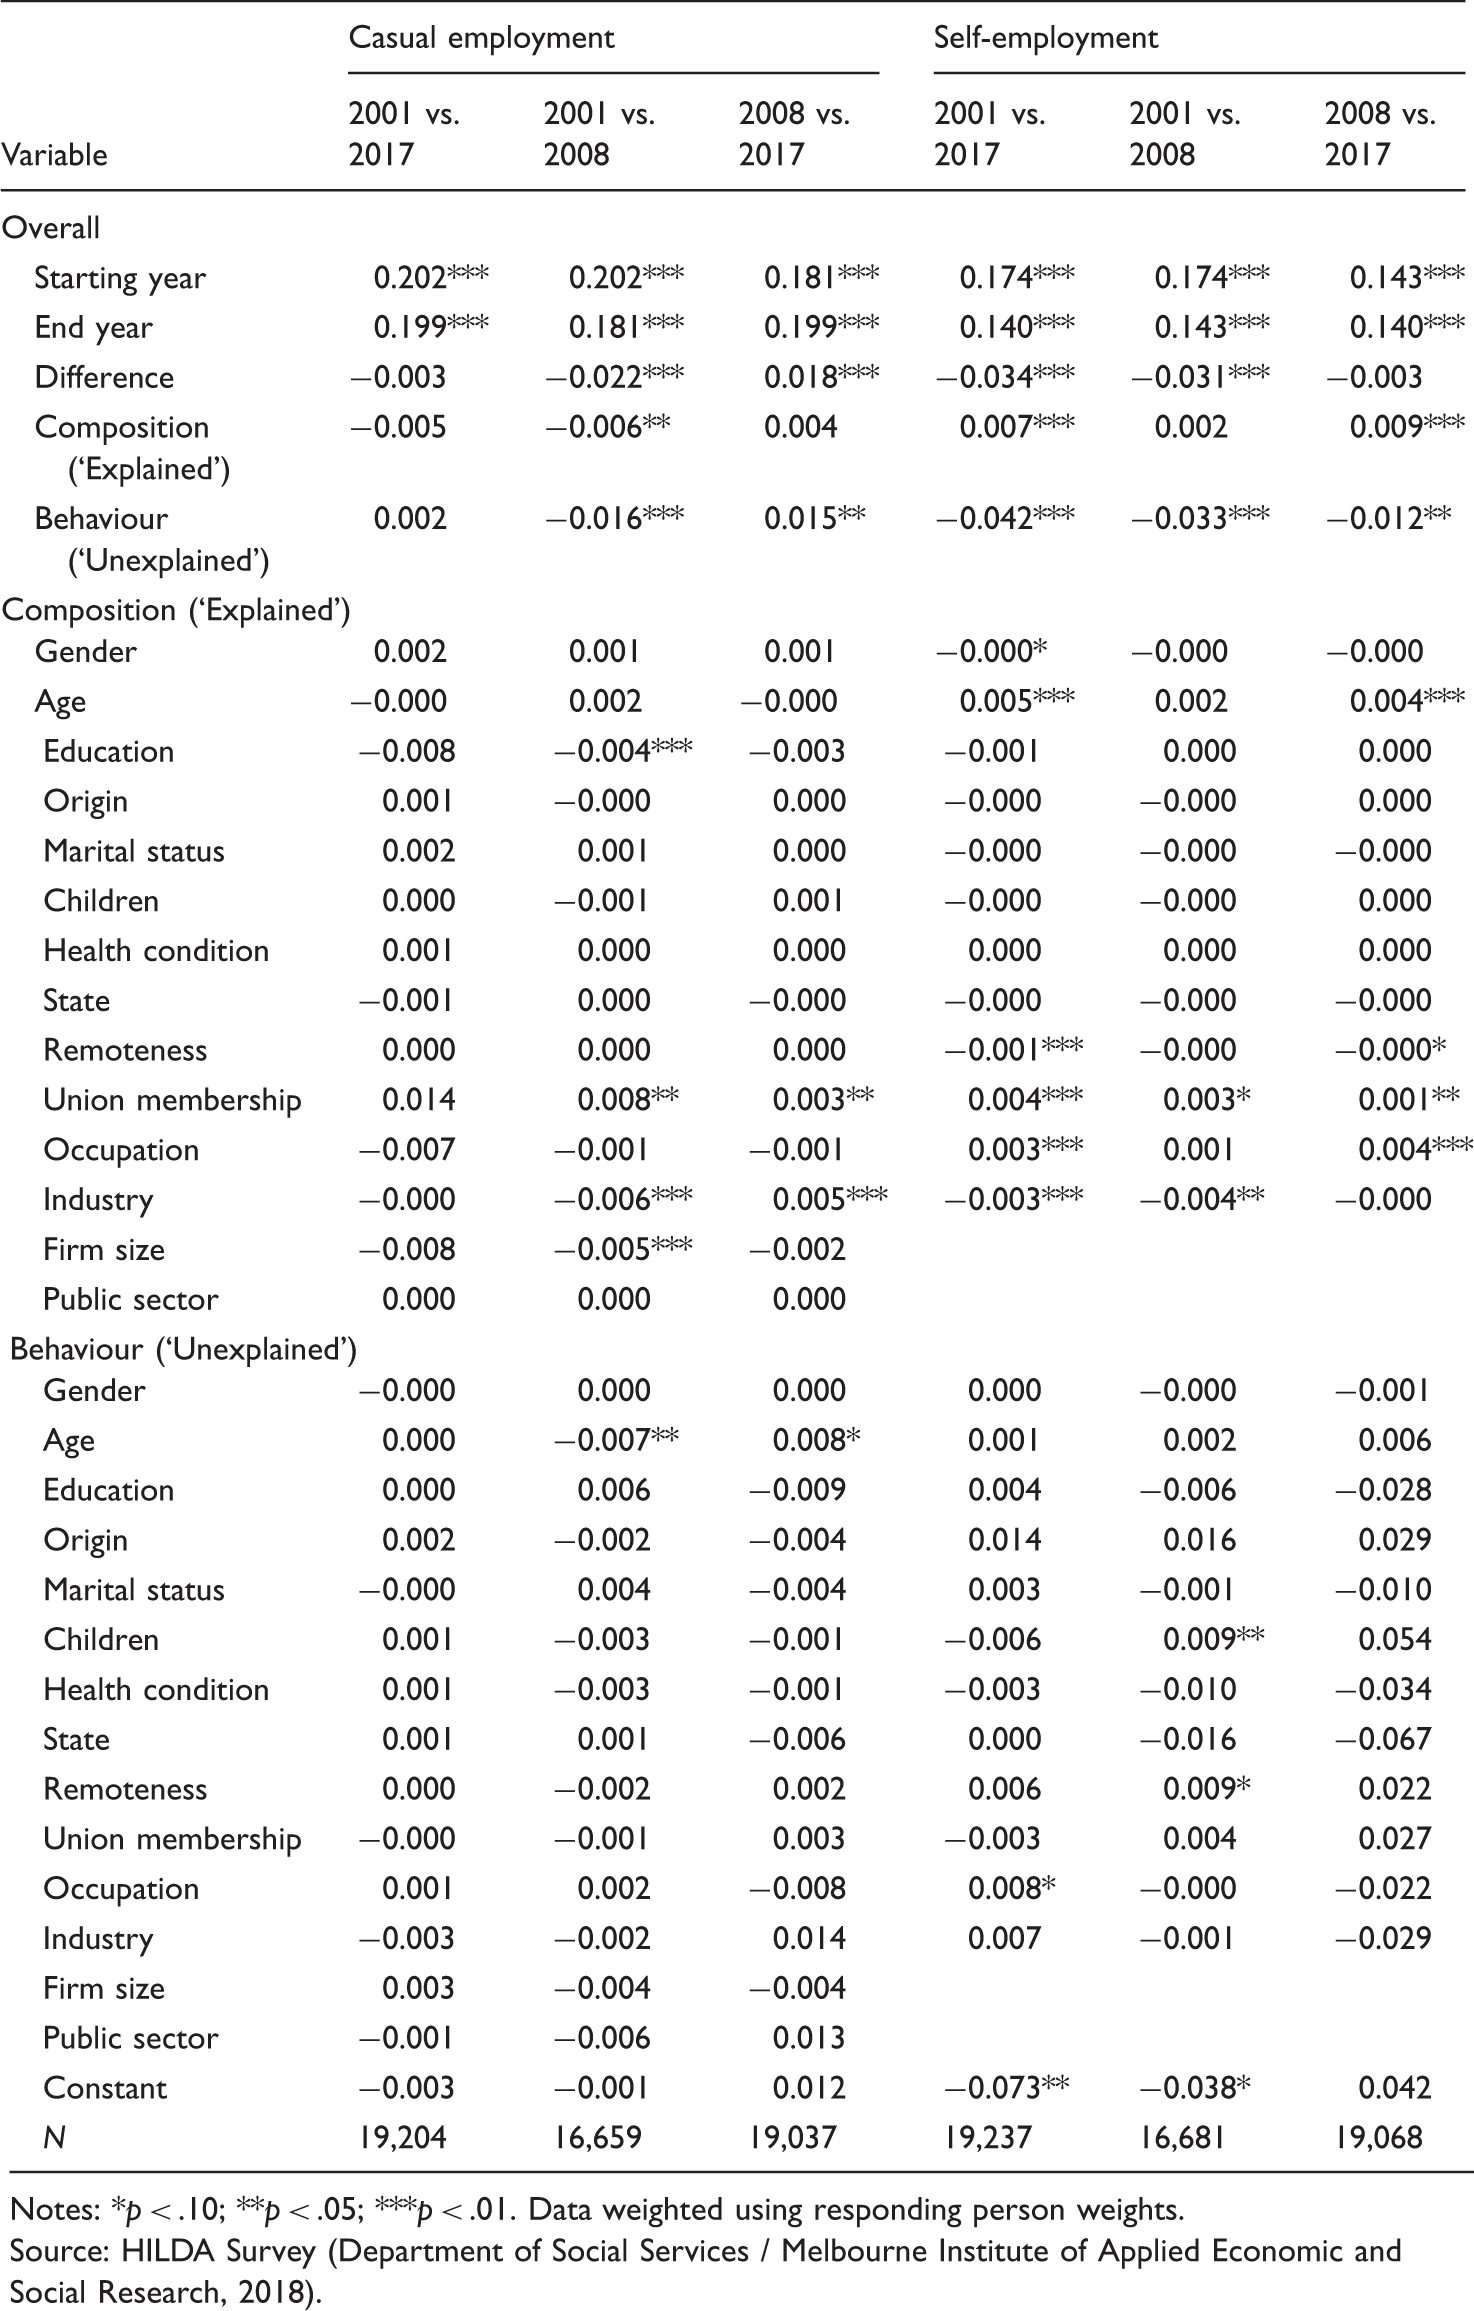
Notes: *p < .10; **p < .05; ***p < .01. Data weighted using responding person weights.
In contrast, a sizeable fraction of the 1.9 percentage point increase in fixed-term employment (also reported in Table 4) can be explained by compositional changes. That said, none of the characteristics included in our model are especially dominant. Changes in the firm size mix are the biggest factor, accounting for 0.4 percentage points of the increase in the fixed-term contract employment share.
As Table 5 highlights, the share of workers in casual employment is almost the same in 2001 and 2017. Furthermore, when we look across this entire period, neither compositional changes in the workforce nor behavioural change appear to have been operating in a way that would cause the casual employment share to change. There are, however, some notable developments when we separately investigate the two sub-periods, which have seen opposing trends in the share of casual employment. Compositional changes explain part of the decrease in the casual employment share during the first sub-period, and part of the increase in the second. Changes in the industry mix, and specifically the relative decrease in jobs in accommodation and food services and the relative increase in jobs in public administration and safety, account for a 0.6 percentage point decrease in casual employment over the 2001 to 2008 period. Interestingly, this trend is almost entirely reversed in the later period, where changes in the industry mix (notably a relative decline in public administration and safety and a relative increase in education and training jobs) account for a 0.5 percentage point increase in casual employment. In both sub-periods, however, behavioural change is relatively more important. Among the factors considered, age plays a crucial role. Between 2001 and 2008, changes in the age-specific likelihood to work in casual employment account for 0.7 percentage points of the decline in the casual share, with workers below the age of 45 becoming less likely to take up casual employment over this sub-period. We see the reverse pattern, however, for the second sub-period: Changes in the age-specific uptake of casual employment contributed 0.8 percentage points to the increase in casual employment between 2008 and 2017, and again this trend was driven by workers below age 45. These results are broadly in line with descriptive ABS data showing that the share of young employees without paid leave entitlements decreased between 2003 and 2008 but increased considerably in the following five years (Rayner, 2016). One notable difference, however, is that the decomposition analysis suggests that the contribution to growth in recent years is not restricted to the youngest workers (i.e., those under 25 years). Once other factors are controlled for, we find notable contributions to growth in the casual employment share from those in the 30 to 44-year age range too. In both sub-periods, however, the trends for the young and middle-aged workers were partly offset by opposing changes among older workers (aged 65 and over), who became much more likely to be employed casually over the first sub-period, but far less likely during the second sub-period.
Finally, as shown in Table 5, the marked decrease in the self-employment share of 3.4 percentage points over the entire period has been mainly due to behavioural changes. Indeed, compositional changes, and especially workforce aging, have acted to increase the prevalence of this employment type by 0.7 percentage points, whereas behavioural changes account for a 4.2 percentage point drop. Potentially important contributory factors are the decline in the self-employment rate among parents and among non-unionised workers.
The main lesson to be learned from the decomposition analysis is that for the most part, the changes in the prevalence of employment types are not merely due to changes in workforce composition, and instead are primarily the consequence of behavioural changes among workers and/or firms.
Conclusions
This article has provided an overview of recent trends in non-standard employment in Australia. The country stands out in international comparisons both because of its relatively large non-standard employment share and because of the high prevalence of casual employment within this group. Yet, in contrast to many other countries, the overall share of non-standard employment in total employment has not increased much since the turn of the millennium: In both 2001 and 2017, around 55% of workers were in some form of non-standard employment. While no longer rising, this share is very high, raising the question of whether the term ‘non-standard’ is still an appropriate epithet for these forms of employment. We believe it is, largely because permanent full-time waged employment continues to underpin the norm of the ‘ideal worker’. Further, we emphasise that while non-standard jobs as a group outnumber standards jobs, the permanent full-time employee remains the single most prevalent employment arrangement.
While overall levels of non-standard employment have not changed much between 2001 and 2017, the intervening period was marked by significant changes, with the share of non-standard workers declining until 2008, and increasing again since then. Further, within the broad group of non-standard employment, the prevalence of individual employment types has developed in different directions. While casual employment has followed the overall trend of an initial decline followed by a recent increase, the shares of permanent part-time work and fixed-term contracts in total employment have increased throughout most of the period, and the reverse is true of self-employment. This finding of diversity in trends reinforces the importance of not simply lumping all workers into two broad categories based on a simple ‘standard’ versus ‘non-standard’ distinction. Within the latter group, there are clear differences depending on whether the worker is self-employed, employed on a casual or fixed-term contract, or working part-time.
The decomposition analysis has shown that the trends in the prevalence of different employment types can only to a limited degree be explained by changes in worker and job characteristics, leading to the conclusion that these changes are primarily due to changed job selection behaviour of workers and/or hiring practices of employers. Economic conditions may have played a role here, with the slowdown of the economy after the GFC potentially motivating employers to employ workers on contracts that provide them with more flexibility. Very differently, casual work may have become more attractive to workers given the casual loading for workers on the national minimum wage and on award rates was incrementally increased to 25% between 2010 and 2014. Similarly, the increased uptake of permanent part-time work may, to some degree, be due to legislative changes in the context of the Fair Work Act 2009 providing workers the right to request part-time hours. The persistent decline in the self-employment rate is also intriguing, especially given widespread concerns about increasing reliance on independent contractors and freelancers. Seeking explanations for this decline lies outside the scope of this article, but our analysis suggests that explanations centred around changes in workforce characteristics should be rejected. More likely explanations lie in structural changes that have favoured large businesses relative to small operators.
Ultimately, seeking definitive answers to what is driving change in the standard versus non-standard employment mix would require different approaches utilising different data. In particular, what is needed are data that link employees to the organisations employing them. The 1995 Australian Workplace Industrial Relations Survey and the 2014 Australian Workplace Relations Study are examples here, but unfortunately both were essentially one-off studies. It is also not obvious that a survey, and especially not one based on a sample of firms, is a fruitful approach given the difficulties persuading businesses to participate in such studies. More promising are the data integration projects currently underway in government that bring together data from different administrative sources. The Linked Employer-Employee Dataset project being undertaken within the ABS, which combines tax data with its Business Register data, is the most obvious example here. However, this data source still lacks the necessary detail about jobs – and notably any measure of employment contract type – that would be required to further advance our understanding of the changes in the mix of employment types.
Footnotes
Acknowledgements
This article uses unit record data from the Household, Income and Labour Dynamics in Australia (HILDA) Survey. The HILDA Survey was initiated and is funded by the Australian Government Department of Social Services (DSS) and is managed by the Melbourne Institute of Applied Economic and Social Research (Melbourne Institute). The findings and views reported in this article, however, are those of the authors and should not be attributed to the Australian Government, DSS or the Melbourne Institute.
Declaration of conflicting interests
The author(s) declared no potential conflicts of interest with respect to the research, authorship, and/or publication of this article.
Funding
The author(s) disclosed receipt of the following financial support for the research, authorship, and/or publication of this article: This research was supported under the Australian Research Council’s Discovery Projects funding scheme (project # DP160103171).