



Abstract
This study aimed to explore the spatial numerical association of response codes (SNARC), the flanker, and the numerical distance effects in children with mathematical difficulties. From a sample of 720 third, fourth, and fifth graders, 60 children were selected and divided into the following three groups: typically developing children (TD; n = 29), children with mathematical difficulties only (MD only; n = 21), and children with mathematical and reading difficulties (MD+RD; n = 10). Children were tested with a numerical Eriksen task that was built to assess SNARC, numerical distance, and flanker (first and second order congruency) effects. Children with MD only showed stronger SNARC and second order congruency effects than did TD children, whereas the numerical distance effects were similar across the three groups. Finally, the first order congruency effect was associated with reading difficulties. These results showed that children with mathematical difficulties with or without reading difficulties were globally more impaired when spatial incompatibilities were presented.
Decades of studies of adults have shown that the representation of number magnitude, namely a nonverbal and analogical representation of quantities expressed by numbers, is automatically activated and connected to a spatially represented number line (e.g., Brannon, 2006; Dehaene, 1997; Dehaene, Bossini, & Giraux, 1993). Indicators of the automatic activation of a magnitude representation are the variations in reaction times that are observed in behavioral tasks that require the evaluation of magnitudes and also in tasks in which the semantic meaning of the number is irrelevant. Specifically, the following recurring effects have been observed: the spatial numerical association of response codes (SNARC) effect (Dehaene et al., 1993), the numerical distance effect (Moyer & Landauer, 1967), the markedness association of response codes (MARC) effect (Nuerk, Iversen, & Willmes, 2004), and the flanker effect (Eriksen & Eriksen, 1974). Temple (1992) described mathematical disability, or dyscalculia, as a “disorder of numerical and arithmetical abilities which is manifest in children of adequate intelligence who do not have acquired neurological injuries.” The awareness and processing of numerical magnitude constitutes a foundation on which mathematical competences, such as calculation processing, are built; this theory was put forth by Butterworth (1999, 2005), along with the definition of the defective number module hypothesis. This hypothesis assumes that dyscalculia depends on a dysfunction of innate basic numerical cognition. There is evidence for an association between basic numerical magnitude processing and mathematical abilities; children with dyscalculia have been shown to perform differently than typically developing children on tasks of basic numerical magnitude processing (Andersson & Östergren, 2012; Cowan & Powell, 2014; Hanich, Jordan, Kaplan, & Dick, 2001; Landerl, Bevan, & Butterworth, 2004; Landerl, Fussenegger, Moll, & Willburger, 2009).
Mathematics difficulty and disability often co-occur with reading disability (Badian, 1999; Barbaresi, Katusic, Colligan, Weaver, & Jacobsen, 2005). The origins and nature of this comorbidity are a topic of debate, aimed in particular to understand how distinct the comorbid condition is from the sum of the single disorders. Rourke and colleagues (Rourke, 1993; Rourke & Conway, 1997) analyzed children with dyscalculia with or without reading disabilities and found dissimilar patterns of neuropsychological and arithmetical performances; these authors specifically observed milder arithmetic difficulties in children with both difficulties. The authors suggested that this finding was due to different hemispheric dysfunctions that were linked to the left hemisphere for children with comorbidity and to the right hemisphere for children with dyscalculia only. A different perspective comes from a recent study by Cirino and colleagues (Cirino, Fuchs, Elias, Powell, & Schumacher, 2013), who examined a large sample of second graders, selecting children with mathematical difficulties (MD), reading difficulties (RD), both difficulties (MD+RD), and adequate reading and mathematical abilities. Results showed differential cognitive and mathematical profiles patterns for MD versus RD: Students with RD (and MD+RD) experienced more difficulty with phonology, whereas students with MD (and MD+RD) were impaired in their processing speed, nonverbal reasoning, and mathematical tasks, such as numeration (count or order sequences, use place value, identify fractions, decimals, and percentages) and number sets (manipulation of small numerosities while transcoding between quantities and Arabic numerals). Therefore, most difficulties associated with either MD or RD were present in the comorbid group, often with a greater degree of difficulty compared to the single-deficit subgroups. Comorbidity was conclusively interpreted by Cirino et al. (2013) as a function of MD and RD severity, rather than as a third profile caused from a distinct set of causes. Some other studies compared groups of children with MD and MD+RD on tasks of both mathematical cognition and mathematical performance. In line with Cirino et al.’s (2013) conclusions, some studies (e.g., Chan & Ho, 2010) have found that students with MD perform better than those with MD+RD on tasks of magnitude comparison, sequencing, and number estimation. Furthermore, in their meta-analysis Swanson, Jerman, and Zheng (2009) found that the only significant cognitive moderator between children with mathematical disability and with mathematical and reading disabilities was long-term memory. Other studies (Cirino, Fletcher, Ewing-Cobbs, Barnes, & Fuchs, 2007; Hanich et al., 2001; Landerl et al., 2004; Landerl et al., 2009; Rousselle & Noël, 2007) have not found differences in nonsymbolic (representation of approximate numbers in arrays of objects and sequences of events; e.g., comparing collections of dots) and symbolic (use of Arabic and spoken verbal numbers; e.g., comparing Arabic digits) number knowledge. Some authors hence argued that children with mathematical and reading disability in comorbidity present similar but sometimes more severe deficits or a summation of symptoms of mathematical disability and reading disability that are characterized by, for example, visuospatial difficulties and reduced automatic orientation of attention in reading skills (Marzocchi, Ornaghi, & Barboglio, 2009) or numerical magnitudes deficits and difficulties in mathematical activities mediated by language, such as story problems (Hanich et al., 2001). Based on these studies, we expect to find differences in numerical processing effects, such as SNARC or numerical distance effects, by comparing children with MD only and MD+RD with typically developing children (TD).
The SNARC Effect
The SNARC effect was first described by Dehaene et al. in 1993. The task used by the authors was a parity judgment in which the subjects used two different response keys, one for the right hand and one for the left, to indicate if the number presented on a computer screen was odd or even. The association between buttons and responses was changed at the midpoint of the test; for example, children had to answer with the right-hand key for odd responses and with the left-hand key for the even responses for a first block of items, whereas for the second block the assignment of responses to keys was reversed. Accuracy and reaction times were recorded. The authors noted that the answers were given faster when subjects responded with the right hand to large numbers or with the left hand to small numbers, independently from being odd or even.
The explanation given by Dehaene and colleagues (1993) is that the magnitude of a number is mentally represented on a line that is oriented from left to right, and this representation is automatically activated when performing a numerical judgment task. The effect seems to be linked to a specific association between number magnitude and space and not to the responding hand. It has been reported that even when subjects respond with their hands crossed, pressing the right button with the left hand and the left button with the right, large numbers are classified faster when pressing the right button and small numbers are classified faster when pressing the left button (Dehaene et al., 1993). Dehaene et al. (1993) have also hypothesized that the SNARC effect depends on reading habits; Iranian subjects, who read from right to left, tend to exhibit an inverse SNARC effect, and this finding has been confirmed by Shaki and colleagues (Shaki & Fischer, 2008; Shaki, Fischer, & Petrusic, 2009).
In recent years, research on the SNARC effect has multiplied and permitted better definitions of its features. Nuerk, Wood, and Willmes (2005) demonstrated not only that the effect emerges with visually presented Arabic numbers, as hypothesized by Dehaene et al. (1993), but also that the effect is universal and amodal; for example, it does not depend on the format of the numbers (e.g., Arabic, verbal, or dot configuration formats) and does not differ whether the input is visual or auditory (also see Shaki, Petrusic, & Leth-Steensen, 2012).
Lammertyn, Fias, and Lauwereyns (2002) showed that the SNARC effect is present in tasks that activate the brain areas involved in the semantic analysis of numbers (i.e., the inferior-parietal region); these areas have also been identified as the areas that are involved in the detection of spatial features of stimuli. For this reason, the effect appears in tests in which subjects must evaluate the orientation of the numerical stimulus but not in other tasks that are based on shape or color elaboration.
The spatial association effect is also present for negative numbers as answers are provided faster when the subjects have to respond to negative numbers with the left hand and to positive numbers with the right hand (Fischer, 2003; Fischer & Rottmann, 2005). The spatial association effect is also present for two digit numbers (Brysbaert, 1995; Tan & Dixon, 2011). In summary, the SNARC effect demonstrates the presence of an amodal association between the numerical input and a representation of the magnitude of the number along a mental line.
Currently, few studies have investigated the SNARC effect in children, particularly children with dyscalculia or MD. In one study, Berch and colleagues (Berch, Foley, Hill, & Ryan, 1999) presented a bimanual parity judgment task that had already been used by Dehaene et al. (1993) to children in Grades 2 through 7 and demonstrated that the SNARC effect emerges in the third grade. According to these authors, however, this fact does not necessarily imply that there is no activation of information about number size or representation of this information on a left-to-right oriented mental line before 8 years of age. The absence of the SNARC effect could be due to the slow reaction times of younger children and to the great variability between different subjects and different tasks. It has also been shown that the SNARC effect is stronger in third and fourth graders compared to older children. According to the authors, the effect was weakened in sixth and seventh graders due to the emergence of the MARC effect. The MARC effect refers to the tendency to provide faster answers with the right hand in response to even numbers and with the left hand in response to odd numbers in a parity judgment task. This effect was discovered by Iversen and Willmes (1996) in a study of adults, and the effect was detected only for verbally presented numbers and not for Arabic numbers. According to Berch et al. (1999), in sixth and seventh graders, linguistic influences override the spatial numerical associations of right/large and left/small; thus, the numbers are not classified as “large” or “small” but as “even” or “odd.” However, there are some inconsistencies between Iversen and Willmes (1996) and Berch et al. (1999) results on the emergence of the MARC effect. Berch et al. (1999) themselves pointed out the need for “further examination of the ways in which supplementary layers of semantic/linguistic representations of numerical information come to play a role in the mental representation of magnitude and parity” (p. 305).
Another study (Van Galen & Reitsma, 2008) analyzed the development of the SNARC effect in 7- to 9-year-old children and adults and compared their performance in two tasks: a magnitude comparison task in which the magnitude information was relevant and a detection task in which the magnitude information was irrelevant. In the first task, the children had to judge whether the Arabic digit presented on the screen was numerically larger or smaller than 5, by pressing the left or right keys. In the first experimental block, participants pressed the left key for digits smaller than 5 and the right key for digits larger than 5. In the second experimental block, the key assignments were switched. In the detection task, the children see a number and had to press the space bar as soon as they noticed the target, which was a grey box presented on the left or on the right of the fixation point. When number magnitude was relevant, the SNARC effect was significant from 7 years of age onward, but when number magnitude was irrelevant, the SNARC effect appeared only from age 9 years onward. The authors hypothesized that young children represent number magnitudes in the same way as adults but that automatic access to magnitude information is acquired by approximately 9 years of age.
Schweiter and colleagues (Schweiter, Weinhold Zulauf, & von Aster, 2005) analyzed the SNARC effect and its correlations with number processing and calculation skills in a sample of TD second graders. About one-third of the sample showed the SNARC effect, but marginal positive correlations between this effect and mathematical test performance were only demonstrated in males (r = .23). In females, a marginal negative correlation was observed (r = −.12). The authors hypothesized that gender-specific strategies might account for these differences: Females predominantly used verbal strategies, whereas males showed a more pronounced visuospatial thinking style.
Bachot, Gevers, Fias, and Roeyers (2005) conducted another study on two groups of 7- to 12-year-old children: One group was composed of children with visuospatial disabilities who had difficulty with complex calculations, and the other group was composed of typically developing participants (control group). The task was to judge whether the proposed numbers were larger or smaller than 5. This research aimed to verify that the often-highlighted link between visuospatial disabilities and mathematical disabilities is connected to an abnormal spatial representation of numbers. The SNARC effect was obtained in the control group but not in the visuospatial disabilities group; furthermore, the effect seemed to be reversed in children with visuospatial disabilities. These results were the first indications that children with visuospatial disabilities could be insensitive to right–left mapping and to mental representation of numbers, which would lead to the development of difficulties in number processing.
The Numerical Distance Effect
The numerical distance effect (NDE; Moyer & Landauer, 1967) affects comparisons between two numbers and produces faster and more accurate answers in indicating which of two numbers is larger, when the difference between the numbers is large (e.g., 2 vs. 10) compared to numbers that are relatively close (e.g., 2 vs. 4). Therefore, the larger the numerical difference between two numbers, the shorter the time required to decide which of them is larger. This effect most likely depends on the automatic activation of the number line representation; specifically, numerical magnitudes that are close on the number line share more mental representational features, which make it more difficult to distinguish between them (Holloway & Ansari, 2009). This effect also suggests that people convert written or auditory numbers into analog magnitudes, while doing small versus large comparisons. Studies of children have shown a developmental decrease in the distance effect with age both in numerical and non-numerical comparison tasks after controlling for general changes in processing speed (Holloway & Ansari, 2008).
Previous research analyzing the NDE in children with MD and dyscalculia has produced controversial results. One study (Ashkenazi, Mark-Zigdon, & Henik, 2009) analyzed the NDE in children with dyscalculia in the third and fourth grades and compared these children with typically developing children. The results showed similar NDE in the dyscalculic and control groups in single-digit comparison tasks and a larger NDE in two-digit number comparisons. However, children with dyscalculia showed an NDE in error rates in the single-digit comparison task, whereas the controls showed no such error-rate effect. The authors hypothesized that the representations of numbers on the mental number line are less distinguishable in children with dyscalculia than in controls, which causes a stronger NDE associated with mathematical disability. In contrast, Rousselle and Noël (2007) found, in line with the defective number module hypothesis, smaller NDE in children with dyscalculia in single-digit comparisons. This study also compared children with mathematical disability and children with both math and reading disabilities and found no significant differences in the NDE. Another study (Landerl & Kölle, 2009) examined children with dyscalculia and typically developing children from the second through the fourth grade and found comparable NDE in all children. Possible explanations for these controversial results include the following: the studies described used different inclusion criteria (e.g., mathematic test scores below the 15th percentile for Rousselle & Noël, 2007, or below −2 SDs for Landerl & Kölle, 2009) and the administration of different arithmetical tasks.
The Flanker Effects
The classical flanker task (Eriksen & Eriksen, 1974), also commonly known as the Eriksen task, consists of a target stimulus (a letter chosen from two sets of letters) that is displayed at the center of the screen with flanking distractor letters on both sides. Subjects are instructed to press a button according to which of the two sets the target letter was selected from. To respond correctly, the participants have to focus on the central stimulus and ignore the distractors. Eriksen and Eriksen’s (1974) results suggest that task performance is altered by the irrelevant information that originates from the distractors and is also affected by the semantic properties of the target and distractors.
Nuerk, Bauer, Krummenacher, Heller, and Willmes (2005) proposed a modified version of the Eriksen task that uses numbers. The subjects are presented with a target number flanked by three distractor numbers on each side and are asked to indicate whether the target is less than or greater than 5 by pressing the right or left button of a purpose-built keypad. The task has been administered to young adults (Nuerk, Bauer, et al., 2005) and confirmed that the attentional congruency effects originally found for letters are also present for numbers. Using this task, the authors also identified and analyzed the SNARC effect; small numbers are responded to more quickly with the left hand, and large numbers produced a right key advantage. The authors interpreted their results as follows:
This study seems to suggest that the magnitude relations between target and distractor numbers in one display are not only automatically computed on the mental number line, but that these relations are automatically used to support attentional selection and inhibition processes. (Nuerk et al., 2005, p. 48)
Currently, this modified version of the Eriksen paradigm has not been applied to children with or without MD.
Aims of This Study
The present study aims to explore the SNARC, the NDE and the flanker effects in children with MD with and without RD due to the lack of studies on these groups of children in the scientific literature. We chose to use the modified version of the Eriksen task that has previously been used by Nuerk, Bauer, et al. (2005) on adults because it allowed us to analyze multiple effects with a unique task and to reduce the time and the effort required to the young participants.
Effects due to spatial-numerical associations will be examined to get indications regarding theories on MD. The defective number module hypothesis proposes that children with MD have a deficit in basic numerical magnitude processing and do not activate number magnitude automatically. According to this assumption, we expect to find weaker SNARC, flanker, and distance effects in children with MD.
Furthermore, given the views on similar and dissimilar pattern of difficulties in children with MD only or MD+RD, we sought to explore two assumptions. Given Rourke et al.’s hypothesis (Rourke & Conway, 1997), which postulates that MD only and MD+RD difficulties are connected to different hemispheric dysfunctions, we would expect to find similar performances in the MD+RD and control groups and significant differences in the MD only group because of the specific deficit in numerical magnitude processing of this group. In fact, MD+RD difficulties would be related to phonological processing deficits, that could impair aspects of mathematics that rely on the manipulation of verbal codes, such as mental calculation and fact retrieval, but should not affect number comparison (Mammarella et al., 2013; Simmons & Singleton, 2008). In contrast, based on the studies that found similar results in basic numerical cognition in the two clinical groups (e.g., Cirino et al., 2013; Landerl et al., 2004; Landerl et al., 2009; Swanson et al., 2009), we would expect similar performances from the MD only and MD+RD children that should be significantly different from the performances of the control group because the impairment in basic numerical cognition is connected to MD (with or without RD).
In particular, the current research addressed the following questions:
Is the MD condition associated with weaker SNARC, NDE, and flanker effects due to a deficit in basic numerical magnitude processing (i.e., awareness of numerical magnitude) that precludes automatic access to the number line?
Are the characteristics of the children’s performances in the tasks common for all children with MD or specific to the MD only group?
To answer these questions, children with MD and RD were selected using strict criteria. In this way only children with a serious specific impairment in mathematical and reading processes were included in the sample.
Method
Participants
A total of 720 Italian children (51.67 % females) in Grades 3 through 5 from eight primary schools in northern Italy were enrolled and screened using standardized tests that assess reading and arithmetic. Children with (a) a diagnosis of mental retardation (n = 7) or (b) for whom Italian was a second language (n = 7) were excluded from the sample. From the remaining children, three groups were created in the following two steps: First, children who performed below the 5th percentile in the arithmetic task (written arithmetic test from the Wide Range Achievement Test–Revised [WRAT]; Jastak & Wilkinson, 1984) were designated as having MD (n = 31); second, MD children were presented with reading tests to split the general MD group into two subgroups according to the presence of RD, as determined by scores ≤ 2 SDs from the mean in reading speed or accuracy for words or pseudo-words (we used the battery for the evaluation of dyslexia and spelling disorders for this classification; Sartori, Job, & Tressoldi, 1995). The MD+RD group was composed of 10 children, and the mathematical difficulty only (MD only) group was composed of 21 children. Then, children that obtained a score between the 30th and 60th percentile in the written arithmetic test, and that fall below the 70th percentile on a questionnaire for teachers designed to screen for psychopathology (Strengths and Difficulties Questionnaire; Goodman, 1997 ) were selected. Within this third group of children with typical development, individuals with same gender, similar age, and same class of children from the two groups with MD (i.e., the MD only and MD+RD groups) were selected for the TD group (n = 29). Table 1 shows descriptive statistics of the groups and F values according to demographic variables (age), selection of the sample variables (scores on the arithmetic task and the reading tests), and full-scale IQ (FSIQ), which was calculated by combining scores from the Vocabulary and Block Design subtests of the Wechsler Intelligence Scale for Children (WISC-III; Wechsler, 2006).
Demographic and Cognitive Characteristics.

Note. Reading skills are expressed in z scores (negative values mean poor performance). FSIQ = full-scale IQ; MD only = mathematical difficulties group; MD+RD = mathematical and reading difficulties group; PIQ = Performance IQ; TD = typically developing children; VIQ = Verbal IQ.
p < .05. **p < .01. ***p < .001.
A chi-square test indicated that the composition of the groups was not perfectly balanced for gender (χ2 = 5.705, p = .058) because a trend toward significance was found; thus, preliminary analyses were carried out, and no significant differences between males and females on any of the variables considered in this study were found: SNARC, t(1, 58) = 0.143, p = .887, NDE, t(1, 58) = −0.518, p = .606, flanker first order congruency, t(1, 58) = −0.223, p = .824, and second order congruency, t(1, 58) = 0.178, p = .859. There were no age differences among the three groups.
Measures
Cognitive ability
Two subtests of the Italian version of the WISC-III (Wechsler, 2006), namely the Vocabulary and Block Design subtests, were administered to assess general cognitive abilities. These subtests were selected because they are highly correlated with FSIQ (Groth-Marnat, 1997).
Arithmetic ability
The written arithmetic test from the WRAT (Jastak & Wilkinson, 1984) consists of 40 items of increasing difficulty with open answers that involve the solutions to arithmetic operations (addition, subtraction, multiplication, and division). The implementation time was set at 15 min. The cutoff to establish the presence of a MD was the 5th percentile of the performances of the entire initial sample (N = 720 children).
Reading ability
The battery for the evaluation of dyslexia and spelling disorder (Sartori et al., 1995), a test of word and pseudo-word reading, was individually administered to the children with MD and to the controls to assess their reading speed and accuracy. Raw scores were converted into z scores according to the Italian norms (Sartori et al., 1995). The cutoff criterion for RD was established as two standard deviations (in speed or accuracy of reading words or pseudo-words) below the mean of the normative sample.
Eriksen task
The numerical Eriksen task was purpose-built for this research using the E-Prime software (Schneider, Eschman, & Zuccolotto, 2002). This task is based on the version used by Nuerk, Bauer, et al. (2005), which was changed to increase its suitability for studying children.
Stimuli appear at the center of the screen of a laptop computer placed 50 cm from the subject. The children were required to respond by pressing the “c” or “m” letter on a keyboard with the index finger of their left or right hand, respectively; all other keys were covered. The two keys are placed to the right and left of the fixation point, and the distance between keys was 9 cm. Reaction time (RT) and error rates were recorded.
Stimuli consisted of seven one-digit Arabic numbers that were horizontally aligned. The central number was the target and was positioned between six lateral identical numbers (three on the right and three on the left). To allow for rapid identification of the target, two vertical bars 1 cm in height appeared above and below the central stimulus. The numerical values of the central and lateral numbers ranged from 1 to 4 and from 6 to 9, resulting in 64 different combinations. The font of the stimuli was Arial 12 and the stimuli were light green on a black background. The space occupied by the 7 numbers was 4 cm. Participants were instructed to respond as quickly and as accurately as possible. Before beginning the experiment, the children were familiarized with the task via one practice block of 16 trials that were randomly selected from the experimental stimuli. The experimental session consisted of 4 blocks of 64 combinations for a total of 256 stimuli. The experiment had a total length of approximately 30 min.
Each trial began with the simultaneous onset of all seven numbers, which remained on the screen until the subject responded. The intertrial interval was 1,700 ms. Subjects were required to decide whether the central number was larger or smaller than 5 and to indicate their decisions by pressing a button with their left (“c”) or right hand (“m”). The initial association between response keys (right/left) and the correct response (larger/smaller than 5) was counterbalanced across participants; half of the subjects began by responding on the right button when the target was larger than 5, and the other half responded on the right button when the stimulus was smaller than 5. At the midpoint of the test, the association between the correct response (larger/smaller) and the response keys (right/left) was switched.
For the SNARC effect, four conditions were considered:
Number smaller than 5, left button (congruent; e.g., 3 3 3 4 3 3 3)
Number bigger than 5, left button (incongruent; e.g., 3 3 3 6 3 3 3)
Number smaller than 5, right button (incongruent; e.g., 3 3 3 4 3 3 3)
Number bigger than 5, right button (congruent; e.g., 3 3 3 6 3 3 3)
For the NDE, four conditions were considered:
Smaller than 5, small distance (1 or 2 numerical units; e.g., 3 3 3 4 3 3 3)
Larger than 5, small distance (1 or 2 numerical units; e.g., 3 3 3 7 3 3 3)
Smaller than 5, large distance (3 or 4 numerical units; e.g., 3 3 3 1 3 3 3)
Larger than 5, large distance (3 or 4 numerical units; e.g., 3 3 3 8 3 3 3)
For the flanker effect, two subeffects and a total of five conditions were considered:
First order congruency effect:
- Congruent: both the target and the lateral numbers are smaller or bigger than 5 (e.g., 3 3 3 4 3 3 3; 6 6 6 9 6 6 6) - Incongruent: the target number is bigger than 5 and the lateral numbers are smaller, or vice versa (e.g., 3 3 3 6 3 3 3; 7 7 7 2 7 7 7) - Neutral: the same number is in both the central and lateral positions (e.g., 4 4 4 4 4 4 4)
Second order congruency effect (Nuerk, Bauer, et al., 2005):
- Congruent second order: the target number is bigger (or smaller) than both 5 and the lateral numbers (e.g., 6 6 6 8 6 6 6; 4 4 4 3 4 4 4) - Incongruent second order: the target number is bigger than 5 but smaller than the lateral numbers, or vice versa (e.g., 2 2 2 3 2 2 2; 9 9 9 8 9 9 9)
Procedure
The tasks were administered over three sessions. First, the written arithmetic test was completed by all participants in a 20-min whole-class session. Then, the remaining tests were administered to each child individually in a quiet room at his or her school in two 30-min sessions. During the first individual session, the child completed the WISC-III Vocabulary and Block Design subtests and the word and pseudo-word reading tasks. Finally, in the last session, the child performed the Eriksen task. During individual testing sessions, a break was allowed if the child showed signs of getting tired. The tests were administered and scored by trained master students; the scoring procedure was supervised by a PhD student also qualified as a clinical psychologist.
Data Treatment
RTs below 150 ms (0.26 %), RT outliers calculated for each participant (SDs ≥ 3; 1.13 %), and incorrect trials were removed. Individual average reaction times (MRTs) were calculated for each subject within each condition. The percentages of incorrect trials for each condition are reported in Table 2.
Percentages (Standard Deviations) of Errors in Each Condition.

Note. Effect sizes between 0.2 and 0.4 are small, effect sizes between 0.4 and 0.8 are medium, and effect sizes greater than 0.8 are large (Cohen, 1988). MD only = mathematical difficulties group; MD+RD = mathematical and reading difficulties group; ns = nonsignificant; SNARC = spatial numerical association of response codes; TD = typically developing children.
Then, to obtain normal distributions for each subject, MRTs for all conditions of the task were log transformed. Because FSIQs were significantly different between groups, FSIQ was entered as a covariate in the following analysis to reduce possible bias due to differences between groups.
To investigate the presence of the SNARC effect, a 2 × 2 × 3 ANCOVA (laterality × size × group with FSIQ as a covariate) was conducted on the MRTs. Laterality (left vs. right response button) and size (stimulus digit smaller vs. larger than 5) were within-participant factors, and group (TD, MD only, and MD+TD) was a between-participant factor. Then, to analyze the presence of the SNARC effect in the three groups, repeated measures ANOVAs considering the four conditions as independent variables were performed within each group. SNARC scores were calculated with the following equation:

To analyze the presence of the NDE, a 2 × 2 × 3 ANCOVA (size × distance × group with FSIQ as a covariate) was performed. Size (stimulus digit smaller vs. larger than 5) and distance (distance between stimulus digit and 5 corresponding to 1 or 2 vs. 3 or 4 units) were within-participant factors, and group (TD, MD only and MD+TD) was a between-participant factor. To analyze the presence of the NDE in the three groups, repeated measures ANOVAs within each group considering the four conditions as independent variables were performed. NDE scores were calculated with the following equation:

To analyze the first and second order congruency effects, 3 × 3 (group × first order congruency) and 3 × 2 (group × second order congruency) ANCOVAs were conducted, respectively, with FSIQ as a covariate. Group (TD, MD only, and MD+TD) was a between-participant factor, and first order congruency (congruent vs. neutral vs. incongruent) and second order congruency (congruent vs. incongruent) were within-participant factors. Finally, first and second order congruency scores were calculated with the following equations:

To analyze differences in SNARC, NDE, and first and second order congruency scores among the three groups, one-way independent ANOVAs were performed. Then, because the number of subjects in each group was small, effect sizes were computed using Cohen’s (1988) formula to interpret the differences between groups. Considering Cohen’s (1988) rules of thumb, effect sizes between 0.2 and 0.4 are small, between 0.4 and 0.8 are medium, and greater than 0.8 are large. The comparisons of effect scores between all groups are reported in Table 3.
Effect sizes (Cohen, 1988) of MRT Differences Between Groups for All Effect Scores.

Note. Effect sizes between 0.2 and 0.4 are small, effect sizes between 0.4 and 0.8 are medium, and effect sizes greater than 0.8 are large (Cohen, 1988). MD only = mathematical difficulties group; MD+RD = mathematical and reading difficulties group; MRT = average reaction time; NDE = numerical distance effect; SNARC = spatial numerical association of response codes; TD = typically developing children.
Finally, to analyze whether the SNARC, NDE, and flanker effects were associated with age, cognitive skills, or reading and arithmetic abilities, correlation analyses were carried out between SNARC, NDE, and first and second order congruency scores and the following measures: grade, vocabulary, block design, reading speed and accuracy for words and pseudo-words, and the written arithmetic test.
Considering the small samples, effect size indices were also considered to analyze differences between groups and to answer both study questions.
Results
There was a statistically significant difference between groups on the arithmetic task, as required by the selection criteria; the two groups with MD had lower scores than the TD children. Furthermore, the MD+RD group had significantly lower scores than the other groups on the reading tests, as required by the selection criteria. Finally, the MD only group had lower performance IQ scores (calculated from the block design) than the control group, and the groups with MD+RD and MD only had lower FSIQ scores than the TD children (see Table 2).
To confirm the hypothesis that MD is related to weaker numerical effects, we expect to find a significant group effect in the ANOVAs that analyzed SNARC, NDE, first and second order congruency scores; more specifically, we expected to find a significant difference between TD children and the two clinical groups (MD only and MD+RD) in which the TD children showed stronger effects. Furthermore, in the analyses of single effects, we expected to find a significant laterality × size × group interaction for the SNARC effect, a significant distance × group interaction for the NDE, and significant group × first order congruency and group × second order congruency interactions for the first and second order congruency effects.
To explore the differences in performance between MD only and MD+RD groups, we expected to find significant differences between the MD only and MD+RD groups in post hoc analyses of the ANOVAs performed on SNARC, NDE, and first and second order congruency scores.
The SNARC Effect
The main effects of the 2 × 2 × 3 ANCOVA were not significant: group, F(2, 56) = 1.521, p = .227, η2 = .05; laterality, F(1, 56) = 0.125, p = .725, η2 < .01; and size, F(1, 56) = 0.948, p = .334, η2 = .02. The size × laterality interaction was not significant, F(1, 56) = 0.006, p = .936, η2 < .01. The group × size × laterality interaction was significant, F(2, 56) = 4.242, p = .019, η2 = .13.
The repeated measures ANCOVAs showed that the main effects of size and laterality were not significant, whereas the size × laterality interaction was significant for the MD only group, F(1, 20) = 28.239, p < .001, η2 = .58. These results suggest the presence of a SNARC effect only in the MD only group. MRTs are presented in Figure 1.
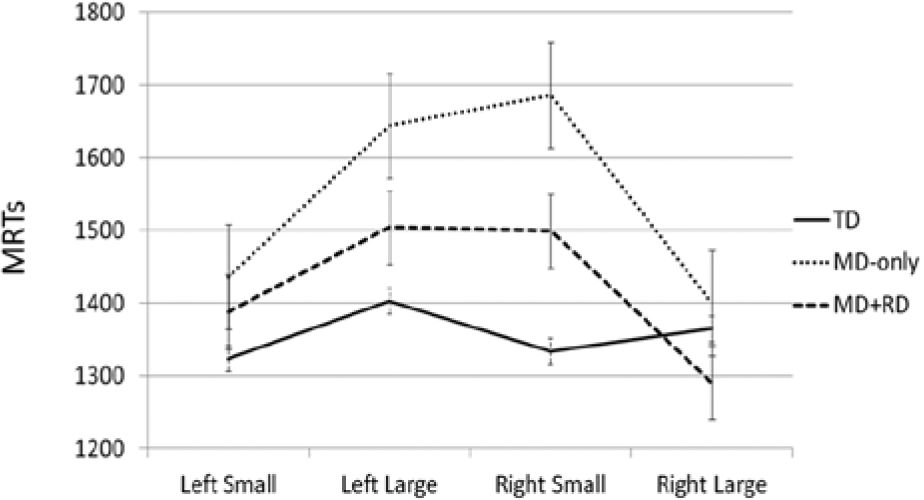
Average reaction times (MRTs) in the four conditions of the spatial numerical association of response codes effect.
The ANOVA revealed a significant effect of group on SNARC score, F(2, 59) = 4.192, p < .05, and Bonferroni post hoc analyses showed a significant difference between the MD only and TD groups (p < .05). The effect sizes reported in Table 3 show that the differences between MD only and TD children were large (d = −0.88), and the MD only group exhibited a stronger SNARC effect. Furthermore, comparison of the MD+RD and TD children revealed a medium effect size (d = −0.57), and again the clinical group showed stronger SNARC effects than the control group. Finally, the difference between the MD only and MD+RD groups was small (d = 0.18).
The results of the correlation analyses revealed a significant correlation between the SNARC effect and grade (r = .291, p < .05), in which the SNARC effect decreased with age. There was also a significant correlation between the SNARC effect and performance in the written arithmetic test (r = .433, p < .01) because the SNARC effect became stronger as performance on the arithmetic test decreased. A partial correlation between the SNARC effect and the written arithmetic test (age was partialed out) confirmed the positive relationships between these variables (r = .438, p < .01).
Numerical Distance Effect
MRTs are presented in Figure 2. The main and interaction effects of the 2 × 2 × 3 ANCOVA (size × distance × group with FSIQ as a covariate) were not significant. The repeated measures ANCOVAs that were performed on the three groups separately showed a significant effect of distance in the TD, F(1, 28) = 35.139, p < .001, η2 = .56, MD only, F(1, 20) = 6.047, p < .05, η2 = .23, and MD+RD, F(1, 9) = 20.226, p < .001, η2 = .69, groups. The distance × size interaction was significant only in the TD group, F(1, 28) = 5.321, p < .05, η2 = .16. The ANOVA showed a nonsignificant effect of group on NDE score, F(2, 59) = 0.025, p = .975. The effect size estimates revealed very small differences between the groups. No significant correlations were found between NDE score and the other cognitive variables.

Numerical distance effect.
First Order Congruency Effect
Mean MRT scores are presented in Figure 3a. The 3 × 3 ANCOVA (group × first order congruency) showed no significant effect of first order congruency, F(2, 112) = 0.170, p = .844, η2 < .01, or group, F(2, 56) = 1.477, p = .237, η2 = .05, and no first order congruency × group interaction, F(4, 112) = 1.001, p = .410, η2 = .03. The ANOVA showed a nonsignificant effect of group on first order congruency score, F(2, 59) = 1.971, p = .149. However, analysis of the effect sizes showed a medium difference between the MD+RD group and the other groups (d = −0.73 with the TD group; d = −0.74 with the MD only group); specifically, the comorbid group showed a stronger congruency effect. In contrast, the comparison between the TD and MD groups resulted in a very small effect size. Correlation analyses revealed significant values for the speed of word (r = .417, p < .01) and pseudo-word (r = .296, p < .05) reading and indicated that the first order congruency effect was stronger in slow readers.
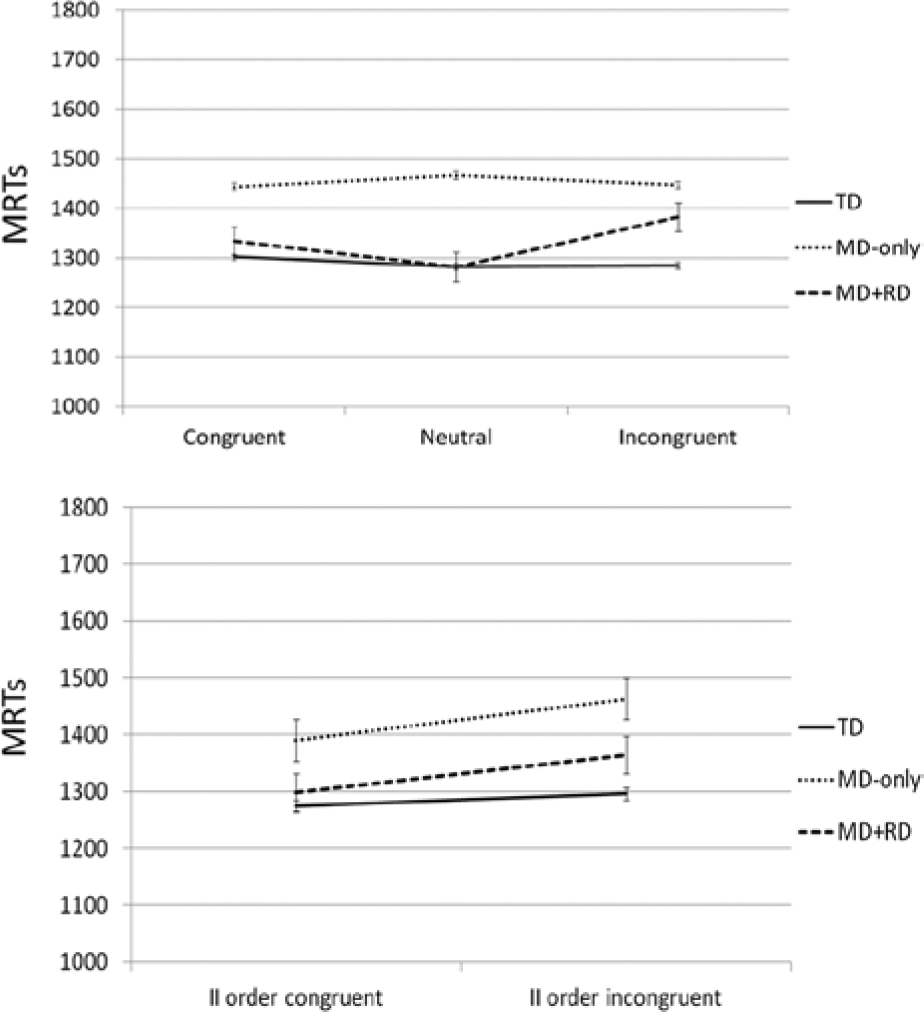
Average reaction times (MRTs) in the conditions of the flanker effects.
Second Order Congruency Effect
Mean MRT scores are presented in Figure 3b. The 3 × 2 ANCOVA (group × second order congruency) showed no significant effect of second order congruency, F(1, 56) = 0.168, p = .684, η2 < .01, or group, F(2, 56) = 1.186, p = .313, η2 = .04, and the second order congruency × group, F(2, 56) = 1.042, p = .359, η2 = .04, interaction was not significant. The ANOVA showed a nonsignificant effect of group on second order congruency effect score, F(2, 59) = 1.114, p = .335. However, the effect sizes that resulted from the comparisons of the MD only or MD+RD samples to the control group were medium (d = −0.45 for both the comparisons), whereas the differences between the MD only and MD+RD groups were very small. None of the correlations between second order congruency score and the variables considered were significant.
Discussion
This research aimed to explore magnitude representation in children with MD with and without RD by analyzing the SNARC, NDE, and flanker effects because of the lack of studies of these groups of children. Based on the defective number module hypothesis (Butterworth, 1999, 2005), we expected to find weaker SNARC, flanker, and distance effects in the MD children because of their deficit in basic numerical magnitude processing, which interferes with the automatic activation of number magnitude on the number line.
Nuerk, Bauer, et al. (2005) observed standard magnitude effects, such as the NDE and the SNARC effects, using the same Eriksen task employed in the present study, although the targets were surrounded by distractors. Their results, obtained from typically developed adults, were only partially replicated in our sample.
In line with Berch et al.’s (1999) observations, we expected to find the SNARC effect in children in or above the third grade. We found the effect but only in the MD only group, whereas decreased RTs were not associated with small numbers and the left button or larger numbers and the right button in the TD and MD+RD groups. However, the Cohen’s d showed a medium effect size for the comparison of SNARC scores between the TD and MD+RD groups, whereas the effect size that emerged from the comparison of the MD+RD and MD only groups was very small (Cohen’s d < .02). Apparently, children with MD are more confounded by the condition of spatial incompatibility between number size and the response button, particularly in the absence of comorbidity with RD. Children with MD were slower than TD children in the automatic activation of the semantic values of numbers because they were more confounded by spatial incompatibility (according to the mental number line orientation). Compared to the other two groups, children in the MD only group were characterized by a more pronounced visuospatial impairment and poorer calculation skills, as shown by their poorer performance in the block design and the written arithmetic test, respectively. However, the correlation analyses showed that the SNARC effect was related to calculation skills (after partialing out the age effect) but not to the block design. This result replicated, for both males and females, the results obtained by Schweiter et al. (2005), which were limited to males.
The greatest consistency of the SNARC effect in children with specific MD can be linked to the increased use of immature strategies, such as finger counting, when performing calculations (Geary, 2004), that may in turn increase the strength of the link between space and numbers found in younger subjects and in those with MD. This hypothesis would be strengthened if Italian children would usually use the fingers of their left hands to enumerate small quantities, encouraging the development of a spatial association between left and small numbers and between right and large numbers. However, literature on this topic showed frequently an opposite pattern (Previtali, Rinaldi, & Girelli, 2011).
An alternative explanation of the association between the SNARC and MD is based on the model of number processing of Tzelgov, Meyer, and Henik (1992); according to this model, there are two strategies to perform number comparison tests. Initially, to make a comparison, children’s performances are based only on the activation of specific positions of digits on the mental line. Later, children become able to rapidly recall results from long-term memory because of the establishment of mnestic (i.e., stored in memory) associations between the pair of numbers being compared and the response. Children with MD may have fewer stored mnestic traces, because of a quick decay of information in working memory, due to which the terms of a problem (for example, two digits to compare) are no longer available when the answer is accessible and long-term memory associations cannot be created (Rousselle & Noël, 2007). Therefore, they would use immature strategies more often. This supposition would explain the stronger association between space and numbers. Indeed, the first strategy mentioned by Tzelgov et al. involves the activation of digit representations on the mental line and therefore their positions on the right or left of the line, which, for these subjects, results in quicker responses to numbers lower than five with the left button and in quicker responses to greater numbers with the right button, which, in turn, causes an increase in the SNARC effect, while the opposite condition causes a disadvantage in terms of increased RTs.
Our results are apparently in contrast with those reported by Bachot et al. (2005) who found a negative relationship between visuospatial skills and the SNARC effect. The reason for this discrepancy is that, in our study, we selected children with MD, whereas Bachot et al. analyzed a group of children with visuospatial deficits, therefore the samples are different, and any comparison is difficult.
In contrast, the NDE was observed in all groups of children examined. Responses became faster as the numerical distance between the target and the digit 5 (i.e., the number with which the target was compared) increased. Furthermore, the TD group showed a significant interaction effect; the difference in MRTs for small and large distances was bigger for digits larger than 5. Effect size estimates showed very small differences among the three groups (Cohen’s d < .02). This finding is in line with the results obtained by Landerl and Kölle (2009) and by Ashkenazi et al. (2009), who analyzed the RTs of children with MD and TD children in a single-digit comparison task, and is in contrast with our expectations based on the defective number module hypothesis. However, the NDE for TD children resulted specifically from the difference between small and large distances for digits larger than 5, as shown by the interaction effect. In addition, in this case, an explanation based on the two qualitatively different strategies introduced by Tzelgov et al. (1992) can be given; TD children used long-term memory associations between the pairs of numbers to compare the numbers and to respond, particularly for digits smaller than 5, as children have greater experience with these numbers (Rousselle & Noël, 2007). The result is a similar NDE and a slight differentiation that partially supports the use of different strategies.
A different pattern was found for the first order congruency effect, which was nonsignificant for all groups considered. However, further analysis using Cohen’s d indicated medium effect sizes for the comparisons between the MD+RD and the other two groups. This finding indicates that, in our sample, the first order congruency effect seemed to be connected to RD but not to MD. This supposition was confirmed by the correlation analysis, which showed significant correlations between first order congruency effect scores and the reading speeds of both words and pseudo-words. The interpretation given by most of the literature regarding the first order congruency effect that emerges in the Eriksen task explains this effect as an alteration that is due to the inability to ignore the irrelevant information that originates from the distractors (Eriksen & Eriksen, 1974; Stevens & Bavelier, 2012); larger RTs in the incongruent than in the congruent condition are taken as an index of poorer attentional filtering ability. In the literature, there are many studies that support the hypothesis that developmental dyslexia may be associated with attentional impairment (Bednarek et al., 2004; Facoetti et al., 2003; Facoetti, Paganoni, & Lorusso, 2000; Vidyasagar, 2004), which has been interpreted as the cause of RD (Franceschini, Gori, Ruffino, Pedrolli, & Facoetti, 2012) or has been considered to be an association mediated by phonological processing (e.g., Marzocchi et al., 2009). In the present study, children without RD were able to focus on the target stimulus and to ignore distractors, whereas the MD+RD group was slightly slowed when the target and the flanker were incongruent. This result is compatible with a visual-attentional bias that specifically affects children with RD.
Finally, the second order congruency effect was nonsignificant for all groups of children. However, analysis of Cohen’s ds revealed that this effect was similar in the clinical groups (MD and MD+RD) because subjects in these groups performed congruent trials faster but showed a medium effect size in the comparison with the control group. Second order incongruency implies that a number that is smaller than the target is nevertheless the largest on the display and vice versa (Nuerk, Bauer, et al., 2005). This effect can only be examined for first order congruent trials in which the target and flanker suggest the same response. The second order congruency effect has been interpreted by Nuerk, Bauer, et al. (2005) as interference from an additional automatic magnitude comparison between the target and flankers. As these authors suggested, “Since this automatic comparison has just a 50% chance of being second order congruent with the correct response, it is dysfunctional to compute it. Nevertheless, the effect indicates that this second automatic magnitude comparison is carried out” (p. 48) by children with MD. It seems that MD only children found a way to address the first order congruency/incongruency issue that had only marginal costs in terms of RT but are slightly slowed by the second order step. Therefore, TD children are able to ignore distractors, whereas children with MD are affected by interference from the distractors, which is primarily mediated by the RD or is secondarily mediated independently of comorbidities.
Regarding clinical and educational implications, it can be assumed that the presence of greater effects in children with MD could prove the existence of a strong dependence on a spatial and concrete representation of numbers. It follows, therefore, that this evidence needs to be taken into account in education, and we propose that teachers should use concrete and supports that can be manipulated, such as number lines, blocks, board games, or tables, as compensative measures that would facilitate access to numerical values (Clements, 2000; Marolda & Davidson, 2000; Wadlington & Wadlington, 2008). Similarly, there appears to be a need in the clinical field to work on this dependence by helping older children become independent of concrete spatial representations, after multiple direct experiences with concepts, for the purpose of facilitating automatic recognition of the values of numbers and more abstract reasoning (Wadlington & Wadlington, 2008). Using a problem-solving approach, focusing on error analysis and reasoning on real-world situations could be a useful way to gradually lead children with MD to a more abstract representation and manipulation of quantities (e.g., Chinn & Ashcroft, 2006; Kaufmann, Handl, & Thöny, 2003; Montague, 1997; Shalev, 2004).
The main limits of this research are as follows: (a) the sample was selected from a school population, and the children had difficulties in computing and reading, as shown by the poor performance on some specific tests, but they had not received a clinical diagnosis of dyscalculia or dyslexia; (b) the sample size was small due to the rareness of severe MD (e.g., Peard, 2010), and we used a conservative cutoff to select the sample. The MD+RD group consisted of only 10 children, and the MD only group was composed of 21 children.
Conclusions
We provide the following answers to our two research questions:
The MD condition overall was related to stronger effects associated with number magnitude. In particular, SNARC effect was significant only for the MD group, and flanker second order congruency effect was stronger in the MD group than in TD group, according to Cohen’s effect size measure.
Children in the MD only group shared common features with the MD+RD group in terms of their performances on the Eriksen task: the NDE, flanker second order congruency, and SNARC effects were partially similar between these two groups. In contrast, the flanker first order congruency effect seemed to be specifically associated with RD. Globally, the deficit in basic numerical magnitude processing was common to both groups, and RD led to additional difficulties.
In summary, the TD group showed only the NDE, and the other effects analyzed were nonsignificant. In contrast, children with MD, with or without RD, seemed to be more globally dependent on spatial representations of numbers when performing single-digit comparisons. We hypothesized this could be due to the application of immature strategies, linked for example to the use of finger counting (Geary, 2004). Whereas TD third to fifth graders are already able to recall results of comparisons between digits from long-term memory, children with MD never developed mnestic traces of these results due to their working memory difficulties (Bull & Scerif, 2001; D’Amico & Passolunghi, 2009; Passolunghi, Mammarella, & Del Torre, 2011; Passolunghi & Siegel, 2004; Swanson et al., 2009; Swanson & Jerman, 2006 ). The lack or weakness of these mnestic traces leads them to employ more primitive strategies based on spatial representations of digits. Studies that showed how TD children no longer exhibit SNARC effect from fourth or fifth grade (e.g., Berch et al., 1999) are in line with this hypothesis.
Footnotes
Declaration of Conflicting Interests
The author(s) declared no potential conflicts of interest with respect to the research, authorship, and/or publication of this article.
Funding
The author(s) received no financial support for the research, authorship, and/or publication of this article.