
Abstract
This study examined mathematics achievement growth of students without disabilities (SWoD) and students with learning disabilities (LD) and tested whether growth and LD status interacted with student demographic characteristics. Growth was estimated in a statewide sample of 79,554 students over Grades 3 to 7. The LD group was significantly lower in achievement in each grade and had less growth than the SWoD group. We also found that student demographic characteristics were significantly related to mathematics growth, but only three demographic characteristics were statistically significant as interactions. We found that LD-SWoD differences at Grade 3 were moderated by student sex, while Black race/ethnicity and free or reduced lunch (FRL) status moderated LD-SWoD differences at all grades. These results provide practitioners and policy makers with more specific information about which particular LD students show faster or slower growth in mathematics. Our results show that simply including predictors in a regression equation may produce different results than direct testing of interactions and achievement gaps may be larger for some LD subgroups of students than previously reported.
Keywords
One of the central goals of current assessment and accountability efforts is to monitor and ensure the development of foundational skills in mathematics, skills that are deemed essential for students’ later achievement and success in school and career (National Early Literacy Panel, 2008). Although the development of mathematics skills for all students is a focus of the No Child Left Behind Act of 2001 (NCLB, 2002), the NCLB requirement that outcomes be disaggregated by targeted subgroups is recognition of a long-standing concern that there are large gaps in achievement for students who are poor, racial or ethnic minorities, are English language learners (ELL), or are served in special education (Reardon, Greenberg, Kalogrides, Shores, & Valentino, 2013).
Composing over 3.4% of all children ages 6 through 21 and 40% of students with disabilities, the most prevalent disability category for which students receive special education services is specific learning disability (LD; U.S. Department of Education, 2014). Although most students identified with a specific LD have primary difficulties in reading (estimated at 80%; Lyon et al., 2001), students may also have mathematics LD, alone or comorbid with a reading disability (Compton, Fuchs, Fuchs, Lambert, & Hamlett, 2012; Geary, Hoard, Nugent, & Bailey, 2012; Jordan, Kaplan, & Hanich, 2002; Judge & Watson, 2011). Research on the cognitive underpinnings of mathematics LD lags well behind work delineating the core deficits underlying reading disabilities (Judge & Watson, 2011). Although there is agreement that some common processing difficulties may underlie both reading and mathematics LD, such as working memory and processing speed (Geary et al., 2012; Swanson, Jerman, & Zheng, 2009), there is also evidence that there are deficits in mathematics cognition specific to mathematics LD that are present at school entry and impede early growth in mathematics. These deficits include low fluency in processing quantities for small sets and difficulty mapping numerals to quantities (Geary et al., 2012). Whether students with LD have a primary disability in reading, mathematics, or both, as a group their achievement in mathematics is substantially below that observed for students without disabilities (SWoD; Jordan et al., 2002; Morgan, Farkas, & Wu, 2011; Stevens, Schulte, Elliott, Nese, & Tindal, 2015).
Progress in enhancing the development of mathematics ability for students with LD can be informed by a general understanding of students’ achievement growth and differences in growth by specific student subgroups. Substantial agreement exists across studies of children’s mathematics achievement that growth is best described as a curvilinear function with greater growth in early grades that slows in middle and high school (Bloom, Hill, Black, & Lipsey, 2008; J. Lee, 2010; Morgan et al., 2011; Wei, Lenz, & Blackorby, 2013). Within this general pattern, studies generally find that disadvantaged students perform lower when they start school, have fewer home resources, and have fewer opportunities for mathematics learning (Hedges & Nowell, 1999; V. E. Lee & Burkam, 2002; Siegler, 2009). Other demographic characteristics related to student achievement include sex and race/ethnicity (Fryer & Levitt, 2004; Jordan et al., 2002), with students who are female or of African American, Hispanic, or Native American race/ethnicity showing early mathematics achievement gaps and often less growth across grades (e.g., Judge & Watson, 2011; Morgan et al., 2011; Reardon & Galindo, 2009; Shin, Davison, Long, Chan, & Heistad, 2013).
Only a few investigators have examined mathematics achievement growth for students with disabilities (SWD), either using a dichotomous categorization of SWD versus SWoD students or examining mathematics growth for specific exceptionalities—most commonly speech–language impairment and/or LD (e.g., Judge & Watson, 2011; Morgan et al., 2011; Shin et al., 2013). These studies generally find that growth for SWD follows the same curvilinear trajectory found for SWoD (Wei et al., 2013). Differences between SWD and SWoD are most consistently found in intercepts, but some studies have reported slower SWD mathematics growth as well (Judge & Watson, 2011; Morgan et al., 2011).
The current study sought to examine achievement gaps between students with LD and SWoD as well as to determine whether a “fan-spread” or Matthew effect pattern existed in which certain subgroups of LD students fall increasingly behind their SWoD peers. Our goal was not to investigate the specific mechanisms responsible for students’ mathematical difficulties but to determine whether students with combinations of characteristics are at greater risk of low mathematics performance and more likely to lag increasingly behind on a high-stakes state test of mathematics achievement. Addressing this goal can guide researchers, practitioners, and policy makers in better targeting resources toward those children who are most at risk of mathematics difficulties (Jordan & Levine, 2009; McCoach, O’Connell, Reis, & Levitt, 2006; Morgan, Farkas, & Hibel, 2008; Parrila, Aunola, Leskinen, Nurmi, & Kirby, 2005; Vukovic et al., 2014).
Most studies examining growth for SWD have controlled for the influence of demographic characteristics (e.g., Judge & Watson, 2011; Wei et al., 2013). Including demographic characteristics in studies of SWD is important because many demographic characteristics related to student achievement growth are also related to SWD identification and placement. For example, poor or Black students are more likely to be identified as LD once they enter school (Sullivan & Bal, 2013), but less likely to receive early intervention services (Morgan, Farkas, Hillemeier, et al., 2015). Males are more likely than females to be identified as SWD across all ages, and for the exceptionality of LD, outnumber females by a ratio of two to one by 10th grade (Coutinho, Oswald, & Best, 2002; Shifrer, Muller, & Callahan, 2011). Given the cumulative nature of risk factors (Evans, Li, & Whipple, 2013), failing to consider the complex interplay of student demographic characteristics and disability status when examining achievement growth may mask groups that are particularly at risk for low achievement and mislead practitioners and policy makers regarding the true nature of group differences and achievement gaps and fail to identify the subgroups of students most in need of early identification or intensive intervention.
Using Early Childhood Longitudinal Study–Kindergarten data, Judge and Watson (2011) found that students with LD had significantly lower achievement growth over Grades K to 5 if they were female, African American, Hispanic, or lower socioeconomic status (SES). Morgan, Farkas, and Wu (2009) found that female, non-White, lower SES students identified as having a mathematics learning difficulty scored significantly lower on initial status and had lower mathematics growth rates than peers over Grades 1 to 5. Wei et al. (2013) found significantly lower mathematics achievement for students in several specific exceptionality categories in comparison to students with LD. Wei et al. also found significantly lower mathematics achievement for students who were Black, Hispanic, or Other ethnicity, male, or lower SES. Stevens et al. (2015) examined the achievement growth of seven exceptionality groups including students with LD and found that the addition of demographic predictors to growth models resulted in (a) substantial changes in the magnitude of intercept coefficients for most exceptionalities, (b) no appreciable changes in the size of linear growth coefficients, and (c) only two differences in rate of curvature.
The Importance of Interaction Effects
In studies of student achievement, a regression model that adds demographic characteristics to the equation exerts control over the demographic predictors through a statistical process known as “partialling.” Although these “control” predictors often theoretically fill the role of moderating variables (see Note 1), which are hypothesized to impact the strength or direction of the relationship between a focal predictor (e.g., LD status) and an outcome (e.g., mathematics achievement), they are not interaction effects (see Hayes, 2013; Jaccard & Turrisi, 2003). Nonetheless, researchers often describe and interpret partial results as though they were interaction effects.
This conflation of partial and interaction effects can lead to important misinterpretations of regression results by researchers, practitioners, or policy makers when multiple predictors are used in single or multilevel regression equations. Take as an example a regression analysis with two dichotomous predictors in which LD status (coded 0 for SWoD and 1 for LD) and free or reduced lunch (FRL) subsidy (coded 0 for no subsidy and 1 for subsidy) are used as predictors of the outcome (with no interaction term) and the LD and the FRL dummy variables are both found to be statistically significant. The correct interpretation of the LD coefficient is that LD students averaged over the two FRL groups differ from SWoD-not FRL students (the group represented by the intercept). But many researchers interpret the coefficient associated with the LD predictor as referring to differences between all LD and all SWoD students and do not realize that specific differences among the six possible combinations of the four LD and FRL groups have never been directly compared nor tested, thereby ignoring contrasts that may be of greater theoretical interest (e.g., Do LD-FRL students differ significantly from SWoD-FRL students? Do LD-FRL students differ significantly from LD-not FRL students?). To correctly test interaction effects, a product term based on the multiplication of the predictors is required, and when the product term is statistically significant, observed differences need to be evaluated using post hoc follow-up tests (see Aiken & West, 1991; Cohen, Cohen, West, & Aiken, 2003; Hayes, 2013; Jaccard & Turrisi, 2003; Pedhazur, 1997). We describe partial regression effects and the testing of interaction effects in greater detail in the appendix.
Few studies in the achievement growth literature have fully tested and interpreted interaction effects and previous research examining the impact of demographic characteristics on the effects of LD status on mathematics growth has usually examined only partial effects, not interactions. For example, Judge and Watson (2011), Morgan et al. (2009, 2011), and Wei et al. (2013) all explored relationships between LD status, demographic characteristics, and growth in mathematics achievement using multilevel models. However, none of these studies explicitly modeled interaction effects using product terms. In these and other studies, interaction hypotheses were addressed in some cases by descriptive statistics and in others by visual inspection of graphical results rather than by conducting the statistical testing required to establish whether what appears to be different descriptively or visually is reliably different (Hayes, 2013).
Purpose and Research Questions
The purpose of the present study was to examine the mathematics achievement growth trajectories of students with LD and SWoD in Grades 3 to 7 using multilevel longitudinal models and explicitly test interactions of LD status with student demographic characteristics. We addressed two main questions about mathematics growth of students with and without LD: (a) How do mathematics growth trajectories interact with student LD status on a statewide mathematics achievement test? (b) Do student demographic characteristics interact with LD status and mathematics growth trajectories? In addressing these questions, we draw attention to frequent imprecise interpretations in research based on multiple regression and multilevel models using multiple predictor variables without including interaction effects.
Method
Sample
We analyzed data from students in North Carolina who were in the third grade in 2000–2001 and had not been retained in grade from the previous year. We excluded students if they did not follow the expected annual grade level sequence from Grades 3 to 7; never participated in the mathematics test; were missing Wave 1, third grade demographic information; or were in exceptionality categories other than students with LD. After students meeting one or more of these exclusion criteria had been eliminated, the analytic sample consisted of 79,554 students, of whom 5,221 (6.6%) were students with LD. Student characteristics of the sample were 2,648 (3.3%) ELL, 40,889 (51.4%) females, and 33,465 (42.1%) FRL. The racial/ethnic composition of the sample was 1,194 American Indian (1.5%), 1,533 (1.9%) Asian, 23,243 (29.2%) Black, 4,325 (5.4%) Hispanic, and 47,854 (62.0%) White students. Students who were in Grade 3 in 2000–2001 were matched to all succeeding years through Grade 7 (2004–2005), after which the state introduced a new test edition that could have confounded estimates of mathematics growth. Students were included in the analyses as long as they had at least one mathematics score; 81.9% had mathematics scores in all 5 years, 4.9% in 4 years, 4.0% in 3 years, 3.4% in 2 years, and 5.7% in only one year. The numbers of students tested in mathematics in Grades 3 to 7 were 78,437, 73,850, 71,372, 69,588, and 67,843, respectively.
We identified students as LD or a SWoD on the basis of students’ exceptionality classification in third grade, according to state accountability testing records. At that time, to be identified as a student with LD, North Carolina required students to have a severe discrepancy between ability and achievement (a) through a 15 standard score point discrepancy between ability and achievement on individually administered ability and achievement tests or (b) through the provision of work samples and other data that provided strong and consistent evidence of the presence of a severe ability/achievement discrepancy, even though it had not been observed on standardized measures. This second option was used infrequently. The LD group consisted of students identified as having an LD in any academic area. We considered including only students with documented LD in mathematics, but elected to include all students with LD given that as a group, students with LD are likely to have lower achievement in mathematics even if they do not meet diagnostic criteria for a specific mathematics disability (Cirino, Fuchs, Elias, Powell, & Schumacher, 2015; Stevens et al., 2015) and mathematics LD and reading LD are frequently comorbid (Watson & Gable, 2013).
Measures
The outcome measure for all analyses was the scale score on the standardized, second edition North Carolina End of Grade Mathematics Test. The test was designed to measure four mathematics strands: (a) number sense, numeration, and numerical operations; (b) spatial sense, measurement, and geometry; (c) patterns, relationships, and functions; and (d) data, probability, and statistics (North Carolina Department of Public Instruction, 2006). Developmental scale scores across the four strands were constructed using a three parameter, logistic item response theory model (Thissen & Orlando, 2001) and are based on vertical linking using a common items design to create a developmental scale spanning all grades. Reliability and validity for the NC mathematics tests are provided in state technical reports (North Carolina Department of Public Instruction, 2006) including total score internal consistency estimates above .90 and evidence of content and criterion-related validity established through teacher content ratings of how well items represented the state’s mathematics curriculum, correlations between teacher judgments of students’ expected mathematics performance and their test scores, and correlations between student scores on other mathematics assessments and the state test (correlations ranged from .56 to .86).
Analytic Methods
We applied multilevel, random effects, longitudinal analyses computed using HLM 7.0 (Raudenbush, Bryk, Cheong, Congdon, & du Toit, 2011) and full maximum likelihood estimation. Time was centered at the first testing occasion (Grade 3). Because our interest was in student achievement not school effects and because we did not want to exclude students who moved schools during the study time period, we did not include a third, school level in analyses.
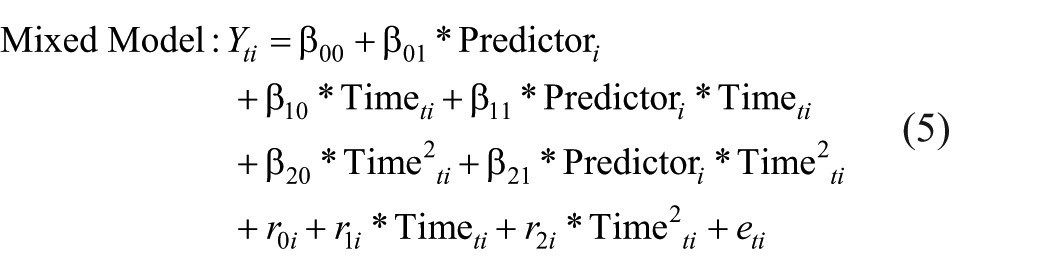
The longitudinal, multilevel model specified the relation between mathematics score and a curvilinear function of time (grade) at Level 1 and student characteristics at Level 2:
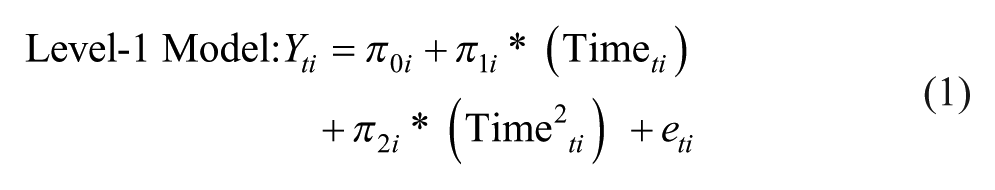

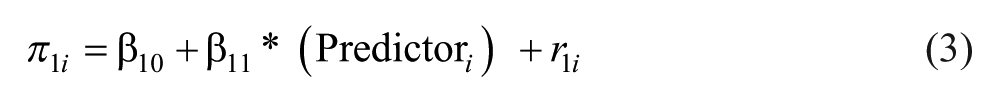

However, the underlying mathematical expression for this model that more clearly shows the cross-level interaction terms is
We evaluated linear and curvilinear models to describe the functional form of the mathematics achievement growth trajectories at Level 1. We next added a dummy coded variable representing LD status (0 = SWoD, 1 = LD). In the third model, we added three dichotomous student demographic variables (ELL, FRL, sex) and four dummy coded variables representing student race/ethnicity (American Indian, Asian, Black, Hispanic). We then computed multiple additional models evaluating each possible three-way interaction of grade by LD by student demographic characteristic, one interaction at a time. Note, however, we did not test an interaction for the American Indian group because of the relatively small sample size in the LD group (n = 78) that resulted in very small cell sizes for the interaction.
We evaluated interaction effects in two ways. First, when a student-level predictor (e.g., LD status) is used to predict growth at Level 1, a two-way, cross-level interaction is formed. When one of these terms was statistically significant, we conducted post hoc tests to determine the source of the differences (e.g., Between SWoD vs. LD groups? From one grade to another?). The second type of interaction effect we tested involved the three-way interaction of Level 1 growth trajectory by LD status by moderator variable (i.e., student demographic characteristic). This involved inclusion of a multiplicative interaction term at Level 2 in the growth model for each moderating variable. If the term was statistically significant, results were probed further to determine more specific, post hoc differences within the interaction (i.e., Which combination of LD moderator groups was different? At which grades were differences significant?). The process of specifying and testing the interaction effects is described in greater detail in the appendix.
Because the repeated testing that occurs in post hoc analysis can result in the inflation of Type I error (see Pedhazur, 1997), we applied Bonferroni’s adjustment whenever we conducted post hoc tests. One common approach is to divide alpha by the number of tests within a family of comparisons (see Pedhazur, 1997, p. 435). In this study there are different numbers of post hoc tests for different interactions. For simplicity of presentation, we used the most conservative of these adjustments for the largest family of post hoc tests (α = .05/6 = .008) as the decision rule to determine statistical significance for all post hoc tests of significant interactions.
Results
Multilevel Growth Models without Interaction Testing
Unconditional and longitudinal Level 1 models
The first model applied was a fully unconditional random effects model that only estimated grand means and variance components. We then applied two-level longitudinal models that sequentially introduced two polynomial terms (linear, quadratic). At each step, introduction of each polynomial term resulted in statistically significant improvements in model fit (p < .001). Although more complex functional forms were mathematically possible, previous research on this test (Stevens et al., 2015) has shown that more complex functional forms accounted for less than one tenth of 1% of variance. Thus, a quadratic model for these data was deemed most parsimonious.
Across all students, the estimated mean mathematics scale score in Grade 3 was 250.65 (see the first columns of Table 1). Average initial linear growth was significantly different than zero, at 6.96 scale score points (z = 491.06, SE = 0.01, p < .001). The initial curvature in the growth function was −0.56 scale score points, also significantly different from zero (z = −158.73, SE = 0.01, p < .001), resulting in an initial rate of change of 6.40 scale score points from Grade 3 to 4 (6.96 – 0.56 = 6.40). This model allowed each growth trajectory parameter (i.e., intercept, linear rate of change, rate of curvature) to vary randomly across students. A multiparameter variance component test indicated that this model provided a better fit to the data than a fixed effects model, χ2(5) = 37,087.79, p < .001, demonstrating that students differed in their growth trajectories.
Fixed and Random Effects Longitudinal Hierarchical Linear Model Regression Models, Grades 3–7.
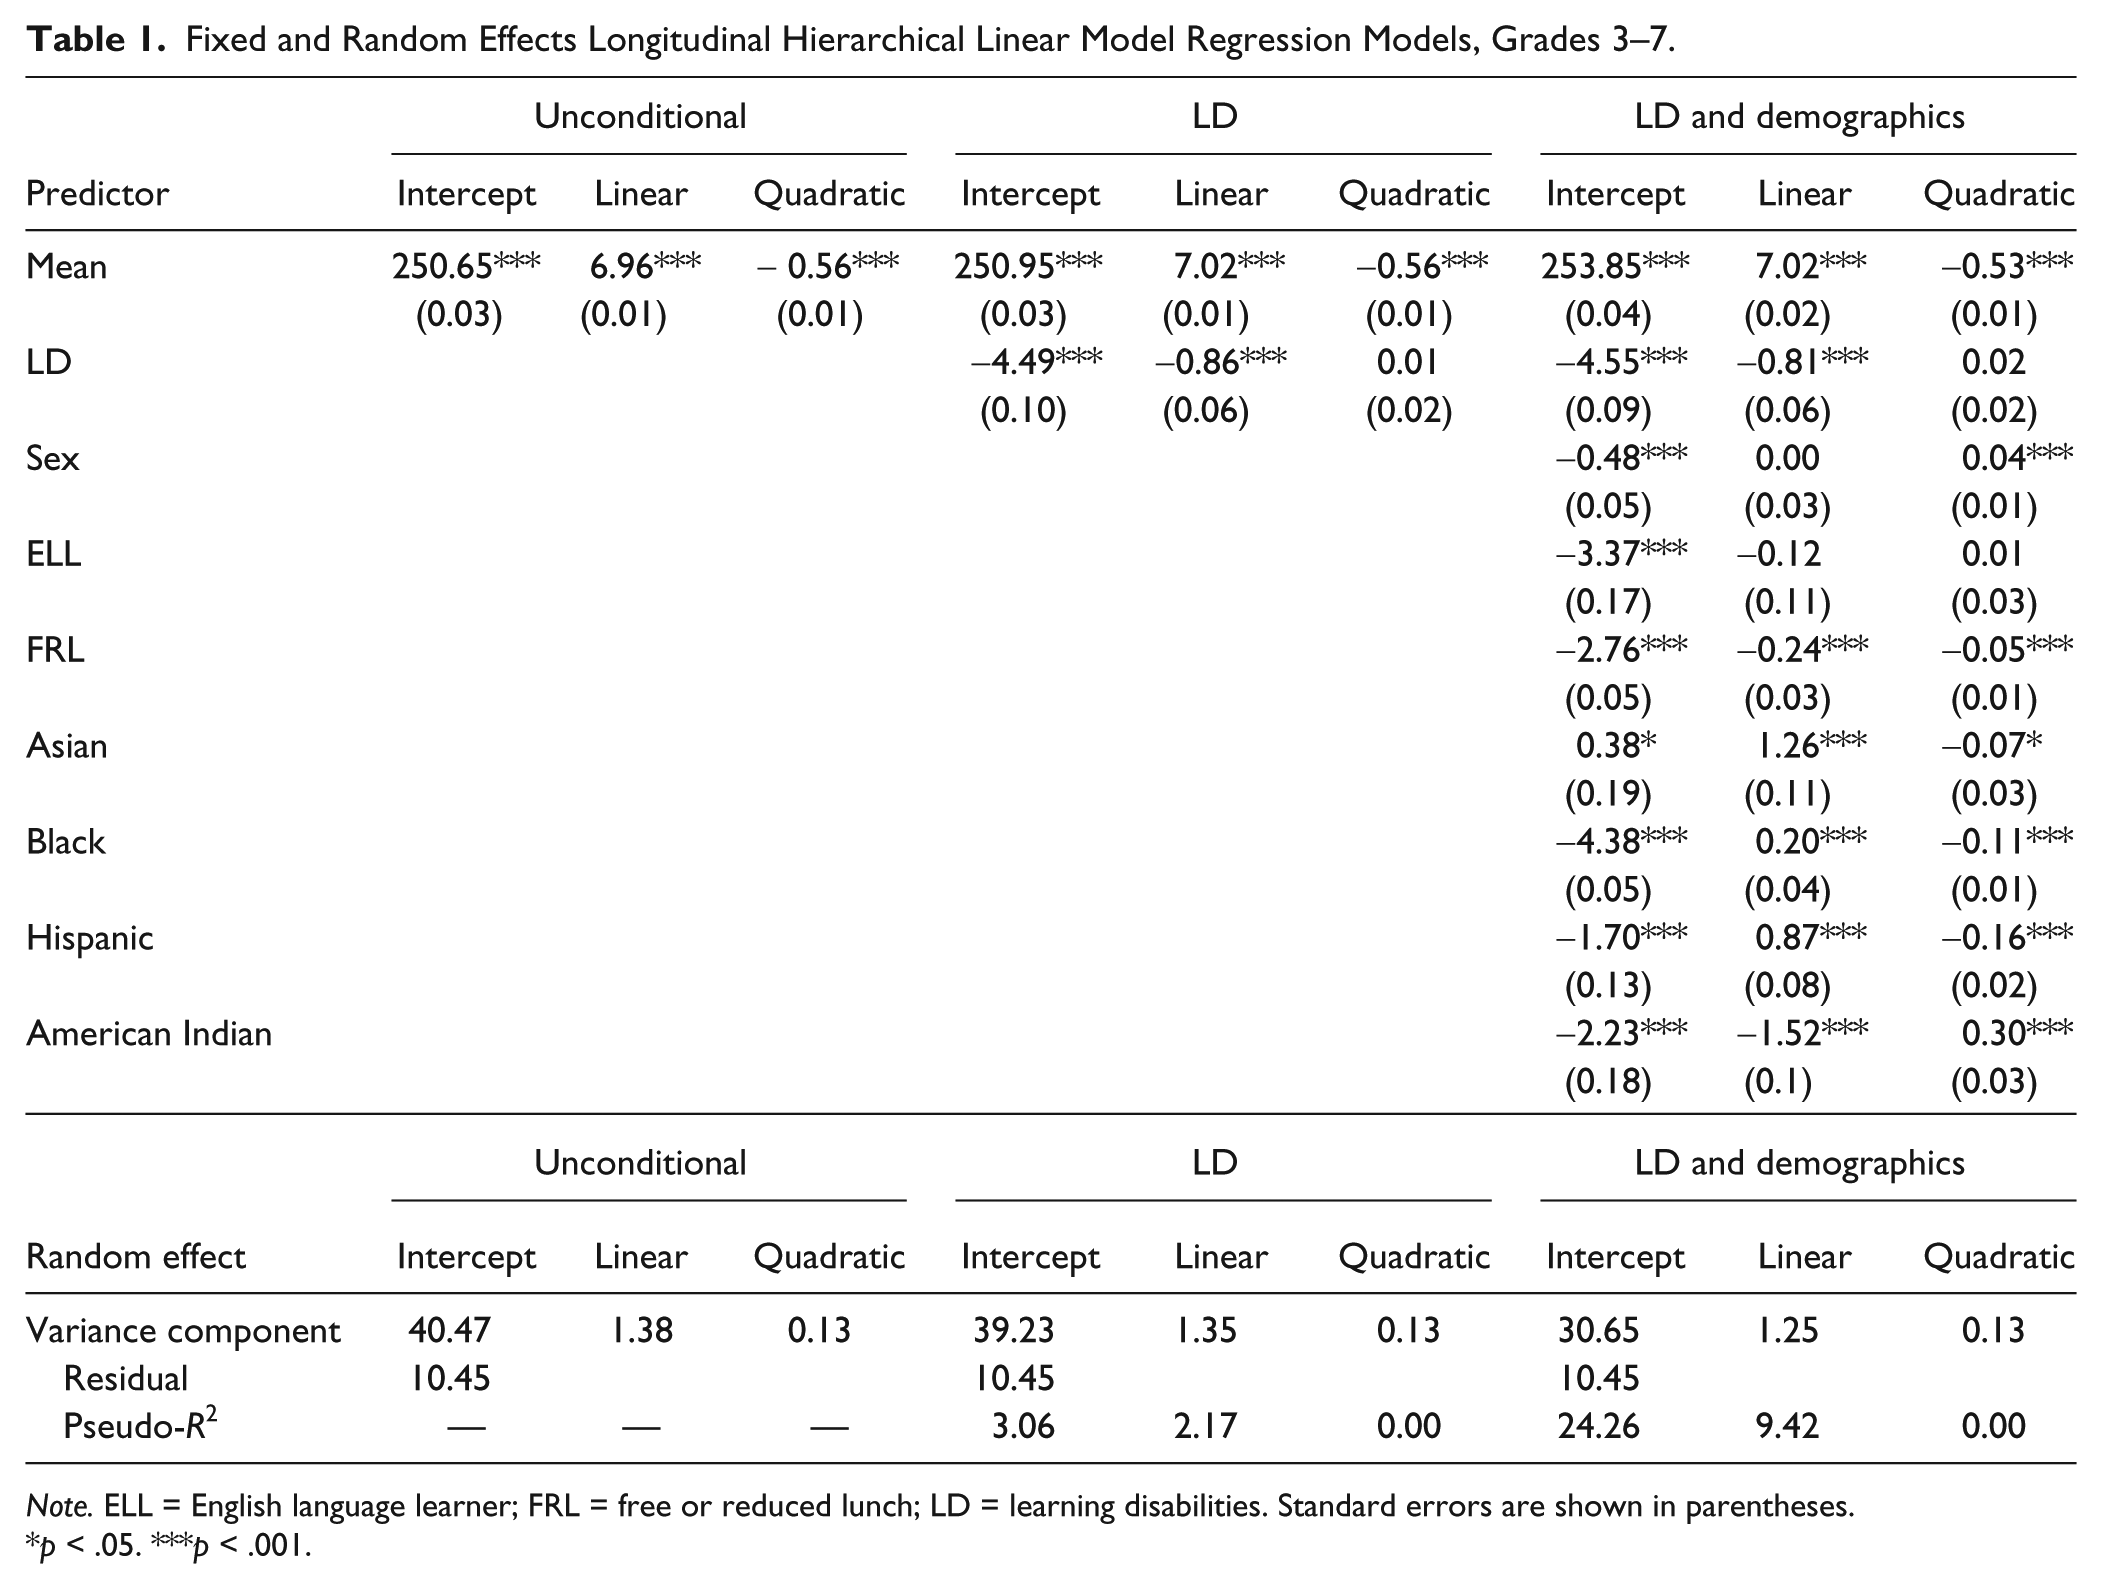
Note. ELL = English language learner; FRL = free or reduced lunch; LD = learning disabilities. Standard errors are shown in parentheses.
p < .05. ***p < .001.
Conditional models
We next applied two conditional models that added predictors to the quadratic, longitudinal model. In the first, we added a dummy coded predictor (LD) that reflected students’ status as a SWoD or a student identified with an LD. Results are shown in the middle columns of Table 1. It can be seen that the Level 1 intercept and linear growth parameter were significantly different (p < .001) as a function of LD status, but there was no statistically significant difference in rate of curvature. Students with LD were 4.49 scale score points lower than their SWoD peers at Grade 3 and had an initial linear growth rate of 0.86 points less per year.
Variance components, psuedo-R2, and deviance statistics are presented at the bottom of Table 1 and show that addition of the LD predictor accounted for no change in the variance of the quadratic parameters and an additional 3% and 2% of the variance in student intercepts and slopes, respectively, in comparison to the unconditional longitudinal model. Comparison of model deviances between the unconditional longitudinal and conditional LD models resulted in a statistically significant reduction in unexplained variance, χ2(3) = 3,244.87, p < .001.
Learning disabilities and demographics model
We then expanded the multilevel growth model by adding an additional set of predictors representing student demographics and background characteristics (see rightmost columns of Table 1). These results represent the partial effects discussed earlier and most commonly reported by researchers as a way to contextualize results for a focal predictor (i.e., LD status). The estimated intercept (253.85) now represents the average mathematics achievement in Grade 3 for White male SWoD who were not ELL and were not FRL (the reference group for contrasts with other predictors). The intercept increased almost three scale score points as the reference group was refined but the magnitude of the other LD parameter estimates changed only slightly with addition of the demographic predictors. All else constant, examination of results for the added predictors showed that females (−0.48), ELL (–3.37), FRL (–2.76), Black students (−4.38), Hispanic students (–1.70), and American Indian students (–2.23) all had significantly lower mathematics performance in Grade 3 than the reference group. Controlling for other predictors, Asian students had significantly higher achievement (+0.38) in Grade 3.
Results for linear rate of change showed that all predictors except student sex and ELL showed statistically significant differences in slope in comparison to the reference group. All else constant, students who were Asian (+1.26), Black (+0.20), or Hispanic (+0.87) showed greater initial rates of linear change. Students who were free or reduced lunch recipients (−0.24) or American Indians (–1.52) showed significantly lesser rates of linear change. Results for the quadratic parameter showed that, in addition to LD students, ELL students did not differ significantly from the reference group. Female students (+0.04) and American Indian students (+0.30) showed acceleration in growth rate. FRL (−0.05), Asian (−0.07), Black (−0.11), and Hispanic (−0.16) students all showed statistically significant deceleration in growth rate.
Examination of psuedo-R2 and deviance statistics showed that addition of the demographic predictors accounted for approximately 24% and 9% of the variance in student intercepts and slopes, respectively, but no additional variance was explained for curvature in comparison to the unconditional longitudinal model. A deviance test between the LD only model and the model that added demographic predictors resulted in a statistically significant reduction in unexplained variance as well, χ2(21) = 18,837.00, p < .001. Intercorrelations of the model parameters between intercept and linear, intercept and curvilinear, and linear and curvilinear parameters were .30, .07, and –.64, respectively. Thus, after controlling for demographic characteristics, there was a modest positive correlation between intercept and linear slope indicating a fan-spread relation in which, on average, those who scored higher in Grade 3 grew at a more rapid rate and those with lower Grade 3 scores grew at a slower rate. There was no relationship of intercept to curvature. And there was a strong negative relationship between linear and curvilinear growth parameters in which those with higher rates of initial linear change had the greatest deceleration in growth and those with lower rates of initial linear change had less deceleration in growth over time.
Figure 1 shows three of the largest partial regression effects from the LD and demographics model. The intercept or reference group is the same in all three panels of Figure 1 and represents the performance of SWoD students who were White, male, not ELL, and not FRL whose estimated growth trajectory ranged from 253.85 in Grade 3 to 273.49 in Grade 7. The left panel of Figure 1 contrasts the reference group with the FRL partial effect, that is, students who were FRL, controlling for special education status, race/ethnicity, sex, and ELL status. The empirical Bayes estimated growth trajectory for the FRL partial effect ranged from 251.09 in Grade 3 to 269.01 in Grade 7. The right panel of Figure 1 contrasts the same reference group with the Black race/ethnicity partial effect, that is, students who were Black, controlling for special education status, sex, FRL, and ELL status. The estimated growth trajectory for the Black partial effect ranged from 249.47 in Grade 3 to 268.22 in Grade 7. The bottom panel of Figure 1 contrasts the reference group with the LD partial effect, that is, students who were LD, controlling for race/ethnicity, sex, FRL, and ELL status. The estimated growth trajectory for the LD partial effect ranged from 249.30 in Grade 3 to 266.01 in Grade 7.
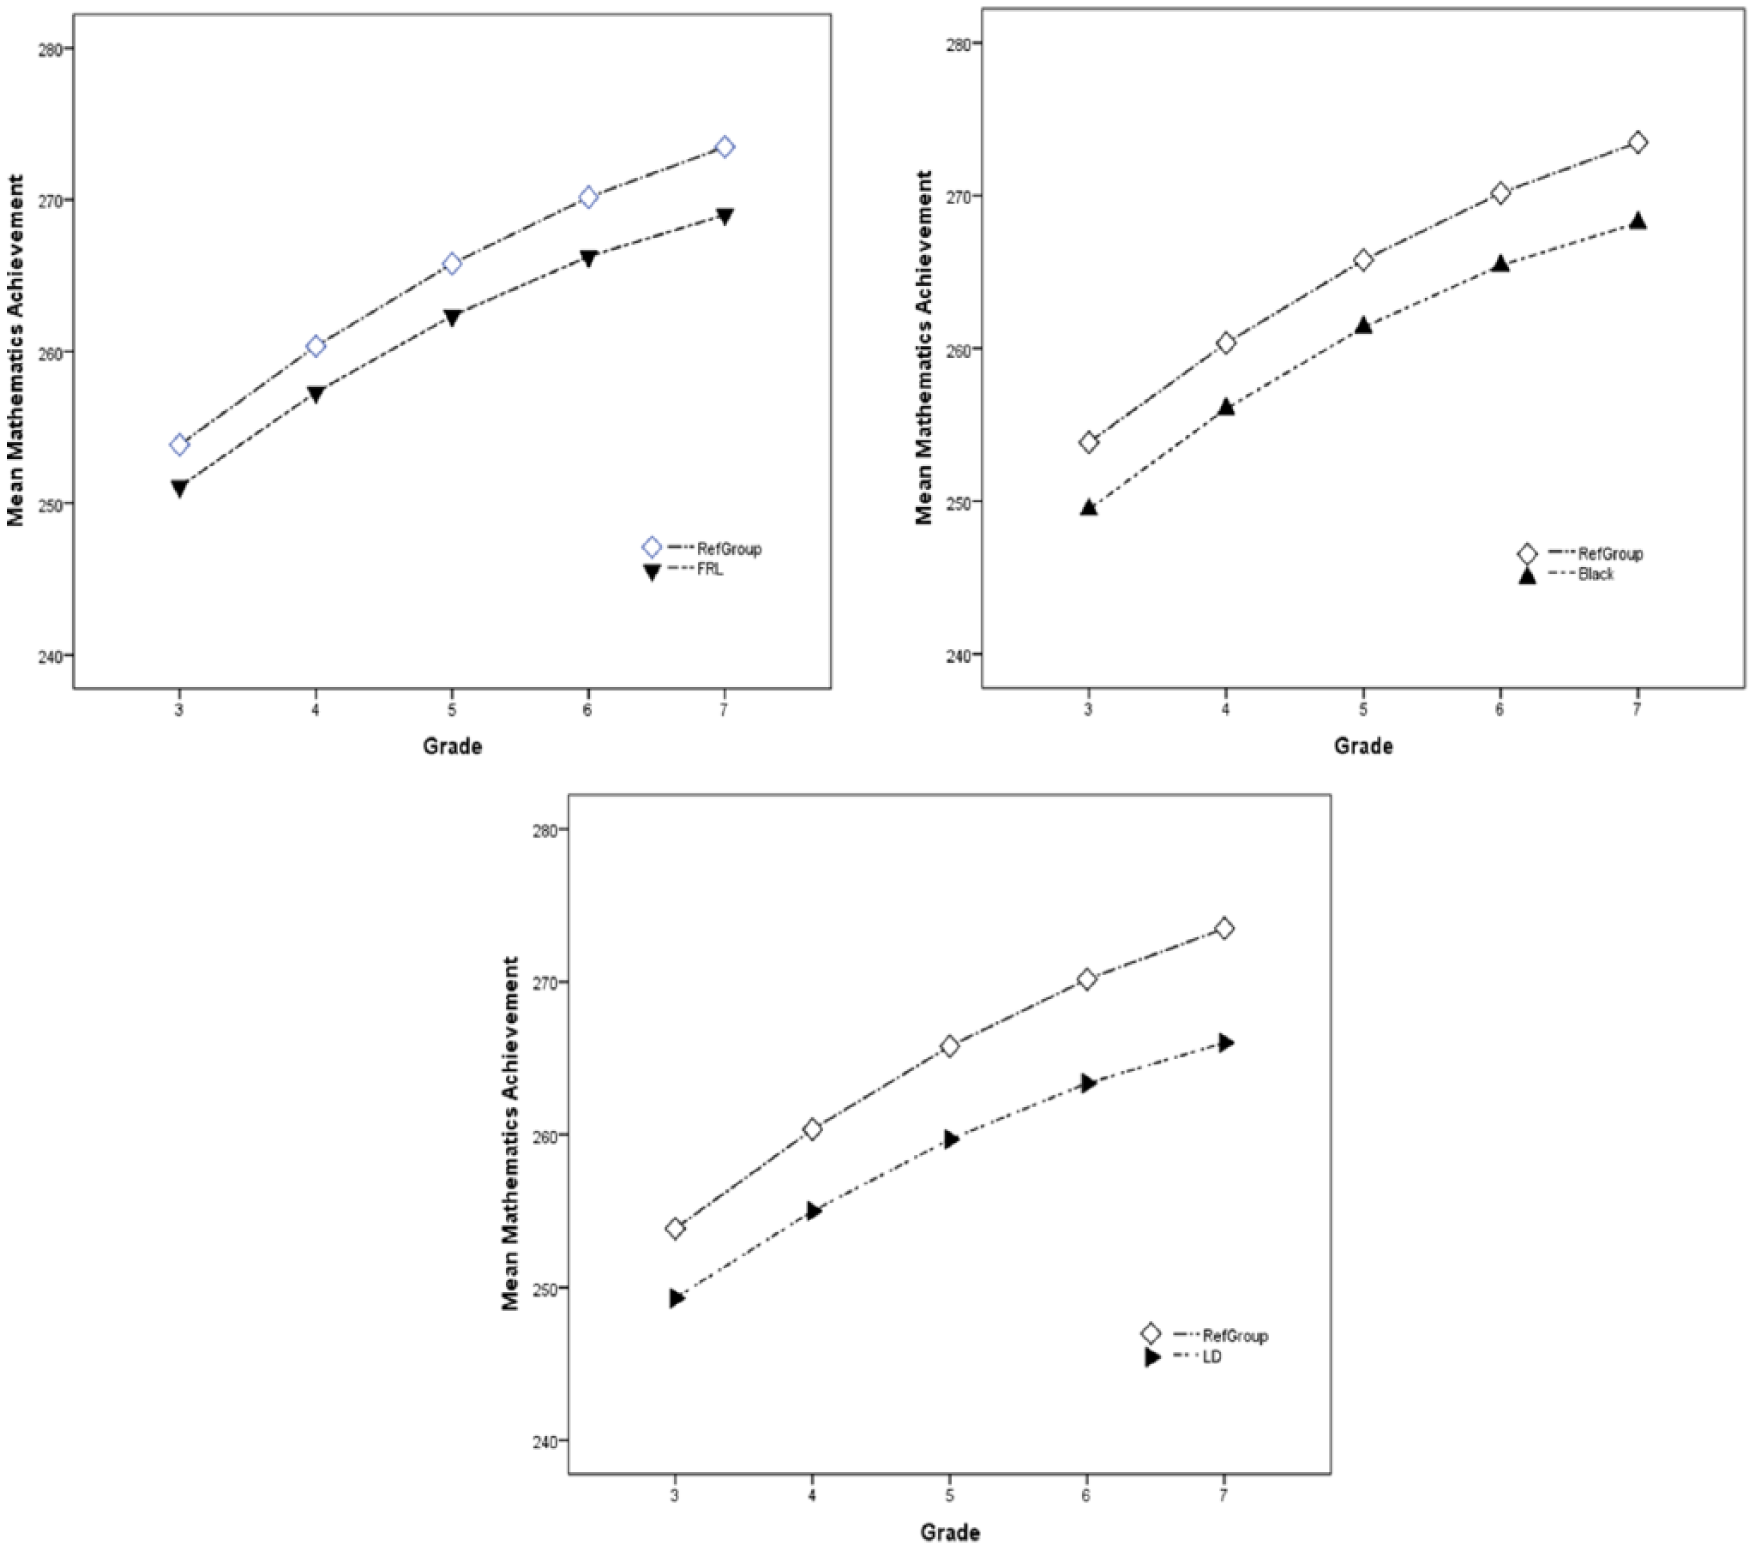
Partial regression effects from the learning disabilities (LD) and demographics model with the reference group (intercept) displayed in each panel and the partial effect of free or reduced lunch (FRL) status on the left, Black race/ethnicity on the right, and LD status on the bottom.
Multilevel Growth Models with Interaction Testing
Two-way interaction of growth and LD status
Although we knew from the results reported in Table 1 that differences in intercept and initial, growth rate between students with LD and SWoD were statistically significant (i.e., cross-level interaction of LD status with Level 1 intercepts and linear slopes), we did not have full information on the growth trajectories of students with LD nor did we know how the two groups differed at each individual grade. We therefore conducted additional analyses to probe these differences. For SWoD students, the growth function was represented by a Grade 3 score (intercept) of 253.85, an initial linear rate of change of 7.02, and a quadratic curvature of −0.53, all statistically significant (see upper portion of Table 2). The LD growth trajectory had a Grade 3 score (intercept) of 249.30, an initial linear rate of change of 6.21, and a quadratic curvature of −0.51, all three parameters statistically significant. In comparing the two growth trajectories, the LD group intercept and linear growth parameters were significantly lower than the SWoD group (p < .001), but there was no statistically significant difference in rate of curvature between the two groups. The first two rows of Table 3 show the estimated mathematics achievement trajectories for each group by grade (see Note 2). Pairwise, post hoc tests showed that differences between the LD and SWoD groups were statistically significant (Bonferroni-adjusted p < .008) at each individual grade. It is noteworthy, however, that the difference between groups increased across grades from 4.6 scale score points in Grade 3 to 7.5 points in Grade 7 (see Table 3). Expressed as an effect size (Cohen’s d), this represented an increased difference between groups from 0.66 to 0.75 of a standard deviation representing medium to large effect sizes (Cohen, 1992) and indicating the presence of a fan-spread effect.
Longitudinal Hierarchical Linear Modeling Regression Model Interaction Effects.
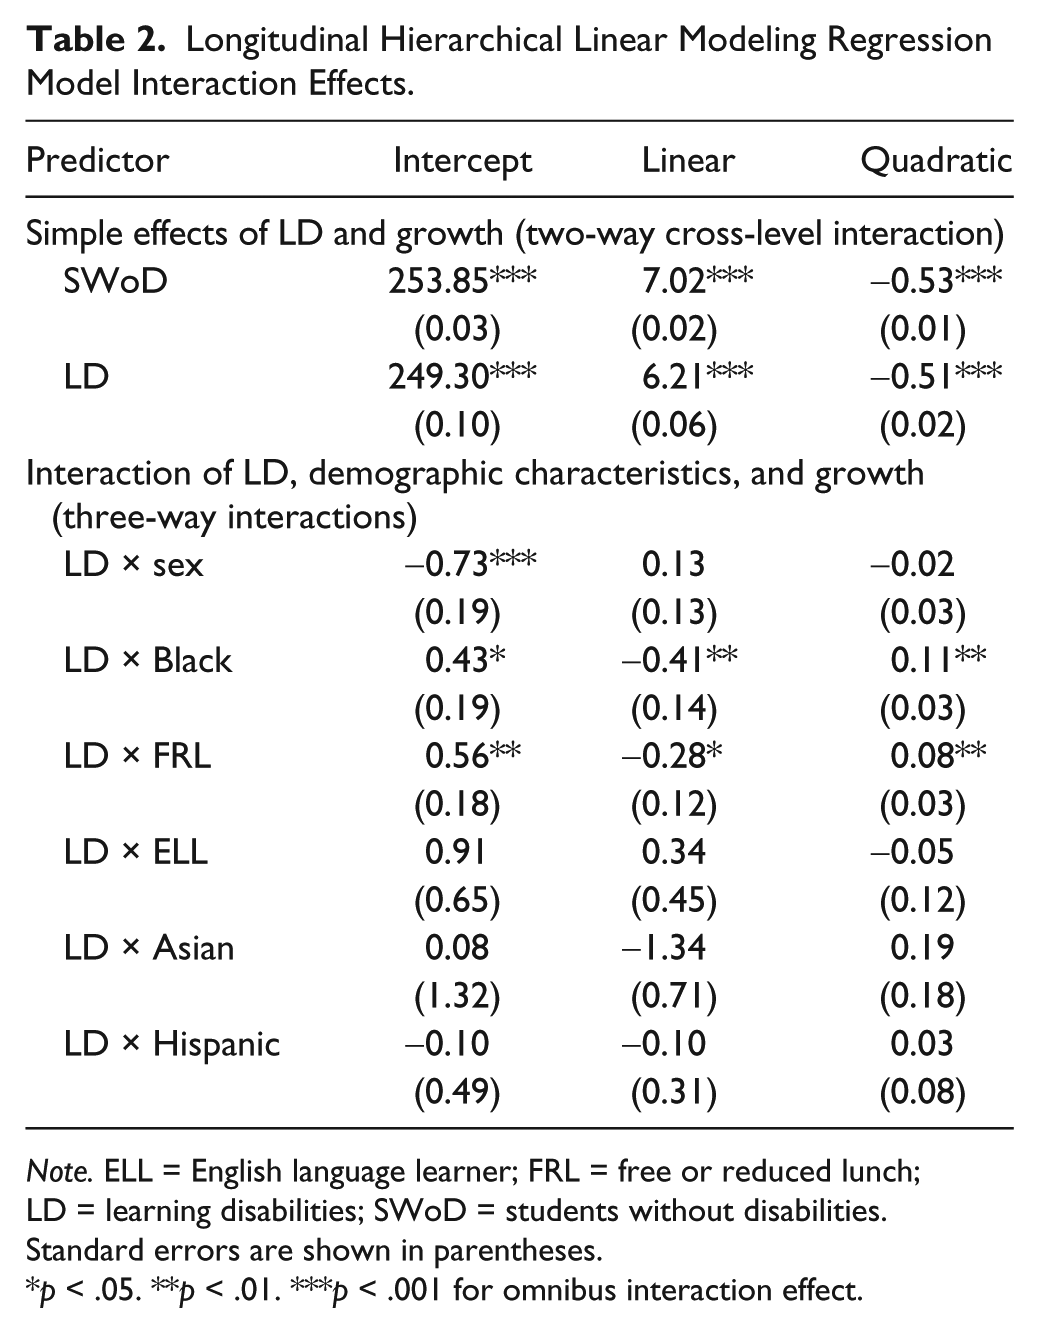
Note. ELL = English language learner; FRL = free or reduced lunch; LD = learning disabilities; SWoD = students without disabilities. Standard errors are shown in parentheses.
p < .05. **p < .01. ***p < .001 for omnibus interaction effect.
Empirical Bayes Estimated Mathematics Scale Score Means by Student Group and Grade for Statistically Significant Interactions (Total N = 79,554).
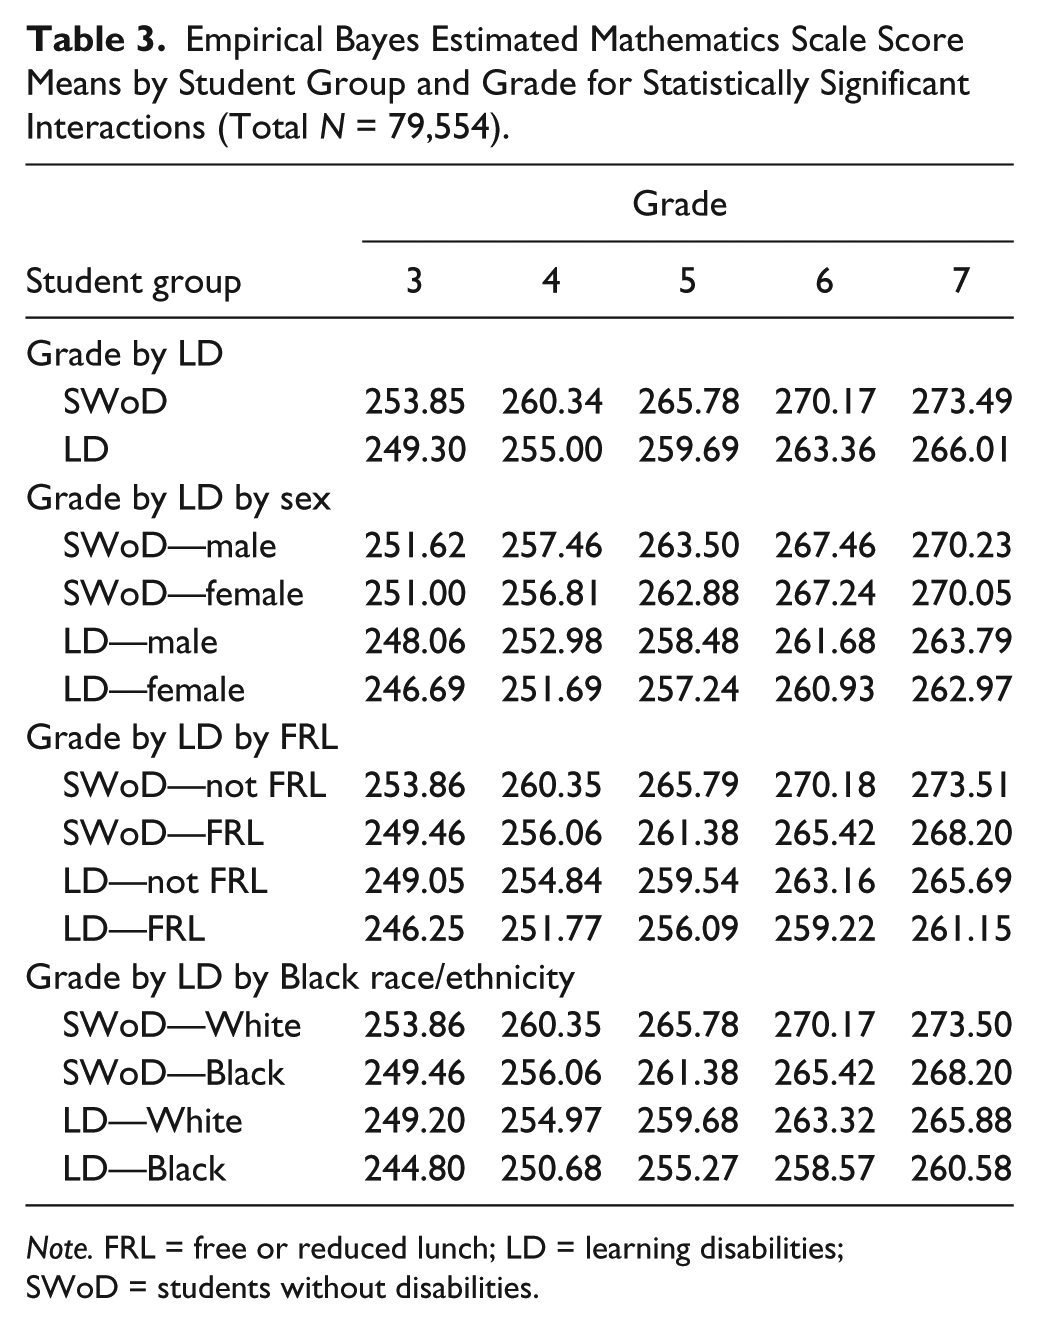
Note. FRL = free or reduced lunch; LD = learning disabilities; SWoD = students without disabilities.
Three-way interactions of growth, LD, and demographic characteristics
We next examined growth of LD and SWoD students as a function of interactions with other student characteristics that served as moderators. The lower portion of Table 2 shows the results of these analyses. When an interaction was significant, we conducted post hoc tests to determine the specific comparisons that were significantly different. Empirical Bayes estimates of mean mathematics achievement for the significant interactions are shown in the lower portion of Table 3 for each student subgroup by grade.
Three of the interaction effects tested were not statistically significant and did not result in reductions in unexplained variance: the interactions of LD by ELL, χ2(3) = 3.76, p = .287; LD by Asian race/ethnicity, χ2(3) = 4.88, p = .179; and LD by Hispanic race/ethnicity, χ2(3) = 0.33, p > .500 (see Note 3).
LD × Sex × Grade interaction
The LD by sex interaction was a statistically significant predictor of Grade 3 achievement only (intercepts only; z = −0.73, SE = 0.19, p < .001). Differences among the four LD by sex groups at Grade 3 were tested using a Bonferroni-adjusted p value. All six possible comparisons were statistically significant with the smallest difference in intercepts (ψ = 0.63, d = 0.09) occurring between the SWoD-male and SWoD-female groups and the largest difference (ψ = 5.25, d = 0.75) between the SWoD-male and the LD-female groups.
LD × FRL × Grade interaction
Addition of the LD by FRL by grade interaction resulted in a significant reduction in unexplained variance for the model as a whole, χ2(3) = 13.40, p = .004, in comparison to the LD and demographics model. We then conducted post hoc tests to examine differences among the four LD by FRL groups. Each group’s estimated growth trajectory is shown in Table 3 and displayed in the left panel of Figure 2. All four trajectories for both students with LD and SWoD showed significant growth as well as significant deceleration over grades. We then tested the pairwise differences among the four groups in their growth trajectories at each individual grade. In essence, this represents vertical comparisons of groups at each grade in the left panel of Figure 2. All pairwise differences between the four groups were statistically significant at all five grades (Bonferroni-adjusted p < .008). The largest difference was between the SWoD-not FRL versus the LD-FRL groups in Grade 7, ψ = 12.23, which represented a large effect size (d = 1.21).
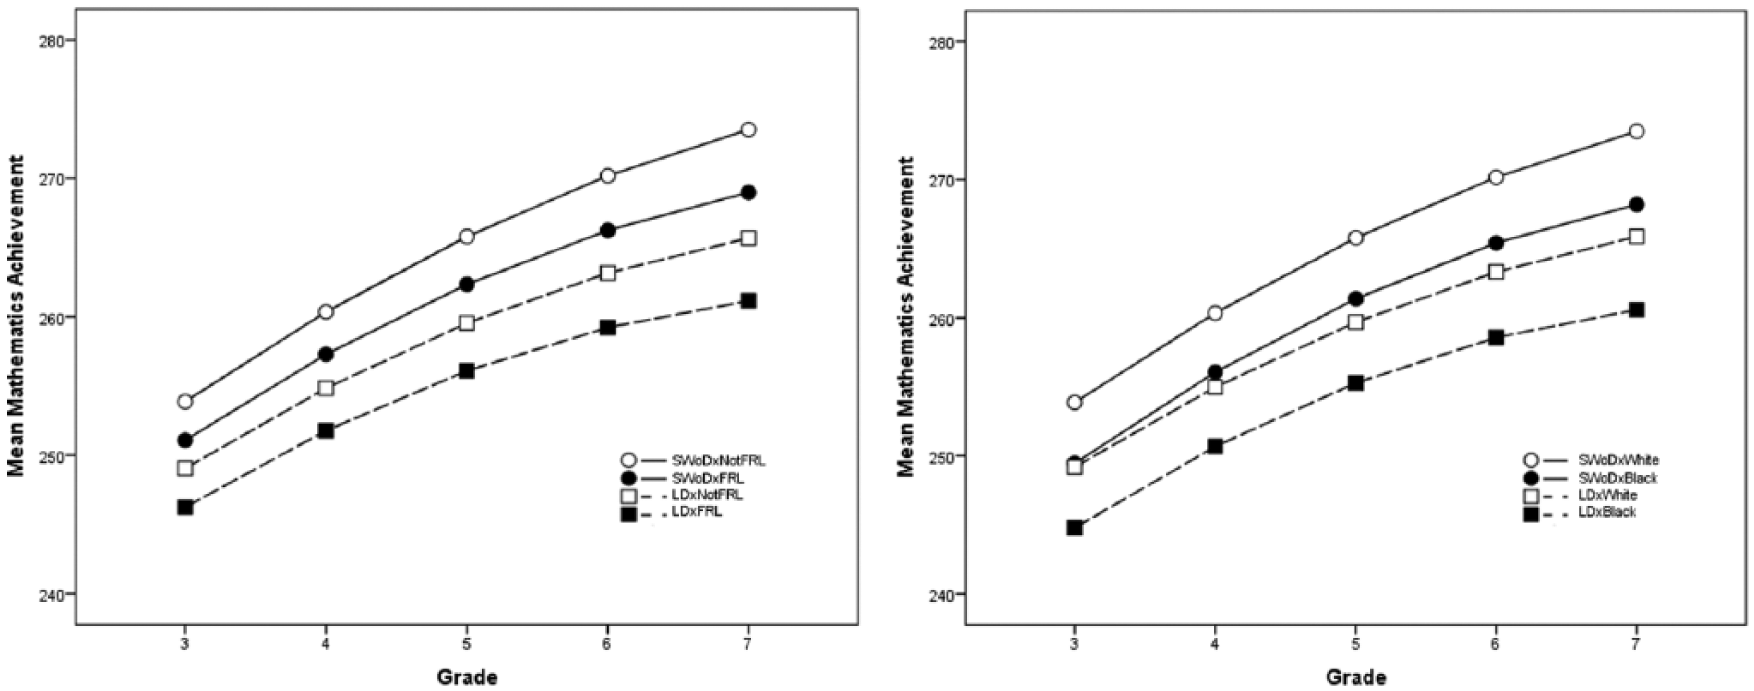
Three-way interaction effects with the learning disabilities (LD) × free or reduced lunch (FRL) × grade interaction on the left and the LD × Black race/ethnicity × grade interaction on the right.
LD × Black × Grade interaction
The three-way interaction of LD by Black race/ethnicity by grade was also statistically significant for all Level 1 growth parameters (intercept, slope, curvature) and resulted in a significant reduction in unexplained model variance, χ2(3) = 11.69, p = .009. We then tested the differences among the mathematics growth trajectories for each of the four Black versus White race/ethnicity by LD groups. Each group’s mean estimated growth trajectory is shown in Table 3 and displayed in the right panel of Figure 2. All trajectories showed significant growth and significant deceleration over grades. We also examined differences between the four race/ethnicity by LD groups at each grade and found that all differences between the four groups were statistically significant at all five grades except for the difference between the SWoD-Black group versus the LD-White group at Grade 3 (see the right panel of Figure 2). The largest difference was between the SWoD-White and LD-Black groups in Grade 7 (ψ = 12.92), which represented a large effect size (d = 1.29).
Discussion
Mathematics achievement growth and gaps in performance among disaggregated student subgroups are of central importance in federal policy and educational reform efforts (Bloom et al., 2008; Reardon et al., 2013) and one of the subgroups of greatest concern is special education students (Eckes & Swando, 2009). Like a number of other recent studies (e.g., Morgan et al., 2008), the goal of our research was not to test a particular developmental model thought to cause the Matthew effect or explain the etiology of mathematics difficulties. Rather we sought to identify and describe those subgroups of students with LD who are particularly at risk of lower mathematics performance and who are most likely to demonstrate increasing achievement gaps over time. Despite the import of such gaps for policy and practice, there have been almost no studies that model interaction effects or directly test the specifics of how SWD and SWoD students differ as a function of other student characteristics. Although there is a growing literature on the achievement growth of SWD and SWoD students in reading and mathematics, all of these studies report the partial, unconditional relationships between SWD status and student demographic characteristics (e.g., Morgan et al., 2009; Wei et al., 2013). Most of these studies also use multilevel modeling methods, yet none have fully tested and interpreted either cross-level interactions or interactive relationships among focal and moderator variables. As a result, our knowledge of the way that demographic characteristics moderate the effects of being a SWD on mathematics achievement growth is incomplete. The present study provided valuable information on interactions in mathematics growth trajectories for students on a statewide test used for accountability reporting. Explicit testing and interpretation of cross-level interactions and the inclusion, testing, and exploration of interaction terms in the current study provided additional information over previous research and some findings from direct interaction testing that differ substantially from conclusions drawn in other studies.
Major Study Findings in Relation to Previous Research
Using multilevel models, we found that mathematics achievement growth over Grades 3 to 7 was best represented as a curvilinear function with achievement growth decelerating over time although the rate of curvature in scale score units was quite small (0.53 points per year, about 0.07 of a standard deviation) and the percentage of variance explained by the curvature term (1%) also was small. These results agree with other recent studies (Bloom et al., 2008; Morgan et al., 2009, 2011; Wei et al., 2013) that all reported curvilinear mathematics growth. Also consistent with other studies (Judge & Watson, 2011; Morgan et al., 2011) were findings that there were significant differences between SWoD and LD students in initial mathematics performance in early grades and in the rate of growth across grades.
We included demographic characteristics of students as additional predictors of mathematics growth and found statistically significant differences in mathematics performance as a function of sex, race/ethnicity, FRL, and language proficiency with male, White, no lunch subsidy, and native English speakers performing higher. These partial regression results are consistent with a large body of research that establishes relationships of these student characteristics with student achievement (V. E. Lee & Burkam, 2002; Tate, 1997). However, after direct testing of interaction effects we found substantially different results. Commonly reported partial effect differences for ELL, Asian, and Hispanic students were no longer statistically significant when directly tested as interaction effects. That is, the performance LD students did not change on the basis of these characteristics.
In contrast, through interaction testing, we found that LD-SWoD differences in intercepts were moderated by student sex with the SWoD-male and the LD-female groups showing the largest difference in performance. Black race/ethnicity and FRL status moderated LD-SWoD differences for intercepts, slopes, and curvature of growth trajectories. Further exploration of these effects showed that all subgroups showed significant growth over grades, but growth was largest for SWoD-White or SWoD-not FRL students and smallest for LD-Black or LD-FRL students. These results provided a more detailed account of the mathematics growth of specific demographic subgroups of students with LD than has been available in previous studies.
There is evidence that achievement gaps are already evident at Grade 3 on state-mandated accountability tests (V. E. Lee & Burkam, 2002). However, results conflict on the stability of the mathematics achievement gap with some studies reporting widening of the gap for SWD (e.g., Judge & Watson, 2011; Morgan et al., 2011) and others reporting stability or decreases over time (e.g., Jordan et al., 2002). Our analyses showed significant differences between SWoD and students with LD at each grade and a notable increase in the gap over time from an effect size of about 0.66 in Grade 3 to 0.75 in Grade 7. It is also noteworthy that use of partial regression results would result in a substantial underestimation of the size of the achievement gap between SWoD and specific subgroups of students with LD. The LD partial effect growth trajectory shown in Figure 1 is very similar to the growth trajectory for the LD-White students in the interaction effect results shown in the right panel of Figure 2. The partial regression results suggested an achievement gap between SWoD students (who were also white, not FRL, English-speaking) and FRL students of 0.54, Black students of 0.64, and LD students of 0.90 standard deviation units. However, these partial effects substantially underestimate the achievement gaps that result from directly testing interactions: 1.56 standard deviations for students who are both LD and Black or 1.49 standard deviations for students who are both LD and FRL. As can be seen by comparing the partial growth trajectories in Figure 1 to the interaction trajectories in Figure 2, more substantial gaps in the performance of specific LD subgroups is “averaged out” in the estimates from partial regression analysis.
It should also be noted that differences in findings across studies of achievement growth for different student groups may be due to misinterpretation of partial effects as moderating effects, differences in which predictors are included in models (and therefore what is partialled), reliance on descriptive inspection or visual analysis to interpret results, making comparisons across scales that do not possess interval-level measurement properties (Ho & Reardon, 2012), and the failure to use empirical methods (i.e., effect size measures) to describe the magnitude of group differences. Greater attention to these issues may lead to better understanding of group differences and greater agreement in study findings that describe academic achievement gaps.
Limitations
A number of limitations in the present study should be noted. First, we did not have available a more comprehensive set of student and family characteristics that may be related to academic achievement (e.g., resources in the home, income level, family stability). Our results also may be limited by case exclusions for missing values on predictor variables. Some attrition of the sample occurred over time, although the rate in the present study (approximately 4% per year) was modest. It is also worth noting that, due to large sample size, small differences between groups in this study were statistically significant, but may not be substantively important. To contextualize this issue we reported effect sizes to provide additional information.
The current study examined the mathematics growth of students with LD using a statewide accountability test and school identification as a student with an LD. Use of an operational state accountability test and state-implemented (versus researcher-implemented) LD identification procedures provides substantial ecological validity but may limit generalization of the study findings, given variations in state mathematics standards, large-scale assessment programs, and LD eligibility criteria (e.g., a more stringent discrepancy criterion or response to intervention model for identifying students with LD).
In addition, the study treated students with LD as a unitary group, regardless of whether the student had been identified as having a disability in mathematics, reading, or another academic area. This aspect of our methodology is in keeping with several other studies of mathematics growth in students with LD (e.g., Judge & Watson, 2011; Morgan et al., 2011; Wei et al., 2013), but may have masked differences in achievement growth for students identified with a specific LD in mathematics, those with comorbid reading and mathematics LD, and those with reading disabilities. Although the present study and others (e.g., Cirino et al., 2015; Wei et al., 2013) confirm that students with LD in any academic area are at substantial risk of low mathematics achievement, the specific cognitive deficits underlying the mathematics difficulties may be different by LD subgroup. For example, Cirino et al. (2015) examined different subgroups of students with LD and found that students with mathematics LD or comorbid mathematics and reading LD had greater difficulties with processing speed, nonverbal reasoning, and most skill areas in mathematics (e.g., basic facts, word problems) than students who were LD in reading only.
Conclusions and Future Directions
Our findings of significant, decelerating mathematics achievement growth of LD and SWoD students over grades were consistent with previously published research and we also extended a small number of studies examining mathematics achievement growth for students with LD and the relationship of achievement to student demographic characteristics. Unlike previous research, however, the present study directly tested interaction effects and cross-level interactions and found that growth model parameters were moderated only by student sex, FRL status, and Black race/ethnicity.
Our study also empirically examined the achievement gap between LD and SWoD students at each individual grade and found a significant, increasing achievement gap over Grades 3 to 7 from about 4.5 to 7.5 scale score points (d = 0.90) for LD students overall, from about 9 to 13 scale score points (d = 1.56) for LD-Black students, and from about 7.6 to 12.4 scale score points for LD-FRL students (d = 1.49). Despite policy goals of closing achievement gaps, the empirical evidence on student growth has not reliably indicated progress (Hedges & Nowell, 1999; Reardon et al., 2013) and results of the present study showed that the gap between students with LD and SWoD students increased over grades and may be substantially larger for certain LD subgroups than reported in previous studies.
There are a number of important implications of our findings for researchers, practitioners and policy makers. Our study demonstrated that students who are members of two or more at-risk subgroups may be especially in jeopardy for lower mathematics achievement throughout their early school years. To effectively identify those students most in need of intervention to close achievement gaps, it is important that future researchers clearly test and explore interaction effects for specific student subgroups. The averaging over other moderator groups that occurs with partial regression effects may mask important subgroup differences as demonstrated in this study. In the absence of careful interpretation of partial regression results or explicit testing of interaction effects, practitioners and policy-makers may be misled about the student subgroups that are most at risk for learning difficulties and most in need of intervention.
From a practice standpoint, more fully understanding and intervening to address the factors that disadvantage students, especially those who are from low-income, minority families (Jordan & Levine, 2009; Morgan, Farkas, Hillemeier, & Maczuga, 2012; Siegler, 2009), is important. Given differential access in early childhood to mathematics experiences (Siegler, 2009), poor and ethnic minority students are more likely to enter school with lower mathematics skills (Fryer & Levitt, 2004; Morgan et al., 2009), and then more likely to attend poorer schools where they experience less time spent on mathematics instruction and lower quality core instruction in mathematics (Desimone & Long, 2010; Fryer & Levitt, 2004). This lack of access to high-quality preschool and early elementary mathematics programs may explain the greater initial impairment in third grade and slower mathematics growth seen in poor and Black students identified as LD in the present study. If this is the case, it argues for stronger core mathematics instruction and targeted mathematics interventions in the early grades, particularly in high poverty schools (Fuchs et al., 2005; Fuchs, Fuchs, & Compton, 2012; Gersten et al., 2009; Morgan, Farkas, & Maczuga, 2015).
However, another important factor contributing to the markedly poorer mathematics outcomes for students who are both LD and Black in the present study may be that ethnic minority students experiencing significant academic difficulties were less likely to receive LD services. When controlling for potential confounding variables such as age, low birth weight, SES, prior achievement, and self-regulatory variables, some studies have found that minority students were less likely than otherwise similar White children to be identified as having an LD (Hibel, Farkas, & Morgan, 2010; Morgan, Farkas, Hillemeier, et al., 2015). Lower LD placement rates for students who are ethnic minorities in the face of similar needs would likely result in a more impaired group of students who are both LD and Black. In addition to stronger core mathematics instruction and targeted interventions prior to referral, this explanation would argue for more special education referral procedures that ensure ethnic minority students are granted the same access to special education as White students (Morgan, Farkas, Hillemeier, et al., 2015) and attention to ensure that those students with the greatest need are afforded more intensive or differently designed intervention strategies once they are identified for special education (Bryant, Kim, Hartman, & Bryant, 2006; Jordan & Levine, 2009; Morgan et al., 2009).
Footnotes
Appendix
Declaration of Conflicting Interests
The author(s) declared no potential conflicts of interest with respect to the research, authorship, and/or publication of this article.
Funding
The author(s) disclosed receipt of the following financial support for the research, authorship, and/or publication of this article: This research was funded in part by a Cooperative Service Agreement from the Institute of Education Sciences (IES) establishing the National Center on Assessment and Accountability for Special Education (NCAASE; PR/Award Number R324C110004); the findings and conclusions expressed do not necessarily represent the views or opinions of the U.S. Department of Education.