




Abstract
The purpose of this study was to examine the amount of attention devoted to data-based decision-making in Curriculum-Based Measurement (CBM) professional development materials. Sixty-nine CBM instructional sources were reviewed, including 45 presentations, 22 manuals, and two books. The content of the presentations and manuals/books was coded into one of four categories: (a) general CBM information, (b) conducting CBM, (c) data-based decision-making, and (d) other. Results revealed that only a small proportion of information in the CBM instructional materials was devoted to data-based decision-making (12% for presentations and 14% for manuals/books), and that this proportion was significantly smaller than (a) that devoted to other instructional topics, (b) that expected were information to be equally distributed across major instructional topics, and (c) that recommended by experienced CBM trainers. Results suggest a need for increased attention to data-based decision-making in CBM professional development.
In 2017, the U.S. Supreme Court ruled on Endrew F. v. Douglas County School District, defining “appropriate” educational programs as programs that enable students with disabilities to make progress (see Sayeski et al., 2019; Yell & Bateman, 2019). The Endrew ruling highlighted the importance of progress monitoring and of using data to evaluate the effects of instructional programs on student progress toward Individualized Education Program (IEP) goals (Sayeski et al., 2019; Yell & Bateman, 2019). Within the field of learning disabilities (LD), the Endrew ruling intensified calls for intensive, data-driven, individualized instruction for students with LD (see Lemons et al., 2018). Such instruction, often referred to as Data-Based Individualization (DBI) or Data-Based Decision-Making (DBDM; see Danielson & Rosenquist, 2014; Deno & Mirkin, 1977; Jenkins & Fuchs, 2012), has been shown to lead to improved academic performance for students with LD, with reported effect sizes ranging from 0.24 to 0.38 (Filderman et al., 2018; Jung et al., 2018; see also Fuchs et al., 2020).
An essential component of DBI is the systematic use of data to track progress of students with LD and to determine their response to instruction. One progress-monitoring system ideally suited for use within DBI is Curriculum-Based Measurement (CBM). CBM involves frequent, repeated measurement of student progress toward long-range instructional goals (Deno, 1985). CBM scores are placed on progress graphs, and the graphs are used to guide teacher decision-making. When the data reveal that the student’s progress is lower than expected, the teacher adjusts instruction; when the data reveal that the student’s progress is greater than expected, the teacher raises the goal.
Teachers who make instructional and goal adjustments in response to CBM data effect greater student achievement for students with or at risk of LD than teachers who do not make such adjustments (e.g., Fuchs & Fuchs, 1989; Fuchs et al., 1989, 2020; Stecker et al., 2005). Regrettably, teachers often do not make instructional and goal adjustments in response to CBM data (Fuchs et al., 2020; Stecker et al., 2005), diminishing the potential for CBM to promote high-quality, individualized instructional programming for students with or at risk of LD.
The reasons for teachers’ lack of response to the data are not clear, but two potential reasons have been discussed in the literature: (a) teachers do not know how to read and interpret CBM graphs, and (b) teachers do not know how or what to adjust in their instruction. A third potential reason, and one that has received little attention in the literature, is that teachers do not receive sufficient instruction on the data-based decision-making aspects of CBM. We review each of these reasons in turn.
Teachers Do Not Know How to Read/Interpret CBM Graphs
One potential reason for teachers’ nonresponse to CBM progress data is that they do not know how to read and interpret the CBM graphs. To use CBM data to guide instructional decision-making, teachers must be able comprehend—that is, to read and interpret—CBM graphed data (Espin et al., 2017).
On the face of it, CBM graphs seem easy to comprehend. They are designed to be simple, clear, and easy to understand (Deno, 1985, 2003); yet, graph comprehension in general can be challenging (see Friel et al., 2001; Kratochwill et al., 2014), and CBM graph comprehension is no different (Espin et al., 2017; van den Bosch et al., 2017; Wagner et al., 2017; Zeuch et al., 2017). For example, van den Bosch and colleagues found that teachers’ description of CBM progress graphs were less complete and coherent than those of CBM and educational assessment experts (van den Bosch et al., 2017), and that teachers inspected CBM graphs in a less logical, sequential manner and devoted less attention to relevant parts of the graph, than did a CBM expert (van den Bosch et al., in press).
Van den Bosch et al. (2017) identified two aspects of CBM graph comprehension that were particularly challenging for teachers: (a) interpreting the relations between graph elements—for example, comparing the data in one phase with the data in an adjacent phase, and (b) linking the data to instruction—for example, recognizing that a flat slope indicates a lack of growth and a need to adjust instruction (van den Bosch et al., 2017). These aspects of CBM graph comprehension are essential to using CBM data to effectively guide instructional decision-making for students with LD. Teachers may need specific, directed instruction in interpreting CBM graphs and linking the data to instruction to become effective data-based decision-makers.
Teachers Do Not Know How or What to Adjust in Their Instruction
A second potential reason for teachers’ nonresponse to CBM progress data is that they do not know how or what to adjust in their instruction when students do not progress. Fuchs and colleagues addressed this problem in the 1980s and 1990s by developing computer supports that assisted teachers in determining how and what to adjust in their instruction when students did not progress (see Fuchs & Fuchs, 1989, 2002; Fuchs et al., 1994, 2007, 2020; Stecker et al., 2005). These supports included diagnostic skills analyses that provided teachers with information about skills that students had or had not mastered, and an expert systems analysis that provided teachers with recommendations for alternative strategies for teaching. The addition of computer supports improved teachers’ ability to design targeted interventions and to implement a wide variety of instructional strategies and methods, which, in turn, improved student achievement (see Fuchs & Fuchs, 1989, 2002; Fuchs et al., 2020; Jung et al., 2018; Stecker et al., 2005).
Although the external supports developed by Fuchs and colleagues helped teachers to improve their data-based decision-making, the teacher remained an essential part of the decision-making process (Fuchs & Fuchs, 1989; Stecker et al., 2005). This point was illustrated in a recent large-scale evaluation of data-driven instruction (DDI) in general education (Gleason et al., 2019). Gleason et al. (2019) found that data-use supports alone did not lead to changes in teachers’ instructional practice or improvements in student achievement, and concluded that teachers needed instruction on how to use data to identify and implement effective instructional practices.
Teachers Do Not Receive Sufficient Instruction on the Data-Based Decision-Making Aspects of CBM
A third potential reason for teachers’ nonresponse to CBM progress data, and one that has received little attention in the literature, is that teachers do not receive sufficient instruction on the data-based decision-making aspects of CBM, that is, on reading and interpreting CBM graphs, linking the data to instruction, and identifying, selecting, and implementing effective instructional adjustments.
Earlier we suggested that teachers need directed, guided instruction to successfully read and interpret CBM graphs and to determine how and what to adjust in their instruction (see also Gesel et al., 2020; Wagner et al., 2017). A similar argument was made by Wayman and Jimerson (2014), who emphasized the need for general education teachers to receive professional training in data use for effective DDI implementation. Supporting this argument, van Kuijk et al. (2016) demonstrated that professional development that targeted teachers’ goal-setting, data use, and instruction led to improvements in their students’ reading comprehension. Specific to CBM, van den Bosch et al. (2019) found that directed, guided instruction in CBM graph comprehension led to improvements in teachers’ ability to interpret CBM data and link it to instruction; however, the authors questioned the extent to which such instruction was typically included in CBM professional development training.
Purpose of the Study and Research Questions
In sum, research has suggested that to become effective data-based decision-makers, teachers need direct, guided instruction in the data-based decision-making aspects of CBM. The question arises as to whether teachers receive such instruction in typical CBM professional development. The purpose of this study was to determine to what extent data-based decision-making is emphasized in CBM professional development materials. To address this question, we conducted a systematic review of CBM professional development materials, including presentations, manuals, and books, to determine to what extent data-based decision-making was emphasized in the materials. We compared the proportion of information devoted to data-based decision-making with that devoted to other aspects of CBM instruction. We also examined whether the proportion of information devoted to data-based decision-making differed from what would be expected if information were to be equally distributed across major instructional topics, and whether it differed from what would be recommended by experienced CBM trainers.
Three research questions were addressed in the study:
We tested the “null” hypotheses, that is, that the proportion of information devoted to data-based decision in CBM professional development materials would be equal to (a) that devoted to other major instructional topics, (b) that expected based on an equal distribution of information across major instructional topics, and (c) that recommended by experienced CBM trainers.
Method
Search and Selection Process
The search and selection process for CBM professional development materials (sources) consisted of three phases. In the first phase, an online search for materials was conducted. In the second phase, CBM trainers were contacted to request additional materials. In the third phase, a second online search was conducted. Each phase is described in the following sections.
To be included in the study, sources had to (a) focus specifically on CBM, and (b) focus on teaching participants how to conduct or implement CBM. CBM was defined as a procedure for repeated measurement of individual student growth toward long-range instructional goals using indicators of student performance that are collected, graphed, and used to evaluate the effects of instruction on individual student learning (see Deno, 1985, 2003).
Online searches were conducted via Google, ERIC (with specific links to sources within education), and the University library’s search system (with links to all library’s holdings, including more than eight million books, articles, and audio-visual materials, and to hundreds of databases). In addition, searches of specific websites focused on progress monitoring and LD were conducted, including AIMSweb, DIBELS, Intervention Central, EasyCBM, and TeachingLD.
Phase I: Initial search and selection
The initial online search was carried out in three steps. Two research assistants independently carried out each step, and at each step, results were merged. The first step was a preliminary search using the terms Curriculum-Based Measurement and CBM. This search yielded 26 sources that potentially met the criteria for inclusion. Based on these sources, a broader list of search terms was generated, and a second search was conducted using the terms General Outcome Measurement, Data-Based Instruction, Data-Based Decision-Making, Curriculum-Based Assessment, and Curriculum-Based Evaluation. This search yielded an additional 69 potential sources. Finally, search terms were combined with additional terms, including instruction, manuals, books, training, how to use, how to implement, trainers, teachers, and educators. This final step yielded an additional 10 potential sources, leading to a total of 105 identified sources in Phase I.
Identified sources were closely examined to determine whether they met the criteria for inclusion. Sources that focused solely on Curriculum-Based Assessment (CBA), Curriculum-Based Evaluation (CBE), or data-based decision-making in general were excluded. In addition, sources that merely described CBM, or focused solely on CBM research, were excluded. Of the 105 instructional sources identified, 30 met the criteria for inclusion: 10 articles, 13 presentations, five manuals, and two books.
Phase II: Survey of CBM researchers/trainers
In Phase II, a list with the selected sources was sent to 23 CBM authors from the identified sources. The authors were asked to review the list and identify missing sources. A reminder was sent if authors did not respond to the first request. Eleven authors responded, identifying an additional 78 sources. Of these, 32 met the criteria for inclusion: seven articles, 12 presentations, and 13 manuals.
In sum, across Phases I and II, a total of 183 potential instructional sources were identified. Of these, 62 met the criteria for inclusion: 17 articles, 25 presentations, 18 manuals, and two books (see Figure 1, top).
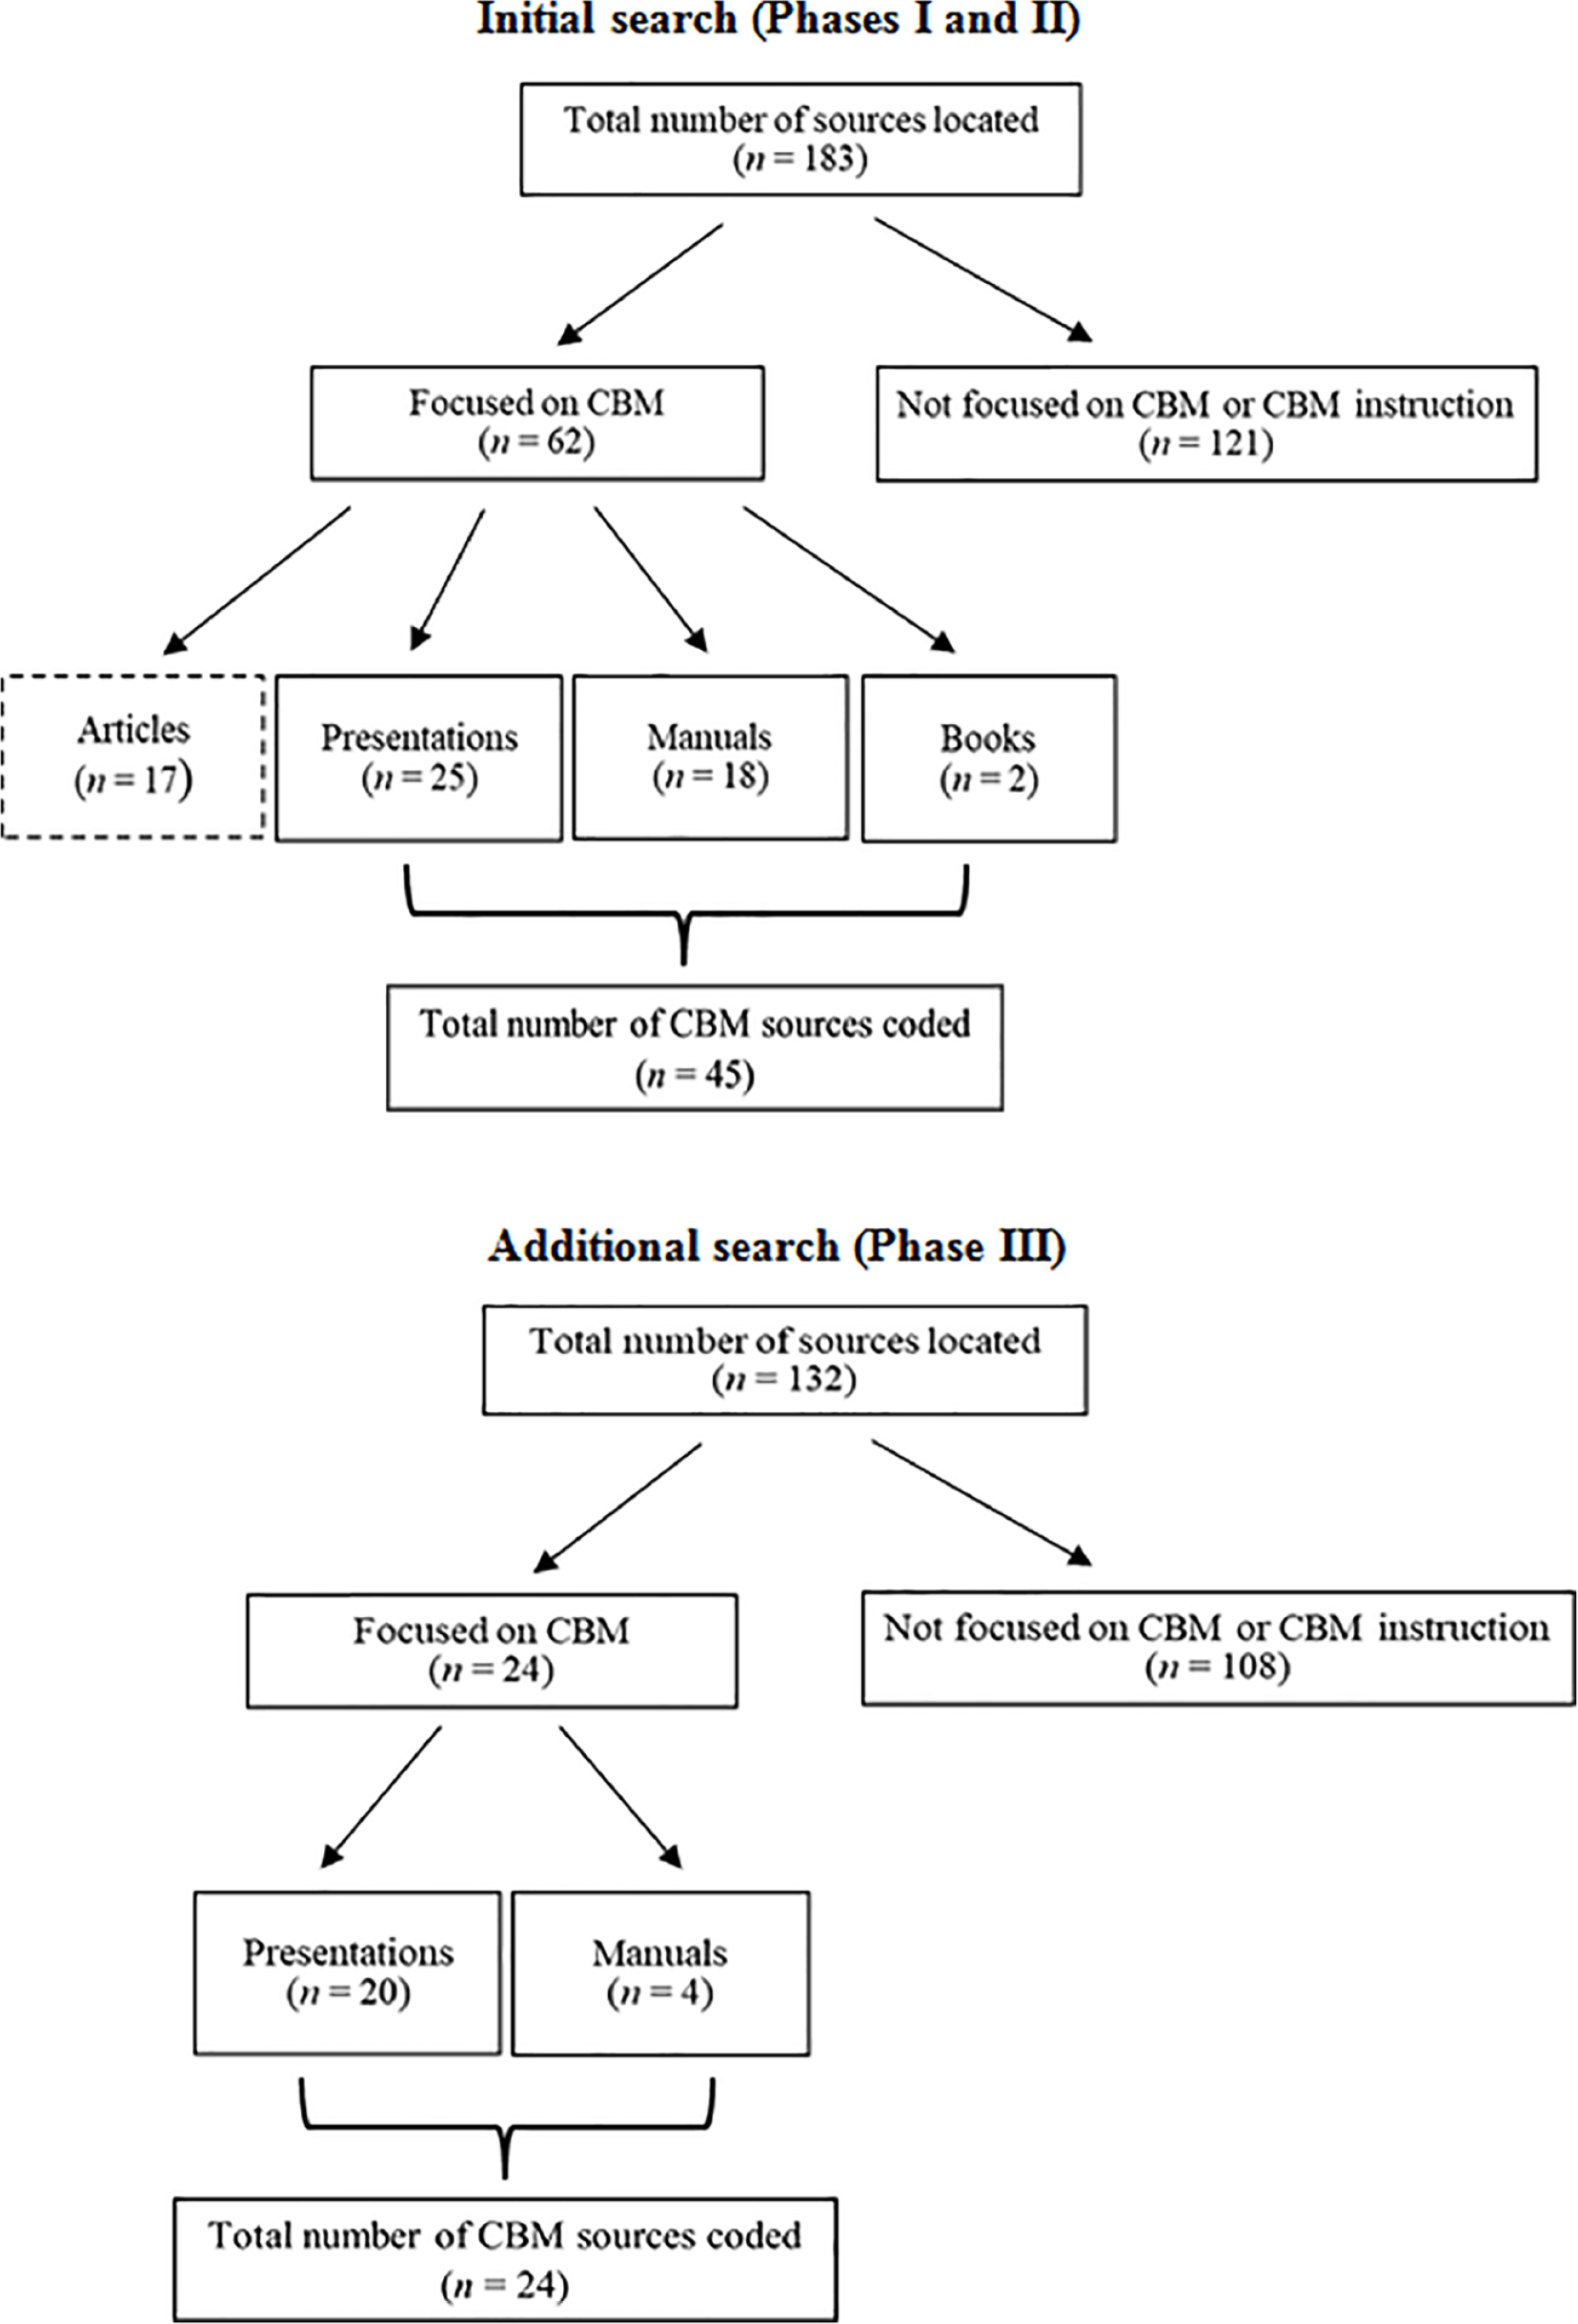
Search and selection process for CBM professional developmental materials.
After an initial review of the selected materials, a decision was made to drop the articles from the study (thus the dashed line around articles in Figure 1). This decision was made because the content and format of the articles were fundamentally different from that of the presentations, manuals, and books. The articles often interspersed information on CBM research with information on how to implement CBM and addressed multiple topics within paragraphs and sections. Coding the articles, thus, would have required counting the number of sentences and paragraphs (or words) rather than counting pages and fractions of pages and would have produced data that could not be combined with the data from the presentation, manuals, and books.
Phase III: Additional search
Between the time of the initial search and the coding and analysis of the data, the U.S. Supreme Court ruled on Endrew F. v. Douglas County School District (2017). Given the fact that the Endrew F. ruling might have influenced the number or content of CBM professional development sources posted online, the research team determined that an additional search was in order. The additional search was conducted using the same search terms and procedures as used in Phase I of the initial search, with the exception that the search was carried out by one research assistant. The second search led to the identification of 132 potential sources, 24 of which met the criteria for inclusion (20 presentations and four manuals; see Figure 1, bottom).
Summary of search results
In sum, across the three phases of the search and selection process, a total of 69 CBM professional development sources were selected for inclusion in the study: 45 presentations, 22 manuals, and two books. The selected sources spanned the years 1989 to 2019 (see Table 1). The majority of sources focused on reading (12 presentations and six manuals) or on a combination of academic areas (10 presentations and nine manuals/books; see Table 2). The sources included a total of 65 different authors or authoring organizations, with the large majority of authors listed on only one or two sources. Exceptions to this were T. Busch (four sources); L. Fuchs and D. Fuchs (four sources alone or in combination + two sources from the IRIS Center); M. R. Shinn and M. M. Shinn (nine sources alone or in combination + two sources from AIMSweb); P. Stecker (six sources); and J. Wright (four sources). Finally, there was one “superspreader” author: E. Lembke with 10 sources (for a complete list of included sources, see Table S1 in Supplemental Material).
Number of CBM Instructional Sources Across Year.
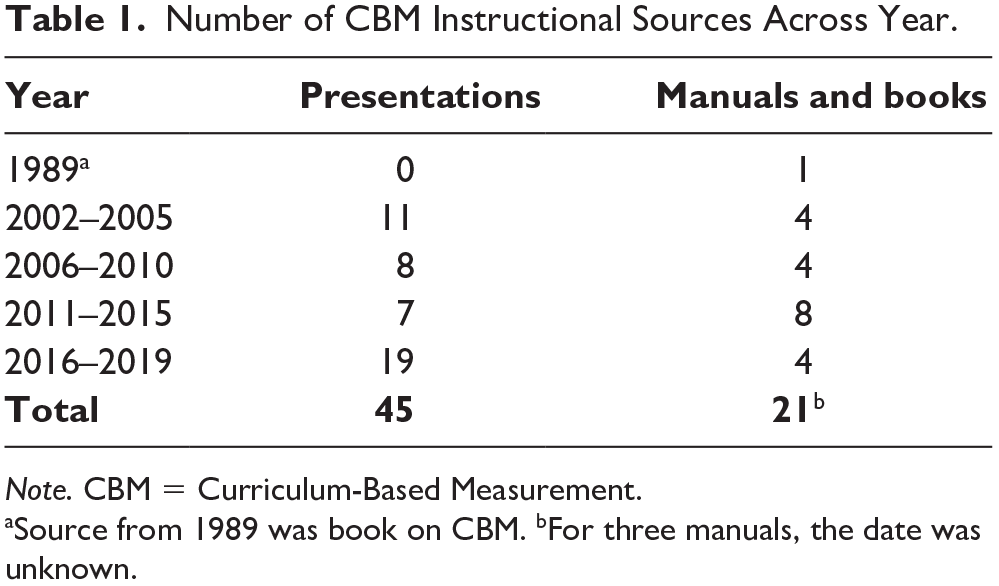
Note. CBM = Curriculum-Based Measurement.
Source from 1989 was book on CBM. bFor three manuals, the date was unknown.
Number of CBM Instructional Sources per Content Focus.
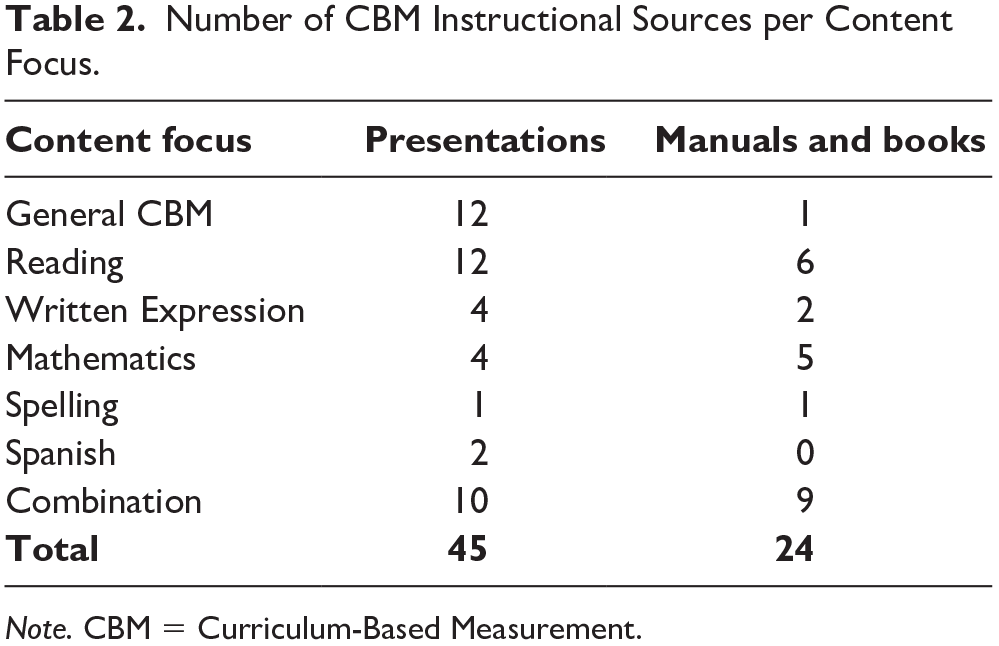
Note. CBM = Curriculum-Based Measurement.
Coding of CBM Instructional Materials
Development of coding system
An initial set of coding categories was developed based on the table of contents from the book The ABC’s of CBM (Hosp et al., 2016) and on the expertise of the lead researcher, who had 27 years of experience conducting research, teaching courses, and conducting professional development training on CBM. The initial codes were used to code a small number of presentations, after which the coding system was revised, and used to code a second set of presentations. The system was revised once more, and presentations that had been previously coded were recoded with the revised system.
The final coding system consisted of seven subcategories of instruction, which eventually were collapsed into four major categories for the analysis. The major categories and subcategories were (a) general CBM information, (b) conducting CBM (including collecting and graphing CBM data), (c) CBM data-based decision-making (including reading/interpreting CBM graphs and linking CBM data to instruction), and (d) other (including using CBM for screening and identification and use of technology for monitoring; see Table 3 for definitions of categories/subcategories). In addition, the year and the academic focus for each source were noted.
CBM Instructional Source Categories and Definitions.
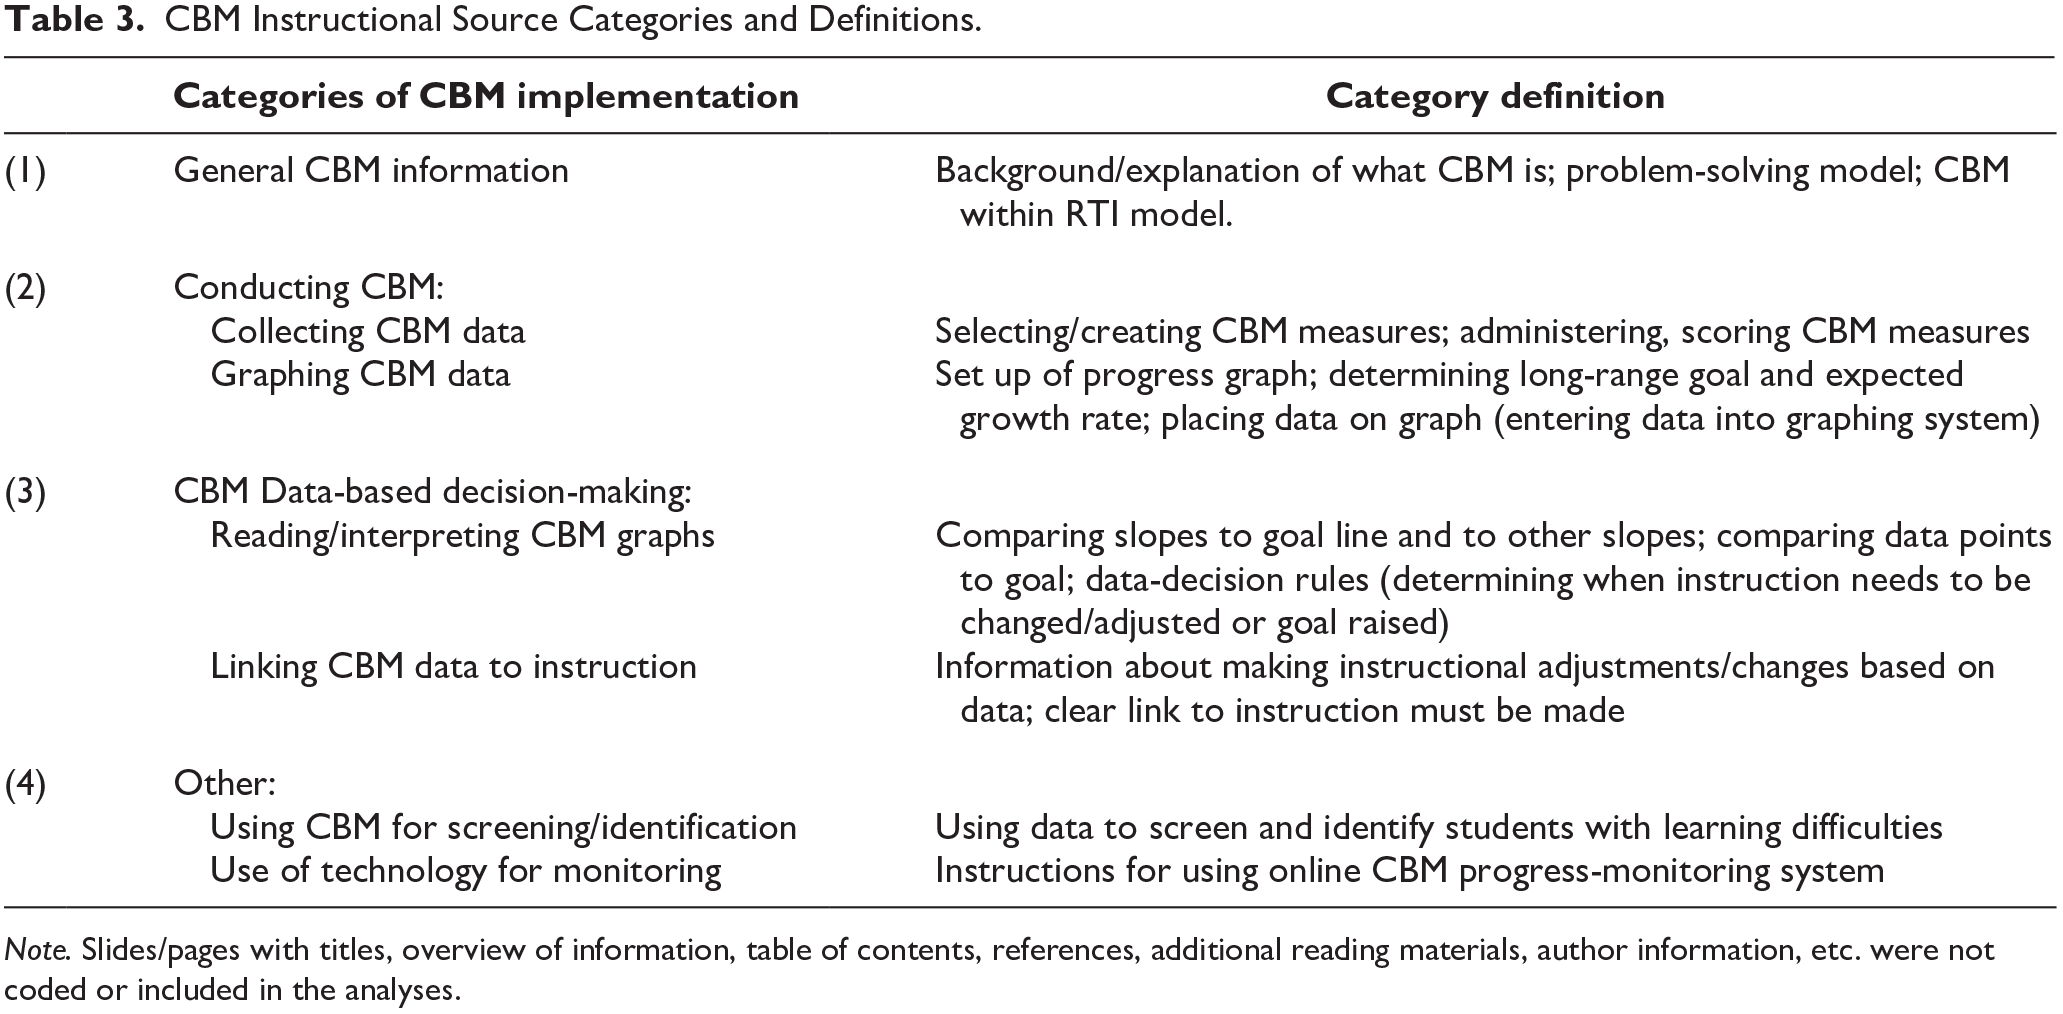
Note. Slides/pages with titles, overview of information, table of contents, references, additional reading materials, author information, etc. were not coded or included in the analyses.
Coding procedure
The content of each slide (for presentations) or page (for manuals/books) was assigned to one of the seven subcategories. Slides/pages that did not contain specific training content (title pages, table of contents, references, etc.) were not included in the coding or analysis.
Slides and pages were coded in terms of the approximate proportion of information devoted to a topic (subcategory). In the majority of cases, a slide or page addressed only one or two topics; only rarely were more than four topics addressed. Thus, the content of each slide/page was coded in terms of the approximate proportion of information devoted to the topic: 1, ½, ⅓ or ¼. To illustrate, if a slide addressed the topics collecting CBM data and reading/interpreting CBM graphs, and approximately a half of the slide was devoted to each topic, then half of the slide was coded for each category. On the rare occasion that a slide or page addressed more than four topics, the four predominate topics were assigned to the slide.
The presentations and manuals were double coded by two research assistants. Presentations were coded first and manuals second. Because the books included a large volume of material, they were coded last, and coding was completed by the research assistants and the lead researchers together.
Intercoder agreement
Intercoder agreement was calculated for presentations and manuals by dividing the number of slides/pages for which coders agreed by the total number of slides/pages coded. For example, if a page had three codes, an agreement was counted only if both coders had the same three codes in the same place for that page.
For the initial set of materials (identified during Phases I and II of the search process), intercoder agreement was calculated for all presentations, excluding those coded as a part of the development of the system. Agreement for the presentations was high; thus, for the manuals, agreement was coded for every third manual. Intercoder agreement for presentations was 96.31% (range = 88.6%–100%) and for manuals was 91.45% (range = 76.5%–100%). (Recall that the books were coded by the research team together).
For the materials gathered during the second search (Phase III), intercoder agreement was conducted for all identified sources. Intercoder agreement for the presentations was 82.02% (range = 67.9%–100%) and for the manuals was 85.91% (range = 77.3%–94.4%). For all coded materials, disagreements were discussed and resolved by the research team. If agreement for a source was below 80%, the entire source was discussed and recoded.
As a final step in the coding process, and to ensure consistency in coding across the two sets of identified materials (initial and additional search), the research assistant who had coded the second set of materials rechecked the coding of the initial set of materials. On the basis of this final check, a small number of changes in codes were made across the two sets of materials.
Recommendations of Experienced CBM Trainers
To address Research Question 3, we asked four experienced professional development trainers to give their recommendations regarding how much information should be devoted to data-based decision-making within CBM professional development instruction. The average number of CBM professional development trainings given across the four trainers was 75 per person. All four had been awarded federally funded grants, conducted research, and published articles on teachers’ use of CBM progress data to build effective instructional programs for students with or at risk of LD. The research of the four trainers spanned academic areas (reading, writing, mathematics, content-area learning) and age levels (elementary to secondary school). Eighteen of the sources reviewed had one or more of the experienced trainers as an author on the source.
The experienced trainers were provided with the definition of CBM used in the study and the definition of each of the four major instructional categories (general CBM information, conducting CBM, CBM data-based decision-making, and other). The trainers were then asked the following question: In your opinion, what percentage of CBM instruction should be devoted to each category to ensure that teachers effectively implement data-based instruction for students with severe and persistent learning difficulties? The trainers were asked to fill in a percentage for each of the four categories and were told that the percentages should total 100%. (Note the trainers were not asked to provide separate percentages for presentations and books/manuals.) Chi-square analysis revealed no significant differences in responses across the four trainers, χ2(9) = 0.51, p = 1; therefore, mean responses across the four trainers were used for the analyses.
Results
Descriptive Information
Detailed descriptive information regarding the proportion of instructional information devoted to each of the seven subcategories broken down by the three instructional sources is presented in Table 4. Each cell in the table displays three pieces of information: The top number is the number of presentations, manuals, or books that contained any information at all about the category. The second and third numbers are the number and percent of slides or pages within each instructional source devoted to the category. For example, for the presentations (first row in the table), 41 of 45 presentations included general CBM information, with a total of 511.25 slides (24.49%) devoted to the category.
Distribution of CBM Instructional Information across Seven Subcategories.
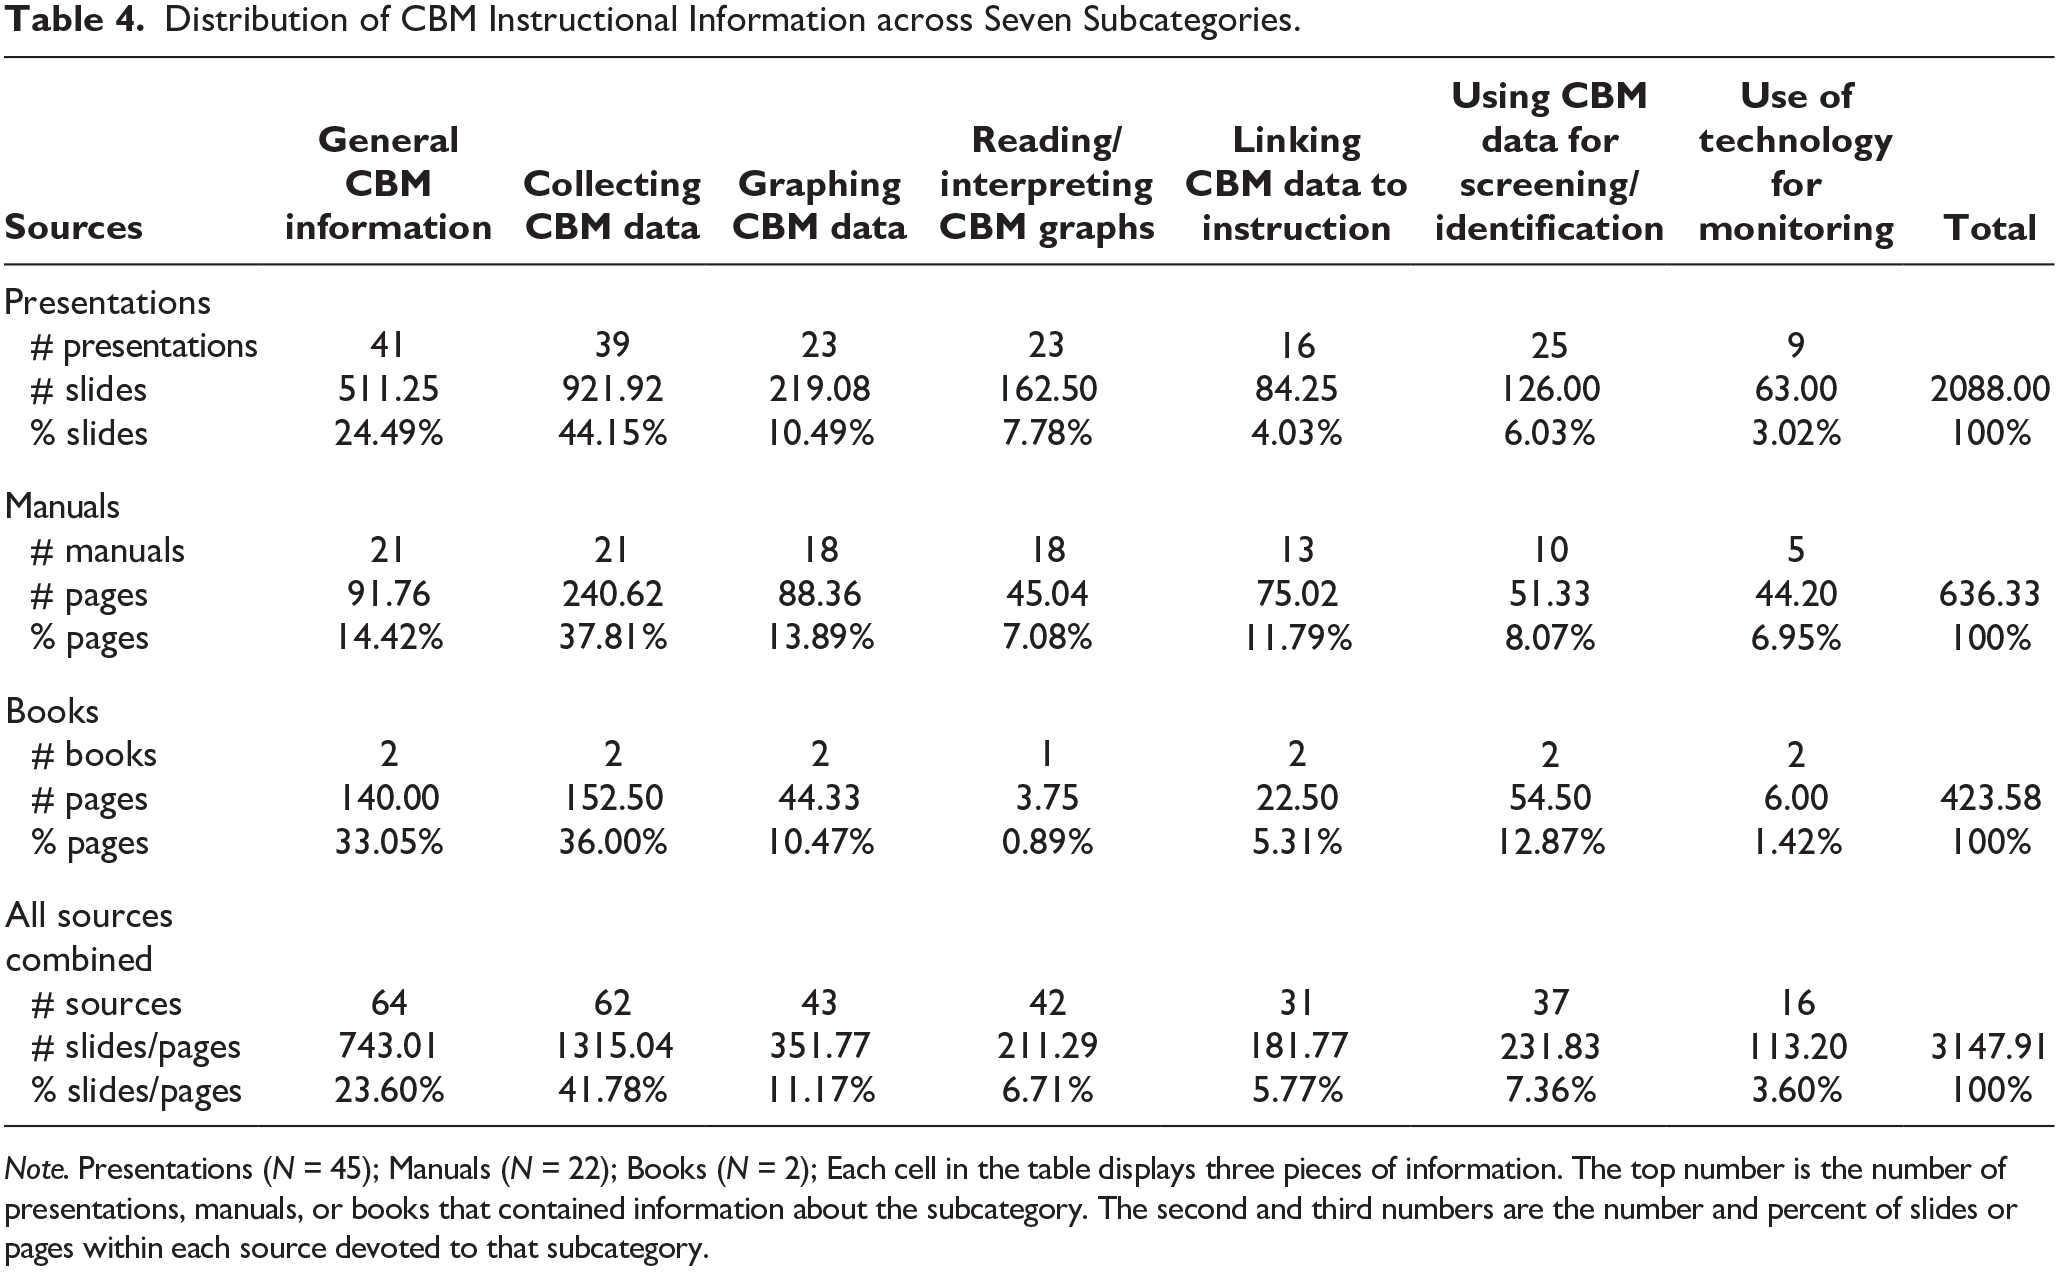
Note. Presentations (N = 45); Manuals (N = 22); Books (N = 2). Each cell in the table displays three pieces of information. The top number is the number of presentations, manuals, or books that contained information about the subcategory. The second and third numbers are the number and percent of slides or pages within each source devoted to that subcategory.
The data in the bottom row of Table 4 reveal that nearly all instructional sources included information about general CBM information (64 of 69) and about collecting CBM data (62 of 69), whereas fewer sources included information on the data-based decision-making aspects of CBM implementation, including reading/interpreting graphs (42 of 69) and linking CBM data to instruction (31 of 69). With regard to the percentage of slides/pages devoted to each category, across instructional sources, the largest proportion of information was devoted to collecting CBM data (approx. 42%). Much smaller proportions were devoted to reading/interpreting CBM graphs (approx. 7%) and to linking data to instruction (approx. 6%).
Preliminary Analysis
To address Research Questions 1 through 3, the data were collapsed into four major CBM categories. In addition, the data from manuals and books were combined because both provided CBM instruction in written form and both were coded in terms of pages or fractions of pages devoted to CBM categories. In the top section of Table 5, the amount of instructional information devoted to the four major CBM categories broken down by the two instructional sources is presented.
Distribution of CBM Instructional Information Across Four Major CBM Instructional Categories: Actual, Equal Distribution, and Experienced Trainers’ Recommendations.
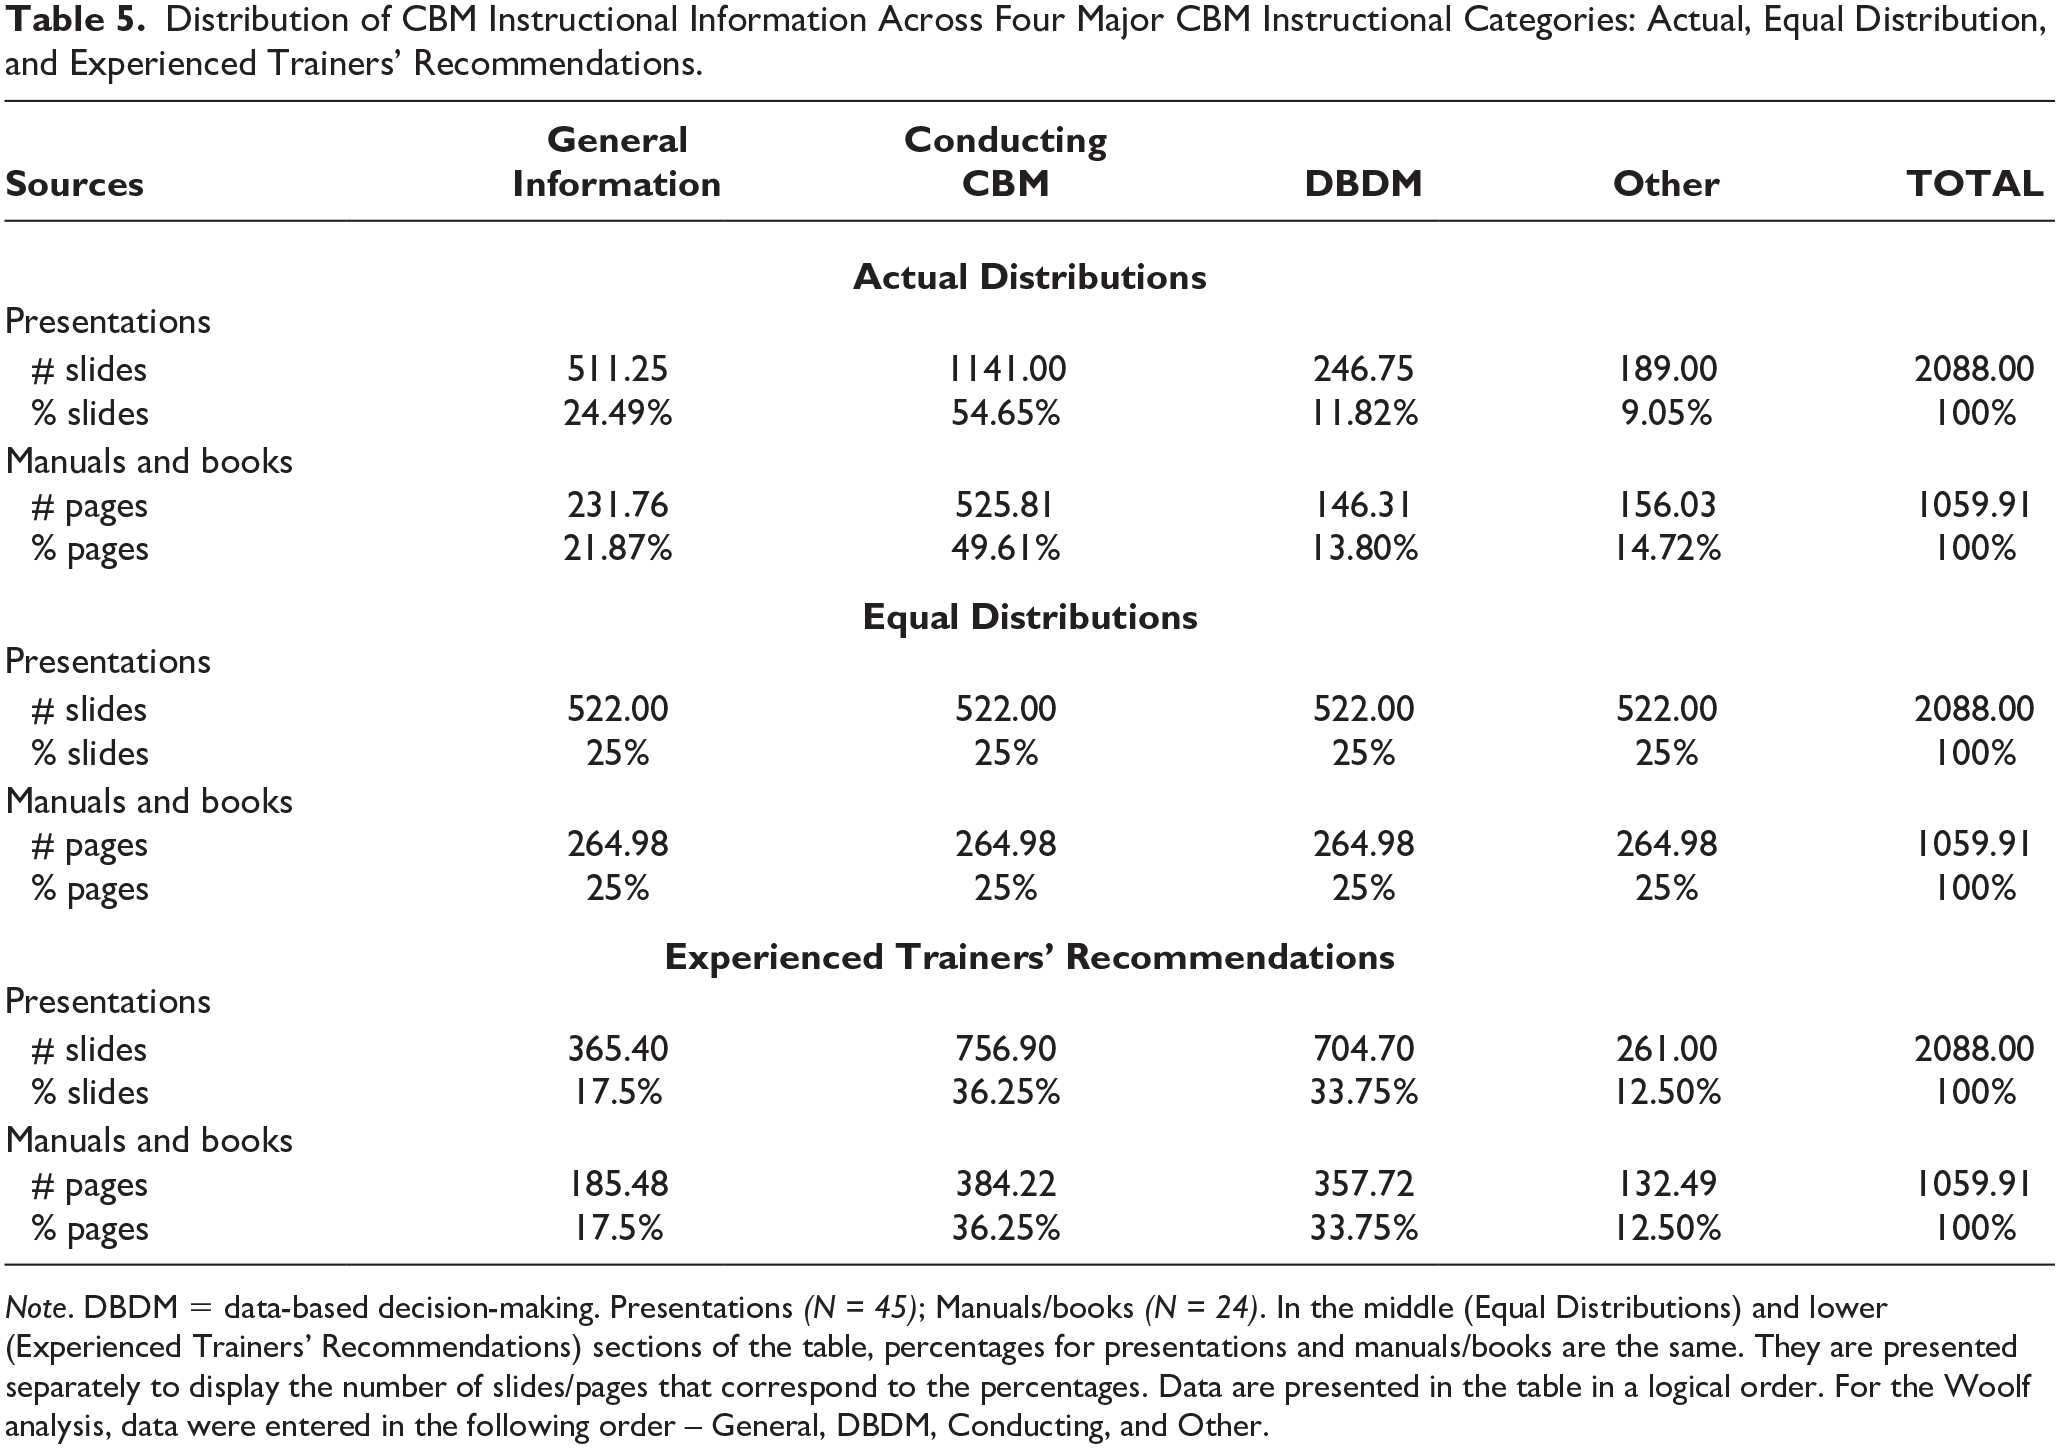
Note. DBDM = data-based decision-making. Presentations (N = 45); Manuals/books (N = 24). In the middle (Equal Distributions) and lower (Experienced Trainers’ Recommendations) sections of the table, percentages for presentations and manuals/books are the same. They are presented separately to display the number of slides/pages that correspond to the percentages. Data are presented in the table in a logical order. For the Woolf analysis, data were entered in the following order – General, DBDM, Conducting, and Other.
A preliminary analysis was conducted to examine whether there was a difference in the distribution of instructional information for the presentations and the manuals/books. Results of a chi-square analysis of independence revealed significant differences in distributions between the presentations and manuals/books, χ2(3) = 28.25, p < .001. Inspection of mean percentages (top section, Table 5) reveal that presentations contained more information on conducting CBM than did the manuals/books (approx. 55% vs. 50%), and less on other (approx. 9% vs. 15%). Despite these differences, the overall pattern of distributions was similar across the two sources. That is, for both presentations and manuals/books, the largest percentage of information was devoted to conducting CBM (approx. 55% and 50%, respectively), followed by general CBM information (approx. 24% and 22%, respectively). Only a small percentage of information was devoted to data-based decision-making (approx. 12% and 14%, respectively).
Comparison of Observed Proportions to Equal Proportions
To address Research Questions 1 and 2, the proportion of information devoted to data-based decision-making was compared with the proportion of information devoted to other categories, and with the proportion of information that would occur if materials were to be equally distributed across categories (that is, conceptually, if slides/pages were to be randomly assigned to category). These analyses were completed via a comparison of the observed proportions of slides/pages with equal proportions across the four categories.
Although the data for analysis were counts, a straightforward cross tabulated chi-square test was inappropriate for two reasons. First, a cross tabulated chi-square would test the observed counts against counts under complete independence, based on the marginal distributions. Second, it would be limited to testing overall dependency between two sets of categories (Fleiss, 1981). Therefore, the Woolf test for homogeneity of odds ratios was carried out to analyze whether the proportions of instructional information devoted to the four categories of CBM instruction differed significantly from user-specified distributions, in this case, equal proportions of information (25% per category).
The Woolf test can be used to indirectly compare two crosstabulations via a comparison of their respective odds ratios (Woolf, 1955). For the current study, the observed and equal proportions of information for the presentations in one tabulation were compared with the equal and observed proportions of information for manuals/books in the other tabulation by comparing the set of odds ratios in all the 2 × 2 cell combinations within the two crosstabulations. Through this analysis of the heterogeneity among the odds ratios, it was possible to indirectly evaluate whether the observed proportion of information devoted to data-based decision-making differed significantly from the proportion of information devoted to other categories, and differed significantly from what would be expected based on a distribution of equal proportions across the four categories (25%).
Because our primary interest was in the category data-based decision-making, data for the analyses were entered in the following order: general information, data-based decision-making, conducting CBM, and other, allowing for 2 × 2 comparisons of general information with data-based decision-making, and data-based decision-making with conducting CBM. (Note that the categories are presented in Table 5 in a different, logical order that represents the order in which topics are covered in most CBM professional development trainings.)
The observed proportions, which appear in the top section of Table 5, have already been described. In the middle section of Table 5, the equal proportions are reported, accompanied by the number of slides/pages that would be expected if information were to be equally distributed across each of the four categories. Results of the Woolf test revealed significant heterogeneity among the odds ratios, indicating that the odds ratios significantly differed between the two tabulations containing observed and equal proportions of instructional information for the presentations and for the manuals/books (Woolf χ2 = 25.97, df = 1, p < .001). The analysis further revealed significant differences in the crosstabulations involving general information and data-based decision-making (Woolf χ2 = 49.49, df = 1, p < .001), and data-based decision-making and conducting CBM (Woolf χ2 = 315.39, df = 1, p < .001).
These results indicate that, for both presentations and manuals/books, the observed proportion of information devoted to the four categories significantly differed from equal proportions (25%, thus), and furthermore, that the proportion of information devoted to data-based decision-making significantly differed from the proportion of information devoted to general CBM information and conducting CBM.
Comparison of Observed Proportions to Recommendations by CBM Trainers
To address Research Question 3, the proportion of information devoted to data-based decision-making was compared with the proportion of information recommended by experienced CBM trainers. The recommended proportions (averaged across the four trainers) for each category are reported in the bottom section of Table 5, accompanied by the raw numbers that would correspond to the proportions for each source.
To analyze whether the observed proportions differed from the recommended proportions, a second Woolf test for homogeneity of odds ratios was carried out in which the observed and recommended proportions of instructional information for the presentations in one tabulation were compared with the recommended and observed proportions of information for manuals/books in the other tabulation.
Results of the Woolf test revealed significant heterogeneity among the odds ratios, indicating that the odds ratios significantly differed between the two tabulations containing the observed and recommended proportions of instructional information for the presentations and for the manuals/books (Woolf χ2 = 105.60, df = 1, p < .001). The analysis further revealed significant differences in the crosstabulations involving general information and data-based decision-making (Woolf χ2 = 212.2, df = 1, p < .001), and data-based decision-making and conducting CBM (Woolf χ2 = 326.36, df = 1, p < .001).
These results indicate that, for both presentations and manuals/books, the observed proportion of information devoted to the four categories significantly differed from the proportion recommended by experienced trainers, and furthermore, that the proportion of information devoted to the category data-based decision-making significantly differed from the proportion recommended by experienced trainers.
Discussion
CBM is used within DBI to build effective instructional programs for students with LD. When teachers respond to CBM data with instructional and goal adjustments, they effect significant improvements in the achievement of students with severe and persistent learning difficulties, that is students with or at risk of LD (Filderman et al., 2018; Jung et al., 2018; Stecker et al., 2005). Regrettably, teachers often do not respond to CBM data, yet the reasons for their nonresponse are not entirely clear. One potential reason, and one which has received little attention in the literature to date, is that teachers may not receive sufficient instruction in data-based decision-making during typical CBM professional development.
The purpose of this study was to determine the amount of attention devoted to the data-based decision-making aspects of CBM within CBM professional development materials. To accomplish this goal, we systematically reviewed CBM professional development materials, including presentations, manuals, and books, to determine what proportion of information was focused on CBM data-based decision-making. Data-based decision-making was defined as instruction related to reading and interpreting CBM graphed data, and linking the data to the students’ instructional programs to make instructional decisions. Such skills are the essence of CBM implementation within DBI.
Our goals were to compare the proportion of information devoted to the data-based decision-making aspects of CBM with other aspects of CBM instruction and to determine whether this proportion differed from what would be expected based on an equal distribution of information across topics, and would differ from recommendations by experienced CBM trainers.
We tested the hypotheses that the proportion of information devoted to data-based decision would be equal to that devoted to other major instructional topics, to that expected based on an equal distribution of information across topics, and to that recommended by experienced CBM trainers. Our hypotheses were not supported by the data. Results revealed that only a small proportion of information in CBM professional development materials was devoted to the data-based decision-making aspects of CBM, namely, 12% for presentations and 14% for manuals/books. These proportions were significantly smaller than the 25% and 22% devoted to general CBM information, and the 55% and 50% devoted to conducting CBM, and also were significantly smaller than the 25% that would be expected if information were to be equally distributed across the four categories. Finally, the proportion of information devoted to data-based decision-making also was significantly smaller than the 34% recommended by experienced trainers.
In sum, our results suggest that relatively little attention is devoted to the data-based decision-making aspects of CBM progress monitoring in CBM professional development materials. This finding supports our suggestion that one potential reason for teachers’ difficulties in responding to CBM data is that they receive insufficient instruction in the data-based decision-making aspects of CBM. This finding is of real concern because it is only through teachers’ responding to data via instructional and goal adjustments that CBM implementation leads to improvements in student performance (see Fuchs et al., 2020; Stecker et al., 2005). More specifically, if teachers do not learn how to read and interpret CBM graphs, and learn how to use the data to guide their instructional decision-making, CBM implementation will likely have little to no effect on the performance of students with or at risk of LD.
Of course, our data do not allow us to draw conclusions about the causal relation between the content of professional development training and teachers’ actual response to CBM data. Nonetheless, we find the results of the study to be sobering and concerning and feel that, at the very least, the results should give CBM professional development trainers pause for thought about the need to increase their instruction on data-based decision-making. Lending support to the argument for increased instruction on data-based decision-making is the recommendation from the experienced CBM trainers, who suggested that 34% of CBM instruction (which would be 705 slides and 358 pages) be devoted to data-based decision-making—a far cry from the 12% and 14% (247 slides and 146 pages) actually found in our data. Also lending support to the argument for increased instruction in data-based decision-making is the result of van Kuijk et al. (2016) and van den Bosch et al. (2019), who found positive effects associated with such instruction.
We were somewhat surprised by the large proportion of information in the professional development materials focused on conducting CBM. Conducting CBM consists of instruction on how to select and create CBM measures (including information on the technical adequacy of scores from CBM measures), how to administer and score the measures, and how to graph the data. Given that a large part of conducting CBM currently can be done automatically via technological means, we wondered to what extent CBM professional development actually needs to emphasize this aspect of CBM. The large proportion of information devoted to conducting CBM may reflect the fact that CBM trainers often also conduct CBM research. Researchers may tend to devote a large proportion of time to the scientific underpinnings of CBM. Although we certainly would argue that such information is important, we think it is worthwhile to reflect on the need to shift some attention away from conducting CBM toward data-based decision-making.
Limitations
There were several limitations to the study. First, in this study, we focused only on CBM professional development materials. We did not include materials for preservice teachers, for example, syllabi, slides, or textbooks from CBM or assessment courses. In addition, as mentioned earlier, we excluded articles in this study. It will be important in future research to examine these other sources of CBM training materials to see whether the patterns found in this study hold true for these other sources. In addition, we did not examine material from other types of informal assessments systems, such as CBA and CBE. Future research should examine the extent to which professional development materials for other types of informal assessment systems emphasize data-based decision-making.
Second, this study did not address the actual amount of attention devoted data-based decision-making in “real-life” professional development trainings. Addressing this issue would require observing professional development trainings. Nonetheless, the data from the present study provide a picture of how content is distributed within CBM professional development materials, and one could assume that this might at least partially reflect actual practice.
Third, our results do not provide insight into the amount of training needed to become skilled data-based decision-makers. One could argue that 12% to 14% of total training time is enough for teachers to learn how to use CBM data to make effective instructional decisions. Arguing against this is, however, research demonstrating teachers’ difficulty with data-based decision-making (reviewed in the introduction) and recommendations by experienced CBM trainers that 34% of professional development be devoted to data-based decision-making.
Fourth, our data do not reveal what “12% to 14%” represents in time. For example, 12% of an 1-hr training session is different than 12% of a three-day training session. Related to this limitation, our study focused only on professional development materials, not on the form of instruction used in the professional development training. It is possible (probable) that different types of instruction have different effects on teachers’ CBM data-based decision-making skills. The issue of differential effects of type and quality of professional development training needs to be addressed in future research.
A final limitation, and one related to those already discussed, is our method for determining how much attention should be devoted to data-based decision-making. We approached this issue in two ways: first, assigning an equal proportion of information to each category and, second, asking experienced CBM trainers for their recommendations. One might question whether comparisons with equal proportions was an appropriate method for determining what should be; yet, given the research on the importance of data-based decision-making within CBM, we would argue that the amount of attention devoted to data-based decision-making should be equal to or greater than that devoted to other aspects of CBM training. Recommendations from experienced CBM trainers is perhaps a more compelling approach for determining what should be, and here, we saw that observed percentages were much smaller than those recommended.
In sum, we believe that the data support the conclusion that too little instructional time is devoted to the data-based decision-making aspects of CBM during CBM professional development.
Implications for Practice
Taken together, our results imply that there is a need for greater attention to data-based decision-making within typical CBM professional development training. We suggest that professional development trainers consider increasing the amount of attention devoted to the data-based decision-making aspects of CBM. The effects of this increased attention on actual CBM implementation within DBI must be examined in future research.
One issue that we did not address is whether different levels of training would be appropriate for teachers at different points in their careers. For example, perhaps for beginning teachers, instruction should focus on what CBM is and on how to conduct CBM, with instruction on data use for decision-making occurring later in their professional development trajectories. However, we caution against such an approach. We believe that instruction about what CBM is and how CBM is conducted should not be separated from instruction on how to use the data to make instructional decisions. It may be the case that preservice and beginning teachers have fewer ideas in their repertoire for instructional modifications and adjustments than more experienced teachers, and may therefore need guidance from more seasoned colleagues or from problem-solving teams about modifications and adjustments. However, we would argue that it is essential to introduce the data-based decision-making aspects of CBM to teachers early in their professional development training.
A related issue is the extent to which general versus special education teachers need to be schooled in CBM data-based decision-making. The focus of this study was on the use of CBM for students with or at risk of LD, and thus primarily on special education teachers. However, in multitiered systems of instruction, special and general education teachers work together in teams to make decisions about students with learning difficulties. Thus, it is important for general education teachers to also become effective data-based decision-makers, although their focus may lie more with group-level data than with individual data. There is a large body of research in the general education literature addressing data-based decision-making for general education teachers, and the need for improved professional development in this area (see, for example, Mandinach & Schildkamp, 2020). It would be wise for special educator researchers to avail themselves of this research, given the similarities in the challenges faced by both general and special educators in data-based decision-making.
Conclusion
In conclusion, the results of this study indicate that only a small proportion of instructional time is devoted to data-based decision-making in typical CBM instruction. This amount of time is less than that devoted to other instructional topics, less than expected based on an assumption of equal distribution of information across major instructional topics, and less than that recommended by experienced trainers. These results suggest that one reason for teachers’ nonresponse to CBM progress data is that teachers do not receive sufficient instruction on the data-based decision-making aspects of CBM, that is, on reading and interpreting CBM graphs, and on linking the data to instruction and identifying, selecting, and implementing effective instructional adjustments. Before drawing firm conclusions, this study must be replicated by examining additional CBM training materials, such as articles in practitioner journals, and by examining materials for preservice teachers. In addition, it will be important to observe and code actual professional development workshops. Most importantly, research should be conducted to experimentally examine the causal relation between improved professional development training and teachers’ data-based decision-making for students with or at risk of LD, and the resulting effects on the performance of these students.
As a final reflection, we wonder to what extent the content of the professional development materials reflects what is happening in the field more broadly with regard to CBM use. That is, we wonder to what extent CBM actually is used for individual progress monitoring and instructional decision-making, versus for identification and placement of students, for example, placement into tiers of instruction. If it is the case that CBM is rarely used to guide teachers’ instructional decision-making, it is unfortunate. It means that the field is missing out on a potentially powerful tool for helping teachers to build effective individualized instructional programs for students with or at risk of LD.
Supplemental Material
sj-docx-1-ldx-10.1177_0022219421997103 – Supplemental material for A Systematic Review of CBM Professional Development Materials: Are Teachers Receiving Sufficient Instruction in Data-Based Decision-Making?
Supplemental material, sj-docx-1-ldx-10.1177_0022219421997103 for A Systematic Review of CBM Professional Development Materials: Are Teachers Receiving Sufficient Instruction in Data-Based Decision-Making? by Christine A. Espin, Roxette M. van den Bosch, Marijke van der Liende, Ralph C. A. Rippe, Melissa Beutick, Athanasia Langa and Suzanne E. Mol in Journal of Learning Disabilities
Footnotes
Declaration of Conflicting Interests
The author(s) declared no potential conflicts of interest with respect to the research, authorship, and/or publication of this article.
Funding
The author(s) received the following financial support for the research, authorship, and/or publication of this article: We thank the department of Education and Child Studies at Leiden University for a small grant that supported a portion of this research project.
Supplemental Material
Supplemental material for this article is available online.
References
Supplementary Material
Please find the following supplemental material available below.
For Open Access articles published under a Creative Commons License, all supplemental material carries the same license as the article it is associated with.
For non-Open Access articles published, all supplemental material carries a non-exclusive license, and permission requests for re-use of supplemental material or any part of supplemental material shall be sent directly to the copyright owner as specified in the copyright notice associated with the article.
