



Abstract
Existing research on the causes of violent ethnic conflict is characterized by an enduring debate on whether these conflicts are the result of deeply felt grievances or the product of an opportunity structure in which rebellion is an attractive and/or viable option. This article argues that the question of whether incentive- or opportunity-based explanations of conflict have more explanatory power is fundamentally misguided, as conflict is more likely the result of a complex interaction of both. The fact is, however, that there is little generalized knowledge about these interactions. This study aims to fill this gap and applies crisp-set Qualitative Comparative Analysis (QCA) in order to identify constellations of risk factors that are conducive to ethnic conflict. The results demonstrate the explanatory leverage gained by taking causal complexity in the form of risk patterns into account. It takes no more than four different configurations of a total of eight conditions to reliably explain almost two-thirds of all ethnic conflict onsets between 1990 and 2009. Moreover, these four configurations are quasi-sufficient for onset, leading to conflict in 88% of all cases covered. The QCA model generated in this article also fares well in predicting conflicts in-sample and out-of-sample, with the in-sample predictions being more precise than those generated by a simple binary logistic regression.
Introduction
The question of whether violent conflicts are the result of grievances or the product of an environment in which rebellion is an attractive and/or viable option has divided scholars of intrastate conflict for decades. The debate was reignited by Collier & Hoeffler (2004), who claimed that rebellion cannot be explained by grievances resulting from ethnic animosities and economic and political inequalities because situations in which people want to rebel are ubiquitous. Opportunity structures in which people are able to rebel, on the other hand, are considered sufficiently rare to constitute the explanation.
In this article on the causes of violent ethnic conflict, I argue that the competition between incentive- and opportunity-oriented explanations is misplaced altogether, because conflict is likely the result of both. This argument is not entirely new. Reflecting a growing unease with the either/or framing of the debate so far, it is now in vogue to state that conflict is the result of a complex interaction of incentives and opportunities (Ballentine & Sherman, 2003: 6; Korf, 2005: 201–202; Østby, 2008: 145; Sambanis, 2005: 329). Yet apart from this basic finding, we have little systematic knowledge about how they interact.
To fill this gap, this study aims to identify the various constellations of explanatory factors that are particularly conducive to the outbreak of ethnic conflict. I analyze global data on 500 five-year periods of ethnic conflict onset and non-onset on the level of ethnic groups. To identify recurring causal patterns and build a configurational model of ethnic conflict, I apply crisp-set Qualitative Comparative Analysis (csQCA), a method well suited to detect complex causal relationships.
The most striking finding is that it takes no more than four different patterns to explain almost two-thirds of all ethnic conflict onsets between 1990 and 2009. Using some of the field’s well-known catchphrases, I label them ‘conflict trap’, ‘bad neighborhood’, ‘ousted rulers’, and ‘resource curse’. The combinations of explanatory factors in these four patterns are quasi-sufficient for conflict, that is, they lead to conflict in 88% of all cases covered. From a theoretical perspective, the results are largely in line with the importance accorded to the risk from previous conflict, neighborhood effects, political exclusion, or natural resources in the recent scholarship on conflict onset. What this study demonstrates powerfully, however, is the explanatory leverage we can gain if we take different combinations of those risk factors into account. The model generated in this article also performs well in predicting conflicts, with in-sample predictions that are more precise than those generated by a simple binary logistic regression. Out-of-sample, both models predict very well and with comparable precision.
The article proceeds as follows: I first briefly recapitulate the debate on incentive- and opportunity-oriented explanations of conflict. Next, I describe my own analytical framework and introduce the explanatory conditions examined, followed by the research design. I then present the QCA results and offer a more substantive interpretation of each risk pattern before I conclude with an assessment of the predictive power of the model.
Incentives, opportunities, and conflict
In the past three decades, ethnic conflict has become the prevalent type of civil war (Fearon & Laitin, 2011: 199). Reflecting the world’s shock and outrage at the slaughtering of innocent men, women, and children in Bosnia, Rwanda, and elsewhere, these conflicts have drawn and continue to draw enormous scholarly interest. Scholars disagree, however, on whether ethnic identities are really an incentive for violence in such conflicts (as in the ‘ancient hatreds’ thesis, see Kaplan, 1993), or whether these identities are merely (re)created and instrumentalized by extremist leaders who sense an opportunity to come to – or hold on to – power (Gagnon, 2004; Snyder, 2000). A similar disagreement concerns the causal role of poverty and economic inequality in what is known as the ‘greed–grievance’ debate. In their famous article, Collier & Hoeffler (2004) rejected the popular argument that economic grievances are a powerful incentive for rebellion. They argued instead that rebel leaders merely employ a discourse of popular grievances to justify their violent strategy in order to profit from the war by looting or eventually controlling the resources of the state. Rejecting both ethnic antagonisms and economic inequalities as meaningful explanations of conflict, Fearon & Laitin (2003: 4) similarly argued that grievances ‘fail to postdict civil war onset’, while measures of an opportunity structure that favors insurgency (like rough terrain or weak states) did fairly well.
These (stylized) debates are but two examples of a controversy that on a meta-level has run through ethnic conflict and civil war research like a golden thread: the incentive–opportunity debate. Ever since the exchanges in the 1970s between relative deprivation theorists (Davies, 1962; Gurr, 1970) and the resource mobilization school (Snyder & Tilly, 1972; Tilly, 1978), the controversy circles around the question of whether conflict can really be understood by looking at the incentives for collective action, or whether we should rather examine the opportunity structure that makes collective action by ethnic groups possible. The morally charged phrasing in terms of ‘greed’ and ‘grievance’ in the latest manifestation of this controversy has certainly contributed to the unease with the either/or framing of the debate (Korf, 2005: 201–202). Increasingly, scholars claim that conflict is more likely the result of a complex interaction of both incentives and opportunities (Ballentine & Sherman, 2003: 6; Østby, 2008: 145; Sambanis, 2005: 329). Case studies usually highlight this complex interplay of risk factors in leading up to conflict, but even the occasional interaction terms tested in quantitative models of conflict (for example Brown, 2009; Østby et al., 2011) offer some preliminary evidence of complex causal relationships. Most research, however, has not systematically explored how incentives and opportunities interact, at least not in a comparative manner. This study aims to fill this gap.
Analytical framework and explanatory factors
Explanatory conditions included in the analysis

The political exclusion of an ethnic group from national-level decisionmaking is a typical incentive variable and has received much attention and empirical support within research on horizontal inequalities and conflict (Brown, 2009; Cederman, Wimmer & Min, 2010). Groups that have no say in government are lacking an important means to redress grievances and may not consider the state to be their legitimate representative. Exclusion is even more explosive if a group is suddenly ousted from a position of power (Cederman, Wimmer & Min, 2010). Such groups obviously have an incentive to regain the privileges once held. At the same time, their inside knowledge of the state, professional networks, and even state resources they may still partially control (Roessler, 2011) may offer them formidable opportunities to launch a rebellion against the new rulers. The condition ruling group was included to control for the fact that the group that holds most power in a state may not have an incentive to rebel at all, no matter what other risk factors are present at the time. Unfortunately, no high-quality data were available on economic inequalities at the level of ethnic groups; hence this incentive remains unaccounted for in this study. 1
The strong academic interest in the link between natural resources – especially oil – and conflict (Collier & Hoeffler, 2004; Humphreys, 2005; Lujala, Rød & Thieme, 2007; Ross, 2003) warrants the inclusion of the condition oil or gas, despite the above-mentioned ambiguousness with regard to its exact causal effect. Previous conflict is also usually included in quantitative models of conflict onset – if only to control for the temporal dependence of observations – but it is again not entirely clear how it facilitates renewed onset. Previous conflict may have caused hurt, loss, and feelings of revenge, thus contributing to the incentives for renewed conflict, or it may have left a legacy of weapons and trained rebels that facilitate the organization of a rebellion (Collier & Hoeffler, 2004; Walter, 2004).
Group size and territorial concentration were included because they are typical for what Gurr (2000: 70) calls group capacity – and thus, opportunity – variables. Group size influences the resources a group can mobilize (Cederman, Wimmer & Min, 2010: 96), and tiny groups may not be able to gather enough financial and personal resources to challenge the state. The same applies to dispersed groups, which face coordination problems in organizing collective action, while territorial concentration positively influences a group’s capacity for mobilization (Weidmann, 2009).
Political instability and extreme state poverty are included because they are two key aspects of state strength – a typical opportunity concept. Political instability as a temporary weakness signals to potential rebels that there is a vulnerability of the state to be exploited (Fearon & Laitin, 2003: 16). Extreme state poverty in terms of GDP per capita is both a cause and a result of bad administrative quality and weak state institutions, and reflects a chronic weakness of the state (Hendrix, 2010). Again, there are alternative mechanisms by which poverty could lead to conflict, such as being an incentive in itself, or via an opportunity cost mechanism: if income from regular employment is absent or low, joining the rebels may be an option to make a living (Collier & Hoeffler, 2004: 569).
The last two factors – having ethnic kin in a neighboring state, and having neighboring kin that are in conflict – are included to account for the international dimensions of ‘internal’ conflict. While there are various ways in which the neighborhood can influence the chance of war in another country, there is evidence that links stemming from transnational ethnic groups are particularly important (Buhaug & Gleditsch, 2008; Cederman, Girardin & Gleditsch, 2009: 409). Such groups may provide safe havens for rebels, and – especially if they are in a conflict themselves – can be a source of both inspiration and support in the form of weapons, finances, fighters, and even rebel leaders (Salehyan, 2009).
Method of analysis and research design
With the 11 conditions described above, a process of pattern-finding – explained in this section – is employed in order to identify the multiple configurations of incentive and opportunity conditions that likely lead to ethnic conflict.
Qualitative comparative analysis (QCA)
This study employs crisp-set QCA (csQCA), which was developed to permit valid generalization on complex causal relationships even with small to intermediate case numbers (Ragin, 2000, 2008). 2 In this study, however, the choice of QCA is not guided by the number of cases available for study, which is sufficient for using standard statistical techniques. Instead, QCA is applied because it can handle two aspects of causal complexity that are of core theoretical interest in this article: conjunctural causation and equifinality. Conjunctural causation is a situation in which the effect of one explanatory factor depends on the presence or absence of other variables (Braumoeller, 2003: 4). Equifinality refers to the fact that there may be multiple paths to the same outcome, that is, that conflict may be the result of different configurations of explanatory factors. In assuming conjunctural causation and equifinality, csQCA differs fundamentally from binary logistic regression, which is frequently used in onset studies but is founded on the assumption that each variable has an independent (‘net’) effect on the risk of conflict (Ragin, 2000: 95). While there are efforts to incorporate individual aspects of causal complexity into statistical methods such as regression analysis (see Schneider & Wagemann, 2012: 88), most of these attempts can handle just one aspect of complexity at a time.
CsQCA starts from an assumption of maximum complexity and lists all logically possible combinations of the conditions examined in a truth table, indicating for each row what proportion of the cases with this combination also have the outcome. The analyst selects for further analysis only those configurations that are sufficient for the outcome, that is, in which all or at least most of the cases have a conflict. QCA then employs the Quine–McCluskey algorithm to discard all redundant information from the selected truth table rows (Schneider & Wagemann, 2012: 104). The result is a logically minimized solution, or in other words, causal complexity reduced to its most simple, valid expression. 3 Given the large-N character of this study, the aim is to identify quasi-sufficient rather than perfectly sufficient causal combinations, which means that most, but not necessarily all cases with a certain combination also have conflict (Ragin, 2000: 109–115). It is the task of the analyst to set a consistency threshold at which the proportion of cases that have the conditions and the outcome is considered high enough to warrant a statement of sufficiency. Not only is consistency relevant in the selection of truth table rows, but also it is one of two important parameters of fit of the final QCA solution. The second parameter of fit is coverage, which reports how many onset cases are explained by the final QCA solution or the individual paths, because QCA does not make any statements about cases that do not exhibit one of the sufficient paths to conflict. In this sense, consistency fulfills a similar function (but is not the same!) as the parameters of significance in a regression analysis – indicating whether it is worth interpreting a causal relationship. Coverage, in turn, resembles the parameters of strength, that is, correlation coefficients and total variance explained (Ragin, 2008: 45).
Outcome and sample population
The outcome to be explained in this study is why some politically relevant ethnic groups experience the onset of ethnic conflict within a five-year period, while others do not. I use the onset_do_flag variable downloaded from the GROWup data portal to identify ethnic conflict onsets (Cederman, Wimmer & Min, 2010; Cunningham, Gleditsch & Salehyan, 2009; Gleditsch et al., 2002; Wucherpfennig et al., 2012). 4 An ethnic conflict is a conflict in which at least one rebel organization in an internal conflict (as defined by Themnér & Wallensteen, 2013) explicitly or implicitly claims to represent this group in the conflict and predominantly recruits fighters from the respective ethnic group (Wucherpfennig et al., 2012: 95). This strict definition of ‘ethnic’ has a caveat worth mentioning: internal conflicts that do not meet the double requirement of ethnic claim and recruitment are coded as zero and are thus treated like cases that had no conflict at all. Note that this problem applies to most analyses using the EPR-ETH group-level data. The consequence is that we need to be careful in the interpretation of deviant cases – they may be deviant because they really had no conflict, or because they had conflict that was not coded as ethnic.
The coding for the onset_do_flag variable applies a two-year rule to collapse renewed episodes of a conflict that are within two years of the last episode into one single onset, assuming that a mere suspension of hostilities for a year does not mean that a conflict has ended in between. The analysis is limited to the time period 1990–2009, which accounts for the fact that the end of the Cold War fundamentally altered a number of conditions that states and potential rebels were facing on local, national, and regional levels, such as the dissolution of multi-ethnic empires, a proliferation of cheap weapons, or withdrawal of superpower support, to name just a few (Kalyvas & Balcells, 2010: 416).
With these rules, the dataset contains 102 onsets of ethnic conflict between 1990 and 2009. 5 To these onset periods, a random sample of just below 400 non-onsets was added, yielding a dataset of 500 observations. Random sampling allowed me to focus data collection and coding efforts on more interesting variables rather than more observations (King & Zeng, 2001: 137). 6 From a statistician’s viewpoint, both the random sampling and the study of five-year periods instead of group-years amounts to ‘wasting data’. However, the number of conflict onsets to be studied is finite and analyzing group-years merely inflates datasets with zeroes (non-events), while most of the knowledge we gain about conflict is obviously gained from events. Moreover, studying five-year periods allows for flexible ‘incubation periods’, that is, the time it takes for a change in a condition to exhibit its conflict-triggering effect.
Measuring the explanatory conditions
The following paragraphs detail the measurement of the explanatory conditions. 7 Political exclusion (polx) is measured with the StatusID variable from the EPR-ETH dataset (Cederman, Wimmer & Min, 2010) and takes on the value 1 if an ethnic group is excluded from central executive power in the majority of period-years. 8 A group was considered ousted from rule (oust) if it was excluded from central executive power in the course of a period. 9 Groups that retained their status as senior partners in government during all period-years were considered to be the ruling group (ruler).
The condition territorial concentration (conc) takes on the value 1 if a group has a defined settlement pattern in the geo-coded version of EPR-ETH (GeoEPR-ETH) rather than being dispersed, migrant, or predominantly urban (Cederman, Wimmer & Min, 2010; Wucherpfennig et al., 2011). The condition petrol measures whether there is at least one giant oil or gas field in a group’s settlement area. It was obtained by combining GeoEPR-ETH data on groups’ settlement areas with a georeferenced petroleum dataset by Lujala, Rød & Thieme (2007). 10 Previous conflict (precon) indicates whether a group already had an ethnic conflict as defined above within the past ten years. The condition tiny group (tiny) was coded 1 if a group makes up less than 1% of the total country population as reported in the EPR-ETH GroupSize variable (Cederman, Wimmer & Min, 2010) and has an absolute group population of less than one million people (CIA, 2013a).
On the country level, the condition political instability (instab) denotes whether there was a regime change, that is, a substantial shift from democracy to autocracy or the other way within a group-period, as measured in the Polity variable of the Polity IV dataset (Marshall, Jaggers & Gurr, 2011). 11 Extreme state poverty (xpoor) indicates whether a country is among the lowest 10% of all countries with regard to real per capita GDP, with GDP data from the Penn World Tables rgdpch variable (Heston, Summers & Aten, 2011), extrapolated for missing years using World Bank growth rates (World Bank, 2013).
Data on transnational ethnic kin (TEK) are from the International Conflict Research group at ETH Zurich (Cederman et al., 2013). The condition havtek is coded 1 if an ethnic group has a kin group in a country that is connected to its host country by a land border (CIA, 2013b). The condition tekcon is coded 1 if such a group has an ongoing ethnic conflict in any year of the group-period and if the settlement areas of the two groups are adjoining.
Results
This section presents the results of the comparative analysis, followed by a discussion of the risk patterns identified.
A configurational model of ethnic conflict
The first step in a QCA is the analysis of necessary conditions. We should be satisfied to find a quasi-necessary rather than fully necessary condition. To this end, I set a consistency threshold of 0.95, which means that at least 95% of all conflict cases should exhibit a necessary condition, with five deviant cases allowed. Only two single conditions fulfill this criterion: ∼tiny and ∼ruler, with the tilde indicating the absence of this condition. This means that with very few exceptions, ethnic conflict should only happen if an ethnic group is not tiny and not the senior partner in government, and indeed, only five very small groups have staged a rebellion, and only three ruling groups have done so. However, with very low coverage scores these are trivial necessary conditions, that is, they are too common in the sample to be of much substantive interest (Schneider & Wagemann, 2012: 144–147, 233–237).
The sufficiency test moves away from looking at single conditions, and aims to identify configurations of conditions that are quasi-sufficient for conflict onset. The consistency threshold to include a truth table row into the minimization process is set at 0.7, which is a bit lower than the 0.75 consistency threshold often recommended (Ragin, 2008: 46; Schneider & Wagemann, 2012: 212), but seems justified given the large number of cases and the fact that some problems connected to lower thresholds apply only to fuzzy-set QCA (Schneider & Wagemann, 2012: 238–244).
As was to be expected, using all 11 conditions discussed in the previous sections in one single model yields a complex, unwieldy solution that is difficult to interpret. It explains 62% of all onsets with a very high consistency of 0.97, but it does so by identifying many different paths, most of which only explain very few conflicts. 12 Conditions were subsequently dropped from this full model to find a model that was both parsimonious, that is, had a limited number of paths that could explain a group of onsets, and at the same time had acceptable consistency and coverage scores. Dropped were the conditions territorial concentration (conc), extreme state poverty (xpoor), and having transnational ethnic kin (havtek). These may still be important risk factors, but they did not contribute to a better explanation in terms of consistency and coverage and split the solution up into many paths that rendered a meaningful interpretation difficult.
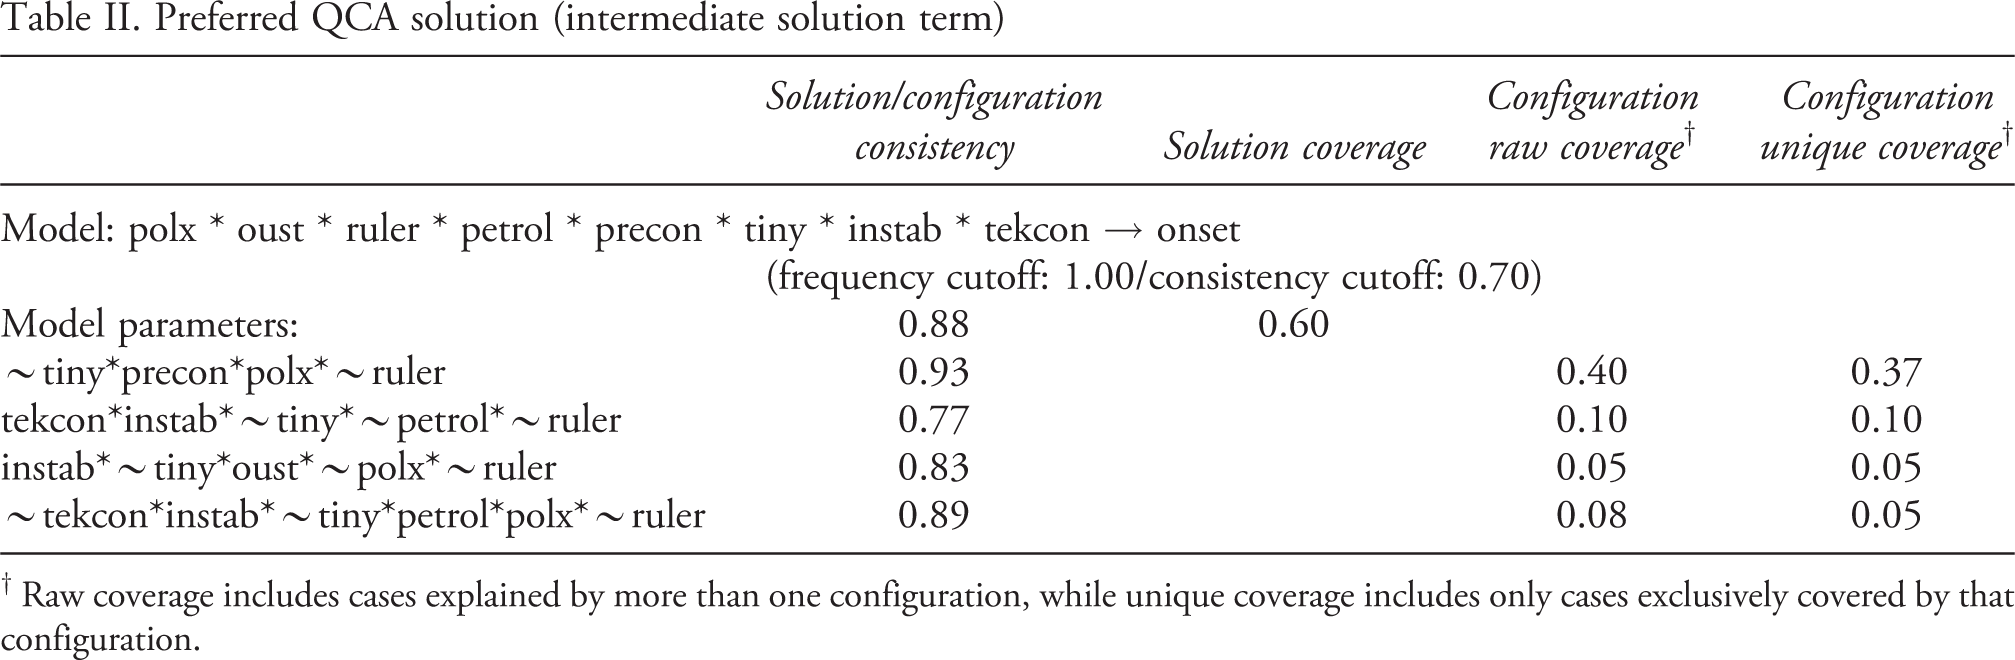
Preferred QCA solution (intermediate solution term)
† Raw coverage includes cases explained by more than one configuration, while unique coverage includes only cases exclusively covered by that configuration.
Some of the paths in Table II contain conditions that should contribute to conflict in their absence, namely ∼petrol (no oil and gas in a group’s settlement area) in the second path, ∼polx (no political exclusion) in the third path, and ∼tekcon (no transnational ethnic kin in conflict) in the fourth path. This is not unusual in QCA solutions given that the effect of any condition is assumed to be dependent on the presence or absence of other conditions. In this case, however, these conditions do not seem to make sense theoretically, and a brief analysis confirms that they are not needed for a valid interpretation of the solution, because the respective paths are quasi-sufficient without them. 14 Ignoring these ‘absent conditions’ and the two trivial necessary conditions from the QCA solution, Figure 1 captures the structure of the argument contained in Table II.
There are four quasi-sufficient paths to conflict, which I labeled using some of the field’s well-known catchphrases: ‘Conflict trap’ for the conjunction of previous conflict and political exclusion, ‘bad neighborhood’ for a combination of ethnic kin in conflict and political instability at home, ‘ousted rulers’ for groups that are ousted from a position of power in a situation of political instability, and ‘resource curse’ for the conjunction of oil and gas reserves, political exclusion, and instability. The following paragraphs explain and discuss these four paths in more detail, with Table III listing all the conflicts that are explained by any of them as well as deviant cases.
Conflict trap
The first path to conflict is via the recurrence of a previous conflict: if a (non-tiny, non-ruling) ethnic group already had an ethnic conflict in the past ten years and is still politically excluded, conflict breaks out with a high consistency (0.93). With a raw coverage of 0.40, this combination explains the highest number of conflicts covered by the total model (41 onsets).
15
This finding is congruent with the central argument of a recent book on conflict recurrence by Call (2012: 4), who argues that political exclusion is the crucial variable in explaining most cases of civil war recurrence. It also corroborates Walter’s (2004: 372, 385) finding that besides the improvement of basic living conditions, access to central political decisionmaking significantly decreases the risk of conflict recurrence. The result as such cannot answer the question of whether the high risk of renewed conflict is due to a grievance or an opportunity effect of the previous conflict. What it shows, however, is that the combination of a clear current grievance (political exclusion) with a situation in which a previous conflict may have left both emotional scars and a legacy of conflict-specific capital (opportunity) poses a threat. The conflict that started in 2005 between the Kurdish PJAK (Free Life Party of Kurdistan) and the Iranian government is a case in point. Since 1946, but in particular since the Iranian Revolution in 1979, Kurdish opposition forces have repeatedly challenged the state in order to create an autonomous Kurdistan and put an end to the discriminatory and assimilatory policies of the regime. Configurational model of ethnic conflict, 1990–2009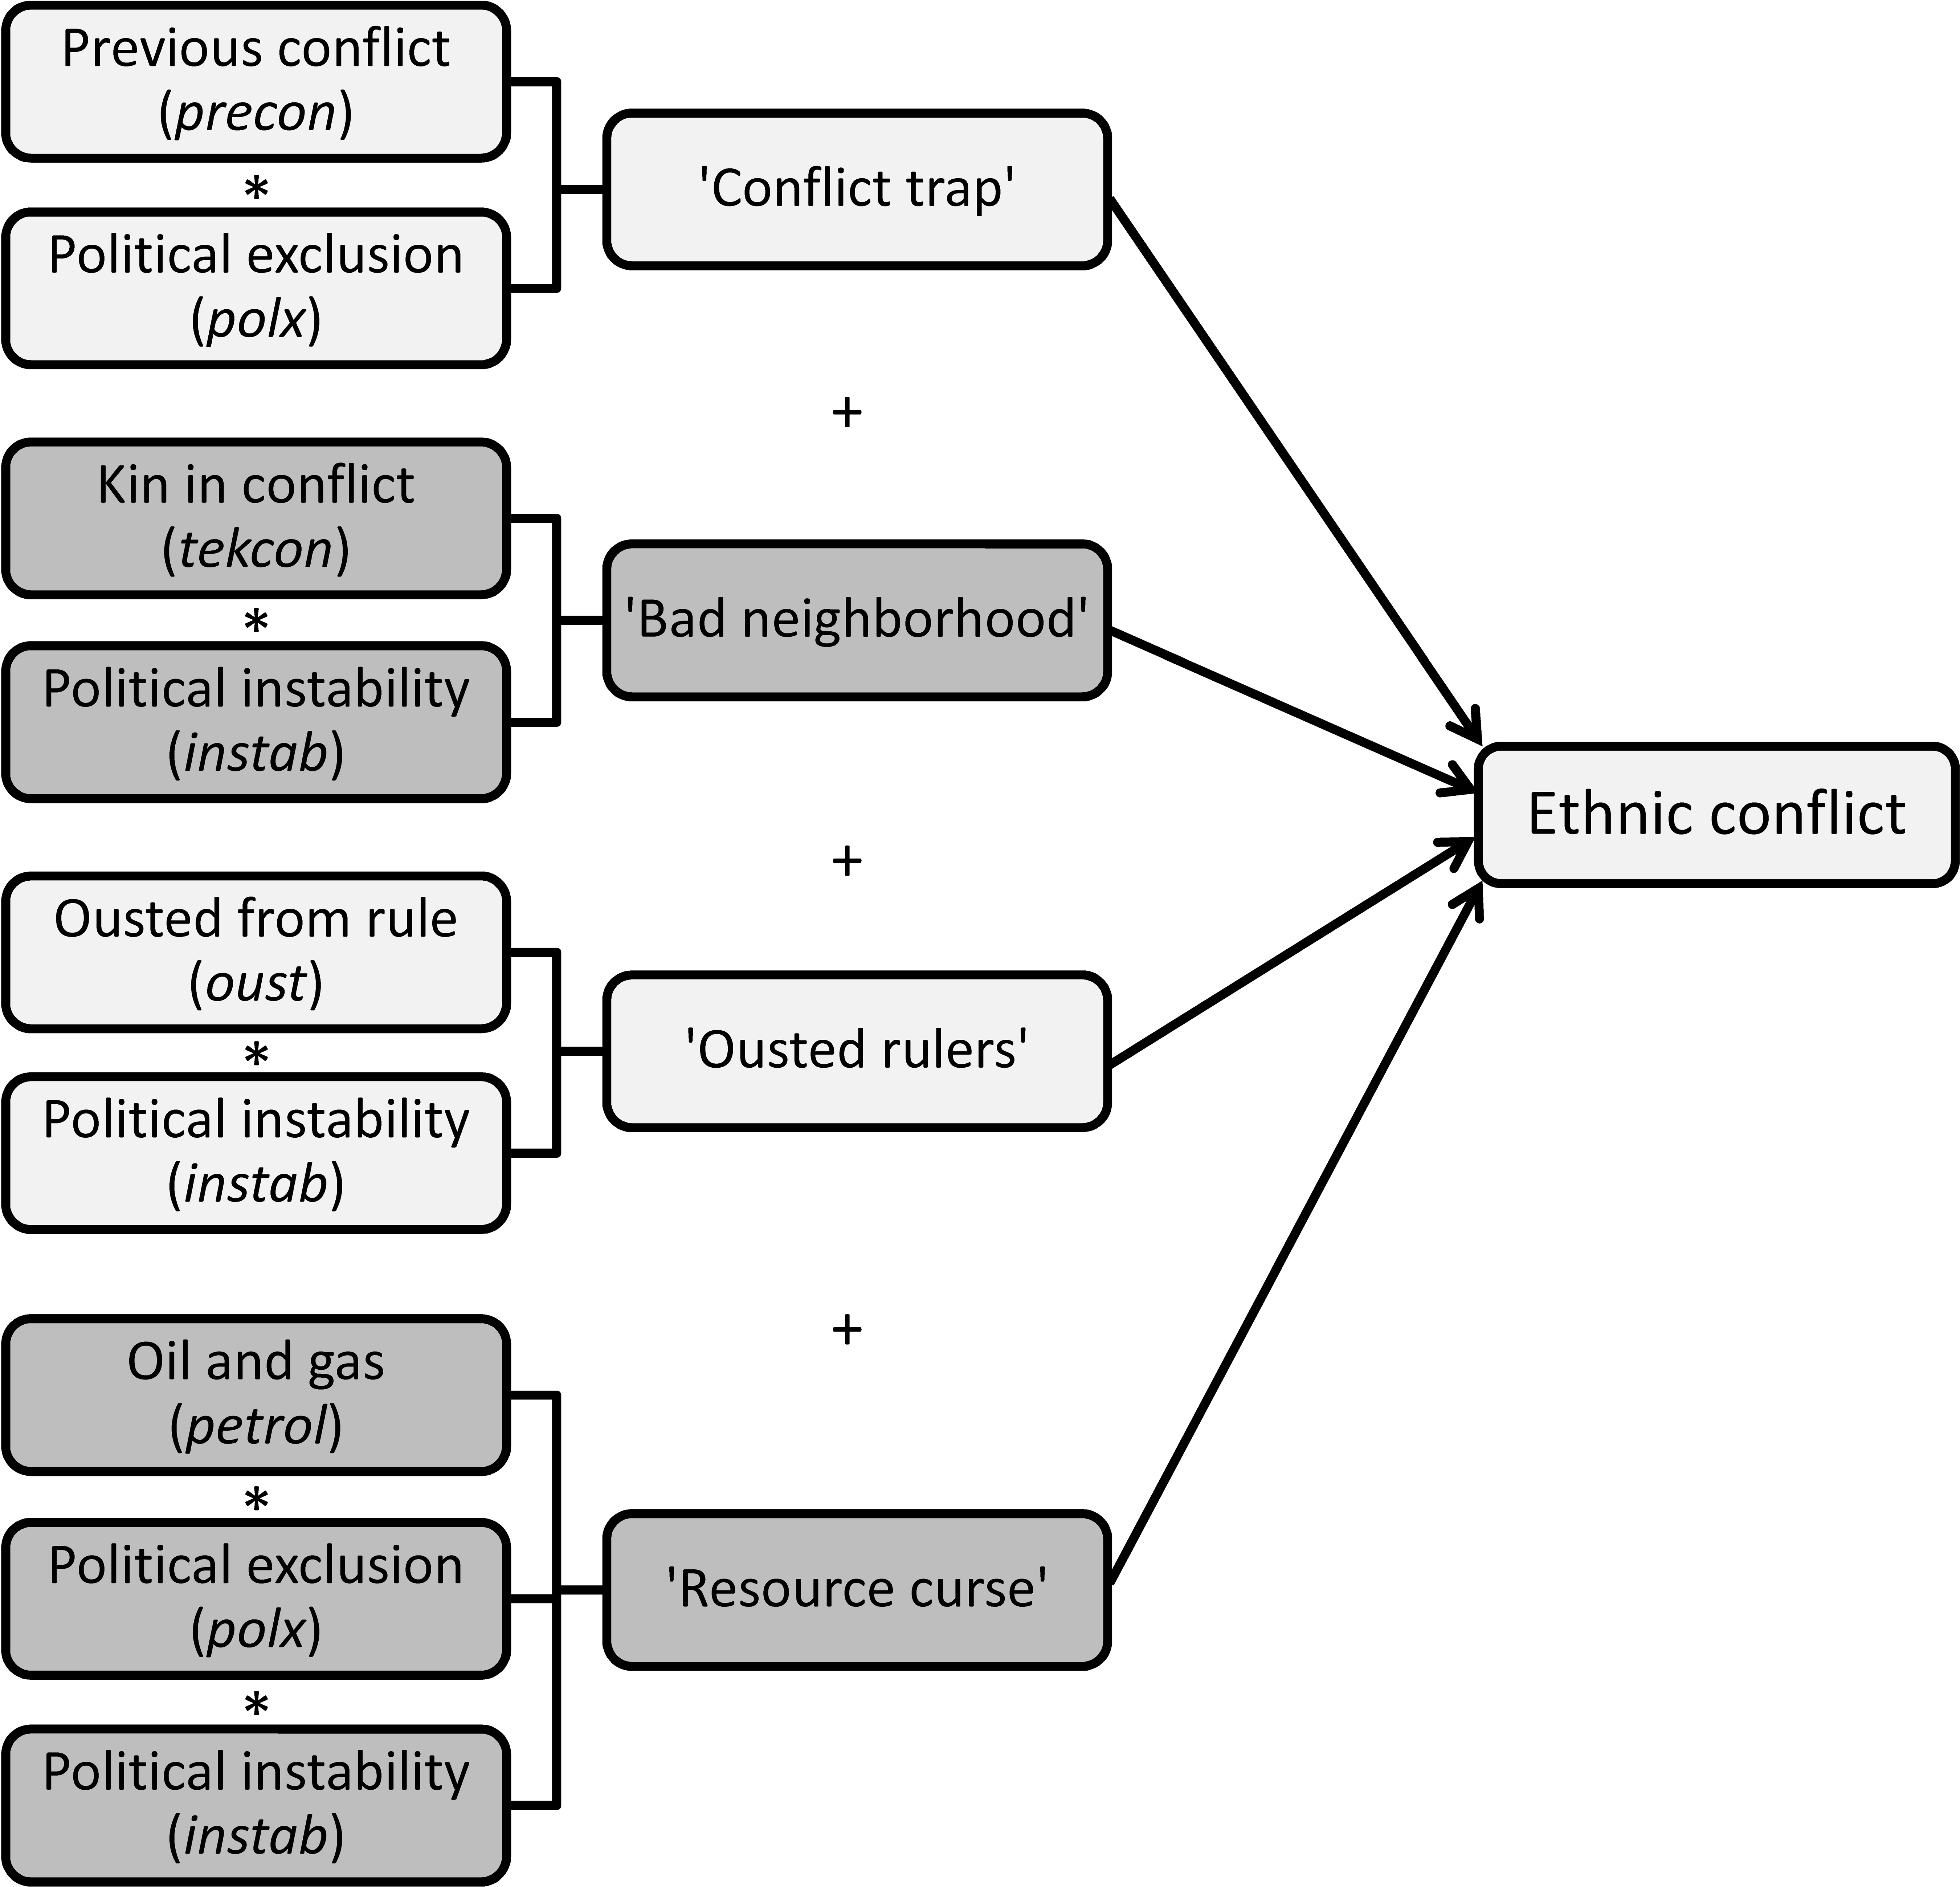
Bad neighborhood
The second configuration can be summarized as a situation of instability both at home and in the neighborhood. Ethnic groups who have warring ethnic kin across the border are likely to rebel themselves if the government at home is at the same time vulnerable because of regime change (consistency 0.77). With a coverage of 0.10, this configuration explains ten onsets in my sample. The finding is fully in line with recent research that has demonstrated an increased risk both for neighbors of a country in conflict (Buhaug & Gleditsch, 2008), and for ethnic groups who have kin groups across the border (Cederman, Girardin & Gleditsch, 2009; Salehyan, 2009). The fact that this condition is not equally dangerous for stable governments supports Buhaug & Gleditsch (2008: 230) who find that the risk of conflicts spilling over is the highest when the ‘host’ state already has a high baseline risk for conflict due to domestic characteristics. Braithwaite (2010) similarly finds evidence that state capacity modifies the risk of conflict contagion. Typical for this configuration is the rebellion by the Tutsi-Banyamulenge in the Democratic Republic of the Congo (DRC). The genocide of Tutsi and the subsequent change in power relations in neighboring Rwanda had a tremendous impact on the Tutsi in the DRC – a country that was already at the brink of anarchy when president Mobutu lost crucial support from his Western allies by 1996 (Prunier, 2009: 78–79). This is the only configuration that includes no unambiguous incentive condition, but in which an extraordinary opportunity structure seems to be sufficient for onset. This does not imply that there were no mass grievances, but they are not captured by the model.
Cases explained per quasi-sufficient configuration
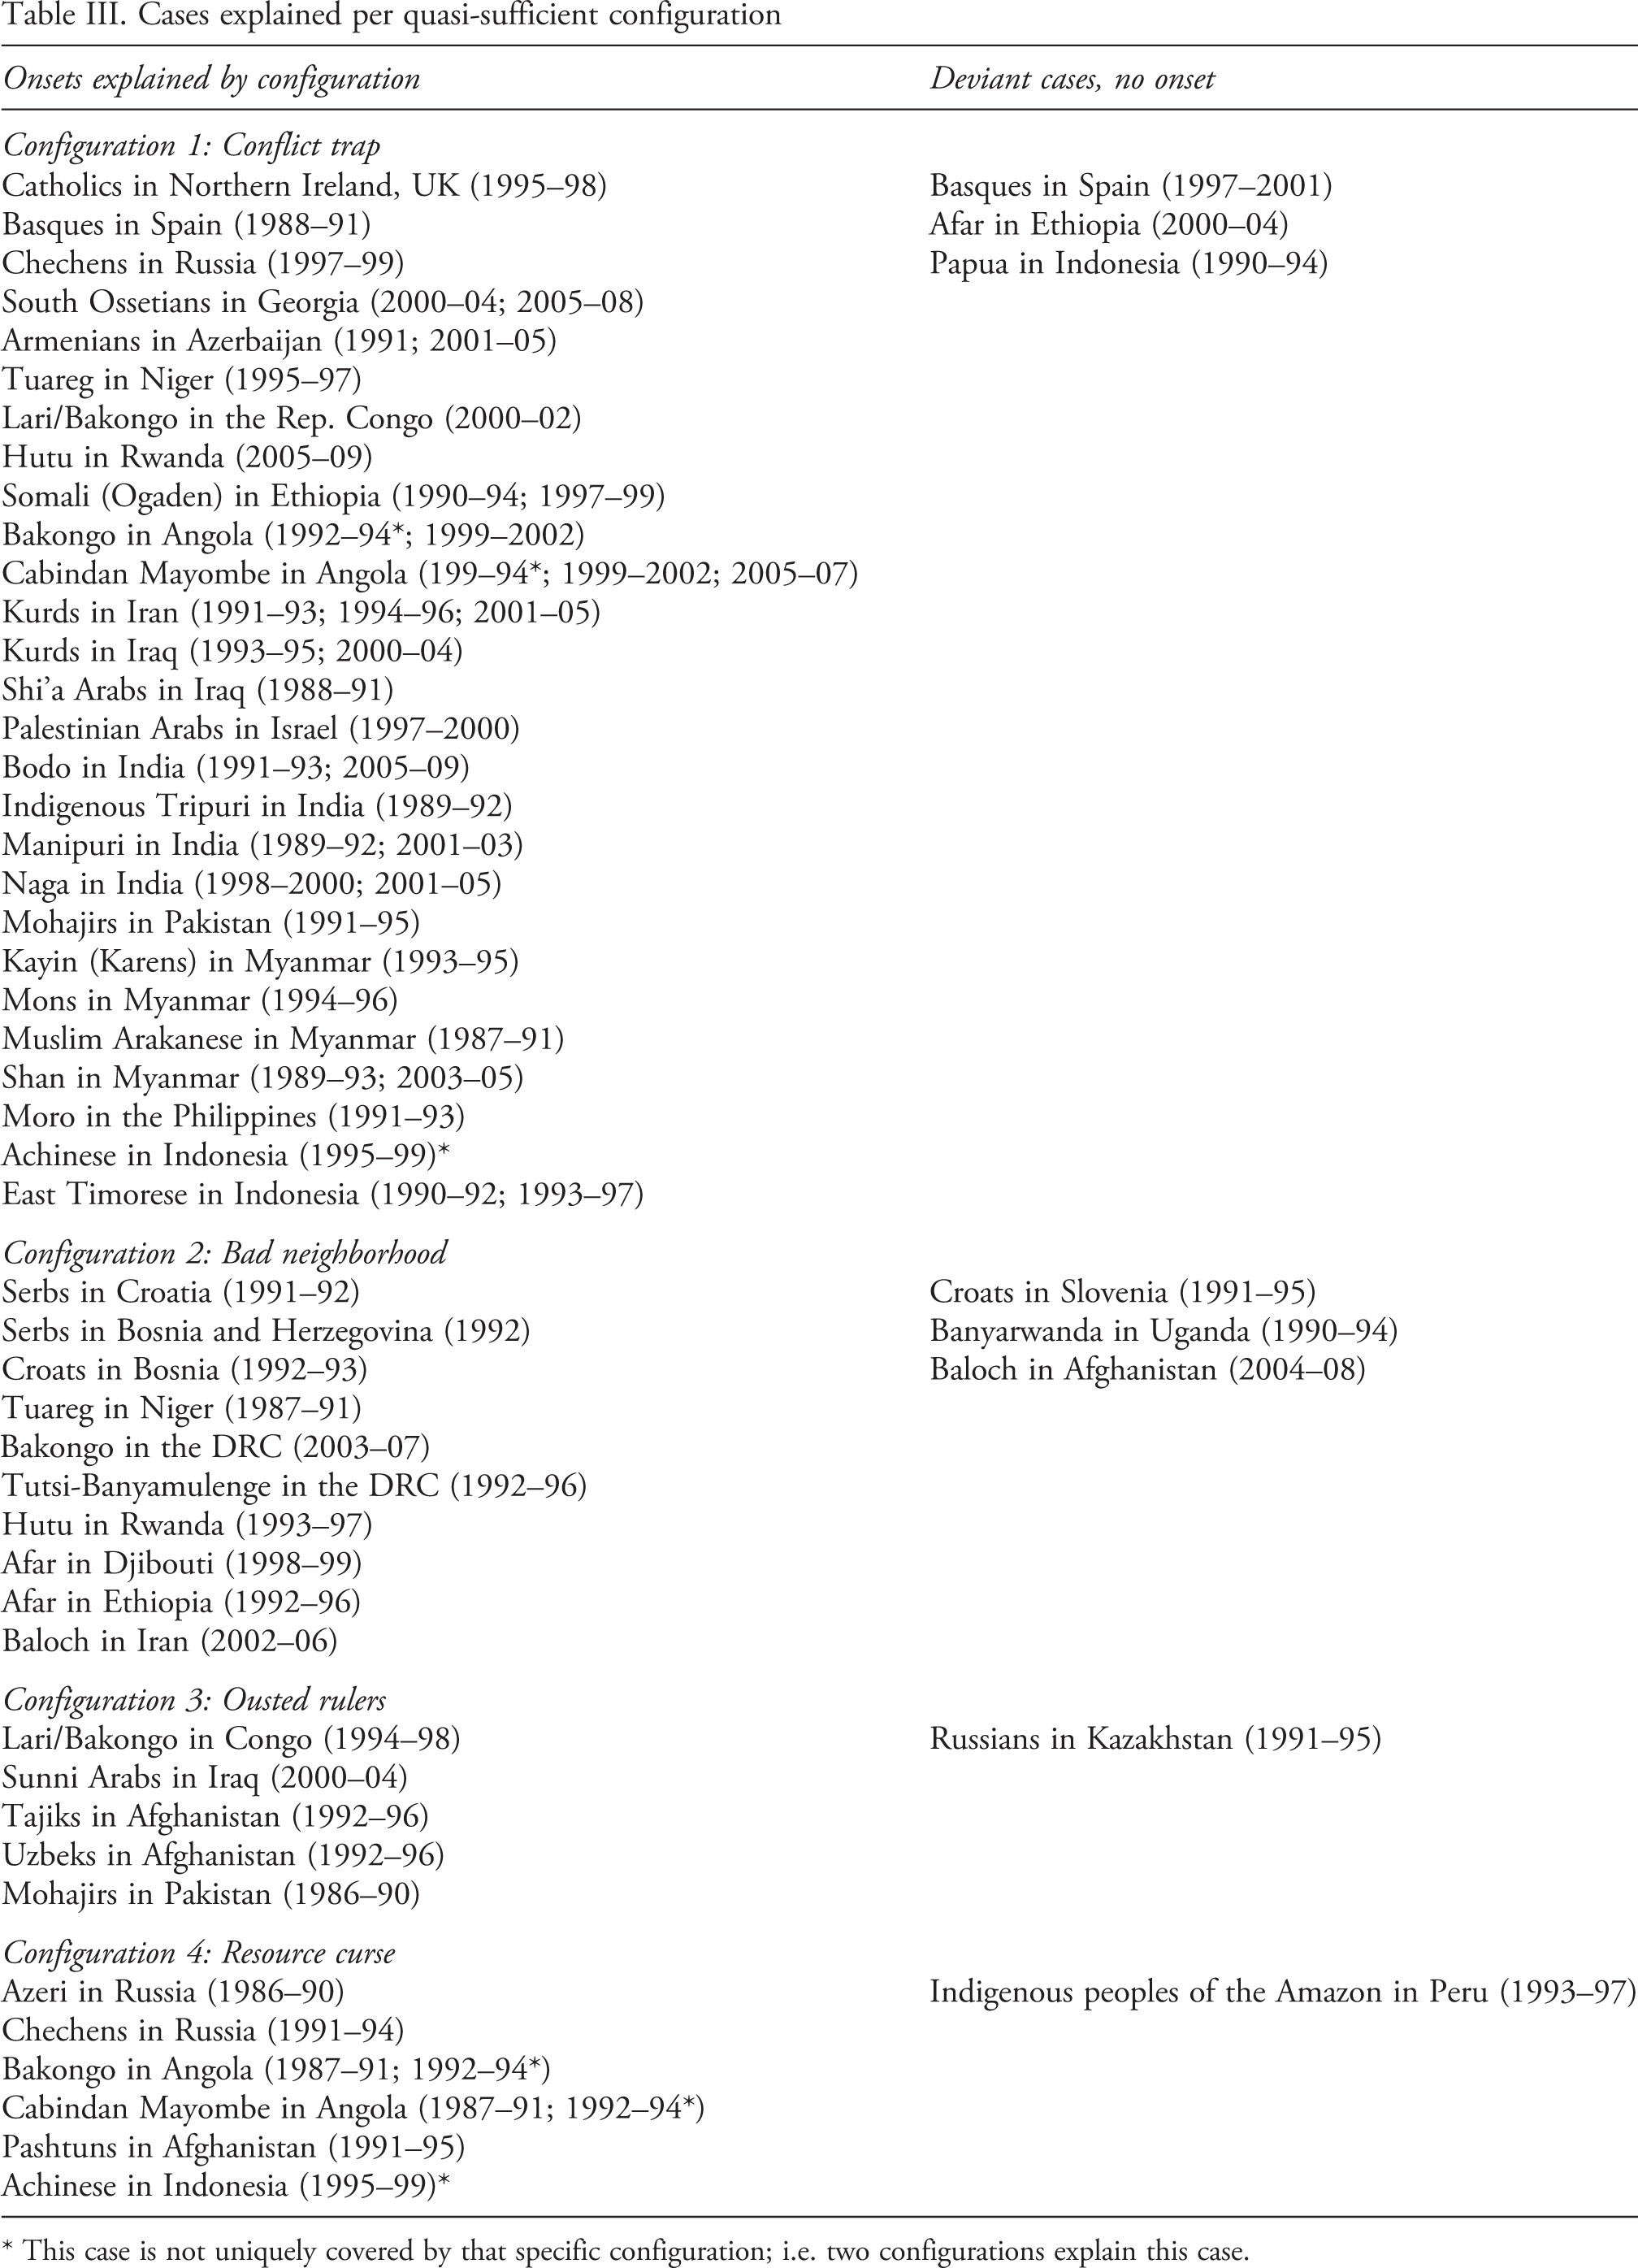
* This case is not uniquely covered by that specific configuration; i.e. two configurations explain this case.
Ousted rulers
The third configuration describes rebellions by groups who were recently excluded from central government power in a situation accompanied by political instability. Typical are the Sunni Arabs in Iraq in 2004, who lost the political advantages they enjoyed under Saddam Hussein’s regime when he was ousted in a US-led invasion of Iraq. With a coverage of 0.05, this configuration explains five conflict onsets in my sample at a consistency of 0.83. It supports research by Cederman, Wimmer & Min (2010: 104) who find that groups whose power status decreased during the previous two years are much more likely to rebel. They argue that anger and resentment are especially strong after a group loses power and prestige, especially when this anger can be directed at the ethnic group that is considered guilty of the ousting. Gurr (2000: 108) also posits that advantaged groups are at a special risk of being the target of reprisals and revenge once displaced from power, giving them an incentive to fight back. Again, in this configuration incentives (loss of power and privileges) and opportunities (political instability, resources still available to the ousted group) coincide to increase the risk of conflict onset.
Resource curse
The fourth path to conflict is when oil-rich but politically excluded groups can make use of the window of opportunity offered by political instability at the center. With a raw coverage of 0.08 this path explains eight conflicts at a consistency of 0.89. The finding supports the view that at the heart of both ethnic and non-ethnic conflicts is frequently a dispute about the control over natural resources. Oil and gas in particular are relatively unlootable commodities and as such only offer a benefit to those who have direct control over them, that is, the extraction firm and the government (Ross, 2003: 55–56). This makes the political exclusion condition in this path so salient. However, this lack of control over resources affects many groups who still do not rebel violently against the exploitation of their lands. It needs an extraordinary opportunity offered by the rupture of regime change to make the combination of natural resources and political exclusion quasi-sufficient for conflict. The movement by the Bakongo and Cabindan Mayombe for the independence of the Angolan enclave Cabinda is a typical case: Cabinda accounts for more than half of Angola’s oil production, yet neither the political power nor the economic welfare of the two groups have been positively influenced by these riches (Le Billon, 2001). At the same time, the presence of oil reserves may have influenced the strategic calculus of the rebels in Angola, fueling beliefs that ‘going it alone’ could be feasible and an independent Cabinda potentially prosperous (Humphreys, 2005: 511). When the instability caused by the country’s transition to multiparty democracy offered a window of opportunity in the early 1990s, the simmering conflict escalated.
Predicting conflict with QCA?
The results reported above and the rich theoretical interpretations they give rise to lend some legitimacy to the ontological assumption made at the outset of this article, namely that the causal relationships involved in ethnic conflict onset are complex. Nevertheless, it is the nature of ontological assumptions that we cannot empirically test whether they are right or wrong (Hay, 2008: 87–88). We can, however, assess the degree to which a model based on such assumptions is useful for policy purposes by testing its capacity to actually predict conflicts. Predictive capacity can also serve as a criterion for comparing the usefulness of competing models across methodological divides. To this end, I compare the predictive power of the QCA model developed in this article with a binary logistic regression model that is founded on very different ontological assumptions.
Equation (1) shows the specification of the binary logit model used for this comparison, where p is the predicted probability of onset contingent on the values of the independent variables. 16

This is a very naïve model with a linear predictor that is purely additive in the regressors, and more complex causal relationships could be modeled using interaction terms. The purpose here, however, was not to build a statistical model that mimics the type of causal relationships analyzed with QCA, but to compare two model specifications that are on the extreme ends of causal complexity as defined further above.
I use the two models to predict conflicts both in-sample and out-of-sample, using the same data. Out-of-sample prediction is the ability to predict conflicts outside the dataset that was used to fit a model in the first instance, often in a different time period. Because most data used in this article are not yet updated for the time period 2010–13, I instead refit both the QCA and regression analyses for the time period 1990–2004 in order to assess how well the resulting models predict the onsets that happened in the last period, 2005–09. The QCA solution for 1990–2004 is almost identical to the one for the full period: the same four paths are quasi-sufficient for conflict onset, with comparable consistency and coverage levels. 17
A good model in terms of predictive power correctly predicts as many onsets as possible (true positives) and at the same time makes few mistakes in the form of false positives, that is, predicting conflict where there was none (Ward, Greenhill & Bakke, 2010). Accordingly, two measures of predictive power are reported in Table IV: sensitivity is the fraction of all onsets that are correctly anticipated, while precision takes false positives into account by reporting the percentage of onset predictions that are correct.
Predictive capacities of QCA and binary logit models
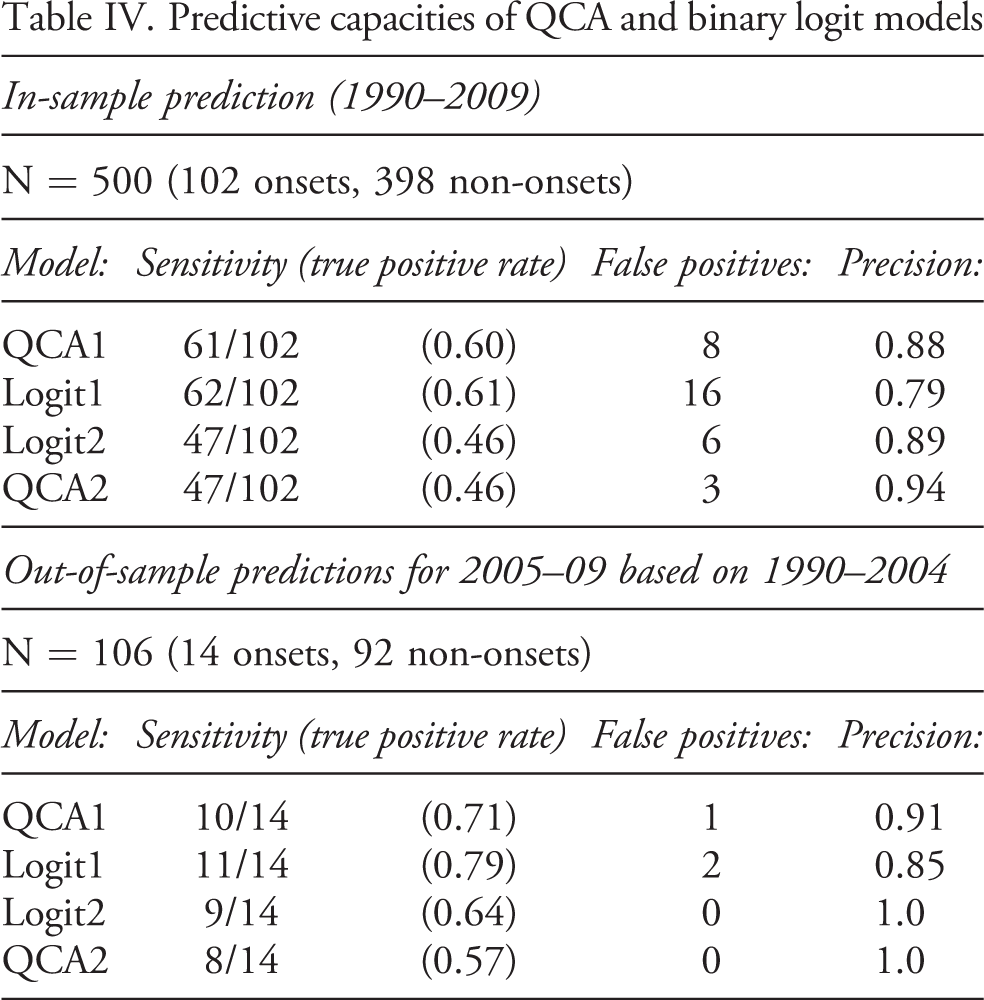
Table IV shows that the QCA model has a considerably better in-sample predictive capacity than the logit model, even at the sensitivity level at which the logit model performs best. The QCA solution correctly predicts 61 out of a total of 102 onsets. At this true positive rate, QCA makes eight mistakes, that is, predicts conflict for eight cases that did not experience an onset of ethnic conflict, while the logit model wrongly predicts 16 conflicts that did not happen. Even at the logit model’s optimum sensitivity, at which both models correctly identify 47 out of 102 onsets, the logit model still produces twice as many false positives as the QCA solution (six instead of only three).
While in-sample predictive power is a useful indicator for the validity of a model, out-of-sample prediction is an even more powerful evaluative tool, especially for policy purposes (Ward, Greenhill & Bakke, 2010). Both the QCA and logit models perform extremely well in the out-of-sample test, with their predictive capacities not differing much. The standard QCA solution (QCA1) correctly identifies 10 out of 14 onsets, and yields only one false positive. Because the logit model identifies two onsets at the same threshold of predicted probabilities, it correctly predicts 11 onsets, but produces an additional false positive. As I have chosen to give the same weight to true and false positives, the predictive capacity of both models is almost the same here. At its optimum, the logit model can predict nine out of 14 onsets without making a single mistake. Achieving this 100% precision with the QCA model requires a consistency cutoff of 0.75 in the estimation data truth table, resulting in a five-path solution that correctly predicts eight onsets in the period 2005–09.
To sum up, the QCA model fares equally well as the logit model in the out-of-sample prediction, and considerably better in the in-sample prediction. 20 Given the low number of onsets in the test sample, the out-of-sample results have to be treated with caution and should be retested once data on further time periods become available, but these preliminary results suggest that the assumptions of causal complexity at the heart of this article are warranted.
Conclusion
This article set out to enrich – and hopefully overcome – the incentive–opportunity debate by exploring how incentives and opportunities combine to give way to ethnic conflict. The patterns that were identified suggest that it may be time to abandon the either/or framing of the debate in favor of a more inclusive approach. The ‘resource curse’ pattern in particular is a textbook example of incentives and opportunities coinciding at a certain point in time to facilitate violent uprising: the ethnic groups in question had a reason to rebel (grievances induced by political exclusion and possibly by the oil and gas resources on their territory), and did so when a window of opportunity opened up through political instability at the center. At the same time, there are clear limits to the interpretation of risk patterns in terms of incentives and opportunities in a macro-level study like the current one, and assessing the causal mechanisms by which explanatory factors really contribute to conflict risk would require more in-depth case analyses. What this study has undoubtedly demonstrated, however, is that a complexity-oriented approach to the explanation of ethnic conflict is fruitful both for explaining and predicting conflict onset.
QCA is an outcome-oriented method, that is, it is targeted at finding explanations for outcomes rather than identifying average effects of causes (Ragin, 2000: 32–33, 39). For policy purposes, this feature of QCA has the advantage that results directly correspond to actual outcomes of individual cases, which permits the scholar to easily communicate research findings to policymakers. The real added value of QCA for conflict studies, however, is the ability to identify multiple paths to conflict, for even if conventional statistical models can incorporate more complex relationships using interaction terms, they do not help us identify these relationships in the first place, and certainly they do not easily lend themselves to the identification of substitutable (equifinal) paths to conflict.
Another policy-relevant aspect is the quasi-sufficiency of the risk patterns identified: that a specific combination of risk factors leads to conflict most of the time is powerful knowledge. The price of this confidence about the consistent effect of some causal patterns is that we can say nothing at all about the 41 conflict onsets not covered by the model. 21 Omitted explanatory factors are most probably responsible for this lack of coverage, especially on the incentive side. Sixteen out of the 41 non-covered cases are coded as politically included. A brief look at them suffices, however, to see that their political inclusion is either just a ‘token inclusion’, for example in the transition to multiparty democracy, or that even the full inclusion of some political leaders of an ethnic group may not be able to offset the pervasive feeling of economic disadvantages and cultural discrimination of the masses – both conditions not accounted for in this study. Future research should expand this configurational model of ethnic conflict and try to cover more conflicts not currently explained.
More generally, however, further research should capitalize on the added value of a complexity-oriented approach. Methodological avenues to be explored are those that are suitable for the type of pattern-seeking employed here, such as cluster analysis (Cooper & Glaesser, 2011), or methods that avoid strong parametric assumptions, such as Kernel Regularized Least Squares (KRLS) (Hainmueller & Hazlett, 2014) or neural network models (Beck, King & Zeng, 2000). After all, this article has demonstrated how evaluating the predictive capacity of different models may be a way to compare our empirical results even if we do not use the same methodological approaches, thus facilitating communication across methodological boundaries.
Footnotes
Replication data
All results in this article were generated using the R software, and in particular the QCA package for R, v1.0-5 (Thiem & Duşa, 2013). Datasets, code, and supplementary documentation are available from  .
.
Acknowledgments
I thank Seraina Rüegger and Philipp Hunziker for sharing their data with me early on in the production of this article. Hunziker also provided essential help with the predictions. I am indebted to Gudrun Østby and three anonymous referees, whose in-depth engagement with previous drafts has helped me take this article to the next level. Thanks also to Andreas Wenger and the PhD group at the Center for Security Studies, and to Alrik Thiem, Sebastian Schutte, Carsten Q Schneider, and the participants at the 2013 QCA Expert Seminar in Budapest.