




Abstract
Military power is central to diplomacy and much of international relations, yet common quantitative measures have limited surface validity. This limitation stems from focusing on latent power and only indirectly incorporating major weapon systems. I contend that weapons are central to military power and present a new measure of country military power based primarily on armaments. The measure includes major naval, air and land weapons as well as nuclear weapons and ballistic missile capability. I examine the surface, content and context validity of the measure and compare it to existing measures. I show that this measure of material military power (MMP) has more surface and context validity than alternative measures. I find that MMP better predicts war outcomes, better accounts for militarized threats, and performs well as a control variable for country power.
Keywords
Introduction
Military power animates much of world politics. Political leaders use their country’s military power to threaten, conquer and defend from attack. Several critical concepts in international relations are a function of military power, such as the balance of power between countries, polarity, shifting power, the probability of victory in war, and arms races. Our understanding of much of world politics depends greatly on how we measure military power.
Common large-N measures of military power focus too much on demographic and economic aspects. Owing to demographic factors, the Correlates of War Composite Indicator of National Capabilities (CINC) ranks China as the top military power in the world from 1999 to 2016 (Singer et al., 1972), but the United States has significantly more aircraft carriers, advanced fighter aircraft, nuclear attack submarines and missile cruisers than China in this period (Saunders & Souva, 2020; Crisher & Souva, 2014). A recent measure proposed by Beckley (2018) addresses some concerns with the COW CINC measure, but it has its own limitations, largely because it is a measure of latent and not actual military power. The Beckley (2018) measure considers Japan and Germany as militarily stronger than Britain, France and Russia in this period, despite the former not having and the latter having aircraft carriers, nuclear attack submarines, ballistic missiles and nuclear weapons.
This research presents a new measure of military power for all country-years from 1865 to 2019. The measure, material military power (MMP), differs conceptually from common quantitative measures of military power in two important ways. First, MMP focuses on the military. The most common large-N measures focus more on economic and population indicators. Second, the primary focus of MMP is a country’s weapons systems. As such MMP includes multiple military components not found in extant measures. The focus on weapons systems also makes MMP a measure of actual and not latent military power.
MMP has considerable surface and context validity. For example, based on MMP, the United States has the strongest military in the world since 2000. The MMP measure also indicates that France, Great Britain and Russia are more militarily powerful than Japan and Germany in the 21st century. With respect to context validity, I find that MMP better predicts war outcomes and the making of militarized threats than broader measures of national power or an indicator based on military expenditures. MMP performs on par with most measures of national power or military expenditures as a control variable in extant models.
In addition to its comparatively strong validity, MMP has a broader range of relevant uses than other measures of military power. Researchers can use MMP to identify the strongest military powers in the world, describe the distribution of world power, forecast changes in a country’s power, create dyadic power ratios, and explain the occurrence and outcomes of crises and militarized conflicts.
Measures of military power
Military power is the source of power that actors use to make violent threats against others or to inflict damage on others or their own property. Measuring military power is difficult because the concept is complex. Like the broader concept of power, military power has multiple ‘bases’ (Dahl, 1957: 203). The most important bases of military power are weapons, troops, training, tactics, logistical resources (e.g. transportation, fuel), strategy and organization. Each is difficult to measure and varies in quantity and quality and the integration of them represents the immediate actual base of military power.
The Correlates of War (COW) Composite Indicator of National Capabilities (CINC) (Singer et al., 1972) is a common measure of military power, but it is really a broader measure of national power – the stock of resources a country possesses that allow it to influence others. CINC includes military factors, but economic and demographic factors significantly influence this indicator. For example, owing to its reliance on demographic factors, CINC greatly overstates the military strength of populous countries such as China in the late 19th and early twentieth centuries (Beckley, 2018).
Recently, Carroll & Kenkel (2019) created a measure for ‘p’, the probability of winning a dispute. Their measure, dispute outcome expectations (DOE), comes from a machine learning model that maximizes out-of-sample predictions of dispute outcomes. DOE explains dispute outcomes better than CINC and performs better than CINC as a control variable (Carroll & Kenkel, 2019). Notwithstanding its benefits, DOE has limitations. First, it is a dyadic measure; as a result, it is not useful for assessing country military power, militarization, or predicting changes in a country’s power. Second, it cannot be used to explain dispute outcomes, as those outcomes were used to create the measure. Explaining and predicting conflict outcomes, however, is of significant interest to many. Third, DOE is a function of economic, military and demographic factors. This makes it a useful composite measure, but it also makes it difficult to know which of these is most important in a particular application.
Beckley (2018: 9, 14) also introduces a new measure of national power. Based on the concept of ‘net resources’, it is elegantly simple and straightforward. It is the product of a country’s gross domestic product (GDP) and its gross domestic product per capita (GDP per capita). He shows that this net resource measure of power better predicts war outcomes than CINC or GDP and that when a control variable for power is present in an empirical model, the net resource measure generally improves model performance compared to CINC and GDP. Anders et al. (2020) introduce a similar measure: surplus domestic product (SDP). While net resources and SDP have significant advantages over CINC for understanding latent power, they are less relevant for understanding a country’s current military power. Net resources and SDP are essentially measures of country wealth. ‘Wealth provides the basis for international power, but it is not synonymous with power’ (Mastanduno et al., 1989: 463). Below I show that these indicators are less useful than MMP for explaining the use of military threats. Further, as measures of latent power they cannot tell us how militarized states are – a robust correlate of conflict (Bremer, 1992).
The empirical bet of this research is that by focusing more directly on major weapons systems we can create a better measure of country military power.
Measuring material military power
‘Diplomacy without armaments’, Frederick the Great noted, ‘is like music without instruments’ (Blainey, 1988: 108). Armaments are not the only aspect of military power. Troops, training, tactics (Grauer & Horowitz, 2012), logistics and civil–military relations (Narang & Talmadge, 2018) are also relevant. Nevertheless, weapons systems are both critical to military power (McNeill, 1984; Parker, 1996) and easier to measure. 1 Giergerich et al. (2018) also suggest that for a ‘basic judgement’ about a country’s military power, ‘it should suffice to examine its core capability portfolio’.
Material military power (MMP) is a function of a country’s naval, air, land and nuclear weapons and ballistic missiles. Naval power is measured as a country’s annual share of world naval warship tonnage. The measure encompasses aircraft carriers, battleships, destroyers, cruisers and submarines, all major surface vessels and submarines with at least 1,000 tons displacement. Data come from Crisher & Souva (2014) and cover the period 1865–2019. To measure airpower, I use the indicator created by Saunders & Souva (2020). Their measure is based on the sum of a country’s fighter and attack aircraft weighted by generation. Thus, a fifth-generation stealth fighter contributes considerably more to the measure than a third-generation MiG-21. Data cover the period 1965–2019 and are measured in annual world shares.
Land power 1 is the sum of a country’s tanks, armored personnel carriers and fighting vehicles. I focus on mobile armor for two reasons. First, in ground warfare since World War II ‘the most important single weapon is the tank’ (Van Creveld, 2010: 273). Tanks and other armored vehicles are central to maneuver warfare (Reiter & Meek, 1999: 374-5), which may be associated with an increase in conflict initiation (Mearsheimer, 1985; Reiter, 1999). Second, mobile armor is also the focus of recent research on army force structure (Sechser & Saunders, 2010) and counterinsurgency success (Lyall & Wilson, 2009). Thus, this data may also be useful to those research programs. Data come from the Military Balance (various years) and were recorded at five-year increments for the period 1975–2020. I linearly interpolate values between the five-year increments.
For the pre-1975 era, I create a proxy measure of land power (land power 2). I assume that a country’s total military expenditures equals its spending on naval weapons, air weapons, land weapons and personnel. I then use a three-step algorithm to create a measure of land power. 2 First, I calculate a country’s share of non-land weapons expenditures. This value is a ratio in which the numerator is the sum of a country’s world share of naval power, airpower and military personnel; the denominator is the sum of naval power, airpower, personnel and military expenditures. Personnel and expenditure data come from the National Material Capabilities data version 6 (Singer et al., 1972). Second, I subtract this value from 1. The resulting no. represents the percentage of a country’s military expenditures that go to land weapons. Third, I multiply the percentage from step two by that country’s annual share of military spending. The resulting no. is a country’s annual share of world land weapons expenditures. 3
Missile power is a five-category ordinal measure of the maximum range of a country’s ballistic missiles. Countries that do not have ballistic missiles receive a score of 0. Countries who only have short-range ballistic missiles (less than 1,000 km) score 1 on this indicator. The possession of medium-range ballistic missiles (1,000–3,000 km inclusive) gives a country a score of 2, intermediate-range (3,001–5,500 km) is scored as 3, and countries with intercontinental ballistic missiles (more than 5,500 km) receive a score of 4. As with the other components, I transform the ordinal variable into annual world shares. Ballistic missile data come from Mettler & Reiter (2013), which I update through 2019 using data from Arms Control Association (Davenport, 2017) and country and missile reports from the Center for Strategic and International Studies (2021) and the Nuclear Threat Initiative (2021).
To create a measure of nuclear weapons power, I first created a four-category ordinal measure of the approximate no. of nuclear warheads a country possesses, where 0 is equal to no nuclear weapons, 1 means a state has at least one but fewer than 200 nuclear weapons, 2 means a state has between 200 and 550 nuclear weapons, and 3 means a state has over 550 nuclear weapons. An ordinal measure is better than a binary indicator for possession of nuclear weapons as it provides some variation over time and allows us to distinguish between the superpowers, the only countries with more than 550 nuclear weapons, and others, as well as between countries with a few nuclear weapons versus countries with a moderate no. 4 I then transform the ordinal variable into annual world shares of nuclear weapons. Data on nuclear weapon stockpiles come from the Bulletin of Atomic Scientists and cover the period 1945–2019 (Kristensen & Norris, 2013; Zala, 2019). I use Bell & Miller (2015)’s coding for the first year a country has nuclear weapons.
Because of the relationship between nuclear weapons and ballistic missiles 5 and to reduce the variance and skewness of these components, I take the average of these two components before including it in the final calculation. Practically speaking, this gives each of these components half the weight of the other components. The averaging of these two components is especially helpful prior to the mid-1970s, when fewer than ten countries have these weapons. If one does not average these components prior to the final calculation, one will likely overstate how much power a country has. For example, from 1945 to 1948, the United States is the only country with nuclear weapons, giving it a 100% share on this component. Similarly, from 1947 to 1950, the Soviet Union is the only country with ballistic missiles. Taking the average of nuclear weapons and ballistic missiles balances out these factors in this time period. Other analysts are free to choose alternative aggregation protocols with the data supplied here. Finally, I use the four indicators just described to create a country-year measure of military power for the period 1865–2019. 6 MMP is a country’s annual average of naval, air, ballistic missile/nuclear weapons and land power. 7 Table I summarizes the indicators in MMP for each time period. The dataset includes each subcomponent as well as the composite MMP indicator. Users may create alternative aggregate indicators based on these components.
Components of material military power (MMP) by time period

MMP is the mean of annual world shares of the specified components for each time period. Land power 1 is based on world shares of mechanized armor vehicles.
Land power 2 is an estimate of land power.
A measure should be judged based on its reliability and validity. MMP has high reliability in the same sense as the major alternative measures of military power. Armed with the data for each component, one can easily recreate it. Like its competitors, MMP is based on a transparent process and its component data are readily available. In the next section I assess the validity of the MMP measure and compare it to other large-N power indicators, specifically net resources, DOE, and the COW military expenditures indicator. Net resources and DOE have each proved superior to the COW CINC indicator as measures of power. Military expenditures is rarely used as an independent variable or a measure of military power in quantitative conflict research, but it is a straightforward measure of military power and does not have the major demographic drawbacks of the CINC indicator.
Surface validity
Since 1971, when the People’s Republic of China was given China’s UN Security Council seat, MMP has identified the permanent members of the UN Security Council as the top five military powers. This is not the case for the net resources or military expenditure measures. The MMP and net resources measures show Israel as stronger than Egypt for the 1967 and 1973 wars; military expenditures does not. Net resources and military expenditure measures ranked Kuwait as stronger than Iraq in 1990. MMP says that Iraq had considerably more military power. As these examples illustrate, MMP has credible surface validity.
The land power indicators also seem to have reasonable face validity. The Soviet Union, for example, has greater land power than the United States during the Cold War, 1947–1990. Israel has greater land power than Egypt in 1973. Similarly, China has very little land power in the late 19th and early 20th centuries. The most common measure of army strength in quantitative research is Rasler & Thompson (1984)’s army size measure, but it is only available for eight countries since 1870 and has some questionable rankings. Using this indicator, Levy & Thompson (2010) record Russia as the strongest European army from 1915 to 1924. The indicator proposed here suggests Germany had the strongest army from 1914 to 1917 and France slightly stronger than Germany in 1918, which seems more consistent with the results of World War I.
Context validity
Military power and war outcomes
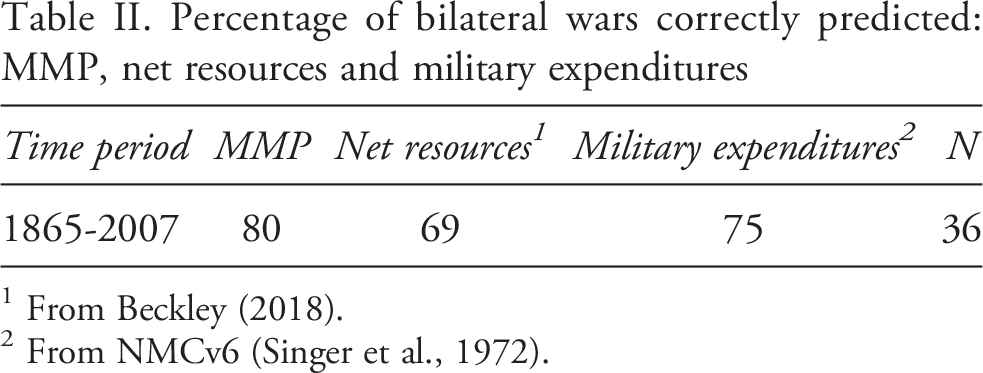
Blainey (1988: 113) famously wrote that ‘warfare is the one convincing way of measuring the distribution of power’. This is only true if one has an expansive and tautological definition of power. The problem with Blainey’s statement is that things like force structure, strategy, training and civil–military relations should be viewed as distinct from military power, otherwise we cannot analytically discriminate between these concepts. Nevertheless, Blainey’s statement contains a nugget of truth. A worthwhile measure of military power should have a positive correlation with victory in war. To evaluate the relationship between MMP and victory in war, I follow the same procedure as Beckley (2018). If one country has more power than the other, then it should be more likely to prevail in war. My list of wars and war participants comes from the Interstate War Data (Reiter et al., 2016).
Percentage of bilateral wars correctly predicted: MMP, net resources and military expenditures
1 From Beckley (2018).
2 From NMCv6 (Singer et al., 1972).
Military power as a control variable
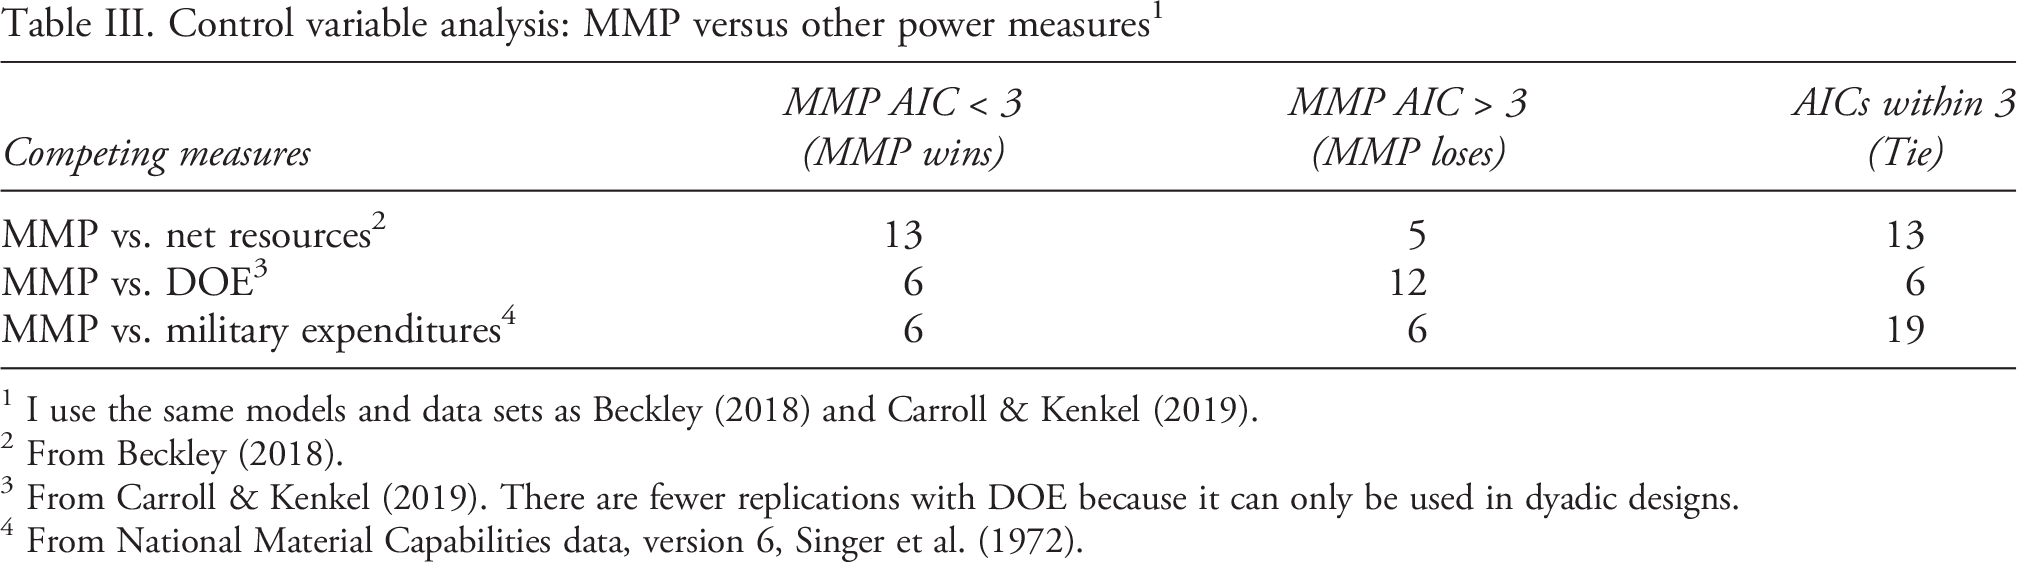
It is common for international relations research to include an indicator for military power in an empirical model. I compare the performance of MMP as a control variable with other measures of power in 31 studies. I focus on differences in Akaike Information Criteria (AIC) (Akaike, 1998). AIC is a measure of the distance between a true model and the data; thus, lower AIC scores are preferred. If a model with one measure of power has an AIC at least three points less than the model with another measure of power, then I record that measure as outperforming the other (Burnham & Anderson, 2004). If the difference in AIC is less than three points, I report no difference in model performance.
Control variable analysis: MMP versus other power measures1
1 I use the same models and data sets as Beckley (2018) and Carroll & Kenkel (2019).
2 From Beckley (2018).
3 From Carroll & Kenkel (2019). There are fewer replications with DOE because it can only be used in dyadic designs.
4 From National Material Capabilities data, version 6, Singer et al. (1972).
AIC values for models of threat initiation: MMP versus other power measures

1 From Beckley (2018).
2 From Carroll & Kenkel (2019).
3 From Sechser (2011).
4 From Maoz et al. (2019).
5 From Singer et al. (1972).
Military power and militarized threats
As a final application, I examine the relationship between military power and militarized threats. As noted previously, diplomacy often involves the threat of military force. As the practitioner Frederick the Great and the scholars Blainey (1988) and Schelling (1966) recognized, the threat and limited application of military power is central to much of international relations. Dahl made a similar point. Power ‘must be exploited in some fashion if the behavior of others is to be altered. The means or instruments of such exploitation are numerous; often they involve threats or promises to employ the base in some way and they may involve actual use of the base’ (Dahl, 1957: 203). If MMP is a valid measure of military power, then it should have a robust correlation with the making of military threats. To assess this expectation, I posit the following logistic regression model of militarized threat initiation:

The unit of analysis is the directed-dyad-year. I examine politically relevant dyads and two different dependent variables. The first is the initiation of a dyadic militarized interstate dispute (Maoz et al., 2019). The second is the initiation of a militarized compellent threat (Sechser, 2011). (In the Online appendix I describe the operationalization of each variable as well as the data sources.) We are interested in whether a model with military power measured using MMP performs better, worse, or about the same as a model with other measures of military power. As before, the measure of performance is the Akaike Information Criteria (AIC).
Table IV summarizes this analysis of threat models. Models with MMP outperform models with net resources or DOE for each measure of threat. Models with MMP and military expenditures perform about the same when threat is measured with the militarized compellent threat data, but models with MMP perform better than military expenditures when threat is measured with the dyadic militarized interstate dispute data. While not shown in Table IV, MMP (sum of State A and B and A’s share of dyadic power) is statistically significant and positive in all models. As relative military power increases, a country is more likely to initiate a militarized threat.
Discussion and conclusion
Military power is a central concept in international relations, yet it is difficult to measure. In large-N research, researchers often employ broad measures of power that emphasize economic and demographic features. I propose a measure of military power based primarily on weapons systems. The resulting measure, called material military power (MMP), incorporates data on naval warships, fighter aircraft, tanks and armored fighting vehicles, ballistic missiles and nuclear weapons.
As a measure of country military power, MMP has better surface validity than alternative large-N measures. MMP, for example, identifies the United States as the world’s strongest military power today and identifies the permanent members of the UN Security Council as the top military powers in the world. As a measure of military power, its substantive components are more valid than broad measures of national power. Further, MMP correctly predicts a higher percentage of bilateral wars than economic measures of power or a measure based only on military expenditures. When used as a control variable, models with MMP perform slightly better than models with net resources, but not quite as well as DOE (Carroll & Kenkel, 2019). When including a control for power, researchers will have to think carefully about what aspects of power they want to control for. Finally, I find that MMP performs better than net resources, DOE and military expenditures in models of threat initiation.
In conclusion, MMP will be especially useful for understanding variation in military power across countries and over time, comparing military to economic power, forecasting changes in military power, understanding the effects of force structure and the relationship between military power and conflict processes.
Footnotes
Replication data

Acknowledgements
I thank the editor, reviewers, Justin Conrad, Brian Crisher, Richard Saunders and Matthew Smith for helpful comments that improved this manuscript. I also thank Jordan Nicolson and Matthew Hermele for excellent research assistance. All errors are my responsibility.
Funding
The author(s) disclosed receipt of the following financial support for the research, authorship, and/or publication of this article: I gratefully acknowledge support from Florida State University for a grant to assist the writing of this manuscript.