
Abstract
Objectives:
Some everyday products, particularly over-the-counter drugs, which are sold in supermarkets and other stores can produce a “high” or serve other roles in illicit drug use. Informed by CRAVED, a model of theft choices derived from crime opportunity theory, this study explores whether products with known roles in drug use are shoplifted at higher rates than other products.
Methods:
Products that serve a variety of roles in illicit drug use were identified through a review of the medical literature and web sources. Data from 204 supermarkets yielded theft rates for 551 of these products, which were compared with theft rates for 7,887 products sold by the same stores without known roles in drug abuse.
Results:
Theft rates of products with roles in drug use were significantly higher than theft rates of other products.
Conclusions:
Knowing which products are shoplifted can provide only limited information about the shoplifter’s “craft.” In this case, more information was needed about the security given to products by the stores, which has broader implications for CRAVED. Despite this, the findings about the higher theft rates of products with known drug roles could assist retailers, manufacturers, and responsible government agencies to secure these products from theft.
Introduction
Informed by CRAVED, a model of theft choices derived from crime opportunity theory (Clarke, 1999), this study this study draws a link, not previously investigated, between two well-established facts about drug abuse. The first is that illegal drug users commonly commit theft to support their drug habits (Anglin and Perrochet 1998; Bennett, Holloway, and Williams 2001; Caulkins et al. 1997; Chaiken and Chaiken 1990; Goldstein 1985; Harrison 1992; Jofre-Bonet and Sindelar 2001; MacCoun, Kilmer, and Reuter 2003; Nurco 1998; White and Gorman 2000). Which forms of theft they favor, and what they steal depends on their motives, skills, and resources. Drug users and addicts often shoplift because it is relatively easy to commit, is hard to detect, and attracts less serious sanctions than burglary or robbery. Thus, prolific burglars often refer to shoplifting as a “fallback crime,” committed to further their drug habits (Schneider 2005; Sutton 2010).
The second well-established fact is that the misuse of some everyday consumer products, or fast-moving consumer goods 1 (FMCGs), constitutes a serious health problem (Crouch, Caravati, and Booth 2004; Johnson et al. 2007; U.S. Centers for Disease Control and Prevention 2010), affecting many countries in the world (Cooper 2013 2 ; King, Vidourek, and Merianos 2013). Many of these products are over-the-counter (OTC) drugs whose misuse is a growing public health problem, especially for juveniles and young adults (Vidourek, King, and Burbage in press). Emergency room visits related to OTC drug abuse have increased substantially due to unintentional poisonings (King et al. 2013). In the United States, estimates indicate an 81 percent increase in the number of emergency room visits related to OTC drug abuse (U.S. Substance Abuse and Mental Health Services Administration 2009, 2011). These visits generally are patients presenting with symptoms including, but not limited to: acute psychosis, euphoria psychosis, neuropsychiatric symptoms, tachycardia, agitation, gastrointestinal disturbances, somnolence, coma, priapism, and irregular heartbeat.
Some FMCGs with drug roles are often the first substances to be abused by adolescents seeking a “high” and they can thus constitute gateway drugs (Anderson and Loomis 2003). In fact, an estimated 81.9 percent of American youths who have abused OTC drugs also reported marijuana use (U.S. Substance Abuse and Mental Health Services Administration 2008). While young people may believe these products are free from harm because they are not prescription drugs, their misuse can cause significant morbidity and mortality (Conca and Worthen 2012; U.S. Substance Abuse and Mental Health Services Administration 2008, 2011).
Apart from serving people seeking a high, OTC drugs might be misused for many reasons. They might become the alternative drug of choice for addicts when their primary drug has become unavailable. OTC drugs have the advantage of being difficult to detect on routine drug testing. Furthermore, they may be used to counter the effects of illegal drug use (e.g., cold and mouth sore remedies can ameliorate so-called meth mouth 3 ) and some contain ingredients that can be used in manufacturing illegal drugs (e.g., the lithium contained in some batteries can be used in “cooking” methamphetamine).
This study investigates the possible link between shoplifting of FMCGs and their role in drug abuse. If drug users commonly shoplift and, if some FMCGs have roles in drug abuse (hereafter FMCG-Ds), then it might be expected that these products are shoplifted at higher rates than FMCGs without a known role in illicit drug use.
The CRAVED Model of Theft Choices
Existing research on shoplifting does not allow a test of this hypothesis. Some studies have investigated illicit markets that carry FMCGs (e.g., Gill et al. 2004; Stevenson and Forsythe 1998; Stevenson, Forsythe, and Weatherburn 2001; Sutton 2010; Sutton, Johnston, and Lockwood 1998), but little research has focused directly on shoplifting of FMCGs (Smith 2013). Given the considerable losses caused to retailers (Majumdar 2007), which Gill et al. (2004) estimate to exceed US$56 billion per year worldwide, this absence of research is surprising. The main exception is Gill et al.’s international survey of the most shoplifted products, which used CRAVED (Clarke 1999), a model of theft choices rooted in crime opportunity theory. The CRAVED acronym summarizes the attributes of items most vulnerable to theft, that is, these are concealable, removable, available, valuable, enjoyable, and disposable. CRAVED could help explain the attraction of FMCG-Ds to thieves, who might be seeking enjoyment from drug use—“Enjoyable” being one of the components of CRAVED.
Previous studies have found CRAVED to be a useful starting point for explaining various forms of theft, including cell phone thefts (Whitehead et al. 2008), bag thefts in licensed premises (Smith, Bowers, and Johnson 2006), domestic burglaries (Wellsmith and Burrell 2005), timber thefts in the Appalachians (Baker 2003), and theft of livestock in Malawi (Sidebottom 2013). CRAVED was also found useful in studies that have analyzed wildlife crimes, including poaching of parrot species in Bolivia (Pires and Clarke 2011) and Mexico (Pires and Clarke 2012) and illegally fished species worldwide (Petrossian and Clarke 2014). These studies have generally used the same approach: Comparisons are made between the objects stolen and those not stolen among the specific class under study (cell phones, parrots, livestock, timber, etc.). In this study, the theft rates of FMCGs with and without an illicit role in drug abuse are compared.
Pires and Clarke (2012) have argued that studying the attributes of stolen products can reveal much about the “craft” 4 of the thieves involved in that form of theft—their motives, the nature of their skills and competence, how they set about committing the offenses, and how they use or dispose of the goods they steal. They suggested that knowledge of these topics is as important to achieving an understanding of theft as knowledge of the demographics, backgrounds, and personalities of thieves, which are more usually studied.
CRAVED-based studies can also be helpful in formulating effective preventive policies. For example, Pires and Clarke (2012) found that the most poached species of Mexican parrots were not rare or valuable, but those that were widely available and easily “Removable.” Their ranges overlapped extensively with concentrations of human populations and young birds were easier to take from their nests that were generally closer to the ground. This pattern of findings suggested that parrot poaching was not an organized crime (as many believed) but was mostly undertaken opportunistically by local villagers seeking to supplement their meager incomes. In turn, this indicated that the usual remedies for poaching—increased penalties, more enforcement, and more protected areas—might in this case be of limited effectiveness. Legal protections are already in place and cracking down on the poachers would be difficult because of their large numbers and the comparatively minor nature of the offenses. If the authorities tried to punish more poachers, they would therefore risk losing the support of the local population. Situational measures that reduced the opportunities for poaching would be more useful.
Research Questions
This study investigates the possible link between FMCG-Ds and shop theft. It sought answers to three research questions:
Data Sources
To answer the research questions required a suitable sample of FMCGs to be obtained, an appropriate measure of theft to be identified, and a method to be developed of determining which products in the sample were FMCG-Ds.
The Sample
A large supermarket chain in the United States made the sample available. It was intended to permit a broader analysis of shoplifting than that undertaken for this study. The sample was unusually large and comprehensive and was drawn from 204 supermarkets located in urban, suburban, and rural areas in four states, which encompass a major metropolitan market in the southeastern area of the United States. Individual store names or locations were not provided by the supermarket chain to avoid its easy identification.
All 204 stores were equipped with standard loss prevention measures such as closed-circuit television cameras (CCTV) and locked cases holding expensive items. OTC drugs containing pseudoephedrine 5 were kept behind pharmacy counters per Federal law. Other personal health OTC products, known to be frequently stolen (e.g., condoms, birth control items, and drug testing kits), were kept close to the pharmacy counter to allow surveillance by the pharmacy employees. The stores had the same products for sale over the year and at the same price. The stores’ registers and physical layout were all very similar.
Some 20,000 products were offered for sale in the stores during the 2011 calendar year. Large items that could not easily be shoplifted (e.g., lawn chairs and televisions) were deleted. Also deleted were 474 products with one or more missing data points. Finally, no perishable food products (e.g., meat and milk) were included because the supermarket chain reported that perishable foods were not given the same level of employee surveillance as other products. In any case, while meat and cheese may be some of the most stolen products in grocery stores (Bamfield 2012), these and other perishable food products are not generally thought to have roles in drug abuse. The remaining 8,438 products, all of which were nonfood FMCGs, constituted the final sample.
The Measure of Shoplifting
It is notoriously difficult to measure shoplifting because most incidents are never detected. When stores apprehend a shoplifter, they frequently do not call the police. When they do, officers often choose to issue a warning or downgrade formal charges (Dabney, Hollinger, and Dugan 2004). Researchers have tried to improve the measurement of shoplifting by (1) conducting self-report studies of shoplifting, (2) following randomly selected shoppers into stores to see whether they steal anything, and (3) comparing thefts of marked items with sales of those items. Farrington (1999) reviewed these studies and estimated that only 1 in 150 shoplifting incidents led to the shoplifter’s apprehension and subsequent police action. Because of the very large sample (N = 8,438), it would be all but impossible to use any of the methods that Farrington reviewed to yield product-specific theft counts for this study.
Because it is so difficult to measure shoplifting, most stores now bundle shoplifting losses into their “shrinkage” rate, that is, the financial cost of merchandize lost due to employee theft, shoplifting, administrative error, and vendor fraud. Stores report shrinkage as a percentage of gross sales (Langton and Hollinger 2005). It is difficult to disaggregate the true amount of shoplifting from the overall shrinkage, though retail executives estimate that shoplifting accounts for approximately 40 percent of the total shrinkage (Dabney et al. 2004; Hollinger and Davis 2002).
However, the supermarket chain that supplied the sample makes unusual efforts to determine how many products are stolen by shoplifters out of the store’s total shrinkage. All 204 stores have stock employees who perform counts of products using handheld bar code scanners one or more times during their shift. These counts are automatically uploaded wirelessly to the store’s automated inventory and also the central corporate database, which collects data on all products in all stores. When a store’s computerized inventory indicates fewer products are on the shelves than there should be, it is not immediately assumed that these products have been stolen. First, the stock employees try to establish where the products might have gone. They examine the shelves where the products should be and check for indicators of theft (e.g., discarded product packaging). They also confirm that the products have not been moved to different displays, to the stockroom, or shipped out. To confirm a product was stolen, the stock employees will often ask store loss prevention staff to review the CCTV recordings for that area and time period. Sometimes a shoplifter will be seen stealing the products; but often they notice a legitimate customer picking up the product and later discarding it somewhere else in the store, usually because they decide not to purchase the product before they reach the point of sale. When there are no other apparent reasons for the disappearance of products from their respective sales displays, they are coded as lost by theft.
The shoplifting measure used in this study, supplied by the supermarket chain, was therefore the numbers of thefts per product. These numbers were converted to theft rates per product by dividing the number of items stolen by the number sold for each product (also supplied by the supermarket chain). Because they allow for comparison of thefts among products, these theft rates served as the dependent variable for the study.
Products with Roles in Illicit Drug Use (FMCG-Ds)
FMCG-Ds in the sample were identified through a comprehensive search of Internet sources, government documents, and reviews of the drug abuse and medical literature. The search engine Google™ was used in web searches. Products were searched by name (e.g., search term: Dramamine®) and with the word “abuse” added (search term: “Dramamine® abuse”). In some cases, the evidence cited by the web sources was exhaustive, but in many other cases, the searches produced mainly anecdotal accounts of how and why products are abused. These reports were checked against the drug abuse and medical literature or government reports on abused OTC products. 6
The senior author then sorted the products into one of the four categories that had emerged from the searches: (1) directly produces a “high,” (2) enhances the effects of an illicit drug, (3) reduces the ill effects of illicit drug use, and (4) serves as an ingredient for making illicit drugs. All FMCGs in the sample were then rated by the senior author according to whether they served any of the four drug abuse roles. The reliability of these ratings was checked with the help of an expert on drug abuse 7 who independently rated all 8,438 products using a coding guide developed for the study (see Appendix). Interrater reliability analysis found that the coders disagreed in less than 1 percent of the products. However, they were able to understand and resolve these discrepancies, and it was considered that the ratings offered a reliable measure of the products’ potential roles in illicit drug abuse.
Results
Results are reported subsequently under the three research questions that guided the study. The large sample allowed for differences in product measures to be analyzed with statistical techniques for normal distributions. Consequently, the analyses that follow are parametric procedures. Research Question 1: Which FMCGs have roles in illicit drug use, that is, which are FMCG-Ds?
Twenty-seven product lines containing 551 individual products (6.5 percent of the total sample of 8,438 FMCGs) were coded as having one or more roles in illicit drug use (see Table 1). The table groups the products into product lines and the lines are listed from highest to lowest by theft rate. Research Question 2: Do FMCG-Ds have higher shoplifting rates than other FMCGs?
Stolen FMCG-Ds (N = 551) and Their Roles in Illicit Drug Use (204 U.S. Supermarkets, 2011).a
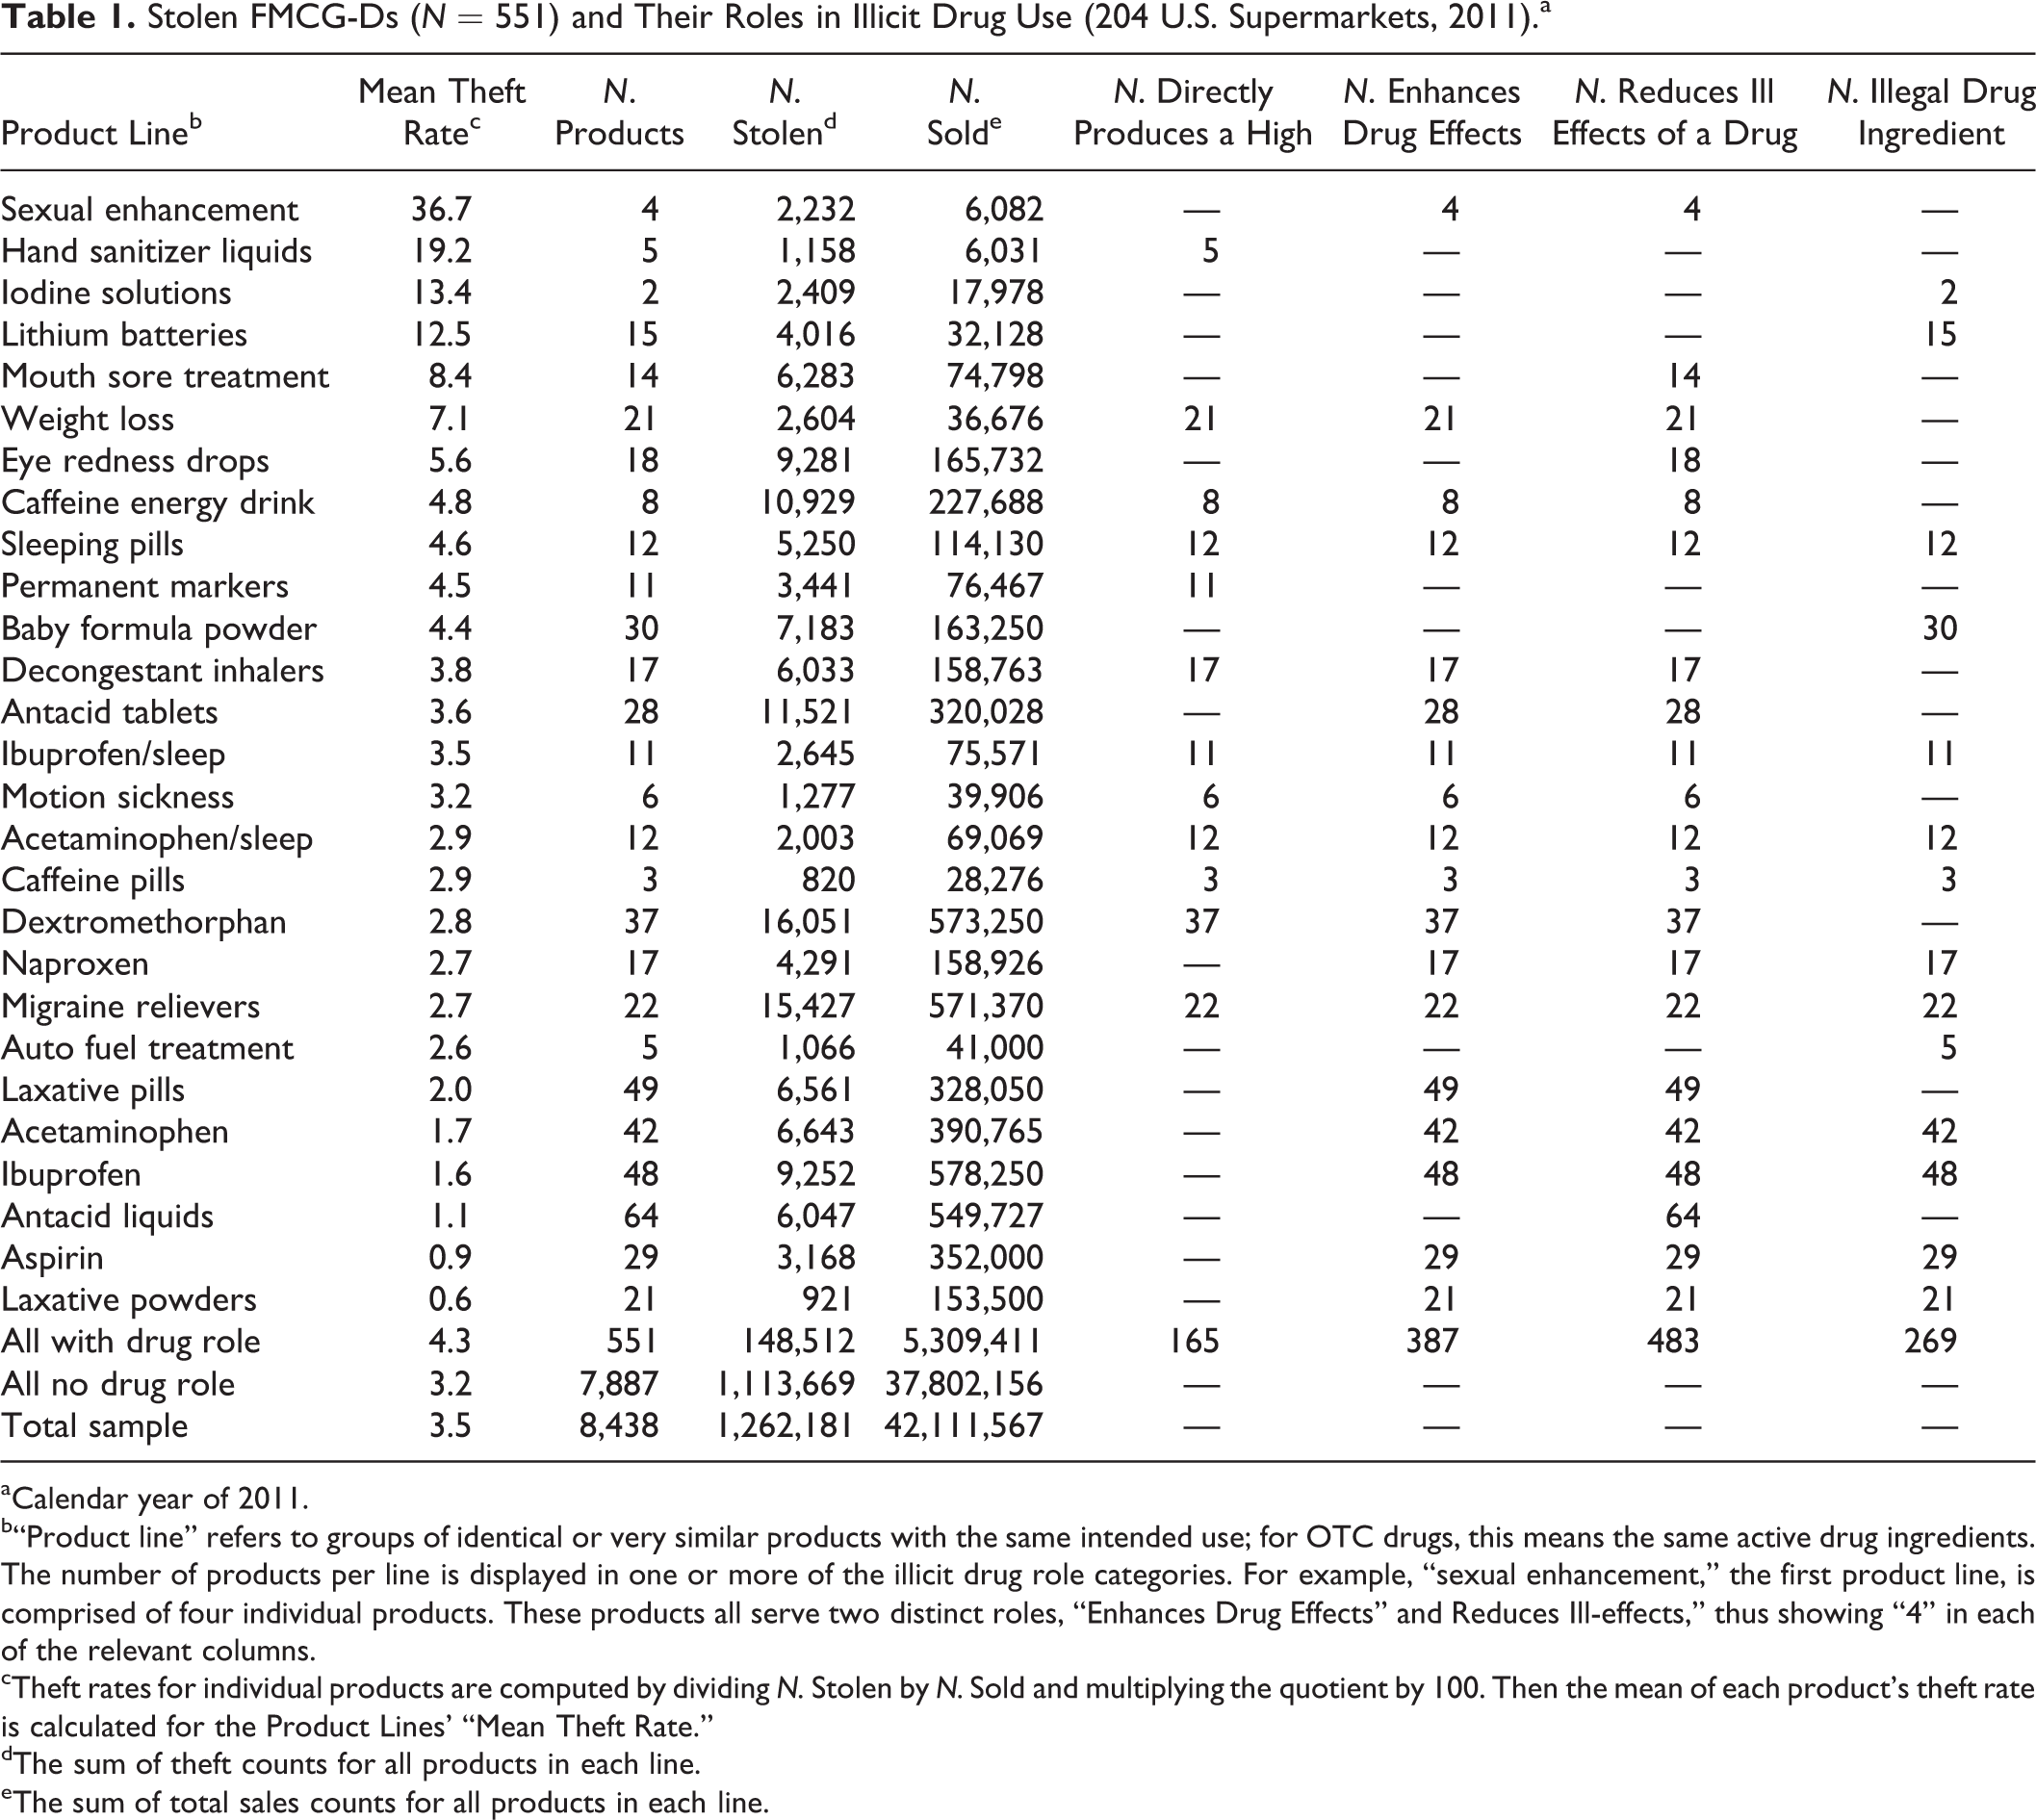
aCalendar year of 2011.
b“Product line” refers to groups of identical or very similar products with the same intended use; for OTC drugs, this means the same active drug ingredients. The number of products per line is displayed in one or more of the illicit drug role categories. For example, “sexual enhancement,” the first product line, is comprised of four individual products. These products all serve two distinct roles, “Enhances Drug Effects” and Reduces Ill-effects,” thus showing “4” in each of the relevant columns.
cTheft rates for individual products are computed by dividing N. Stolen by N. Sold and multiplying the quotient by 100. Then the mean of each product’s theft rate is calculated for the Product Lines’ “Mean Theft Rate.”
dThe sum of theft counts for all products in each line.
eThe sum of total sales counts for all products in each line.
The data in Table 1 also answer this question. It shows that the average theft rate for all products in the sample was 3.5 (SD = 3.8), meaning that for every 100 products sold, 3.5 are stolen.
8
The average theft rate for the 551 FMCG-Ds was 4.3 (SD = 5.9) and for the remaining 8,438 products without a drug function was 3.2 (SD = 3.8). An independent samples t-test was used to compare the FMCG-D’s theft rates against all other FMCGs in the sample. Theft rate was the interval dependent variable and FMCG-D (0 = no, 1 = yes) was the independent variable. The overall model was significant (F
2, 8,436 = 37.18, p < .001), as was the difference (t
2, 8,436 = 4.36, p < .001) in the theft rates of FMCG-Ds and the remaining FMCGs. Research Question 3: Do FMCG-Ds that produce a “high” have higher theft rates than other FMCG-Ds?
Table 2 presents the differences in theft rates between FMCG-Ds with one or more of the four identified illicit drug role categories. As expected, it shows that the 165 FMCG-Ds that “directly produce a high” are stolen at higher rates (5.9) than the other three categories: Both “Enhances drug effects” and “reduces ill effects of a drug” had mean theft rate of 4.5, while “illegal drug ingredient” had the lowest mean theft rate (3.6). A one-way analysis of variance indicated that products’ drug category was significantly related to their rate of theft (F 3, 1,300 = 5.79, p < .001). Post hoc comparisons using the Fisher’s least significant difference test revealed that “Directly Produces a High” showed significantly greater mean differences in product theft rates compared to the other categories of “Enhances a High” (1.4, p < .001), “Reduces Ill-Effects of an Illegal Drug” (1.4, p < .001), and “Illegal drug ingredient” (2.3, p < .001).
Illicit Drug Roles (N = 1,304) of 551 FMCG-Ds (204 U.S. Supermarkets, 2011).a

aCalendar year of 2011.
bProducts identified as FMCG-Ds had one or more roles in illicit drug use. This column lists the number of products having roles in one of the four listed categories of illicit drug roles.
Summary and Discussion
Consistent with expectations derived from CRAVED, this study found that FMCGs, with a role in illegal drug use (known here as FMCG-Ds), available for sale in U.S. supermarkets, have significantly higher risks of being shoplifted than other FMCGs. FMCG-Ds (N = 551) comprised 6.5 percent of the sample, but their mean theft rate (4.3) was on average about one third higher than that of the remaining 7,887 FMCGs (3.2). One FMCG-D, Coricidin®, a dextromethorphan (DXM)-based cough and cold medicine, had the highest theft rate (36.7) of the entire sample of 8,438 product studied. Also consistent with expectations, it was found that FMCG-Ds that directly produce a high had higher rates of theft than FMCG-Ds with other roles in drug abuse.
The sample size (N = 8,438) provides considerable statistical power, and the fact it includes a year’s worth of data from over 200 stores in a large region of the United States increases confidence in the findings. Further, the supermarket chain takes unusual care to measure theft and to differentiate it from other sources of shrinkage. Finally, the fact that the supermarket chain was prepared to release sales data for each product, which permitted rates of theft to be calculated, is unprecedented in the present authors’ experience. As stated by the ECR Europe (2010:4), “…getting comparable [theft] data from retailers is not easy, not least because it is frequently deemed highly sensitive information and not something that is often shared with third parties.” Altogether, the shoplifting data set used for this study is unique and valuable. It may not be “representative” of all such retail data, even data obtained from supermarkets; but, for reasons given previously, it would be difficult if not impossible to obtain a more representative sample.
Limitations
The study’s limitations should be noted before its implications are discussed. The first of the limitations is the unknown and varying availability of products on the sales floor. Some displays hold hundreds of a product type, while in other cases, there may only be a few products on display. Thus, a product’s theft rate could potentially vary depending on how fast shelves can be restocked, how many products are on the sales floor, and how many displays are reserved for individual products. However, an important responsibility of all store employees (with the exception of cashiers) is never to leave a display empty of its products. Further, as mentioned previously, employees are aware of product movement—in real time—and will restock shelves quickly as they run out. So although one display may have 20 items of a product and another has 5, if the employees work correctly, neither will run out and each will always have enough products for sales and theft. Assuming this to be the case, it is doubtful whether some variation in the number of certain goods on display would be a serious threat to the findings.
A second limitation is that the products offered for sale by supermarkets change from year to year. New products are introduced, some are discontinued, and others are altered. Consequently, the theft rates found in 2011 (when the sample was gathered) are likely to change over time. For FMCG-Ds in particular, products are discontinued because they are abused, others are altered to reduce their potential for abuse, and new products with the potential for abuse appear on the market. These changes may not be picked up immediately in the medical literature, government reports, and web sources used in this study to determine a product’s abuse potential. In fact, the sources originally consulted to determine which products in the sample were FMCG-Ds were informally rechecked in 2014. It was found that Delsym®, Vicks Inhaler®, and Vicks Nasal Spray®, which had not previously been identified in the checks undertaken earlier, were listed as products likely to produce a high in 2011. 9 The theft rates of all three were greater than the average theft rates (4.3) for products with a drug role. However, small changes such as these would not constitute a serious threat to the validity of the study.
A third and more important limitation is that not all products are held under the same level of security in the stores or are given the same level of surveillance by employees. Very expensive items were kept in locked cases and OTC drugs containing pseudoephedrine were kept behind pharmacy counters as per Federal law. The shelves with OTC drug products and other “hot” personal health products (e.g., condoms, birth control items, and drug-testing kits) were located close to the pharmacy to permit natural surveillance by pharmacy employees. This means that FMCG-Ds are given more protection against theft than most other products in the sample. Indeed, if this were not the case, their theft rates might be even higher than those found in this study. This feature of the design does not weaken the findings—rather the reverse—but it suggests that undertaking more detailed statistical analyses of the data, intended, say, to control for the effect of other CRAVED components such as value (i.e., the sales price of products) would be unlikely to clarify the relationship between theft of products with a drug role and those without (Smith 2013).
In summary, the interpretation of the findings is made difficult by the fact that products with drug roles were often given greater protection from theft than those without drug roles. However, the findings were in expected directions, and it can be concluded that the study shows that products with roles in drug abuse are shoplifted at a higher rate than products without such a role.
Conclusions
Despite the study’s limitations, the results hold implications for CRAVED and the study of theft. They also have preventive implications for retailers, manufacturers of FMCGs, and government. The subsequent discussion includes suggestions for further research.
Implications for CRAVED
This study has revealed more starkly than previous CRAVED-based studies that enumerating theft targets can provide only limited information about the decision making of thieves or, more broadly, about their craft. In the present case, for example, it is not known how often products with drug abuse functions are shoplifted because the thieves wish to misuse them and how often they are stolen for sale on the black market. In addition, it is not known why these relatively inexpensive products should be stolen at higher rates than other, more expensive products carried by the stores. Indeed, it seems likely that many people might legally purchase these products simply to take advantage of their drug abuse functions. These kinds of questions would need to be answered through interviews with thieves of these products as well as legal purchasers. Interviews with store managers and security staff would also help in answering these questions. More generally, it might be the case that the analysis of the attributes of stolen goods, though important, would usually need to be supplemented by additional research that probes more deeply into motives and other aspects of the thieves’ craft.
Some researchers who have used CRAVED have suggested various changes to the acronym. Of particular relevance here is Pires and Clarke’s (2012) suggestion that “Accessible” and “Abundant,” two components of Available, might usefully substitute for it in CRAVED. They made this suggestion because they had found in their study of parrot poaching in Mexico that measures of “Accessible” and “Abundant” were independently related to poaching. This is relevant to this study because of its finding that stores hold their products under varying degrees of security, therefore making them variously accessible to thieves. As with parrot poaching, both “Abundance” and “Accessible” could therefore be important components of any full account of which goods are shoplifted.
In fact, it might be the case that every group of products is given varying protection from theft. Thus, stores give extra protection to products that are most vulnerable to shoplifting; householders try to hide their most precious possessions from burglars; when out and about, many people will try to thwart muggers or petty thieves by concealing their cash and leaving their laptops and other valuables at home. As for endangered animals, which in theory are protected by the law, many species (such as some parrots) might be given effective protection from poachers by the fact that they can only be found in remote and inaccessible areas.
Implications for Retailers, Manufacturers, and for Government
Because so few shoplifters are apprehended, the results hold few if any implications for the police and the criminal justice system. However, the results do have preventive implications for other stakeholders, one of whom are retailers. Retailers are reasonably aware of how their products can be abused and how easy it is to steal them (Courser et al. 2009), and they already provide more security for some of those products. However, up-to-date information about OTC drugs vulnerable to theft often takes time to appear in government reports, the medical literature, and web sources. As explained previously, when these sources of information about products with drug roles were rechecked later in the course of this study, it was found that Delsym®, Vicks Inhalers®, and Nasal Sprays® were now included in the results for calendar year 2011, though they had not been included in the results of the original search made for that year. More timely information about which specific products are most at risk of abuse could be useful to retailers in fine-tuning the preventive measures and thus reducing losses.
As for manufacturers of FMCGs, the results suggest that they could do more to prevent theft of their products, for example, by improved antitheft packaging, by inclusion of electronic article surveillance tags, and by unique tracking numbers for products. More advanced security features are sometimes added to particular products at the request of retailers—often acting on advice from companies that specialize in loss prevention and that sell antitheft equipment. These companies can have significant influence over manufacturers of FMCGs, and they certainly have the incentive to add their own antitheft equipment to products. This assumes that manufacturers choose to consider shoplifting risks when designing products, but it is well established that they have resisted changing high-risk products when they are not directly harmed by the crime (Clarke and Newman 2005). However, they should consider that they may be contributing to drug abuse by failing to protect their goods from theft (Clarke 2000).
If government intervened more directly in the problem of OTC drug abuse, perhaps retailers and manufacturers would expend more resources to protect these products from theft and their subsequent abuse. Increased government scrutiny or regulation of commonly abused OTC drugs might be needed by the U.S. Food and Drug Administration (2013), despite that agency’s view of OTC drugs that “their benefits outweigh their risks, the potential for misuse and abuse is low, consumers can use them for self-diagnosed conditions, they can be adequately labeled and health practitioners are not needed for safe and effective use of the product.” However, some of these drugs, especially medicines containing DXM, are now widely abused and have led to deaths among young people. Increased regulation of these medicines with DXM may therefore help to lower youth mortality. In fact, there is precedent for more strict regulation of OTC drugs. In 2005, the U.S. Congress (2005) passed the Combat Methamphetamine Epidemic Act. This law (21 U.S.C. 801) increased regulation of OTC decongestants containing pseudoephedrine—the primary chemical used to produce methamphetamine. The law made the drugs harder to obtain by (1) restricting number of sales, (2) securing the drugs behind pharmacy counters, and (3) only allowing sales to persons aged 18 and older with valid identification. Similar legislation regulating DXM should be considered.
Footnotes
Appendix
Acknowledgment
We thank the anonymous U.S. Drug Enforcement Administration Special Agent expert who helped in rating the sample of products for their possible roles in drug abuse; but the authors, not the U.S Drug Enforcement Administration or Department of Justice, are responsible for the views and opinions expressed in this article. We also thank Robert DiLonardo for his help in obtaining the data used for this study and in commenting on the draft. Finally, we are most grateful to the supermarket chain that generously provided the data.
Declaration of Conflicting Interests
The author(s) declared no potential conflicts of interest with respect to the research, authorship, and/or publication of this article.
Funding
The author(s) received no financial support for the research, authorship and/or publication of this article.