
Abstract
Objective:
To date, much of what we know about the immigration–crime link is based on the United States setting. Yet, contextual features unique to the United States may produce distinct outcomes for immigration and crime that do not hold elsewhere. This study therefore tests the applicability of ecological frameworks largely derived from the United States experience (such as the immigration revitalization thesis) in a country with a greater mixture of ethnic groups and where immigration policy is focused on recruiting skilled immigrants.
Methods:
Utilizing an innovative hybrid modeling approach, this article draws on three waves of census data and nine years of official recorded crime incident data to examine the effect of immigration on violent crime across 882 neighborhoods located in two Australian cities.
Results:
The results offer little evidence that neighborhoods with a greater concentration of immigrants have more crime or that increases in the immigrant population over time are associated with increased violence. Diversity however appears to have a more problematic effect on violent crime in both cities.
Conclusions:
While these findings are relatively consistent with previous research in the United States, whether this similarity is due to a process of revitalization requires further investigation.
Introduction
Myths surrounding the criminal immigrant and the criminogenic effects of immigration are deeply rooted in public and political discourses across the globe. The consequences of the perceived immigration–crime link are nontrivial. Conservative governments tend to manipulate the public’s fear of “crime prone” immigrants to garner support for restrictive immigration policies and deportation practices (Mears 2001; Sniderman, Hangendoorn, and Prior 2004; Stumpf 2006). Further, certain immigrant groups are likely to be subjected to heightened levels of alienation and discrimination, particularly at times of economic crises and threats to national security (Chavez and Griffiths 2009; Mayda 2006; Sniderman et al. 2004). This perceived association is also linked to increased social anxiety and higher reports of disorder in neighborhoods where immigrants live (Sampson and Raudenbush 2004; Wickes et al. 2013). Yet whether immigration actually leads to measurable increases in crime is highly questionable.
Much of what we know about the immigrant–crime link (i.e., immigrants as perpetrators) and the immigration–crime link (i.e., the effect of immigration on crime rates) is derived from the United States. Here, studies find that neither immigrants nor their children represent a greater criminal threat to society than the native-born population once appropriate controls are considered (Butcher and Piehl 1998, 2007; Hagan and Palloni 1999; Morenoff and Astor 2006; Rumbaut et al. 2006; Sampson 2008). Contrary to popular perceptions, immigrant concentration is actually associated with lower levels of crime across many neighborhoods and cities (Chavez and Griffiths 2009; Desmond and Kubrin 2009; Kubrin and Ishizawa 2012; Kubrin and Ousey 2009; Martinez, Stowell, and Lee 2010). Evidence at both the local and national level suggests no relationship or indeed a negative relationship between increased immigration and crime over time (Ousey and Kubrin 2009, 2013; Stowell et al. 2009; Wadsworth 2010). In fact, Sampson (2008:30) argues that increased immigration may, in some part, be responsible for the violent crime drop and claims “cities of concentrated immigration are some of the safest places around.”
The empirical examination of the immigration–crime nexus outside of the United States is relatively rare and presents a much less consistent picture. For example, immigrant concentration is linked to lower crime rates in England (Bell and Machin 2013); but in France, the presence of immigrants is positively associated with crime (Aoki and Todo 2009). In Belgium, research finds no significant relationship between total immigrants and crime. However, when focusing on group-specific effects, concentrations of non-European Union nationals and African nationals are related to higher crime in certain municipalities (Bircan and Hooghe 2011). In Canada, the relationship between immigration and crime is indirect, and a result of changes to the demographic composition of neighborhoods, namely, increases in the most criminogenic subpopulation—young males (Andersen 2012). Taken together, these findings suggest that in some countries, under certain conditions, increased immigration may suppress crime while in others increased immigration may heighten it.
This article examines the effect of immigration on violent crime across 882 neighborhoods located in two Australian cities: Sydney—an established immigrant gateway and Brisbane—a relatively new immigrant destination (Singer 2004). By assessing both concentration and diversity effects, key theories of immigration and crime, namely social disorganization theory and the immigration revitalization thesis, are robustly tested. Recognizing that immigration is a social process that unfolds over time and therefore requires longitudinal analysis, three waves of Australian Bureau of Statistics (ABS) census data and nine years of official, recorded crime incident data are utilized.
Previous immigration–crime studies have considered either how changes in immigrant concentration over time impact crime within a unit (see, e.g., Martinez et al. 2010; Ousey and Kubrin 2009) or how static levels of immigrant concentration are associated with more or less crime between units (see e.g., Stowell and Martinez 2009; Velez 2009). Yet experiencing change in immigrant concentration is inherently different to exhibiting a generally high level of immigrant concentration and as such, each process may differentially influence crime. This study considers both by employing a unique hybrid modeling approach that captures both within- and between-neighborhood effects.
Literature Review
Regardless of group differences in offending patterns, immigration changes the demographic, economic, and social structures of cities and neighborhoods (Reid et al. 2005). Whether these changes will have a positive or negative effect on crime is heavily contested. For example, some argue that an increased number of immigrants may heighten crime by adding to the share of the population with a high-risk crime profile (i.e., increasing the number of young males) (Andersen 2012; Ousey and Kubrin 2009). As immigrants tend to experience higher rates of victimization than natives, higher crime rates in immigrant areas may also be a consequence of increasing the share of the population that is vulnerable to crime (Bell, Fasani, and Machin 2013).
Others argue that increased immigration should lead to an overall reduction in the crime rate as first generation immigrants are typically found to exhibit relatively low-criminal propensities (Butcher and Piehl 1998, 2007; Hagan and Palloni 1999; Morenoff and Astor 2006; Rumbaut et al. 2006; Sampson 2008). Similar arguments are put forward as part of the migration selection effects thesis. Here, it is argued that the process of migration itself “selects” individuals who are particularly responsive to deterrent mechanisms and possess fewer criminal tendencies (Butcher and Piehl 2007). On a larger scale, increased immigration should be associated with a drop in the crime rate by increasing the proportion of the population unlikely to offend (Ousey and Kubrin 2009; Sampson 2008).
While immigration is ultimately a macrosocial process, it has a significant influence on neighborhood contexts. The spatial concentration of immigrants within cities is nonrandom (ABS 2014b; McDonald, Hipp and Gill 2013). Due to limited social and economic capital, immigrants are often sorted into disadvantaged areas on arrival, and thus any relationship uncovered between immigration and crime may be due to selection bias (Stowell 2007). Two theoretical frameworks are predominantly used by scholars to explain the negative or positive impact of immigration on neighborhood crime: social disorganization theory and the immigration revitalization thesis. Often presented as a competing dichotomy (although sharing common elements), social disorganization theorists contend that immigration is likely to disrupt the development of key social networks important for the informal social control of crime, whereas the immigration revitalization thesis purports that immigration can bring economic and social opportunities that reduce neighborhood crime (Martinez, Lee, and Nielsen 2004; Martinez et al. 2010; Stowell 2007).
Social Disorganization Theory
At the turn of the twentieth century, Shaw and McKay’s (1942) landmark study found that certain structural conditions of an area, namely heightened levels of poverty, ethnic diversity, and residential instability, were linked to higher rates of juvenile delinquency in Chicago neighborhoods. While they did not explicitly identify immigration as a direct cause of crime, it was argued that immigration altered both the sociodemographic composition of the neighborhood and the social processes important for the regulation of crime (see Figure 1). Within the social disorganization framework, it is assumed that immigrants arrive at their new host country with limited social and economic capital. As a result, they are “sorted into resource poor neighborhoods” subsequently worsening the levels of economic deprivation (Stowell 2007). The ethnic diversity that comes with increased immigration also leads to language and cultural barriers among residents, making it difficult to reach shared expectations of behavior. Additionally, influxes of immigrants add to the share of the population who are “new” to the neighborhood thereby increasing residential mobility. Taken together, these sociodemographic shifts make it difficult for residents to develop social networks and form strong ties to local organizations (Stark 1987). Without these critical networks, a community’s regulatory capacity becomes limited and crime flourishes (Shaw and McKay 1942; Sampson and Groves 1989; Sampson and Raudenbush 1999; Sampson, Raudenbush, and Earls 1997). Thus changes in immigration are indirectly linked to crime by weakening networks and informal social control.
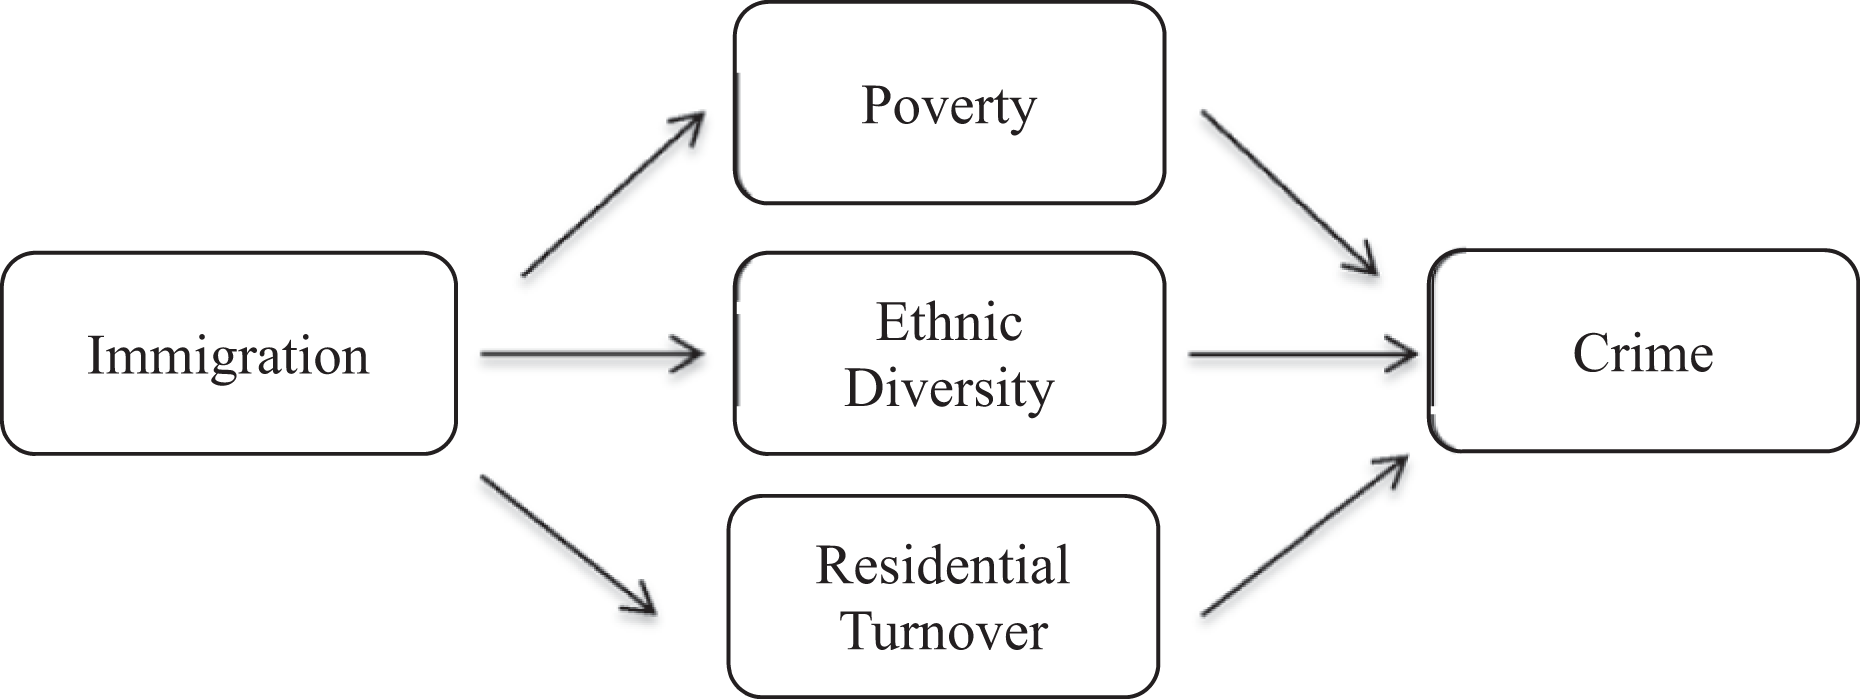
The immigration and crime relationship as predicted by social disorganization theory (Stowell 2007).
In the United States, research investigating the immigration–crime link finds little support for the social disorganization perspective. Evidence suggests immigrant concentration is not linked to more youth violence, robbery, burglary, theft, drug-related homicides, gang-related homicides, or total homicides at the neighborhood or city level (Alaniz, Cartmill, and Parker 1998; Desmond and Kubrin 2009; Feldmeyer and Steffensmeier 2009; Ferraro 2015; Kubrin and Ousey 2009; Reid et al. 2005; Stowell et al. 2009; Wadsworth 2010). In fact, some studies suggest that increases in immigration operate as a protective factor against crime, as it serves to revitalize neighborhood life, especially in disadvantaged communities (Martinez et al. 2010).
Immigration Revitalization Thesis
The immigration revitalization thesis developed by Martinez and colleagues (Lee and Martinez 2002; Martinez and Lee 2000; Martinez et al. 2010) explains why studies find limited support for the immigration–crime link as proposed by social disorganization theorists. Rather than increasing crime, they argue that increased immigration in ethnic enclaves can revitalize an area by encouraging opportunities to build social and economic ties with culturally similar individuals (Breton 1964; Desmond and Kubrin 2009). Immigrant neighborhoods often boast local ethnic economies that meet the needs of the immigrant population while also providing employment opportunities that stimulate economic growth (Velez 2009). In immigrant neighborhoods, residents are also typically active in local organizations like schools and faith-based institutions (Portes and Rumbaut 2006). This involvement allows for the additional development of social networks and helps generate informal social control. These strong social ties may potentially mediate the effect of social isolation and deprivation on crime.
There is extensive support for the immigration revitalization thesis in the United States. In neighborhoods and cities with concentrated immigration, strong social networks have effectively stabilized the community, offset the criminogenic conditions of the area, and in turn reduced crime (Chavez and Griffiths 2009; Desmond and Kubrin 2009; Kubrin and Ishizawa 2012; Kubrin and Ousey 2009; Martinez et al. 2010). Indeed, neighborhoods that had previously experienced a population decline and were “destined to become crime ridden enclaves” became thriving social hubs following increased immigration (Martinez et al. 2010:822). Interestingly, this relationship is particularly strong in areas of concentrated disadvantage (MacDonald, Hipp, and Gill 2013; Velez 2009). Yet theoretically the utility of the revitalization thesis in explaining the immigration–crime connection is dependent on the degree of homogeneity in the immigrant population. Without concentrations of immigrants from the same origins, opportunities to develop strong social ties may be limited.
The Importance of Context
There are notable exceptions to the revitalization thesis internationally (Andersen 2012; Aoki and Todo 2009; Bircan and Hooghe 2011; Francis, Armstrong, and Totikidis 2006) and within the United States (Martinez, Lee, and Nielsen 2004; Ramey 2013). Martinez and colleagues (2004:152) argue this is because “local conditions eclipse broad theoretical predictions.” Immigrant composition differs significantly across contexts and is determined by a range of factors such as geography, immigration policy, histories of colonization, shared languages, economic opportunities, and conflict/humanitarian crises. As these macrolevel conditions determine the significance and direction of the immigration–crime connection, explicating the differences in each country’s immigration experience is necessary in order to fully assess the applicability of theoretical frameworks outside the United States.
The United States is the leading destination country for immigrants globally. Founded as an immigrant nation, it is currently home to over 40 million foreign-born persons who comprise around 13 percent of the total population (Zong and Batalova 2016). The 11.7 million Mexicans residing in the United States represent the largest immigrant group in the world and make up almost one third of all foreigners (Zong and Batalova 2016). Other key groups and their respective share of the immigrant population include India and China (5 percent each); Vietnam, Cuba, and Korea (3 percent each); and the Dominican Republic and Guatemala (2 percent each) (Zong and Batalova 2016). In fact, the top 10 countries of origin account for almost 60 percent of the total immigrant population (Zong and Batalova 2016). Further, the distribution of the foreign-born population across United States cities is nonrandom with immigrants tending to settle with coethnics, forming ethnic enclaves (Martinez et al. 2010). Thus, while the United States hosts immigrants from a variety of ethnic backgrounds, there are clear ethnic groups that dominate at both the local and national level.
Like the United States, Australia is also a nation of immigrants with over a quarter of the population born overseas (ABS 2012). Almost one in every two Australians is a first or second-generation immigrant (ABS 2012). As a lingering effect from what is colloquially referred to as the “White Australia” era (Jupp 2002), immigrants from the United Kingdom and New Zealand continue to represent the largest foreign-born groups in Australia (ABS 2012). These typically White, English-speaking immigrants comprise 21 percent and 9 percent of the foreign-born population respectively (ABS 2012), experience incredibly low levels of anti-immigrant sentiment (Markus 2012), and are widely dispersed across Australian cities and neighborhoods (Markus, Jupp, and McDonald 2009). However, the last decade in particular has witnessed significant growth and diversification in the Australian immigrant population—largely driven by the Asian region. Between 2001 and 2011, an additional 200,000 Indian and 176,000 Chinese immigrants were added to the residential population (ABS 2012). Yet while Indian and Chinese natives now represent the third and fourth largest immigrant groups in Australia (and the most sizeble ethnic minorities), their respective share of the foreign-born population (around 6 percent each) is still relatively small (ABS 2012). Similar to the United States, certain Australian neighborhoods attract large numbers of immigrants. Yet by comparison, these neighborhoods are highly diverse with a much greater mixture of ethnic groups. Indeed, empirical studies find ethnic segregation is far less common in the Australian context when compared to cities in the United States (Johnston, Poulsen, and Forrest 2007).
Therefore, while the United States and Australia similarly boast incredibly diverse immigrant populations, they differ significantly in terms of ethnic group size and the settlement patterns of immigrants. These differences have important implications for theory. For example, the process of neighborhood revitalization may require that there be a critical mass of one ethnic group that can dominate a neighborhood. Ethnic group concentrations may therefore not reach the size necessary for revitalization in Australian neighborhoods. As social disorganization theory predicts higher crime in more ethnically diverse areas, this theory may be more applicable in the Australian context where immigrants are less likely to share common origins. While social disorganization theory suggests the language barriers created by increasing immigration will reduce a community’s regulatory capacity, this may not be the case in the United States if immigrants tend to settle with coethnics. By sharing a common language (for example, Spanish) and often a common religion (for instance, Catholicism), immigrant communities should be able to effectively communicate with one another and find a mutual ground in order to come together to solve local problems.
In addition to ethnic group composition and size, the immigration programs of the United States and Australia are designed to attract very different types of immigrants. Family unification is prioritized in the United States with 480,000 family visas available annually compared to just 140,000 skilled permanent visas and 70,000 refugee visas 1 (American Immigration Council 2014). Australia’s immigration program is designed to “cherry pick” high-skilled immigrants, employing a point-based system similar to Canada (Bertone 2009:87). Each year, over 120,000 skilled visas are allocated compared to around 60,000 family visas and 13,000 humanitarian visas (Spinks 2016). The number of immigrants who fail to use these legitimate routes varies considerably across the two contexts. Recent estimates suggest around 11 million unauthorized immigrants are currently residing in the United States (Zong and Batalova 2016). However, due to Australia’s geographic isolation, crossing its borders undetected is particularly difficult. In fact, persons who stay in the country after their visa expires constitute the only group of “illegal” immigrants in Australia (representing around .02 percent of the total population in 2010). Thus, Australia’s controlled strategy has resulted in a relatively well-educated and employable foreign-born population. In fact, 38 percent of Australia’s immigrant community is highly educated compared to an average of 31 percent across other OECD (2012) countries. 2 Bertone (2009:87) contends, “while the US has a thriving subprogramme of skilled migration much like Australia’s, in most other respects the two immigration programs could not be more different.”
As a consequence of Australia’s skilled migration program, new immigrants may rely less on community-level ties and resources for successful settlement compared to their counterparts in the United States. This is because immigrants arriving in Australia typically have the resources to use services that are dependent on income rather than residential community. Further, as many immigrants—particularly those arriving through the skilled stream possess access to human and economic capital—it is unlikely influxes of new immigrants into Australian neighborhoods will exacerbate poverty levels as predicted by social disorganization theory. In fact, the relationship between poverty and race is relatively weak across Australian neighborhoods. In the current study, the correlation between immigrant concentration and disadvantage is exceptionally low in both cities (e.g., .18 in Sydney and .13 in Brisbane in 2011).
With these contextual differences in mind, it is argued that theories of immigration and crime are unlikely to universal but rather highly nuanced and context specific. Thus, the overarching aim of this article is to determine whether United States–focused theories of immigration and crime translate to multiethnic settings with limited segregation and where the focus is on the admittance of skilled immigrants. Three key overarching questions guide the research. First, how do changes in immigrant concentration impact changes in violent crime over time and across neighborhoods? Second, how does diversity influence violent crime within and between neighborhoods? And finally, what role do neighborhood, city, and national contexts play in shaping these relationships? By considering both concentration and diversity effects and by accounting for the dynamic contextual features of the neighborhood, the central tenets of social disorganization theory and the immigration revitalization thesis are rigorously tested.
Methods
Research Sites
Scholars find that the receptivity of city contexts can play an important role in moderating the effect of immigration on crime (Martinez et al. 2004; Ramey 2013). Cities with long-standing immigrant histories, often referred to as “gateway cities,” are generally receptive contexts. In a receptive city context, access to established ties, social institutions, and ethnic economies is readily available for new immigrants upon arrival (Portes and Rumbaut 2006; Singer 2004). By contrast, less receptive city contexts typically exhibit limited coethnic presence, and local governments and native residents often struggle to integrate new immigrants. The social organization of the city therefore has implications for crime at the neighborhood level. Two Australian cities with differing immigration histories are thus included as research sites.
Sydney Statistical Division
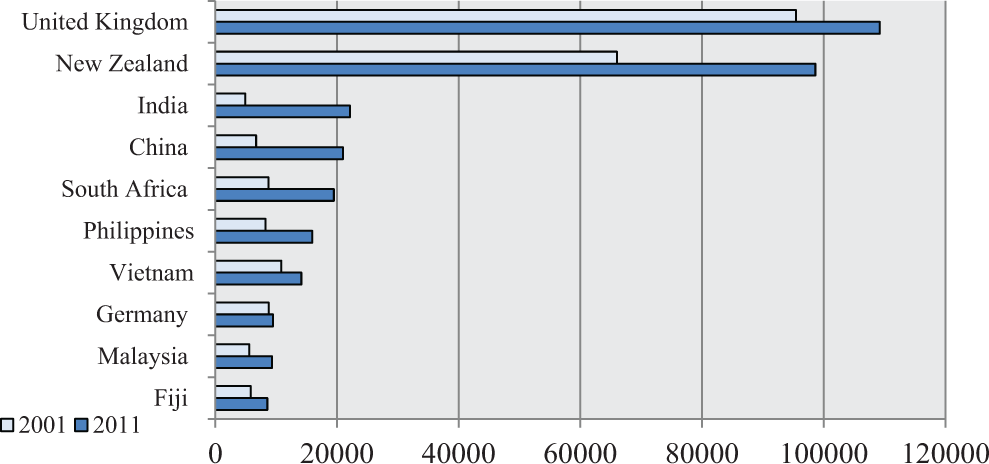
As an immigrant gateway city, Sydney has served as a key entry point for new immigrants entering Australia since the 1940s and today boasts the country’s largest foreign-born population (ABS 2014b; Ley and Murphy 2001). Of Australia’s 6 million immigrants, approximately 1.4 million live in Sydney, representing over one third of the city’s total population (ABS 2014b). Sydney’s immigrant population is also incredibly diverse—96 groups exceed numbers of over 1,000 persons (ABS 2011). A significant proportion of Sydney’s immigrant population (67 percent) speak a language other than English at home with many affiliated with non-Christian religions (25 percent; ABS 2011). Attracting large volumes of both skilled and humanitarian immigrants, Sydney has undergone considerable change in key migratory groups over the last decade (see Figure 2). Meeting Singer’s (2004) criteria as an established or continuous immigrant gateway city (Singer 2004), Sydney provides an interesting research site for the longitudinal investigation of immigration and crime in a non-United States setting.

Changes in key migratory groups between 2001 and 2011 (Sydney).
Brisbane Statistical Division
By comparison, Brisbane is a relatively new immigrant destination city (Singer 2004). Between 2001 and 2011, the number of foreign-born persons residing in Brisbane grew by over 45 percent, with an additional 200,000 immigrants added to the total residential population of around two million persons (ABS 2011). Traditionally, immigrants living in Brisbane have largely come from English-speaking backgrounds originating mainly from the United Kingdom and New Zealand (Forrest and Dunn 2006). Brisbane’s immigrant population has not only substantially increased in recent years but also diversified with a considerable rise in the number of Indian and Chinese immigrants (see Figure 3). Yet compared to Sydney, Brisbane’s immigrant population is much less linguistically diverse (41 percent speak a language other than English), with fewer immigrants practicing non-Christian religions (14 percent; ABS 2011). Brisbane provides an interesting comparative site to Sydney as it is expected the lack of existing ethnic geographic clusters in this city coupled with limited established immigrant networks and resources may reduce capacity for bonds and revitalization.
Changes in key migratory groups between 2001 and 2011 (Brisbane).
Unit of Analysis
Immigrants are not randomly dispersed across city landscapes but rather favor particular types of areas (ABS 2014b). The unit of analysis for this study is the state suburb 3 which from here on will be referred to as the neighborhood (Brisbane, N = 429; Sydney N = 824). As this study is primarily interested in how changes in the residential population influence violence over time, some neighborhoods were considered inappropriate for inclusion. Neighborhoods were selected based on two criteria: (1) The area had over 300 residents at all three time points and (2) over 25 percent of the land use was classified as residential in 2011. In addition, two well-known entertainment precincts were excluded from the analysis as the high density of licensed premises located within these neighborhoods largely explains the high prevalence of violent crime. Using these criteria ensured that outlier areas such as parklands, agricultural land, entertainment precincts, and newly developed areas were not included in the analysis. This process resulted in a total neighborhood sample of N = 302 (Brisbane) and N = 580 (Sydney). The total persons residing within these neighborhoods ranged from 307 to 43,373, with an average population of 6,089 residents.
Data Sources
ABS census data
This study utilizes three waves of ABS census data (2001, 2006, and 2011) to provide information on the sociodemographic features of neighborhoods, including various measures of immigration. The administrative boundaries for the neighborhoods shifted over the period of study. To ensure the earlier census data are geographically aligned with the 2011 boundaries, the 2001 and 2006 data were each concorded 4 using a proportional approach recommended by the ABS (2014a).
Crime data
In Australia, each state is responsible for the distribution of crime statistics, and therefore crime data were extracted from two separate sources. The New South Wales Bureau of Crime Statistics and Research (BOSCAR) provided data on crime in Sydney and the Queensland Police Service (QPS) allowed access to crime data for Brisbane. Both sources include counts of all reported offenses from 2000 to 2012. While the crime incident data from BOSCAR were preassigned to a neighborhood, the QPS data listed the xy coordinates of offenses which were then geocoded within neighborhood boundaries. Counts were aggregated to represent annual counts of violent crime.
Dependent Variable
To provide a point of comparison to international studies (Martinez et al. 2004, 2010; Ousey and Kubrin 2009, 2013; Stowell and Martinez 2009; Velez 2009; Wadsworth 2010), violent crime counts are employed as the dependent variable. The violent crime count for each time point is calculated based on a 3-year moving average centered on each census year (e.g., in 2001, the crime count represents the average for 2000, 2001, and 2002). This approach helps create a more stable estimate of crime and prevents an uncharacteristically high crime year from skewing the results (Ousey and Kubrin 2009, 2013). Offenses classified as violent crime include homicide, other homicide, 5 assault (excluding sexual), and robbery (armed and unarmed). 6
Independent Variables
Immigrant concentration
To set a baseline for Australian research, a measure for percent immigrant is included in the initial model. This variable effectively captures the share of the total population who is foreign-born across each neighborhood. However, as immigrants represent a diverse group, arriving under different circumstances with varied resources and backgrounds, relying solely on this broad measure may oversimplify the immigration–crime relationship and wash out any effect on crime. Therefore three group-specific measures focused on capturing the effects of ethnicity were included in the later stages of modeling. More specifically, these measure percent Chinese, percent Indian, and percent Vietnamese. By tapping into the presence of immigrants from the same origin, these more refined measures allow for a more meaningful test of the immigration revitalization thesis in Australia.
Immigrant diversity
Social disorganization theory predicts the negative effect of immigration on crime is particularly pronounced in diverse areas (Stowell 2007). To measure this, a language diversity index was included in the analysis comprised of nine broad language groups defined by the ABS including Northern European languages (excluding English), Southern European languages, Eastern European languages, Southwest and Central Asian languages, Southern Asian languages, Southeast Asian languages, Eastern Asian languages, other languages, and English only. Language diversity rather than country of birth diversity was chosen as it best taps into the potential for communication barriers among residents as outlined by Shaw and McKay (1942). 7 The language diversity index is calculated using the Blau formula:
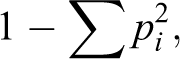
where p is the proportion of the total group who are members of a given category i. A completely homogenous community would receive a score of 0, and the score for an entirely heterogeneous community would approach 1. For ease of interpretation, the index is multiplied by 100. In both cities, the total immigrant concentration measure and the diversity index are highly correlated (.88 in Sydney and .83 in Brisbane). 8 To avoid issues with multicollinearity, the diversity index was added in the second stage of modeling with the correlation between the group-specific measures and diversity below .70 in both cities at all time points.
Contextual variables
In Australia, like elsewhere, immigrant settlement patterns and crime are nonrandom and are both heavily shaped by dynamic neighborhood contexts (ABS 2014b; McDonald, Hipp, and Gill 2013). Due to lower rents and costs of living, many immigrants settle in disorganized communities (Stowell 2007; Velez 2009) where violent crime is much more pronounced (Krivo and Peterson 1996; Shaw and McKay 1942). In Australia, newly arrived immigrants often settle in and around the central business district (CBD; ABS 2014b); however, such areas present greater opportunities for crime due to high population density and a greater mixed land use (Grubesic et al. 2013; Livingston 2008; Nielsen and Martinez 2003). The relationship between immigration and crime may therefore be spurious and a result of the types of places immigrants chose to settle. To control for aspects of the neighborhood that might correlate with crime and immigration, a number of theoretically and empirically derived sociodemographic variables are included in the analysis (Bell and Machin 2013; Martinez et al. 2010; Ousey and Kubrin 2009, 2013).
As social disorganization theory predicts more crime in disadvantaged areas, a disadvantage factor was generated based on percent unemployed, percent one parent families, and percent low-income persons. 9 These variables loaded strongly on one factor in both cities at each time point. All variables had loadings of 1.9 or higher. To account for residential mobility—another key aspect of social disorganization theory—percent at a different address five years ago and percent renters were included in the models. As previous research links the presence of Indigenous Australians to violent crime (McCausaland and Vivian 2010), percent Indigenous was added to the models. In the broader criminological literature, young males are found to be disproportionality involved in crime (Boyd 2000; Hirschi and Gottfredson 1983). As this may impact crime at the aggregate level (Andersen 2012), percent males aged 15–24 years was also included in the analysis. Recognizing areas with greater nonresidential land use present more opportunities for violent crime, the land use categories assigned to meshblocks 10 in the 2011 census were employed to construct a percent residential land use variable. Population density was also included and calculated by dividing the total population of a neighborhood by the area of the neighborhood (in square kilometers). 11 The distance between the centroid of each neighborhood and the centroid of the CBD was estimated to create a distance to CBD measure. Acknowledging the potential for spillover effects, a spatially lagged violent crime variable was also generated to account for violence in surrounding areas. 12 Descriptive statistics for each city and time point can be found in Tables 1 and 2.
Descriptive Statistics for Sydney.

Note: N = 580. CBD = central business district.
Descriptive Statistics Brisbane.

Note: N = 302.
Analytic Strategy
As immigration is a social process which unfolds over time, it requires longitudinal analysis. There are two main approaches to longitudinal analysis: fixed effects and random effects. While fixed effects models control for unobservable factors reducing potential bias, they concentrate solely on within-unit variation and time variant variables (Allison 2009). In contrast, random effects models exploit both within-group and between-group variation, producing more precise estimates (Allison 2009). Yet the assumptions of the random effects model can lead to omitted variable bias and potentially misrepresent the association. Longitudinal examinations of immigration and crime have preferred the fixed effects estimation (Martinez et al. 2010; Ousey and Kubrin 2009, 2013; Wadsworth 2010) and are thus unable to examine between-unit variation as well as the effect of time invariant variables.
Hybrid models allow for more precise estimates than what is offered by fixed effects models while dealing with the potential bias which undermines the random effects approach. This study utilizes Allison’s hybrid model which allows for the examination of both within and between neighborhood effects (Allison 2009) by including both community-specific mean variables (for the between effects) and mean-deviated variables (for the within effects). Therefore, the models presented here comprise two distinct components demonstrating the within and between neighborhood effects of the predicator variables on violent crime. The within-effects component considers how changes in the predicator variables in Neighborhood A influence changes in Neighborhood A’s level of violent crime over time. The between-effects component allows for comparison across neighborhoods by calculating an average score for the predicator variables—Neighborhood A’s average score over the three time points is thus compared to Neighborhood B’s. This allows us to disentangle how change influences violent crime within a neighborhood over time as well as compare across neighborhoods.
As violent crimes represent relatively rare neighborhood events, the distribution is strongly skewed to the right with many places exhibiting low counts. As such, hybrid estimates for negative binomial regression models are calculated using the xtnbreg command in Stata with total resident persons included as the exposure variable. The models are presented in two stages. In stage 1, only the immigration measures are included. In stage 2, the sociodemographic and environmental features of neighborhoods are added.
Results
Immigrant Concentration
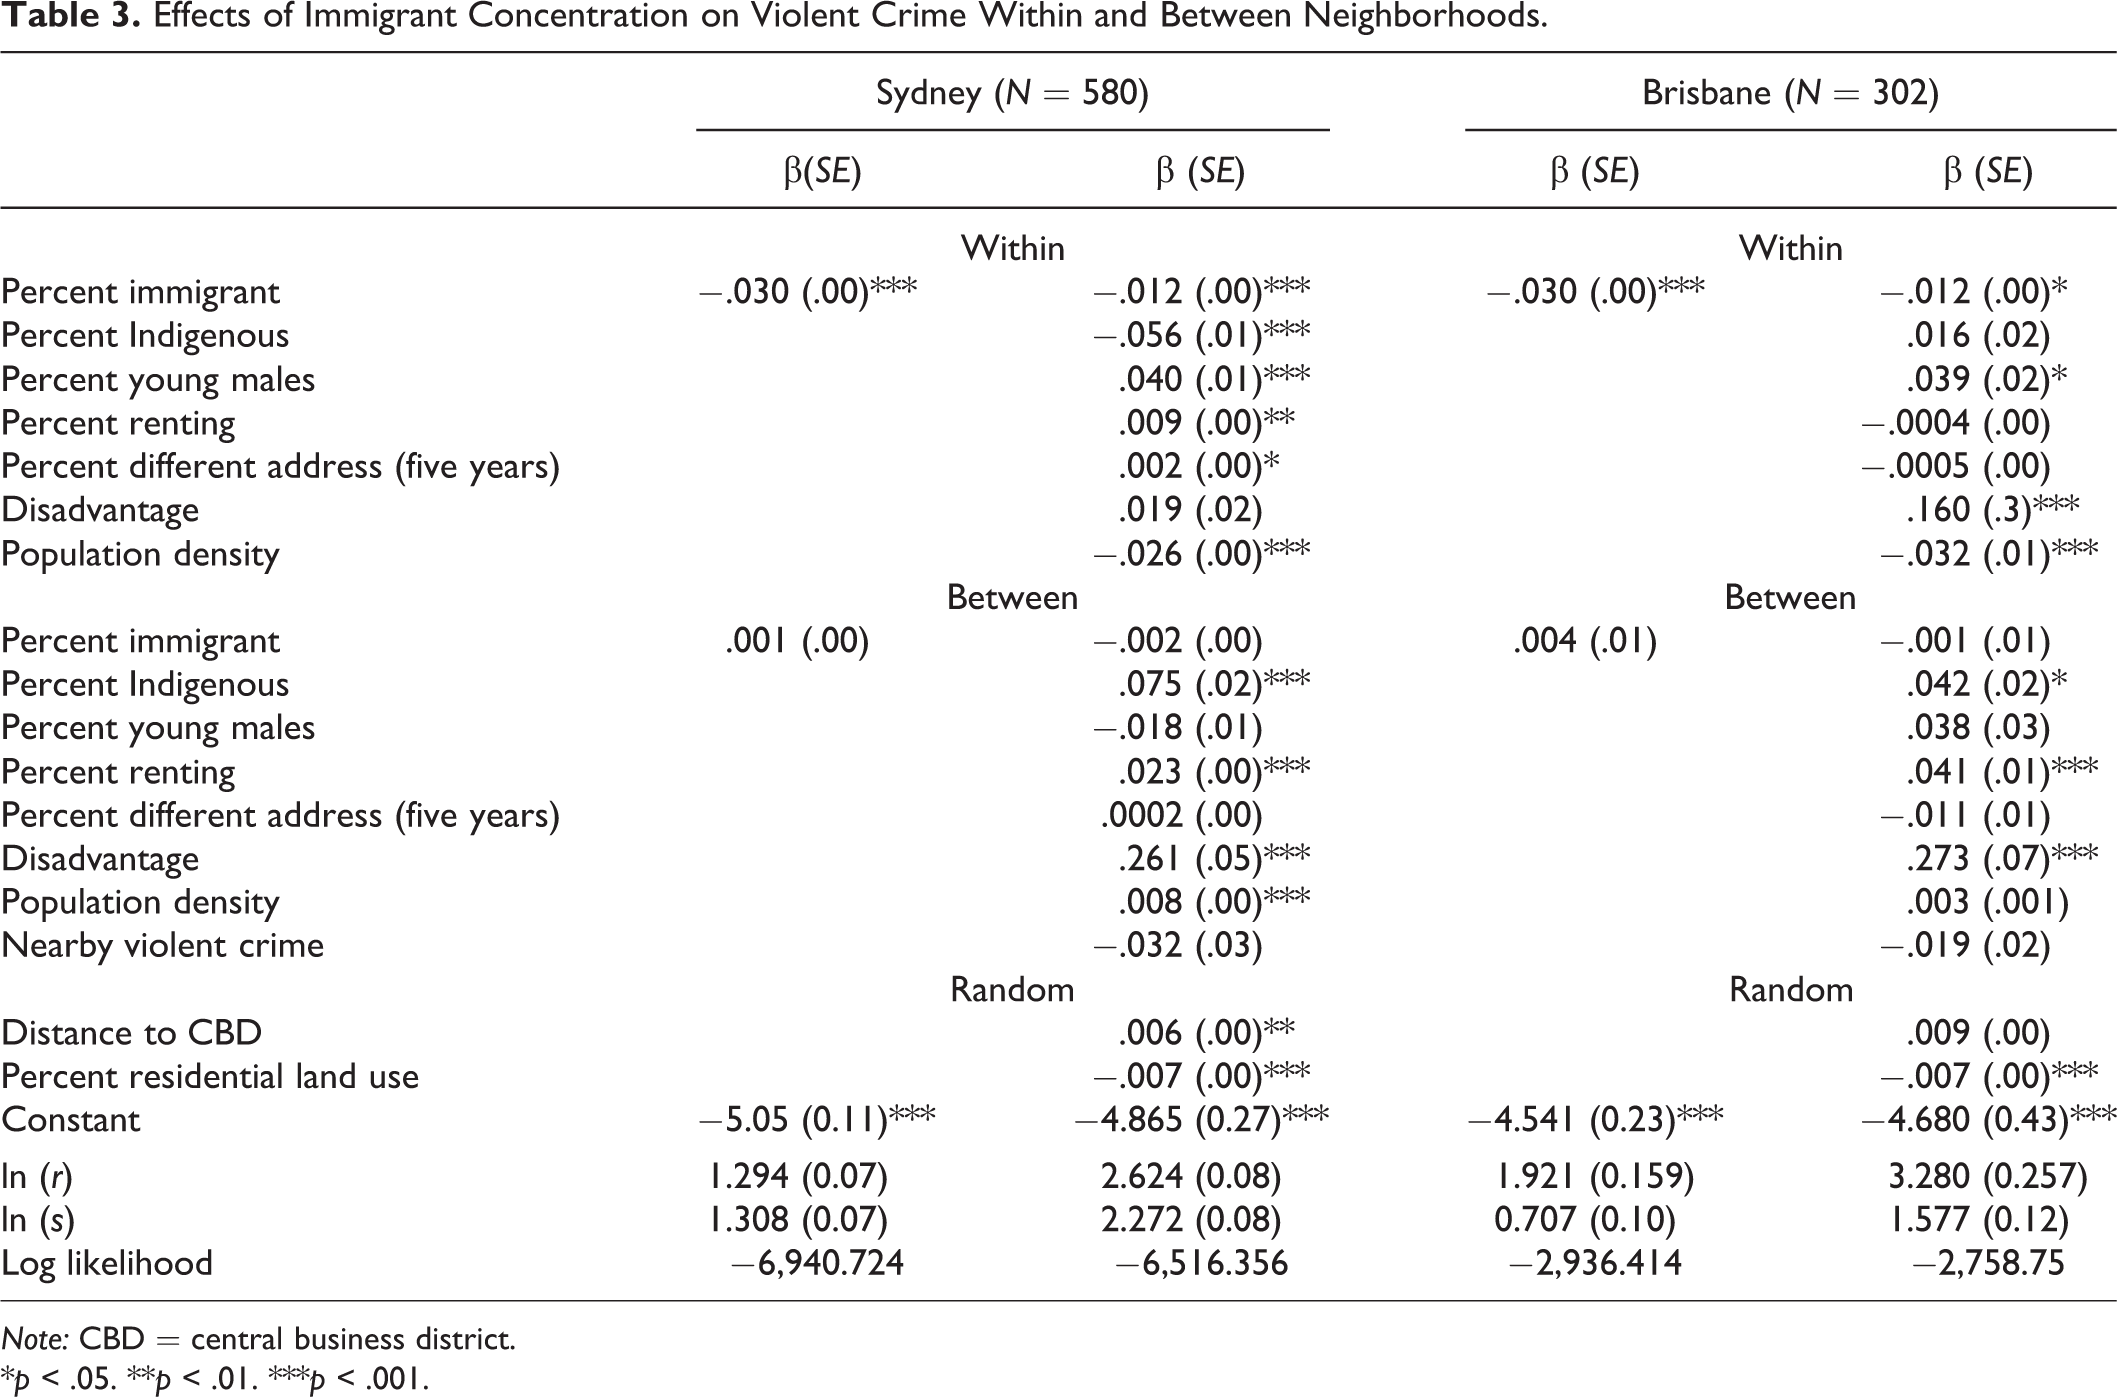
In the initial stages of modeling, only the immigrant concentration measure is included. Here, the within-effects component of the model suggests a significant negative relationship between immigration and crime in Sydney (B = −.030, p < .001). That is, as immigrant concentration increases within a neighborhood over time, violent crime decreases. However, in the between-effects component of the model, the relationship between immigrant concentration and violent crime does not reach statistical significance. This suggests that it is the process of change in immigrant concentration that is most impactful in protecting communities against violent crime rather than static levels of concentration. In other words, neighborhoods undergoing greater change in immigrant concentration will experience less violent crime over time. In Brisbane, the within-effects component of the model similarly indicates a significant negative relationship between changes in immigrant concentration and crime over time (B = −.030, p < .001). Again, the between-effects component of the model in Brisbane does not indicate a statistically significant relationship between immigrant concentration and violent crime across neighborhoods.
Next, the sociodemographic and environmental features of neighborhoods are entered into the model. Once accounting for the neighborhood context, the within-effects component of the model demonstrates that changes in immigrant concentration in Sydney—an established immigrant gateway—continue to have a significant and negative effect on violent crime over time (B = −.012, p < .001). Other significant predictors of increased violence include changes in the presence of young males (B = .040, p < .001), renters (B = .009, p < .01), and those at a different address five years ago (B = .002, p < .05). Increasing population density is negatively related to violent crime in Sydney (B = −.026, p < .001).
The between-effects component of the model reveals no significant relationship between the average level of immigrant concentration and violent crime across neighborhoods. Greater levels of population density (B = .008, p < .001), indigenous presence (B = .075, p < .001), disadvantage (B = .261, p < .001), and renters (B = .023, p < .001) are all positively and significantly linked to more violent crime across Sydney neighborhoods. A neighborhood’s distance from the city center is positively linked to violent crime meaning that as the distance to the city center increases, so does violence (B = .006, p <.001). Alternatively, areas with a higher degree of residential land use encounter fewer violent crimes (B = −.007, p < .001). These findings reinforce the importance of considering the broader context of neighborhoods when assessing the immigration–crime link.
Turning now to Brisbane—a new immigrant destination city—the within-effects component of the model continues to point to a significant and negative relationship between changes in immigrant concentration and violent crime over time once appropriate controls are considered (B = −.012, p < .05). Thus, despite possessing fewer established networks and resources for immigrants upon arrival in comparison to Sydney, increased immigration in Brisbane neighborhoods is also linked to less violent crime.
Other variables significantly associated with changes in violent crime within Brisbane neighborhoods include changes in the presence of young males (B = .039, p < .05) and changes in disadvantage (B = .160, p < .001). In Brisbane, as disadvantage and young males become more concentrated over time, levels of violent crime increase. Changes in population density are negatively associated with violent crime within Brisbane neighborhoods (B = −.032, p < .001).
The between-effects component of the model reveals no significant relationship between immigrant concentration and violent crime across Brisbane neighborhoods. Like Sydney, higher average levels of disadvantage (B = .273, p < .001), more indigenous residents (B = .042, p < .05), and the presence of more renters (B = .041, p < .001) are associated with greater violence. Residential land use is negatively linked to violent crime (B = −.007, p < .001).
At times, the direction of the relationships shown in the within and between components of the model for the same variable differs significantly (e.g., population density in Sydney). This is not particularly surprising as the two included measures capture very distinct processes. Specifically, the within-effects component of the model measures change and thus signals the degree of disruption a neighborhood has experienced over time in a particular indicator. By contrast, the between-effects component of the model provides a more static representation of a particular neighborhood feature. In other words, experiencing a significant change in population density is inherently different to presenting a generally high level of population density.
Immigrant Diversity and Group-Specific Effects
While the results presented in Table 3 are promising, the broad measure of immigrant concentration utilized may mask the effect certain ethnic groups have on crime. English-speaking, White immigrants (largely those born in the United Kingdom and New Zealand) comprise the largest foreign-born groups in Australia. Including these groups in the total immigrant concentration measure may potentially wash out the effects of ethnicity. To tease apart these group-specific effects, I next focus on concentrations of the three largest, non-White groups living in Australia: Chinese, Indian, and Vietnamese immigrants. The size of the Chinese and Indian population grew exponentially in both sites over the period of study (see Figures 1 and 2). By comparison, the Vietnamese population is much more established with high levels of migration dating back to the 1970s (Jupp 2002). These group-specific concentration measures are arguably more relevant for testing the utility of the immigration revitalization thesis in the Australian context, as they tap into the presence of culturally similar immigrants living in a given area. To simultaneously test the central tenets of social disorganization theory, the next stage of analyses also includes a measure of language diversity. According to social disorganization theory, diversity (rather than concentration) leads to higher neighborhood crime with communication barriers between residents breaking down the regulatory processes necessary for the informal social control of crime. Including both measures of diversity and concentration in the same model allows for a direct test of the two theories.
Effects of Immigrant Concentration on Violent Crime Within and Between Neighborhoods.
Note: CBD = central business district.
*p < .05. **p < .01. ***p < .001.
Similar to the models displayed in Table 3, only the diversity and concentration measures are initially included in Table 4. In Sydney, the within-effects components of the model suggest the presence of Chinese immigrants is significantly and negatively linked to violent crime over time (B = −.044, p < .001). As Chinese immigrants become more concentrated over time, violent crime decreases. Changes in the Indian population are similarly linked to lower violent crime (B = −.018, p < .001). Changes in the Vietnamese population are not significantly linked to violent crime. Further, increasing diversity is not associated with increased violence in Sydney. In the between-effects component of the model, the higher average presence of Chinese immigrants is related to fewer counts of violent crime across neighborhoods (B = −.043, p < .001). The average concentration of Vietnamese and Indian immigrants has no effect on violent crime. Alternatively, language diversity is significantly and positively associated with violent crime across neighborhoods (B = .009, p < .001). Areas with higher levels of language diversity also experience more violent crime.
Effects of Diversity and Ethnic Group Concentration on Violent Crime Within and Between Neighborhoods.

Note: CBD = central business district.
*p < .05. **p < .01. ***p < .001.
In Brisbane, the within-effects component of the model reveals a relatively strong, significant, and negative relationship between changes in the concentration of Indian immigrants and violent crime over time (B = −.096, p < .001). Changes in the Chinese and Vietnamese population had no effect on neighborhood violence. Interestingly, increasing language diversity over time is associated with less violent crime (B = .009, p < .001). The between-effects component of the model in Brisbane indicates a negative and significant relationship between each ethnic group and violent crime. Areas with a higher average presence of Chinese immigrants encounter fewer violent crimes (B = −.141, p < .001) as do areas with more Indian immigrants on average (B = −.302, p < .001). Neighborhoods with more Vietnamese immigrants similarly experience less violent crime (B = −.077, p < .001). However, when comparing between neighborhoods, areas with higher levels of language diversity are positively associated with greater violent crime (B = .039, p < .001).
Next, the sociodemographic and environmental features of the neighborhood are added into the model. In the within-effects component of the model in Sydney (see Table 4), the negative relationship between changes in the Chinese population and violent crime remains even after these controls are considered (B = −.018, p < .001). Interestingly, the relationship between change in the Vietnamese population and violent crime (while nonsignificant in the initial model) is negative and significant in the contextual model (B = −.033, p < .05). Once accounting for neighborhood context, changes in the Indian population are no longer significantly associated with violent crime. In the between-effects component of the model, the relationship between Chinese immigrants and violent crime persists after accounting for the sociostructural features of neighborhoods (B = −.022, p < .01). Although nonsignificant in the initial model, neighborhoods with a greater average concentration of Vietnamese immigrants are negatively associated with violent crime once context is considered (B = −.024, p < .01). The positive relationship between language diversity and violent crime across neighborhoods continues to hold after the inclusion of other neighborhood features (B = .007, p < .001).
In Brisbane, the relationship between changes in the Indian population and violent crime remains after controlling for the contextual features of neighborhoods (B = −.061, p < .01). Yet changes in language diversity and violent crime are no longer significantly related. In the between-effects component of the model, only the presence of Vietnamese immigrants continues to have a significantly negative effect on violent crime once accounting for context (B = −.049, p < .05). Holding other contextual features constant, areas with a higher average level of language diversity experience more violent crime (B = .015, p < .01).
Discussion
In his presidential address, Sampson (2013:25) called for a “relentless focus on context” in the study of neighborhoods and crime. The current article took such an approach exploring the role dynamic national, city, and neighborhood contexts play in shaping the relationship between immigration and crime over time. In particular, this article questioned whether theories of immigration and crime derived from the United States experience translate well to other settings. In a country with limited ethnic segregation, high levels of ethnic diversity, and a largely skilled immigrant population, would similar relationships unfold? Three key questions guided the research. First, in line with the revitalization thesis, how does immigrant concentration impact changes in violent crime within and between neighborhoods? Next, considering the central tenets of social disorganization theory, how does diversity influence violent crime within and between neighborhoods? And finally, what role do neighborhood, city, and national contexts play in determining the significance and direction of these relationships?
Overall, there was limited evidence in either city to suggest that neighborhoods with a greater concentration of immigrants have more violent crime or that increases in the immigrant population over time are associated with greater violence. In fact, even after accounting for the neighborhood context, increasing immigrant concentration was significantly linked to lower violence over time in both cities. Here, significant effects were found in the within-effects component of the model only, indicating that it is the process of change in immigrant concentration that is most important in protecting communities against violent crime rather than static levels of concentration.
Similar findings were uncovered when considering the presence and growth of key ethnic migratory groups—namely Chinese, Indian, and Vietnamese immigrants. Neither changes in these populations over time or their average level of concentration was related to more violence. Indeed, in Sydney, both changes in the Chinese population and higher average levels of Chinese concentration were associated with less violent crime within and between neighborhoods. The same effects were seen with Vietnamese immigrants once appropriate controls were considered. Interestingly, while these ethnic groups may have a less dominant presence in Australian neighborhoods compared to ethnic groups in the United States setting, significant and negative relationships were still found. Taken together, these findings suggest that while ethnic enclaves are often viewed as undesirable and associated with a range of social problems (Markus et al. 2009), ethnic group concentration is not linked to more violence. In fact, these ethnic group concentrations may actually operate as a protective shield against neighborhood violence, at least in the Australian setting.
By comparison, diversity appears more problematic. Linguistically diverse neighborhoods in Sydney and Brisbane experience greater violence, suggesting a breakdown in regulatory capacity. However, diversity was most impactful; when comparing across neighborhoods, the process of increasing diversity over time had no effect on violent crime in either city. It is important to note that when explaining crime across place, immigrant concentration and diversity represent only a modest piece of the overall puzzle. Rather, other factors such as disadvantage and land use play a much more instrumental role in determining the spatial distribution of violent crime. The evidence presented here suggests disorganized neighborhoods, places with higher levels of disadvantage, diversity, indigenous presence and renters, experience the greatest share of violent crimes.
Theoretical Implications
To date, the bulk of immigration–crime scholarship has focused on testing concentration effects over diversity effects (see for exception, Graif and Sampson 2009). However, social disorganization theory predicts higher crime in more ethnically diverse areas with communication barriers between residents breaking down the regulatory processes necessary for the informal social control of crime. Measuring both concentration and diversity is thus important in order to fully test both theoretical perspectives. Overall, the results highlight the potentially divergent effects of immigrant concentration and diversity on violent crime across neighborhoods. In both cities, neighborhoods with a higher average level of diversity encounter more violent crime. While at the same time, areas with a higher average concentration of particular groups (e.g., Chinese in Sydney and Vietnamese in Brisbane) experience less violent crime. Rather than presenting the immigration revitalization thesis and social disorganization theory as a competing dichotomy, the results here suggest that each theory’s hypothesized effects of immigration on violent crime can occur simultaneously.
Like the United States, the findings suggest that increased immigration does not lead to higher violent crime in Australian neighborhoods. However, whether this similarity is due to a process of revitalization is unclear and requires further investigation. The measures included here (similar to previous scholarship) do not directly test the effect of immigrant concentration on the neighborhood social processes important for the regulation of crime (such as collective efficacy). From a revitalization perspective, we would expect immigrant neighborhoods to exhibit strong social networks which help foster shared expectations for informal social control which in turn lead to a reduction in crime. This missing link in the current study makes it difficult to determine whether the similarities found between the two countries are the result of the same processes.
Alternatively, the push/pull factors which drive migratory decisions may explain some of the similarities found across the two contexts. In Australia, the foreign-born population largely embodies the “motivated immigrant” described in the selection effects thesis, with most highly skilled and securing employment before arrival (Department of Immigration and Border Protection 2015). The point-based program of migration effectively chooses migrants who have high stakes in conformity and wish to avoid the criminal justice system. Similarly, the United States attracts a large volume of workers, albeit low skilled as well as immigrants hoping to reunite with family. Thus, regardless of differences in socioeconomic and legal status, in both settings, immigrants are pulled to the host country in pursuit of a better livelihood for themselves and their family with the hope of upward social mobility. On a larger scale, Sampson (2008:30) argues that this selection bias “favors the argument that immigration may be causally linked to lower crime.” However, in other contexts like Germany, a large proportion of immigrants are pushed from their country of origin as a consequence of conflict/humanitarian crisis. Such groups often lack both social and economic resources upon arrival, face high levels of anti-immigrant sentiment, and experience high levels of posttraumatic stress. Research which evaluates the immigration–crime connection in a cross-cultural comparative framework is needed in order to further understand how the broader processes of immigration at the national level differentially influence crime outcomes within cities and neighborhoods.
Limitations and Future Research
Although this study advances immigration–crime scholarship, it is not without limitations. First, the results are largely dependent on the unit of analysis chosen. While state suburbs accurately reflect Australians’ perception of their neighborhood, it is possible that this relatively large unit washes out the effect of immigration on crime. To overcome the modifiable areal unit problem, future research should consider and compare the immigration–crime connection at various geographic scales—particularly as the segregation of ethnic groups is a multiscalar phenomenon (Fowler 2016). It is also important to note that these results do not represent the offending rates of immigrants. Data that disaggregate the overall violent crime measure by offender and victim immigrant status are required in order to more fully understand these relationships. Like most immigration–crime research to date, this study focused on violent crime. Considering other crime types and how the results compare is an important area for investigation. Further, this study did not account for individual-level differences in employment and socioeconomic status across neighborhoods. Rather than focusing solely on the ethnic background, future research should also consider the circumstances under which immigrants arrive as well as employment and education status, which will help disentangle the effect of poverty from the effect of ethnicity.
Conclusions
With 244 million people currently residing outside of their country of birth (United Nations Department of Economic and Social Affairs (2015) and the number of persons forcibly displaced by violence and conflict at the highest recorded level since World War II (United Nations High Commissioner for Refugees 2015), this line of research helps us understand the implications of immigration and crime as a threat to neighborhoods. While the general public may fear that increased immigration will increase crime rates (Fetzer 2000; Haller, Jowell, and Smith 2009; Mayda 2006; McLaren and Johnson 2007; Sides and Citrin 2007), this study suggests such concerns are largely unjustified, at least in the Australian context. Yet the differential effect of concentration and diversity indicates that the two measures tap into very different components of neighborhood life. Communities may thus be simultaneously revitalized and disorganized.
Footnotes
Acknowledgments
The author would like to thank Dr Rebecca Wickes and Dr Renee Zahnow for their valuable feedback on an earlier draft of the manuscript.
Declaration of Conflicting Interests
The author(s) declared no potential conflicts of interest with respect to the research, authorship, and/or publication of this article.
Funding
The author(s) disclosed receipt of the following financial support for the research, authorship, and/or publication of this article: This work was supported by the Australian Research Council (LP0453763; DP0771785; RO700002; DP1093960; DP1094589 and DE130100958).