
Abstract
Objectives:
Few studies have examined the potential nonlinear effects of strain on offending and other outcomes, even though the initial development of general strain theory (GST) recognized their feasibility. This study was designed to investigate these nonlinear effects on delinquent behavior and depressive symptoms, as well as the potential moderating effects of family relations.
Methods:
Eight years of longitudinal data from the Family Health Study (n = 840) were used to develop a multivariate multilevel model that examined the nonlinear effects of strain—in the form of stressful life events—on delinquent behavior and depressive symptoms.
Results:
The empirical results suggested that strain has an exponential effect on the delinquency when family relations are poor and a diminishing effect on depressive symptoms when family relations are strong.
Conclusions:
The findings of this study lend support to the argument that strain has nonlinear effects on delinquency, crime, and depressive symptoms. This suggests that research should consider nonlinear effects in more detail when assessing of GST. Moreover, good family relations can serve to protect youth against the untoward effects of strain and thus may provide a practical focus for intervention efforts.
Interest in the effects of strain and stress on the lives of adolescents and young adults has produced a substantial literature in criminology, sociology, and social psychology (Agnew 2015; Carr and Umberson 2013; Wheaton et al. 2013). In particular, Agnew’s (1992) general strain theory (GST) has motivated a considerable amount of research on how certain external conditions place pressure on individuals so they are at risk of criminal, delinquent, and externalized behaviors. Similarly, social psychological theories of the stress process have described how negative experiences can lead to problems such as depression and anxiety (Pearlin and Bierman 2013). Although these theories and the studies they motivated have led to several key observations about individual states and actions, an issue that has not been unexplored adequately is the form of the relationship between strain and its behavioral consequences. For example, most criminological and social psychological studies assume that the association between strain and delinquent behavior or depression is linear: It is invariable whether external strain or stressors are below or above a certain threshold. Yet, as argued later, important conceptual and empirical evidence demonstrates the existence of nonlinear associations that should be explored. Without such a pointed investigation, a large corpus of research may have missed a vital feature—or even reached erroneous conclusions—about how stress and strain affect delinquency and other untoward outcomes.
The goal of this study was to carefully explore some nonlinear strain associations. Based on Agnew’s continued development of GST, recent mental health research, and studies of stress and strain from several fields, I posited that strain, in the form of stressful life events, affects both delinquency and depressive symptoms in a nonlinear fashion, but the patterns depend, in part, on an important source of social support: family relationships. A multivariate multilevel model that utilized eight years of longitudinal data was employed to examine this proposition. The results demonstrated that strain’s effects are nonlinear, with a steeper gradient on delinquency when family relations are poor, and a diminished effect on depression when family relations are strong.
Background
In the last three or four decades, research on the effects of strain, stress, and negative life events has produced hundreds of studies in criminology, sociology, and psychology. In criminological research, most of the impetus behind this interest has been due to Agnew’s GST. In a widely cited article that offered a substantial elaboration of traditional strain theories, Agnew (1992) proposed that strain is manifest in several ways including the inability to achieve positively valued goals, the removal of positively valued stimuli, and the presence of negatively valued stimuli. He also argued that the effect of strain is particularly acute among adolescents since they are more likely than children to comprehend the sources and likely consequences of stressful events, and compared to adults, they tend to have relatively few resources to escape the source of the strain. This argument parallels the stress-reactivity model, which submits that adolescence is a period of heightened reactivity because of the many hormonal and psychosocial changes that occur (Romeo 2010). As youth undergo more stressful experiences, there is a heightened likelihood of problems such as depression and anxiety (Carr and Umberson 2013).
Importantly, Agnew posited that strain is channeled toward delinquency primarily when it leads to certain emotions, such as anger, but that its effects are conditioned by factors such as social support. However, studies have been mixed regarding the role of anger, with some showing little evidence that anger mediates the association between strain and delinquency (e.g., Aseltine, Gore, and Gordon 2000; Tittle, Broidy, and Gertz 2008), and others finding support for this pathway (e.g., Jang and Rhodes 2012; Rebellon et al. 2012). Similarly, tests of conditional effects have been inconsistent, with some demonstrating that myriad intra- and interpersonal factors have little effect on the association between strain and delinquency (e.g., Botchkovar, Tittle, and Antonaccio 2013; Eitle 2010; Tittle et al. 2008), and others finding that strain tends to affect delinquency in the presence of delinquent peers, low self-esteem or self-efficacy, or inadequate social support (e.g., Lin, Cochran, and Mieczkowski 2011; for review of this literature, see Agnew 2015).
In a similar vein, researchers in sociology and social psychology have proposed that strain—in particular, stressful life events—affects various internalizing and externalizing outcomes. Perhaps the most prominent internalized disorder examined in this literature is depressive symptomatology, which focuses on persistent feelings of dysphoria, anhedonia, restlessness, low energy, and an inability to concentrate. This has been linked to several subsequent problems including substance abuse, self-harm, poor academic performance, and sexual risk behaviors (Hawkins 2009; Jaycox et al. 2009; Peck 2013). According to the stress process model (Pearlin and Bierman 2013), stressful events and life strains lead to depression when social support or internal coping mechanisms are weak or absent. Similarly, social psychologists have argued that stress affects depression when social support is not available to buffer the emotions and cognitive overload that result from negative experiences (Rueger et al. 2016; Thoits 2011).
In general, then, there is ample theoretical and empirical support for the notion that the stresses and strains of life can lead to untoward consequences such as depression, delinquent activities, and criminal behaviors (Agnew 2015; Carr and Umberson 2013; Peck 2013; Risch et al. 2009). Moreover, certain conditions—such as good interpersonal relationships and other forms of social support—diminish the effects of strain on delinquency and depression (Kort-Butler 2010; Licitra-Kleckler and Waas 2003).
Delinquency and Depression
The parallel research efforts to understand the effects of stress and strain on delinquency and on depression have led some researchers in criminology and psychology to consider both outcomes in the same model. However, it has not been established fully why these two outcomes are associated. In building GST, Agnew (1992, 2015) posited that depression is a negative emotion and, as a consequence of strain, mediates or moderates strain’s effects on delinquency. This is consistent with studies that have explored whether depressive symptoms predict future delinquent and criminal behavior (e.g., Kofler et al. 2011; Vaske and Gehring 2010). Empirical research has not found consistent results, however, regarding depression’s role as a mediator (e.g., Defoe, Farrington, and Loeber 2013; Jang and Rhodes 2012; Peck 2013).
More generally, researchers have developed three conceptual models to account for the association between delinquent behaviors and depression: failure, acting out, and shared risk (Kofler et al. 2011). The failure model posits that delinquent behavior leads to negative relations with parents and peers, which increase the risk of depressive symptoms. The acting out model argues that depression often engenders social withdrawal, irritation, and aggression, which, in turn, increase future delinquent activities. Note that this model is similar to GST, although its presumed chain of events does not begin with strain. The shared risk model suggests that the co-occurrence of depression and delinquency is due to common antecedents, which research seeks to identify. Given several studies that have shown that strain affects both outcomes, it is feasible to argue that it is a key risk factor for their co-occurrence (e.g., Aseltine et al. 2000; De Coster and Heimer 2001; Meadows 2007; Schmeelk-Cone and Zimmerman 2003). Since the central concern in the current research is the potential nonlinear effects of strain, this study focused on strain as a significant antecedent factor that presages both delinquent behavior and depressive symptoms. It is thus not only a partial test of GST but also an examination of the shared risk model.
Nonlinear Strain Effects
Although hundreds of studies in several social science disciplines have addressed strain, stressful experiences, and the aforementioned outcomes, a large majority of studies have posited, at least implicitly, that strain linearly affects each. For instance, a large meta-analysis of the effects of stress on depressive symptoms found it rare for studies to address or even mention nonlinear effects (Risch et al. 2009). Moreover, a literature review of published GST studies revealed few that examined nonlinear strain effects on delinquent or criminal behaviors, with fewer still designed to explicitly model nonlinear associations.
1
This is unusual since Agnew (1992) explicitly proposed nonlinear strain effects in his seminal article. He stated, in particular, Whether the effect [of strain] is additive or interactive, there is limited support for the idea that the level of stress/strain must pass a certain threshold before negative outcomes result (Linsky and Straus 1986; Thoits 1983). Below that level, stress/strain is unrelated to negative outcomes. Above that level, stress/strain has a positive effect on negative outcomes, perhaps an additive effect or perhaps an interactive effect. (p. 63)
A few studies of depression in adolescence have also posited nonlinear stress and strain effects. For instance, Besser et al. (2007) contended that linear models of the stress process are incomplete. Their argument built upon the accentuation principle of life-course research (Elder and Caspi 1990) that asserts that when there is a substantial threat to the self, individuals tend to accentuate customary behavioral patterns, thus allowing them to cope with stressful experiences. However, when these threats reach a certain threshold, symptoms of depression emerge. Similarly, Larson and Moses (2017) drew upon the Yerkes–Dodson law of arousal (Teigen 1994) and the challenge model of resilience (Evans, Marsh, and Weigel 2010) to contend that experiencing a low rate of stressful events leads to positive outcomes and growth—a process known as eustress—because it allows individuals to learn stress management skills and draw from local resources to cope with negative emotions. However, a high number of stressful events can quickly overwhelm one’s ability to cope and hence instigate depression.
Although not directly germane to behavioral research, a discipline that treats nonlinear stress effects as a virtual truism is mechanics, the study of how objects react when subjected to external forces. In applied fields such as civil and mechanical engineering, strain—a measure of the deformation of an object due to external pressures—is typically modeled as following a logarithmic pattern, with linear changes in the object’s shape as pressure increases, but then a decreasing effect at higher levels of pressure (this is known as the strain plateau; Broek 2012; e.g., Feng and Li 2015). This pattern is contrary to Besser et al.’s (2007) model mentioned earlier—which brings to mind an exponential effect—but suggests, nonetheless, that assuming linear effects of strain may provide an incomplete or biased view of how it affects outcomes such as delinquency and depression.
Empirical Research on Nonlinear Strain Effects
A modest number of studies have been suggestive of nonlinear strain effects on delinquent and criminal behaviors. 2 For example, Agnew et al. (2008) found that youth economic problems are related to delinquent behavior, but only after these problems cross a threshold from one or two to three or more. Focusing on negative interpersonal relations as a source of strain, Thaxton and Agnew (2004) discovered that the association between attachment to parents and delinquency was nonlinear, with negative attachment—a source of strain according to the authors—associated with more delinquent behavior, but positive or neutral attachment having a “flat” (null) association with delinquency.
In addition to Agnew’s research, a couple of other studies provide tentative evidence of nonlinear strain effects on delinquency. Although not designed with nonlinear effects in mind, Hoffmann and Cerbone’s (1999) growth curve model showed a curvilinear effect on delinquency when strain is high, but a relatively flat association when strain is at or below its mean level. Currie and Tekin (2006) found a similar pattern, though they focused on child maltreatment rather than general strain. They reported that the probability of criminal behavior increases only after an individual has experienced two or more episodes of serious maltreatment; there is no effect on criminal behavior among those reporting fewer episodes.
Consistent with the models of Besser et al. (2007) and Larson and Moses (2017), studies also suggest that depressive symptoms may follow stressful events only when the latter surpass a certain threshold. Wiesner and Kim (2006), for instance, estimated a latent class trajectories model to rank order depression groups from low to high. They determined that as stressful events increased, youth were more likely to be found in a high-level depression group, but the number of events did not matter for placement in the medium- versus low-level depression groups. In other words, there was a threshold effect in evidence. Copeland et al. (2007) noted that youth are fairly resilient to traumatic events that affect depression and anxiety, but that multiple traumas tend to instigate symptoms of depression and related problems. Consequently, models that address only linear effects may fail to identify thresholds beyond which stress and strain affect negative outcomes and thus reach misguided conclusions regarding the role of strain and the validity of GST.
Modification of Nonlinear Strain Effects
As noted earlier, Agnew (1992, 2001) built GST not only on various forms of strain but also on conditions that channel strain toward delinquency. Although, as mentioned earlier, there is mixed evidence regarding these conditioning effects, several of them—especially those that involve interpersonal relations—are consistent with the stress process model and the stress buffering hypothesis (Grant et al. 2006; Pearlin and Bierman 2013). In particular, both frameworks posit that positive social relationships diminish the effects of stress on depression and deleterious externalizing behaviors. Among young people, one of the most consistent conditioning effects involves positive family and parent–child relationships (Dougherty, Klein, and Davila 2004; Hay and Meldrum 2010; Oliva, Jiménez, and Parra 2009; Rueger et al. 2016). 3 For example, in a review of stress buffering effects, Grant et al. (2006) reported that close parent–child relations are among the most consistent influences on whether stress results in problem behaviors. On the other hand, the effects of peer relations or involvement in conventional activities are inconsistent.
In general, then, it is reasonable to anticipate that when faced with strain in its various guises, youth who have a close relationship with their parents and family are less likely to react with untoward behaviors such as delinquency or experience states such as depression. On the other hand, youth who have poor relations with parents and family will likely be channeled toward these outcomes (cf. Oliva et al. 2009), assuming other sources of support are not available as compensatory mechanisms. Note, though, that Agnew (2001) has considered poor or negative relations with parents as a source of strain. Thus, particularly poor relations may compound the effects of other strain sources and lead to a magnified effect on delinquent and depression. 4
Although this position seems reasonable, there is an alternative model that should be considered. That is, some family researchers point out that family relations among adolescents range on a continuum from very weak or fragmented to very strong and even overwhelming (Coyne and DeLongis 1986). When family relations are especially high, this can indicate a lack of alternative coping sources that might be helpful when strain occurs. Parents, in particular, may find that their attempts to provide support to children experiencing strain backfire and increase the potential for negative outcomes (Taylor 2011). This phenomenon has been called reverse stress buffering. Therefore, family relations may operate best when they function at moderate levels (Oliva et al. 2009). Empirical work has noted, for instance, that some youth who report especially high levels of parental support are also involved in high levels of delinquency (Licitra-Kleckler and Waas 2003), although it is not known whether strain is implicated in this finding.
Summary and Hypotheses
In sum, based on GST and research on the stress process, I posited that strain has a nonlinear association with delinquent behavior and depressive symptoms, but its effects are conditioned by family relations. This led to the following hypotheses:
In addition, based on research that has suggested different potential patterns of strain and the outcomes (Broek 2012; Oliva et al. 2009), the following alternative hypotheses were considered:
Data and Methods
To examine the nonlinear strain model, I used eight years of data from the Family Health Study (FHS), a prospective cohort (longitudinal) survey conducted in a large, upper Midwestern U.S. metropolitan area that was designed initially to assess how parental mental health problems affect adolescent behavior and development. The goal of the study was to compare children at high and low risk of a mental health disorder, stressful conditions, and behavioral problems based on their parents’ mental health status. Study participants were recruited in two ways. First, all adults who were currently being treated for a psychoactive substance abuse disorder (PSUD) or affective disorder at the mental health clinics of a major metropolitan medical center in the area were screened for eligibility. Eligibility criteria included the presence of at least one child, aged 10 to 16, in their home. Those who satisfied this criterion were invited to participate in the study along with their current and previous spouses or partners and their children in the specified age range.
Second, the sample was supplemented by recruitment of eligible families from outpatient clinics—pediatrics, family medicine, and internal medicine—at the same medical center. About 16 percent of the total clinical group approached by study personnel met the eligibility criteria. Approximately 62 percent of this eligible group agreed to participate in the study. 5 Additional families were recruited via community advertisements placed in local newspapers, on television, and at sites where families with adolescents tend to be found, such as local recreation centers. Recruitment of both the clinical and community samples took place over an 18-month time period. A total 861 children and adolescents (aged 10 to 16) and their parents agreed to participate.
All adult participants, regardless of recruitment source, were administered the Structured Clinical Interview for DSM-III-R (SCID)—a semistructured interview guide for making DSM-III-R diagnoses (Williams et al. 1992)—early in the study period. SCID interviews were conducted by advanced graduate students in clinical psychology and family therapy who were familiar with DSM-III-R classification and diagnostic criteria and who had received intensive training and supervision in administering the instrument. In addition to the SCID evaluation, a special questionnaire was administered to parents whose spouses or partners were unwilling or unable to participate. The Family History Questionnaire was developed specifically to enable adult participants to provide information on their spouses’ or partners’ substance abuse or affective disorder. It was adapted from the Family Informant Schedule and Criteria (Mannuzza et al. 1985), which is frequently used in mental health research to acquire information on family members who are deceased or unwilling to participate in this type of research.
The diagnosis obtained from the SCID and the information provided by the Family History Questionnaires were the basis for classifying the presence or absence of a psychiatric disorder in parents, regardless of recruitment source. Three groups of families were distinguished based on the final diagnoses: PSUD (n = 243 offspring), affective disorder (n = 190 offspring), and nonimpaired (n = 428 offspring).
Among the psychiatrically impaired families, 42.6 percent were recruited from mental health clinics, 9.1 percent from other medical clinics, and 48.3 percent from the general community. Although the psychiatrically impaired parents recruited from the general community population were not in treatment for a psychiatric disorder at the time of recruitment, 48.9 percent had received outpatient care in the past and 14.2 percent had been hospitalized for a psychiatric disorder.
Among the nonpsychiatrically impaired families, 78.9 percent were recruited from the general community, 16.7 percent from the other medical clinics, and 4.4 percent from the mental health clinics. This latter group consisted primarily of patients who had been referred to the clinic for bereavement therapy or for postdivorce counseling.
Several months after the classification phase of the study, an appointment was scheduled for the parent, spouse or partner, and their eligible children so that each could complete a self-administered questionnaire. The questionnaires were administered in a variety of settings, including the participants’ homes, at an office, or at another convenient location. They were completed in a private setting, and parents were not in the same room as their children. Trained interviewers were available to assist with the questionnaires, if needed. Each participant received monetary compensation for completing the questionnaires. Similar questionnaires were used in seven follow-up periods approximately one year apart.
The questionnaires addressed several topics that implicated families and adolescent problems including extensive questions about life events, psychosocial support systems, health status, drug and alcohol use, delinquency and criminal behavior, and depressive symptoms. A total of 861 adolescents, aged 11 to 17 (mean = 12.9), participated in the first year of the survey. The study achieved an impressive follow-up rate: After eight years of data collection, 97.5 percent of the adolescents continued to participate in the study (840/861). Attrition analyses indicated few differences between those who remained in the study and those who did not.
The sample included members of multiple birth cohorts embedded in an accelerated longitudinal design (Galbraith, Bowden, and Mander 2017). The advantage of this approach is that we may develop a portrait of the effects of strain among individuals from ages 11 to 25, a key life-course period when delinquent behavior escalates and then diminishes to varying degrees (Farrington, Piquero, and Jennings 2013).
The 840 adolescents were primarily White (84 percent), with the remainder African American (8 percent) or members of other racial/ethnic groups (8 percent). The sample was about 49 percent female. Since the sample was not based on a probability model, I compared its characteristics to U.S. Census Bureau estimates of demographic attributes of the principal county included in the metropolitan area from which the sample was drawn. This comparison revealed that the FHS sample was similar to its surrounding population in terms of race, family income, parental education, family size, and family structure. For example, 84 percent of the FHS sample was White and 81 percent of the county population in the 11- to 17-year-old age-group was White. The median family income of FHS participants was about US$40,000, whereas the similar U.S. Census Bureau estimate for the surrounding county was US$39,926.
Measures
The first outcome variable, delinquent behavior and young adult crime, is time-varying and was measured by 14 questions that asked about involvement during the previous year in a variety of offenses including shoplifting, damaging or destroying property, theft of items over US$50 in value, theft of items under US$50 in value, breaking into a house or business to take money or property, motor vehicle theft, beating up another person, participating in a gang fight, carrying a weapon such as a knife or a gun, attacking someone with the intent to kill or inflict serious harm, and using a weapon to obtain money or property. The questions were adapted from the National Youth Survey. The resulting measure represented an involvement scale (also called a variety score), with each positive response to a question yielding a single contribution (Bendixen, Endresen, and Olweus 2003). Therefore, the scale ranged from 0 to 14. Since the variable manifested a high degree of skewness across all waves, the natural logarithm (+1) was computed and used in the analysis. This led to residuals from the regression model that followed a normal distribution more closely than when the original metric was used. 6
The second outcome variable, depressive symptoms, was based on a set of questions from the revised CES depression scale, a 20-item scale designed to assess the frequency of depressive symptomatology in a typical week during the previous 30 days (Van Dam and Earleywine 2011). The scale items included symptoms of sadness, restlessness, sleeplessness, inability to concentrate, suicidal or self-harm ideation, and poor appetite. The response categories ranged from 0 (zero days) to 4 (5 to 7 days). The responses were summed to create a depressive symptoms scale. Hence, the possible range of the variable was 0 to 80, although the actual range in the data was 0 to 45. Note that both of the outcome variables were measured at leading time points so that the explanatory variables were used to predict subsequent delinquent behavior and depressive symptoms (e.g.,
Consistent with several previous studies (e.g., Eitle 2010; Robertson, Stein, and Schaefer-Rohleder 2010), strain was operationalized as stressful life events, which were measured as a time-varying covariate based on a variety of events reported by respondents during each year of data collection. They were measured by a checklist of 16 items derived from the Junior High Life Experiences Survey (Swearingen and Cohen 1985) and the Family Inventory of Life Events and Life Changes (Lavee, McCubbin, and Olson 1987). The events included largely uncontrollable incidents that occurred in the 12 months prior to each annual survey such as death, illness, or accidents among family or friends; changes in school or residence; parental divorce or separation; parental mental health problems; and family financial problems. 7 The actual number of life events reported by respondents ranged from 0 to 14 per year, with a mean of 1.9.
Since age tends to have an inverted U-shaped association with delinquent behavior across adolescence (Farrington et al. 2013), it was entered as a lower order and a quadratic term (age2) in the models. The age range across the eight years of data was from 11 to 25, with an overall mean of 16.5.
The key moderating variable used in this study was family relations. It was based on a 15-item family cohesion scale (Olson 1985). The scale was based on questions that inquired about family closeness, warmth, support, joint activities, and problem-solving. High scores on the scale indicate a sense that the family is close, supports one another, and has members who spend time together. Low scores indicate a perception of distance, coldness, and lack of support in the family. Since there were slight differences in the response categories from one year to the next, each variable was standardized within year prior to creating additive scales. Higher scores on this scale indicated stronger family relations. The α coefficients ranged from .80 to .92.
Although only one moderator was considered as germane to this analysis, I also included as control variables several of the concepts discussed by Agnew (1992, 2013) in his research on GST. These included self-efficacy, which was a time-varying covariate gauged during each year by Pearlin and Schooler’s (1978) scale. A series of seven questions inquired about the youth’s perceived personal control over their environment; in particular, they measured feelings of helplessness, fatalism, and lack of problem-solving ability. Each variable was standardized within year prior to creating additive scales. Higher scores on this scale indicated greater perceived control over life. The α coefficients for the annual scales ranged from .87 to .92.
Self-esteem was measured by Rosenberg’s (1979) 10-item scale. The questions tapped into the youth participants’ feelings of worth, pride, ability, respect, and satisfaction with life. Higher values indicated higher self-esteem. Each variable was standardized within year prior to creating additive scales. The α coefficients ranged from .82 to .88.
As noted by Agnew (2006), delinquent peers may affect whether strain is associated with delinquent and criminal behavior. Hence, a set of questions was used that asked whether the participants’ three closest friends had engaged in the following types of behavior in the past year: beat up another person, participated in a gang fight, shoplifted, stolen money or belongings, broken into a dwelling, used a weapon to steal money or property, carried a weapon, or sold drugs. Responses to each question ranged from never (coded 0) to three or more times (coded 2) for each friend mentioned. Additive scales demonstrated positive skew, so the natural logarithms of each (+1) were taken to normalize their distributions. The α coefficients ranged from .73 to .80. Although reports of peers’ behaviors tend to display bias, the FHS did not include any information from friends that could be used to assess their actual behaviors.
By the end of the observation period, many respondents were young adults and a modest proportion had married, cohabited, or had a child. Since these life changes may affect the propensity to commit criminal acts or experience depressive symptoms (e.g., Musick and Bumpass 2012; Zoutewelle-Terovan et al. 2014), each year included dummy variables that indicated whether or not the respondent was married or cohabiting, or had a resident child. By the end of the study, about 12 percent were married or cohabiting and 13 percent had a child.
In addition, based on previous studies, the following additional variables were included in the model: sex, family income, race/ethnicity, and family structure (e.g., Demuth and Brown 2004; Pardini, Waller, and Hawes 2015). Sex was coded as 0 for females and 1 for males. Family income was based on parents’ reports of their total annual income. It was measured on a scale from 1 to 12 corresponding to increasing monetary levels. It had a mean of 4.02 (corresponding to about US$45,000 per year) and a standard deviation of 2.6. Since a large majority of the sample was White (84 percent), race/ethnicity was measured by a dummy variable that was coded as 0 for non-Whites and 1 for Whites. Family structure was identified with a dummy variable coded as 0 if respondents did not live with both biological parents and 1 if respondents lived with both biological parents during the year.
Statistical Model
As an initial step to testing nonlinear effects, I compared several nonlinear regression models that varied based on general forms of bivariate nonlinearity. These models included an exponential growth model, a logarithmic growth model, and a linear growth model. The former two included two- and three-parameter models (Rhinehart 2016). Once the best fitting model was obtained, I verified the nonlinear shape of the joint distribution between stressful life events and delinquent behavior and depressive symptoms using fractional polynomials (Binder, Sauerbrei, and Royston 2013).
A key statistical issue involves the modeling of two outcomes that are presumed to vary due to common antecedent factors. It is risky empirically to treat two outcomes as independent net the potential effects of strain. Instead, it is prudent to treat them as multivariate—and thus residually correlated—outcomes in an empirical model of nonlinear strain effects. An additional complication due to the use of longitudinal data is that there are two sources of errors (within and across the panels), as well as residual variance that is likely to be correlated (Verbeke et al. 2014). A possible solution to these issues is to use a statistical model suitable for longitudinal data, such as a generalized estimating equation, covariance structure model, or a mixed effects model (Hedeker and Gibbons 2006). However, these are not generally designed for multivariate models that estimate two or more outcomes. Although there are covariance structure models, such as SEMs, that may be generally suitable for multivariate outcomes, they tend to focus on multiple lags. A promising alternative that allows the estimation of both within- and between-person effects as well as more than a single outcome variable involves recent advances in multivariate multilevel models (Baldwin et al. 2014; Verbeke et al. 2014). 8
As described by Baldwin et al. (2014), as an initial step one might estimate a univariate growth-curve model in a multilevel context to estimate the person-to-person variability in intercepts and slopes by assuming that they are random effects from normal distributions (see Baldwin et al. 2014:922-23, for detailed equations representing the random coefficients in the models). In addition, the random errors are normally distributed with a distinct variance for each outcome. This is represented by:


In order to move from a univariate model—as shown in equations (1) and (2)—to a multivariate model that jointly estimates delinquent behavior and depressive symptoms, we may assume that the random effects and residuals are drawn from a single multivariate normal distribution. Focusing on the latter, this is depicted as:
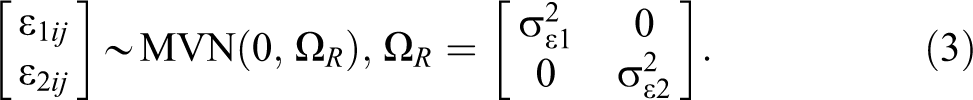
Notice that the covariance matrix Ω R includes only the two variance components, representing the variation in the random errors among individuals. Since there is zero covariance, this equation represents a multivariate independent outcomes model. It implies that the outcomes are independent, which is untenable in this situation. Contrariwise, it is likely that changes in delinquent behavior and changes in depressive symptoms are correlated (De Coster and Heimer 2001; Fieuws and Verbeke 2004). This necessitates estimating the covariance between the random coefficients and thus leads to a multivariate-related outcomes model (Baldwin et al. 2014). Moreover, given the longitudinal nature of the data, it is likely that there is an association between the residuals. Equation (4) shows the modification to the model to estimate this association:
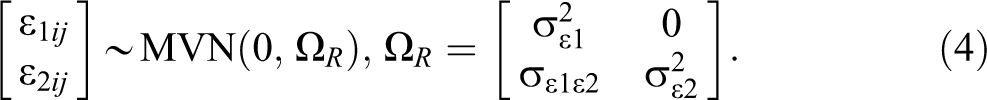
The covariance (σε1ε2) can be important because it has a substantive interpretation and affects the tests of the multivariate coefficients.
The multivariate multilevel model requires that the data be set up in a particular manner to facilitate a three-level model. First, the two outcomes are contained in a single variable, called yrij here, in which r identifies the outcome measure. This requires they be set to the same metric; Baldwin et al. (2014) recommend using z-scores. Second, two indicator variables are needed, dqj and dsj , such that dqj = 1 for delinquent behavior and 0 for depressive symptoms, and dsj = 1 for depressive symptoms and 0 for delinquent behavior. Time-varying stressful life events are indexed as strij . A general form of the combined multilevel equation may then be represented by equation (5):

Since there are two outcomes, there are two intercepts as denoted by β10 and β20. Recall that yrij was measured at t and the covariates in the model were measured at t – 1 to establish the temporal order. This is a general random effects model that allows the effects of the key explanatory variable—stressful life events in this model—to vary over time. We may also add a time-varying higher order stressful life events term (e.g., [strij ]2) to capture the proposed nonlinear effects, as well as a quadratic age term to model the presumed inverted U-shaped association between age and delinquent behavior (Farrington et al. 2013). The time-varying variables were group mean-centered to reduce bias and minimize collinearity issues (Osgood 2010). Finally, the other covariates were entered as fixed effects in an extended model.
The model was estimated with maximum likelihood. However, in the sensitivity analyses reported later, the multivariate multilevel model was also estimated using a logistic response model, which examined the outcome variables as proportions (Bishop, Fienberg, and Holland 2007; Britt, Rocque, and Zimmerman 2018). This model was estimated with Gauss–Hermite quadrature to approximate the likelihood (McCulloch and Neuhaus 2013).
Results
Table 1 provides descriptive statistics for the variables used in the empirical models. Most of these variables were described earlier, with the two outcome variables measured in z-scores and several of the explanatory variables centered about zero. About half of the sample was male and most respondents lived with both parents across the eight waves of data. However, by young adulthood (ages 21 to 25) less than one-fifth (18 percent) lived with their parents. Moreover, by this point in their lives, about 12 percent were married or cohabiting and 13 percent had a child.
Means and Standard Deviations (Decomposed) of the Outcome and Explanatory Variables, Family Health Study, 1993 to 2001.
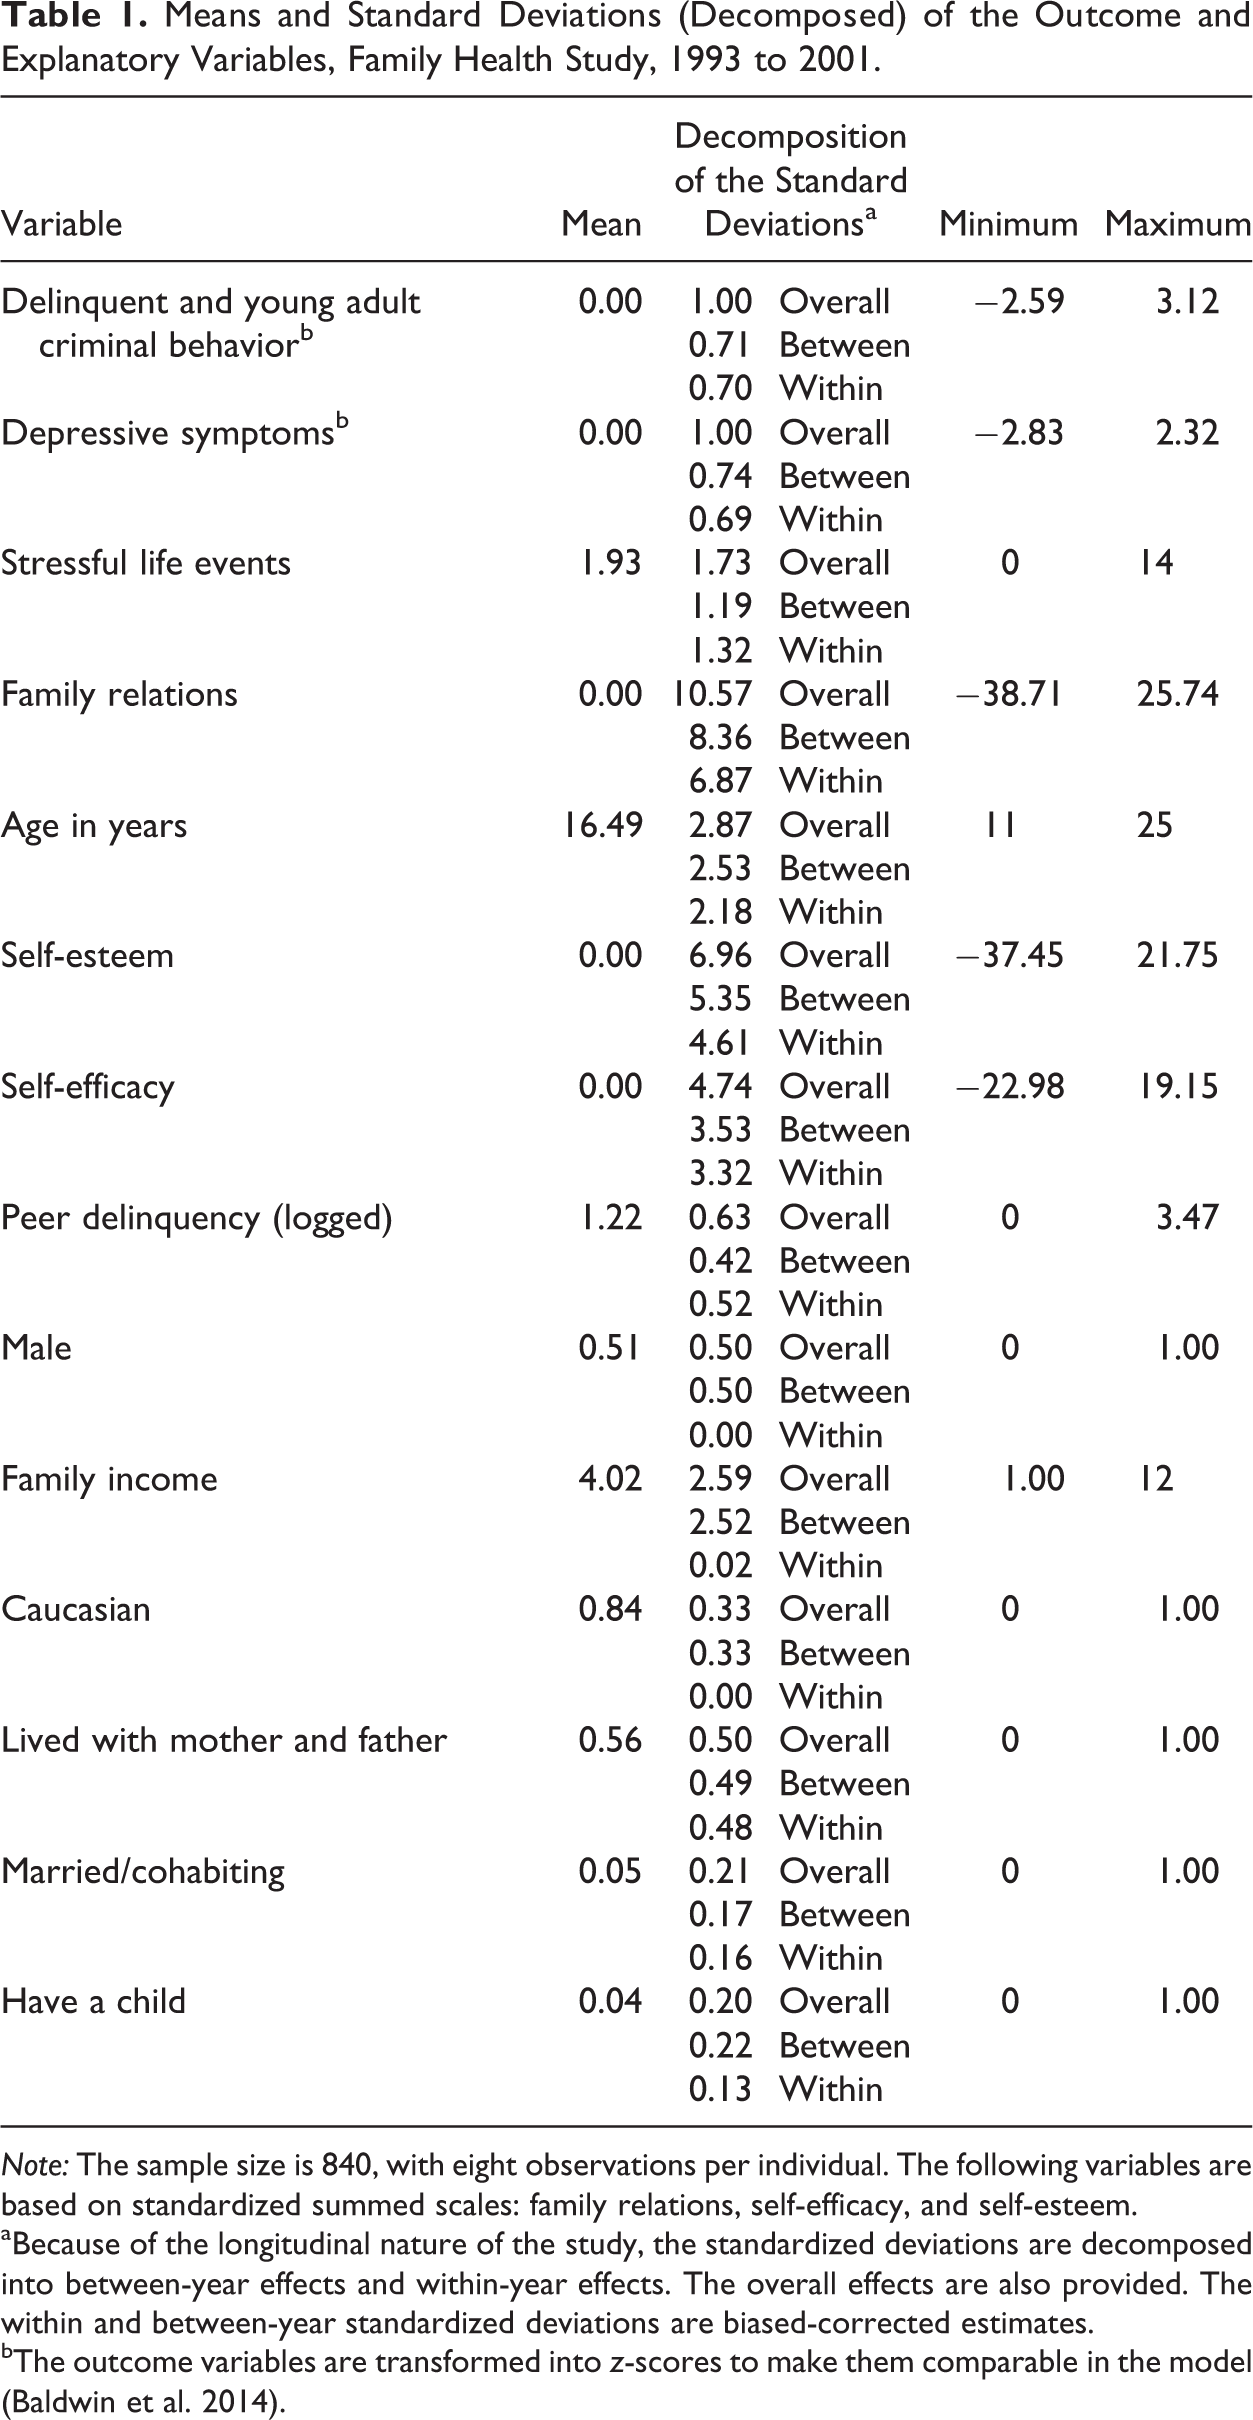
Note: The sample size is 840, with eight observations per individual. The following variables are based on standardized summed scales: family relations, self-efficacy, and self-esteem.
aBecause of the longitudinal nature of the study, the standardized deviations are decomposed into between-year effects and within-year effects. The overall effects are also provided. The within and between-year standardized deviations are biased-corrected estimates.
bThe outcome variables are transformed into z-scores to make them comparable in the model (Baldwin et al. 2014).
Table 2 shows information from the nonlinear regression models of strain, delinquent behavior, and depressive symptoms. These models were designed to explore the shape of the joint bivariate distributions (Rhinehart 2016). Based on the R 2 and Akaike information criterion values, the two-parameter exponential model provided the best fit for delinquent behavior (R 2 = .25). On the other hand, the two-parameter logarithmic model fit depressive symptoms quite well (R 2 = .62). In order to understand what these results imply about the distributions, Figure 1 furnishes the predicted patterns from the two models. In order to make them comparable, I rescaled the two outcomes so they are on a similar metric in the figure. As suggested by Table 2, there was an exponential “growth” pattern in the association between stressful life events and delinquent behavior. However, there was a slight logarithmic shape to depressive symptoms, with a modest flattening out of the association as stressful events reach a certain level. These two patterns furnished tentative evidence of the nonlinear effects of strain. 9
Nonlinear Regression Models of Stressful Life Events, Delinquent and Young Adult Criminal Behavior, and Depressive Symptoms, Family Health Study, 1993 to 2001.

Note: The cells provide unstandardized coefficients, with standard errors in parentheses. The term exp is short for exponential and the term log is short for logarithmic. For example, 2-exp is an abbreviation for a two-parameter exponential model. To ensure that the transformations of the outcome variables did not unduly affect the potential nonlinearities, each was entered into the model in its original metric. Moreover, the results merely provide the general nonlinear association between stressful life events and the two outcomes. The longitudinal nature of the data is not yet considered, although the standard errors are adjusted for clustering within individuals. The sample size is 840. AIC = Akaike information criterion.
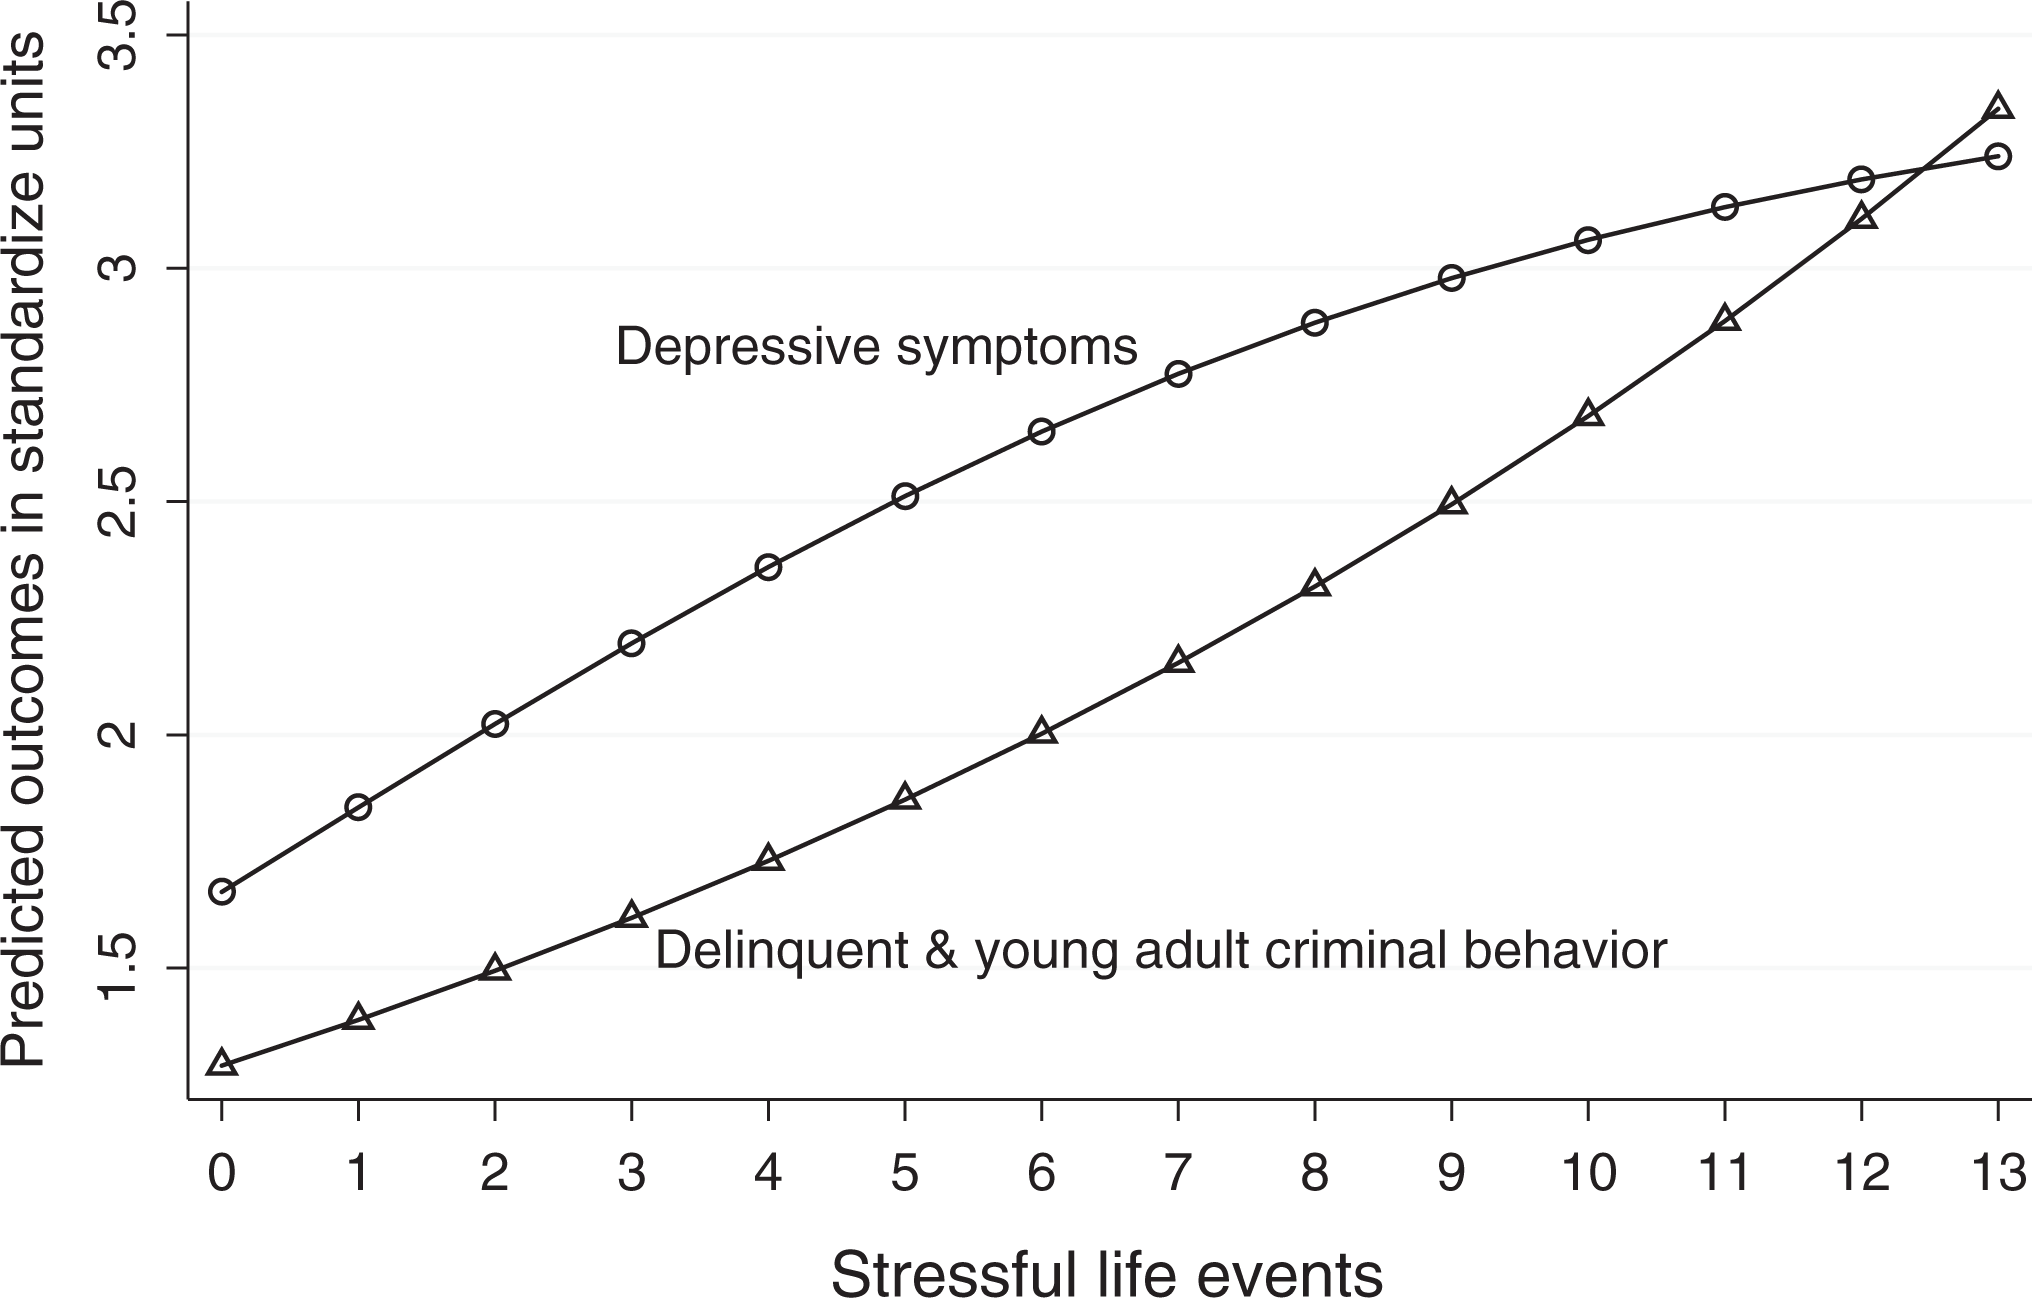
Results of nonlinear regression models: Predicted associations with life events, Family Health Study.
The next step was to estimate a multivariate multilevel model with the measure of strain entered as a quadratic term. Given the way the data and model were set up, the expectation was that stressful events squared has a statistically significant effect on the delinquency and depressive symptoms indicators. Moreover, this was expected to depend, partly, on family relations, which were treated here as the moderator variable. Two models were estimated. Model 1 included the key variables: stressful events—including the quadratic term—and family relations, as well as age and age2. Model 2 added the control variables.
Model 1 indicated that stressful events had a linear association with the two outcomes, but the quadratic terms were not statistically significant (delinquency: β = .008, p > .05; depressive symptoms: β = −.004, p > .05). This provided no initial support for either of the nonlinear strain hypotheses (see Hypotheses 1 and 3). However, note that there were statistically significant interactions between family relations and stressful events squared (delinquency: β = −.004, p < .05; depressive symptoms: β = −.009, p < .01). These results suggested that any impact of nonlinear strain on delinquent behavior and depressive symptoms was conditioned by family relations. Examining the signs of the coefficients, it appeared that better family relations were associated with relatively less delinquency and symptoms at higher levels of stress. On the other hand, poor family relations magnified the effects of stressful events in a nonlinear fashion (see Hypothesis 2). In addition, there was a nontrivial correlation between the residuals of the two outcomes (.28, p < .01). This offered support for estimating a related outcomes model.
Model 2 added the control variables as fixed effects in the model. Most of the results were consistent with previous studies. Males tended to be involved in more delinquent activities than females but reported relatively fewer depressive symptoms. Living with a mother and a father was negatively associated and peer delinquency positively associated with delinquent behavior. Self-esteem was positively associated with delinquent behavior but negatively associated with depressive symptoms.
Nonetheless, the addition of these control variables did not change the key associations shown in model 1. Instead, there remained a statistically significant effect of strain that was moderated by family relations. In particular, there were negative interactions between family relations and stressful events squared in the delinquency (β = −.005, p < .05) and in the depressive symptoms (β = −.008, p < .01) portions of the model. It is difficult to fully understand what these effects imply about the general associations in the model. Hence, Figures 2 and 3 provide predicted values by stressful events for three family relations categories: those up to the 25th percentile of family relations (poor relations), those between the 25th and 75th percentiles of family relations (average relations), and those at or above the 75th percentile of family relations (good relations). The other variables in the model were set to their mean (continuous variables) or modal (discrete variables) values.
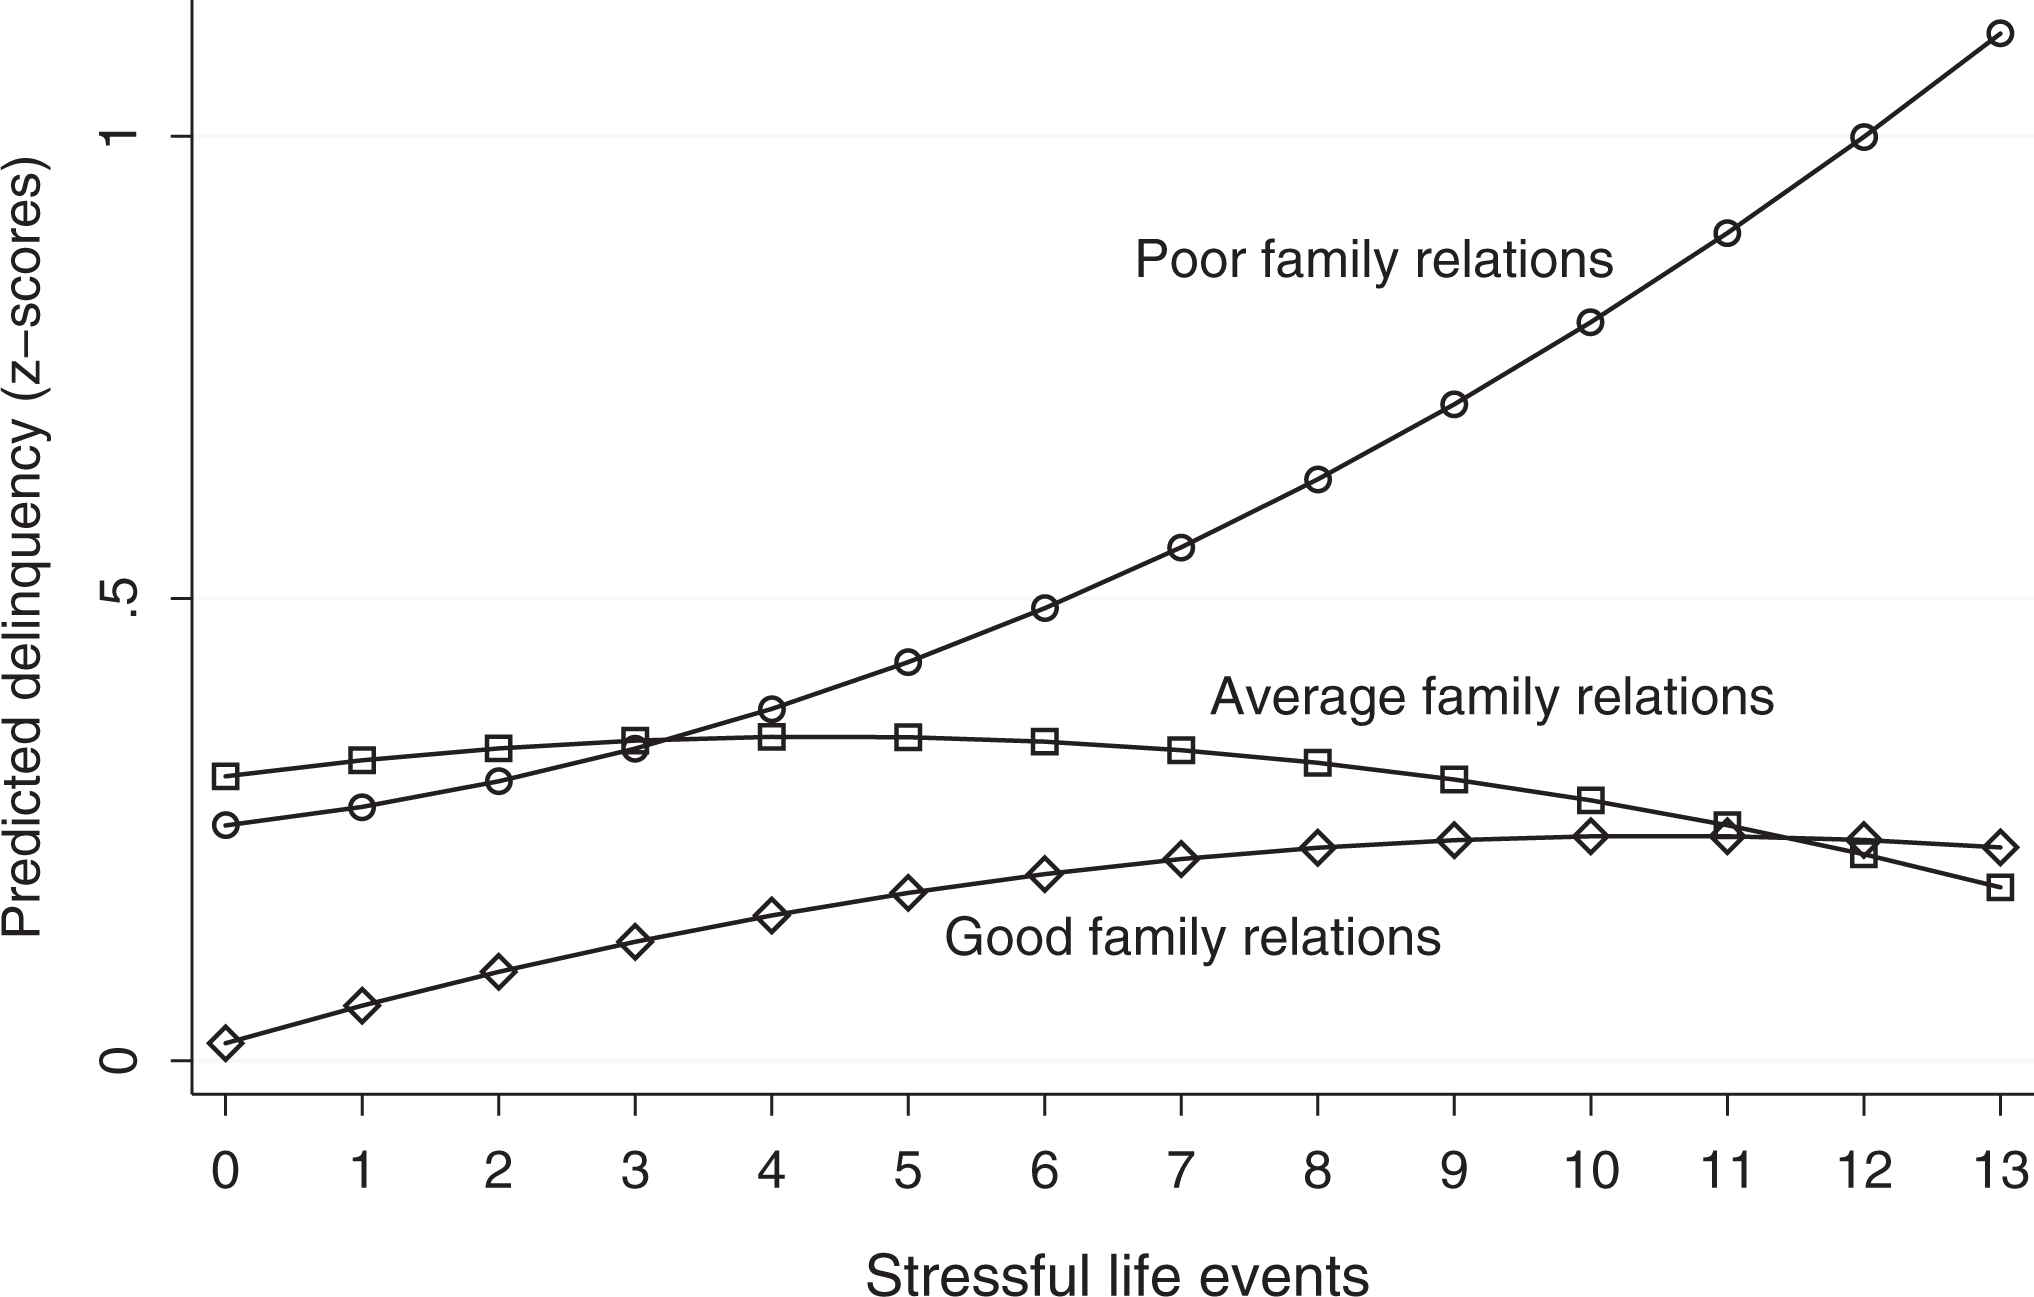
Predicted effects of life events and family relations on delinquent and young adult criminal behavior, Family Health Study.
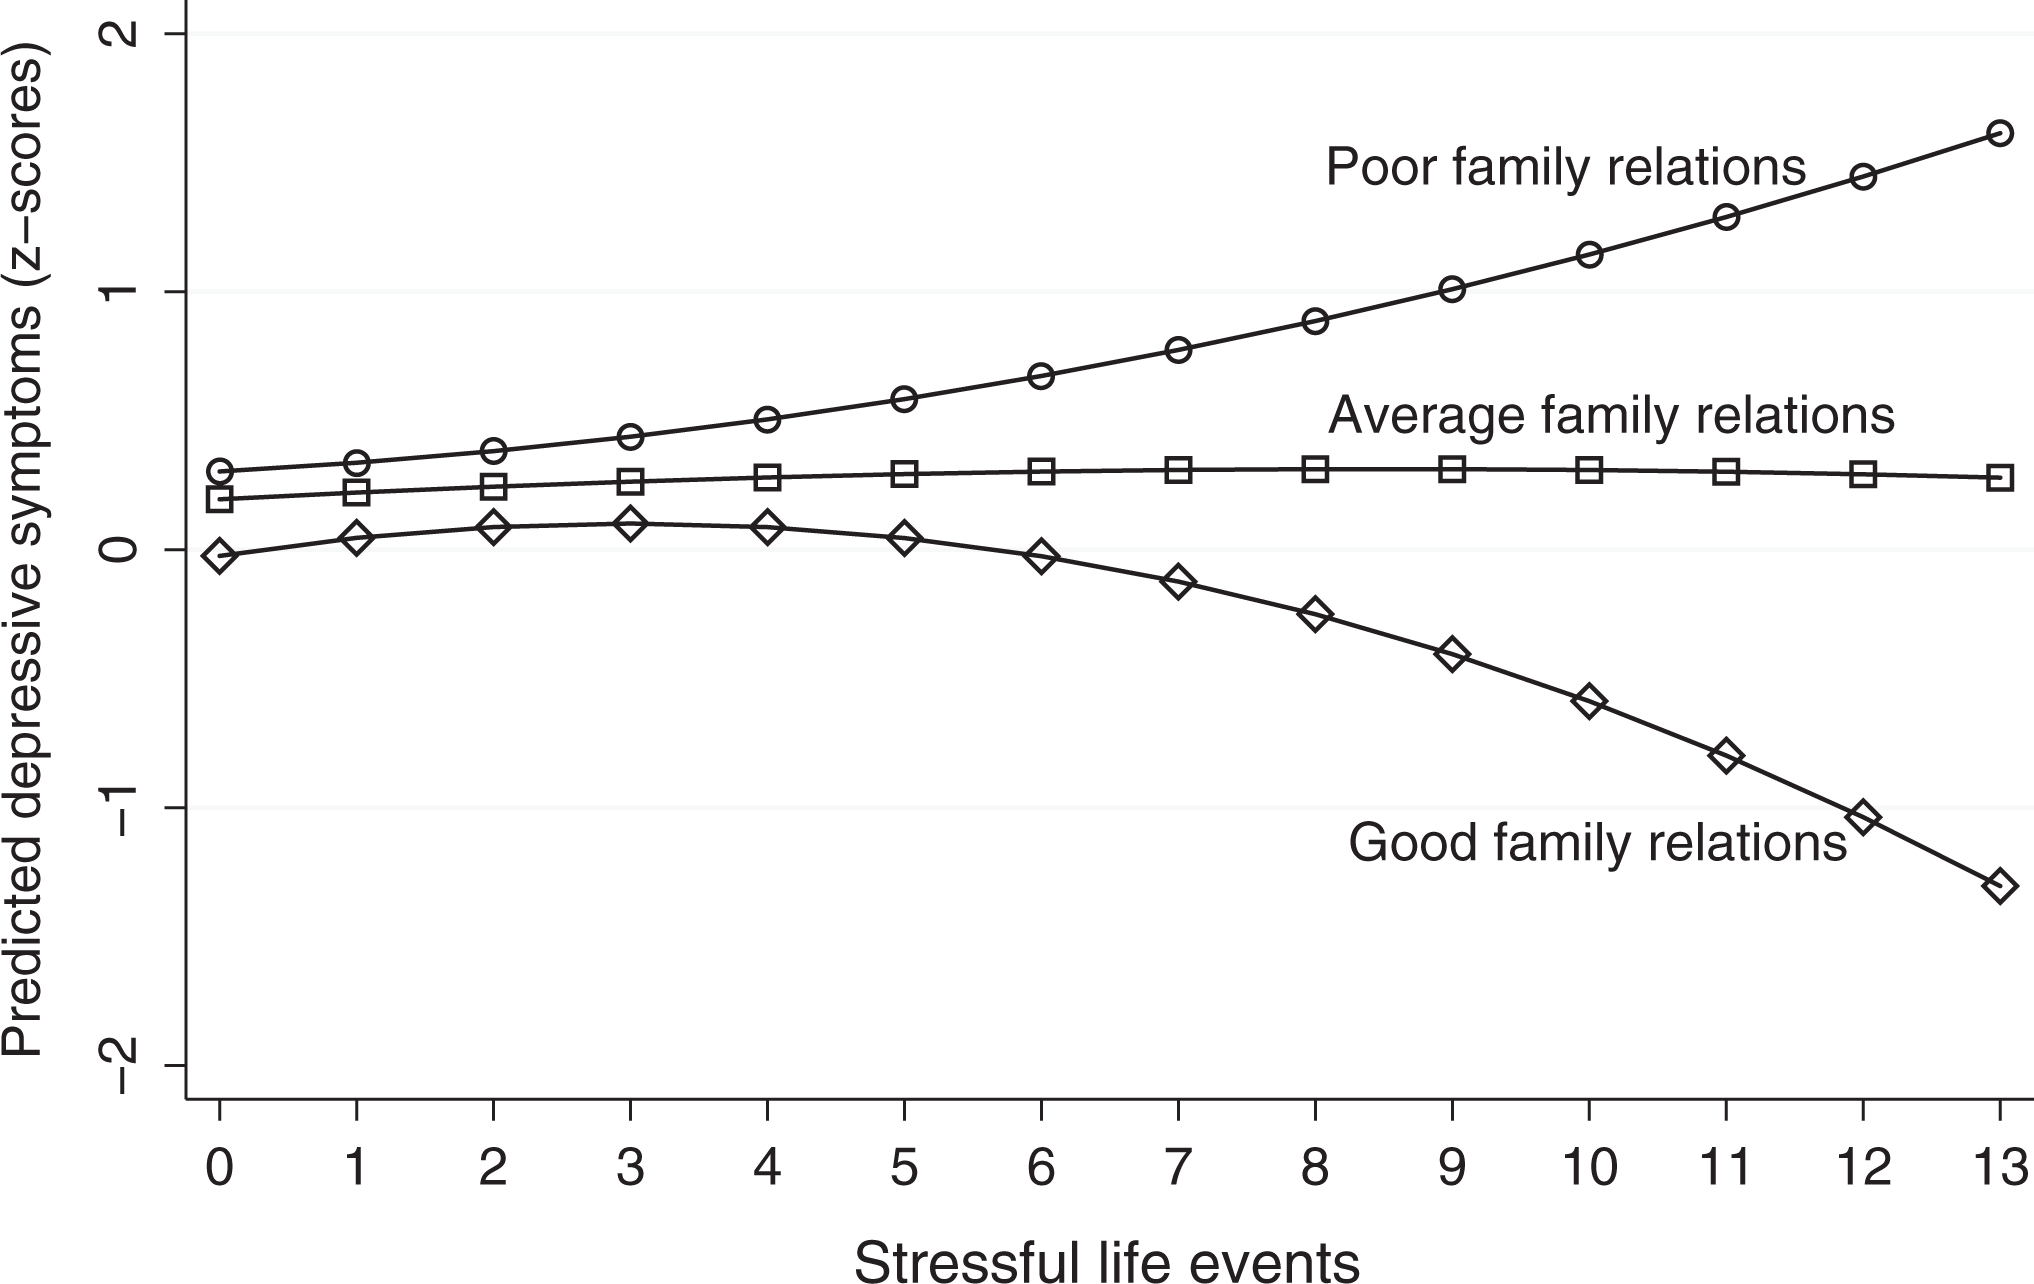
Predicted effects of life events and family relations on depressive symptoms, Family Health Study.
The figures provide a sense of strain’s nonlinear effects on delinquent behavior and depressive symptoms. Moreover, they elaborate the shapes of the bivariate associations shown in Figure 1. Both figures show a slight exponential increase in delinquency and depressive symptoms that accompanied an increase in stressful events when family relations were poor. To provide more context, transforming the predicted values back to their original metric suggested that when stressful events among those with poor family relations were between zero and about five, the predicted number of delinquent activities reported was close to one. Yet, when stressful events were between 9 and 12, the predicted number of activities was between eight and nine. Similarly, the depressive symptom scores increased from about 5 (0 to 4 stress events) to about 17 (10 to 13 events).
The patterns are discriminative when examining average and good family relations. Those who reported good family relations also reported the least involvement in delinquency when experiencing no stressful events. Moreover, stressful events had a rather flat association with delinquent behavior when family relations were average, and only a minimal positive increase when family relations were good. On the other hand, strong family relations had a notable protective effect on depressive symptoms. As shown in Figure 3, depressive symptoms were close to an average level for all three family relations groups when stressful events were zero, but as individuals experienced more events—about five or more—there was actually a nonlinear decrease among those reporting good family relations. In fact, the shift was from average depressive symptoms to about 1 SD below the mean for those who reported a large number of events. 10 This translates, for example, to a score in the original depressive symptoms metric of about 5 for those reporting zero stressful events to about zero for those reporting 11 to 13 events. These results provide evidence to support Hypothesis 2 but fail to support Hypothesis 4 that suggests the existence of a reverse stress buffering effect. 11 There was also no support for Hypothesis 3 in either model.
Sensitivity Analyses
There are several issues in the way the variables were measured and the models executed that mandate some sensitivity checks to determine whether the results are consistent. First, as pointed out earlier, some recommend that when researchers use variety scores to measure delinquent and criminal behavior, they should rely on models for count variables or for proportions. One approach is to utilize a logistic response model (also called binomial regression; Bishop et al. 2007; Britt et al. 2018). This is useful for modeling proportions (xi /ni ). In order to determine whether the results of the analysis were sensitive to the scaling decision, I utilized proportion scores for the counts of delinquent behavior and depressive symptoms in a multivariate multilevel generalized linear model assuming a binomial distribution and a logit link function. These models mimicked the models shown in Table 3. They were estimated with Gauss–Hermite quadrature to approximate the likelihood (McCulloch and Neuhaus 2013). Although there were a few differences in the magnitudes of the coefficients, the general results remained consistent. In particular, the nonlinear patterns shown in Figures 2 and 3 were approximately the same when using predicted values from the logistic response model. Online Appendix, Table 3a, provides the results of the full model.
Multivariate Multilevel Model of Stressful Life Events, Delinquent and Young Adult Criminal Behavior, and Depressive Symptoms, Family Health Study, 1993 to 2001.
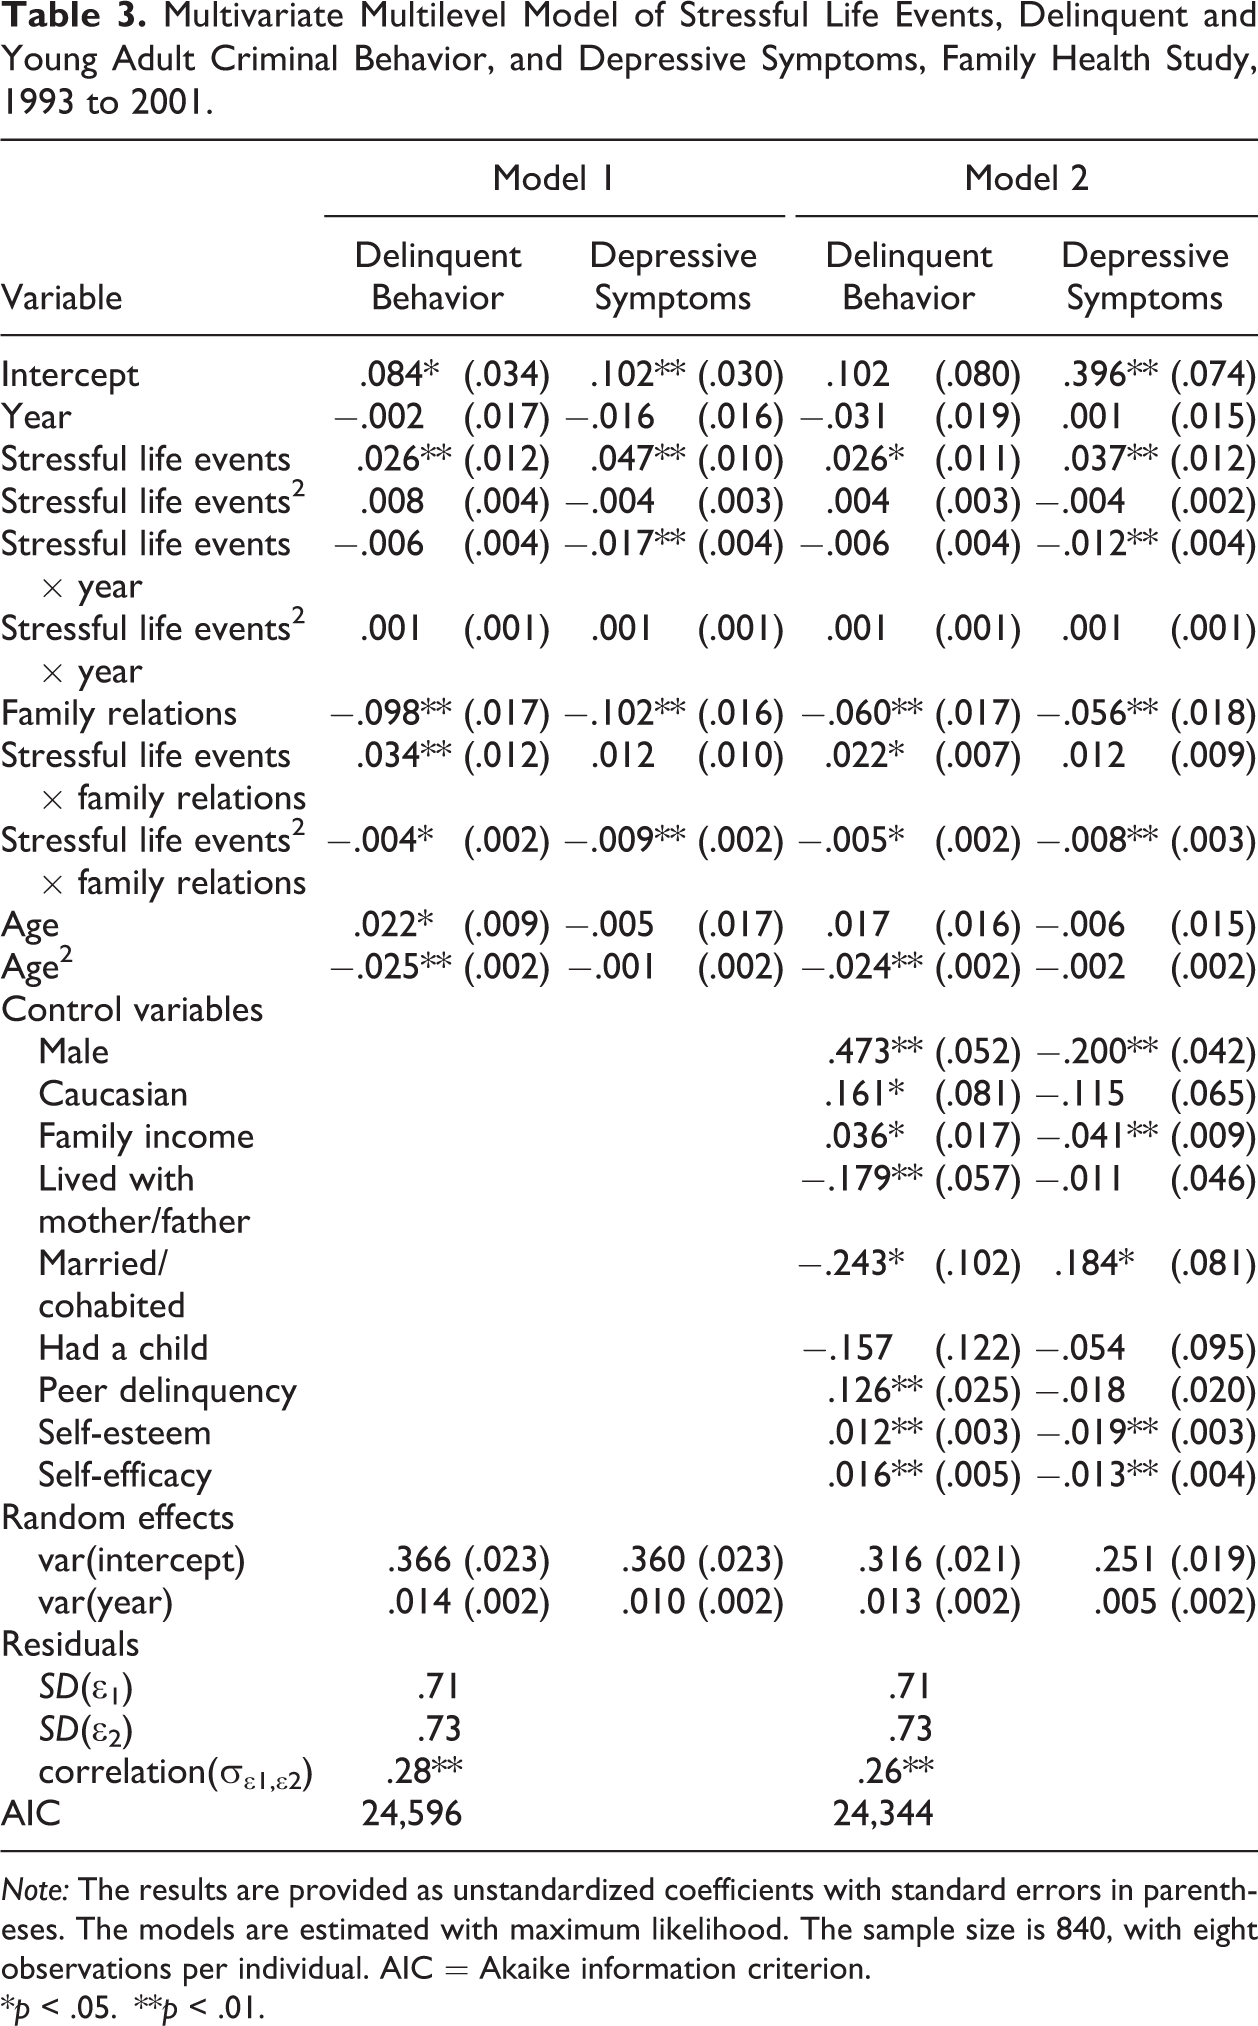
Note: The results are provided as unstandardized coefficients with standard errors in parentheses. The models are estimated with maximum likelihood. The sample size is 840, with eight observations per individual. AIC = Akaike information criterion.
*p < .05.
**p < .01.
Second, I examined the consequences of using a logged version of the delinquency measure in the multilevel models shown in Table 3. As mentioned earlier, utilizing the natural logarithm of the variable may induce a nonlinear pattern, which could result in misleading evidence attributed to the nonlinear stress explanatory variable. Hence, I reestimated the multivariate multilevel model using the z-scores of the unlogged version of delinquency. This did not result in any revised conclusions, although the level-1 residuals did manifest substantial right skew. Online Appendix, Table 3b, furnishes the results of this model.
Third, some researchers have pointed out that parametric regression models, such as estimated here, make strict assumptions regarding the shape of the associations among key variables. As an alternative, nonparametric regression models should be considered (Sullivan and Loughran 2014). These allow outcomes to be estimated as a smoothed function of the explanatory variables. Two promising nonparametric models that provide these functions are generalized additive models and multivariate fractional polynomial models (Binder et al. 2013; Sullivan and Loughran 2014). Research indicates that these models provide similar results when used to estimate regression models (Moore et al. 2011). Since a bivariate model estimated earlier utilized fractional polynomials (see note 7), I extended them to a multivariable model with a similar set of explanatory variables as those in Table 3 (see Online Appendix, Table 3c). The results showed the point at which the impact of stress changes—known as the “knot” in nonlinear regression (Binder et al. 2013)—is at the same point in the joint stress–delinquency distribution as those shown in Figures 2 and 3 when disaggregated by family relations (stressful events: df = 2 in each model). For instance, the “knot” for stress among those with poor family relations occurred at approximately six stressful events, whereas there was only a linear and flat association among those with average family relations (cf. Figure 2). The main difference occurred in the stress-depressive symptoms association: Those with good family relations manifested a slightly flatter association than that shown in Figure 3. 12
Finally, similar to Agnew et al. (2008), I estimated models that measured strain using categories of 0 (none), 1–2 (low), 3–4 (medium), and 5 or more (high) stressful events to determine whether the presumed nonlinearities remained under a different distributional assumption (see Online Appendix, Table 3d). Consistent with Figure 2, delinquency was substantially higher among those who experienced five or more events and reported poor family relations. Similarly, depressive symptoms were lower when family relations were good, even when stressful events were high (cf. Figure 3). This additional analysis supports the proposition that strain has nonlinear associations with both outcomes. 13
Discussion
There is a large and growing literature on the effects of strain on delinquent and criminal behavior and on mental health problems. The substantial number of studies in criminology has been due, in particular, to the efforts of Agnew (1992, 2006, 2015) to develop GST. Moreover, social psychologists have elaborated how stressful life experiences affect disorders such as depression (e.g., Oliva et al. 2009; Pearlin and Bierman 2013; Risch et al. 2009). These various studies have regularly shown that strain and stressful experiences among adolescents increase the likelihood of untoward outcomes.
However, a large majority of this research has merely considered strain in a linear fashion. In other words, there is a tacit expectation that the effect of strain on, say, delinquent behavior is the same whether one experiences only a few stressful events or a large number of events. Yet, as described earlier, there is theoretical support for the notion that strain has nonlinear effects on delinquent behavior, criminal behavior, and depressive symptoms. This was articulated by Agnew (1992, 2006) in his seminal work on GST and it is proposed by psychological models of functioning under stress, such as the accentuation principle in life-course research, the Yerkes–Dodson law of arousal, and the challenge model of resilience (Besser et al. 2007; Larson and Moses 2017). Moreover, the results of a small number of studies, almost all of which examined nonlinearities as a secondary issue, have been consistent with a nonlinear strain model, with a stronger impact on delinquent behavior and depressive symptoms as youth experience high levels of strain or stressful events (Agnew et al. 2008; Copeland et al. 2007; Currie and Tekin 2006; Thaxton and Agnew 2004).
It is unfortunate that studies have not focused clearly on an evaluation of nonlinear effects, such as those explored herein. The lack of attention by previous research risks underestimating strain’s actual impact and fails to provide valid test of GST or similar models. In addition, no study has considered depression and delinquency as jointly determined outcomes when assessing strain’s nonlinear effects. Considering the effects of strain on delinquency or depression only may lead to model misspecification if there is a residual correlation between the two. Hence, the empirical models presented herein are important because they (a) explored nonlinear strain effects, (b) assessed family relations as a key moderator of these effects, and (c) estimated delinquent/criminal behavior and depressive symptoms as multivariate outcomes.
The results of the multivariate multilevel model demonstrated that strain has a nonlinear impact on delinquent and criminal behaviors, but these effects are conditioned by family relations. At low levels of strain, between about zero and five events, the association with delinquency and depression was relatively flat regardless of whether family relations were poor or good. But, as shown in Figure 2, the combination of a high number of events and poor family relations was associated with more delinquent behavior (cf. Thaxton and Agnew 2004). This supported Hypothesis 2. Moreover, there was a positive residual correlation (ρ = .26, p < .01) between delinquency and depressive symptoms net the effects of all the variables in the model.
Turning to depressive symptoms, it appeared that, among those reporting poor and average family relations, strain operated is a similar fashion as it did on delinquent behavior, which also supported Hypothesis 2. Nonetheless, an unexpected result was that when family relations were good, there was a negative effect of strain on depressive symptoms once the number of events exceeded about six. This is a peculiar finding since, for instance, the stress buffering hypothesis intimates that social support should simply attenuate—or flatten out—the impact of stress on depressive symptoms (Dougherty et al. 2004; Grant et al. 2006). Yet good family relations were associated with a reduction in depressive symptoms at higher levels of strain. It is important to note, though, that one of the sensitivity analyses did not show the same degree of attenuation among those reporting good family relations (see the discussion of the multivariate fractional polynomial model). Clearly, more research is necessary to validate and to fully understand this effect.
The results failed to support Hypothesis 4: There is no evidence of a reverse stress buffering effect (Licitra-Kleckler and Waas 2003; Oliva et al. 2009). Rather, the findings point toward a positive impact of strong family relations, especially when considering delinquent and criminal behaviors. Moreover, the reverse buffering model would not predict that strain and depressive symptoms manifest a negative nonlinear association when family relations are strong. There was also no evidence that the effect of stressful events plateaued, thus providing no support for Hypothesis 3.
More broadly, the findings—especially regarding delinquent and young adult criminal behaviors—may be viewed in a couple of different ways. First, the effects of nonlinear strain on these behaviors were moderated by family relations. In other words, as Agnew and others have contended, family relations serve as a source of social support that diminishes the negative effects of strain. Second, the magnifying impact of poor family relations is consistent with Thaxton and Agnew’s (2004) argument that inadequate relations with parents and family members serve as a source of strain. Recall that Agnew (1992:63) claimed that “Above that level [of strain], stress/strain has a positive effect on negative outcomes, perhaps an additive effect or perhaps an interactive effect.” The current results might be seen as reflecting an interactive effect of two forms of strain: stressful life events and poor relations with parents. Thus, although the results shown in Figure 2 support both Hypothesis 2 and the broader framework of GST, the conceptual mechanism by which they do so is not yet as clear.
In general, the nonlinear strain effects found herein are important for a critical examination of much of the previous research on GST. Studies that have assumed linear effects of strain on delinquent and criminal behavior, in particular, may have missed some nuances. Assuming a strict linear association when, say, an exponential association exists can lead one to underestimate strain’s effects on delinquency. Moreover, family relations are worth further investigation as a crucial moderator of strain’s effects on delinquency and depression. Ignoring their effects risks missing a key moderator that shapes whether strain is channeled toward or away from these untoward outcomes.
The results also have important policy implications, for a practical ramification is that a fruitful focus of intervention programs should be on building strong family relations, especially for youth who experience a relatively frequent number of stressful events that are beyond their control. Of course, this is merely a single study, one that calls for replication by future disquisitions, but it does, nonetheless, highlight an intriguing process through which strain may operate to affect negative outcomes.
Although the results offered support for nonlinear strain effects, as well as a moderating role for family relations, there were several limitations that make replication vital. First, the FHS was not based on probability sampling and the use of inferential statistics with such a sample is suspect. Second, the model examines strain, family relations, and the outcomes over a particularly dynamic period in the life course. The data represent early adolescence to young adulthood, and it is questionable that the same mechanisms affect illicit behaviors and depressive symptoms among the study’s participants across such a period. Accordingly, future research should sensitize nonlinear strain models to developmentally appropriate causal mechanisms. Third, the FHS is not a diverse sample, especially in terms of ethnicity; thus, the results have limited utility for considering the broader population of young people in the United States.
Fourth, the data are several years old. Even though there is little reason to think that the social processes involving strain and negative outcomes have changed over this time period, other forms of strain that have emerged or increased in recent years, especially with the growth of social media and online issues such as bullying (Paez 2018), may affect how strain and delinquency or depression are associated. Fifth, there are other ways to conceptualize and model the association between delinquency and depression that future research might consider. This study examined them using a shared risk framework (Kofler et al. 2011) wherein they are both consequences of strain. However, recall that GST posits depression as a potential mediator, which coincides with the acting out framework, and other studies have examined depression’s effects on subsequent delinquency (the failure model). Future research should attend to each model and consider the impact of nonlinear strain.
The most consequential limitation, though, is the lack of a measure in the data of anger or angry disposition. As Agnew (1992, 2015) has noted, anger—as well as some other negative emotions—is a key mediator presumed to affect whether strain is channeled toward delinquent and criminal behavior. Although the evidence regarding its role has been inconsistent (cf. Jang and Johnson 2003; Tittle et al. 2008), anger continues to play a central role in GST and its empirical tests (Jang and Song 2015; Moon and Morash 2017). One might even argue that unless an empirical model includes a measure of anger or angry disposition, it is misspecified and cannot claim to be testing GST. Nonetheless, the model and results presented here were not designed as a complete test of GST, but rather drew upon GST and similar models to expand our understanding of how strain affects negative outcomes in a nonlinear fashion, especially when family relations are weak or strong. Moreover, elaborations of GST have noted that offending may be an instrumental response to strain as individuals act upon those responsible for their adversity (Felson et al. 2012). Although certain emotions, such as anger, are still germane to GST, there are also other reasons for linking strain to delinquency and depression that do not require them.
In sum, then, this study has furnished evidence that strain has nonlinear associations with two key outcomes: delinquent\young adult criminal behavior and depressive symptoms. Moreover, these nonlinearities were affected by family relations. When relations were weak or poor, the effects of strain tended to be magnified. Yet, when they were strong, the impact of strain on depressive symptoms in particular was diminished. Therefore, encouraging family social support and understanding the threshold effects of strain may help us understand more fully the behaviors and mental health of adolescents and young adults.
Supplemental Material
Supplemental Material, Appendix_A_-_Sensitivity_analyses_for_nonlinear_strain_effects_models - Nonlinear Strain Effects on Delinquent Behavior and Depressive Symptoms
Supplemental Material, Appendix_A_-_Sensitivity_analyses_for_nonlinear_strain_effects_models for Nonlinear Strain Effects on Delinquent Behavior and Depressive Symptoms by John P. Hoffmann in Journal of Research in Crime and Delinquency
Supplemental Material
Supplemental Material, Appendix_B_-_GST_studies,_1992-2018 - Nonlinear Strain Effects on Delinquent Behavior and Depressive Symptoms
Supplemental Material, Appendix_B_-_GST_studies,_1992-2018 for Nonlinear Strain Effects on Delinquent Behavior and Depressive Symptoms by John P. Hoffmann in Journal of Research in Crime and Delinquency
Footnotes
Author’s Note
All interpretations of the results are the sole responsibility of the author.
Acknowledgment
I appreciate helpful reviews of and suggestions about earlier drafts of this article by Bob Agnew, Mikaela Dufur, Scott Wolfe, Christopher Sullivan, and several anonymous reviewers. Thanks to Scott Baldwin for sharing his R and Stata code and discussing the empirical models with me. Moreover, I have benefitted from my collaborations with the late S. Susan Su, Felicia Gray Cerbone, Dean Gerstein, the late Alan Miller, Robert Johnson, and Tim Ireland.
Declaration of Conflicting Interests
The author(s) declared no potential conflicts of interest with respect to the research, authorship, and/or publication of this article.
Funding
The author(s) disclosed receipt of the following financial support for the research, authorship, and/or publication of this article: The funding for data collection of the Family Health Study was provided by grant DA05617 from the National Institute on Drug Abuse.
Supplemental Material
Supplemental material for this article is available online.
Notes
References
Supplementary Material
Please find the following supplemental material available below.
For Open Access articles published under a Creative Commons License, all supplemental material carries the same license as the article it is associated with.
For non-Open Access articles published, all supplemental material carries a non-exclusive license, and permission requests for re-use of supplemental material or any part of supplemental material shall be sent directly to the copyright owner as specified in the copyright notice associated with the article.