



Abstract
This study was designed to investigate preservice music teachers’ (N = 187) perceptions of employment preferences when considering future teaching positions. Adaptive Conjoint Analysis, a business market–based research tool, was used to determine preferences for personal factors (e.g., salary, commute), school environmental factors (e.g., administrative support, school type, student race-ethnicity, student socioeconomic status [SES]), and music teaching factors (e.g., resources, facilities, program sustainability, parental and community support). Results indicated that preservice music teachers perceived administrative support, parental and community support, and program sustainability as most important factors and student SES and student race-ethnicity composition as least important factors when considering future employment.
Few educational issues have received more attention this past decade than the U.S. public school system’s ability to provide high-quality education to all students (Boe, Cook, & Sunderland, 2007; Guin, 2004; Howey & Zimpher, 2007; Ingersoll, 2001; Ingersoll & Smith, 2003; Lankford, Loeb, & Wychoff, 2002; Peske & Haycock, 2006). To achieve this goal, an adequate supply of effective teachers is required. Districts and schools continuously engage in the cycle of recruiting bright new teachers while simultaneously seeking ways to retain their most effective teachers in an effort to meet the federal mandate to educate every student with a “highly qualified” educator (Guarino, Santibañez, & Daley, 2006; Guin, 2004; Ingersoll, 2001; Ingersoll & Smith, 2003; Lankford et al., 2002; U.S. Department of Education, 2004). Numerous efforts, such as alternative certification processes, induction programs, and professional development opportunities, have been employed to decrease the growing deficit of qualified teachers; however, even with the best efforts, national estimates suggest that approximately 500,000 teaching positions remain vacant each year (Hancock, 2009).
Researchers originally assumed the supply-and-demand deficit of qualified teachers was a result of the cohort of retirees—representing approximately one half of the national teaching workforce—who were hired between 1965 and 1975, when women and people of color had limited access to other occupations (Johnson & Birkeland, 2003). These projected retirements, in addition to a convergence of other factors—increased birth rates, influx of immigration, changes in class size policies, and new teachers’ early departure from the profession within the first 3 years of employment—perpetuated the teacher shortage crisis (Henke, Chen, & Geis, 2000; Johnson & Birkeland, 2003).
Initially, it seemed logical to merely increase the number of eligible teachers entering the workforce to meet the supply-and-demand needs of the profession (Johnson & Birkeland, 2003). However, further investigation revealed that only 16% of annual teacher departures was attributable to retirement; the remaining 84%, approximately half a million teachers, either left the profession (attrition) or transitioned from one school to another (mobility) (Boe et al., 2007; Horng, 2009; Ingersoll, 2001; Ingersoll & Smith, 2003; Johnson & Birkeland, 2003). Initially, researchers focused more on attrition than mobility, assuming that when a teacher departed from education, it was more detrimental to the profession than when a teacher transitioned from school to school, rationalizing that mobility did not influence the overall supply and demand of teachers (Ingersoll, 2001; Ingersoll & Smith, 2003). However, more contemporary researchers recognized that teacher departure, regardless as a result of attrition or mobility, has similar consequences: disruption of cohesiveness and effectiveness of school communities, interruption of educational programs, and a negative impact on professional relationships (Elfers, Plecki, & Knapp, 2006; Hahs-Vaughn & Scherff, 2008; Imazeki, 2005; Ingersoll, 2001; Ingersoll & Smith, 2003).
Attrition and mobility affects all academic areas, including music. Hancock (2008, 2009) reported that each year, more than 5,000 music teaching positions remained unfilled as a result of attrition and mobility. Madsen and Hancock (2002) and Hancock (2008) investigated music teacher retention and attrition and discovered attrition rates of 18% during a 5-year period and that 34% of the sample population left teaching within a 6-year period later. After extensive review of the 2000–2001 Teacher Follow-Up Survey, Hancock (2009) reported that music education experienced 11% mobility and 8% attrition, rates notably higher than non-arts-focused teachers.
Some general education scholars (Darling-Hammond, 2003; Lankford et al., 2002) have suggested that personal factors, such as salaries, commute time, and decision-making input, may influence teacher turnover. Other scholars (Imazeki, 2005; Ingersoll & Smith, 2003) have suggested that school environmental factors, such as class sizes, school facilities, and administrative support, are reasons teachers decide to leave or remain employed with a particular district or school. Although reasons for attrition and mobility may be transferable from the general education research, it is important that scholars investigate factors specific to music teaching because of the “reinforcing nature of music, idiosyncratic teacher prerequisites, and unique demands” music teachers may encounter (Hancock, 2008, p. 8). Results of research in music have suggested that isolation, extended duties and responsibilities, scheduling, and teaching loads may influence music attrition and mobility (Baker, 2007; Conway, 2003; Hamann, Daugherty, & Mills, 2007; Killian & Baker, 2006; Krueger, 2000; Madsen & Hancock, 2002). Other music-specific factors may include teaching workload, deadlines, limited job recognition, and lack of peer support (Hamann et al., 1987).
As recruitment and retention became more of a priority of the National Association for Music Education (NAfME), increasingly more research with preservice music teacher emerged. Topics studied included perceptions and attitudes toward teaching (Bergee, 1992; Hellman, 2008; Kvet & Watkins, 1992; Schmidt, Zdzinski, & Ballard, 2006), preferences for specific school teaching environments (Kelly, 2003; Madsen & Kelly, 2002), and perceptions of important teaching skills and behaviors (Butler, 2001; Campbell & Thompson, 2007; Teachout, 1997); however, no researcher has investigated various aspects of music teachers’ future employment plans, specifically, those that may influence attrition and mobility.
Attempts to find solutions for attrition and mobility are challenging because specific causes are only partially understood (Johnson & Birkeland, 2003), and it is difficult to disentangle various aspects of working conditions and school environments (Horng, 2009). Using utility maximization as a framework for understanding and investigating teacher mobility may provide insight into understanding of the distribution (and redistribution) of teachers among schools (Horng, 2009). With utility maximization, one assumes that people make decisions to maximize their utility or happiness, whether or not they can articulate such preferences. Because people have different preferences and values, choices are made on the basis of opportunities or preferences that are not static but, rather, change with time and context (Horng, 2009). In the absence of “perfection,” decisions are based on “trade-offs” between various factors. Therefore, when teachers choose among teaching jobs, they are expressing in part their preferences for specific employment conditions, such as salary, location, daily tasks, collegial and administrative support, and composition of the student body (Horng, 2009).
If attrition and mobility are based in part on teachers’ employment preferences, it would deem beneficial to determine employment factors that are “attractive” enough to encourage preservice music teachers to enter the profession and, better yet, remain. Are such factors similar to or different from those of in-service teachers? Is it possible that understanding more about employment factors that are important to preservice music teachers may assist with good job placement in hopes of reducing attrition or mobility? This study used Adapted Conjoint Analysis (ACA) to investigate preservice music teachers’ perceptions of personal, school environmental, and music teaching employment factors. Specifically, the following research question guided this study: What employment factors do preservice music teachers perceive as important when considering future employment?
Method
Participants
Participants were preservice music education majors attending National Association of Schools of Music–accredited 4-year public comprehensive undergraduate music education degree programs (N = 187). Advisors of National Association for Music Education Collegiate chapters were solicited to administer the survey at their respective colleges or universities. These individuals were identified through the national NAfME database of collegiate chapters, which provided a list that included 316 active chapters that met my criteria and were eligible for the study. Because of the limited academic-use license of the ACA software, the survey could be distributed to only 100 sites; therefore, 100 colleges and universities were selected using stratified random sampling to ensure that all NAfME geographical divisions had proportionate opportunities for representation. Chapter advisors were asked to forward the web-based survey to their respective collegiate chapter members. Because each advisor could forward the survey to multiple students, the response rate of 28% was calculated on the basis of the number of colleges and universities that responded to the initial call of participation.
Adapted Conjoint Analysis
Conjoint analysis, developed in the 1960s and 1970s, is a business market–based research model used to understand how consumers make decisions about preferences between products and services (Green & Srinivasan, 1978; Mele, 2008). The basic assumption of this methodology is that all decisions involve compromises and trade-offs, since “perfection” is rarely attainable. Individuals may be unable to articulate personal values clearly, but such values may be revealed and predicted by understanding the trade-offs people make (Horng, 2009). Traditional survey methods typically use a “compositional” approach whereby respondents indicate preference for each characteristic individually; however, conjoint analysis uses a “decompositional” approach in which respondents are asked to indicate preferences using a set of characteristics or profiles that coagulate various characteristics or attributes simultaneously (Horng, 2009). Conjoint analysis forces the respondent to evaluate conflicting attributes and uses the results to evaluate the internal consistencies and idiosyncratic behavior to disentangle characteristics and determine what one values the most (Mele, 2008). Adaptive conjoint analysis refers to the use of an Internet-based, interactive survey that customized each survey for each respondent on the basis of the respondent’s prior responses. Subsequent questions are adjusted to challenge the respondent to make more difficult trade-offs as he or she proceeds through the survey (Horng, 2009).
Participants responded to four sections of the interactive survey, which generated responses, additional questions, and hypothetical teaching scenarios on the basis of the respondent’s previous answers:
Preference for levels: Participants indicate “best-to-worst” or “worst-to-best” levels of preference for specific attributes when such preference would not be obvious.
Attribute importance: Using the level of preference indicated, participants provide initial levels of utilities (or preference) for attributes with similar value levels.
Paired-comparison trade-off questions: Participants select and indicate strength of preferences between two previously indicated preferences.
Calibrating concepts: Participants are presented customized “hypothetical” profiles ranging from very unattractive to very attractive for the respondent.
Conjoint analysis is based on three interrelated concepts: (a) Each product or service is a bundle of attributes, (b) each individual has unique values that reflect the desirability of different product features or attributes (part worth), and (c) combining utilities for different attributes measures the individual’s overall preference for a product or service (utility) (Green & Srinivasan, 1978; Mele, 2008). Finally, ACA uses ordinary least squares regression calculations to determine average utilities (or value) scores and importance scores of each employment factor.
Utility (or values) represents the desirability or value placed on each employment consideration factor—the higher the utility level, the more desirable the attribute level. For example, in the data gathered for this study, limited resources has an average utility value of −49.22, whereas adequate resources has an average utility of +.68, and excellent resources has an average utility value of +48.55, indicating that on average, preservice teachers would prefer excellent resources to limited resources. Utility values are interval data and are scaled to a random stabilizer constant within each characteristic (Green & Srinivasan, 1978; Mele, 2008); therefore, calculations and comparisons can be made only within characteristics and cannot be generated between characteristics. For example, additional salary (e.g., $5,000 additional salary per year) and school type (e.g., suburban) cannot be compared directly, but the desirability or value within additional salary intervals (e.g., $0 additional salary per year, $5,000 additional salary per year, and $10,000 additional salary per year) or school type (e.g., suburban, urban, private nonreligious, private religious, and rural) can be compared.
Unlike the utility score, average importance scores are ratio data and are used to make comparisons across characteristics to indicate the relative importance of each characteristic compared to the other characteristics. The ACA software calculates the range of the utility value (subtracting least preferred level from the most preferred level) and adjusts those ranges so that the sum of all characteristics equals 100; if it were possible for each characteristic to be preferred equally, the importance score of each characteristic would be 10 (Green & Srinivasan, 1978). Inferences can be made that an employment factor with an importance score of 20 would be twice as important as one with an importance score of 10. To determine significance differences between pairs of employment characteristics, two-tailed paired-sample t tests comparing the mean importance scores may be used (Horng, 2009).
ACA has been used in several professions, including medicine and health (Markham, Diamond, & Hermansen, 1999; Singh, Cuttler, Shin, Silvers, & Neuhauser, 1998; Telser & Zweifel, 2002), marketing (Green & Krieger, 1991; Green & Srinivasen, 1990; Wittink & Cattin, 1989), and agricultural and environmental fields (Alriksson & Öberg, 2008; Darby, Battley, Ensa, & Roe, 2008; Tano, Kamuanga, Faminow, & Swallow, 2003), to name a few. ACA has not been used as much in education research, but it is becoming increasingly more popular. Educational studies that have used ACA were primarily higher education studies in which researchers investigated recruitment (Bickel & Brown, 2005; Sohn & Ju, 2009; Sontar & Turner, 2002), student course choice and preference (Maringe, 2006; Moogan, Baron, & Bainbridge, 2001; Zufryden, 1983), and effectiveness of academic services (Crawford, 1994; Decker & Hermelbracht, 2006; Howard & Sobol, 2004).
Horng (2009) used conjoint analysis to analyze the sorting of teachers (N = 531) to determine whether specific working conditions or student demographics influenced teacher mobility in a California elementary school district in an effort to disentangle student demographics from other characteristics of the teaching job. Results indicated that teachers identified working conditions—particularly, school facilities, administrative support, class sizes, and salaries—as significantly more important than student demographic characteristics when selecting a school in which to teach.
Survey
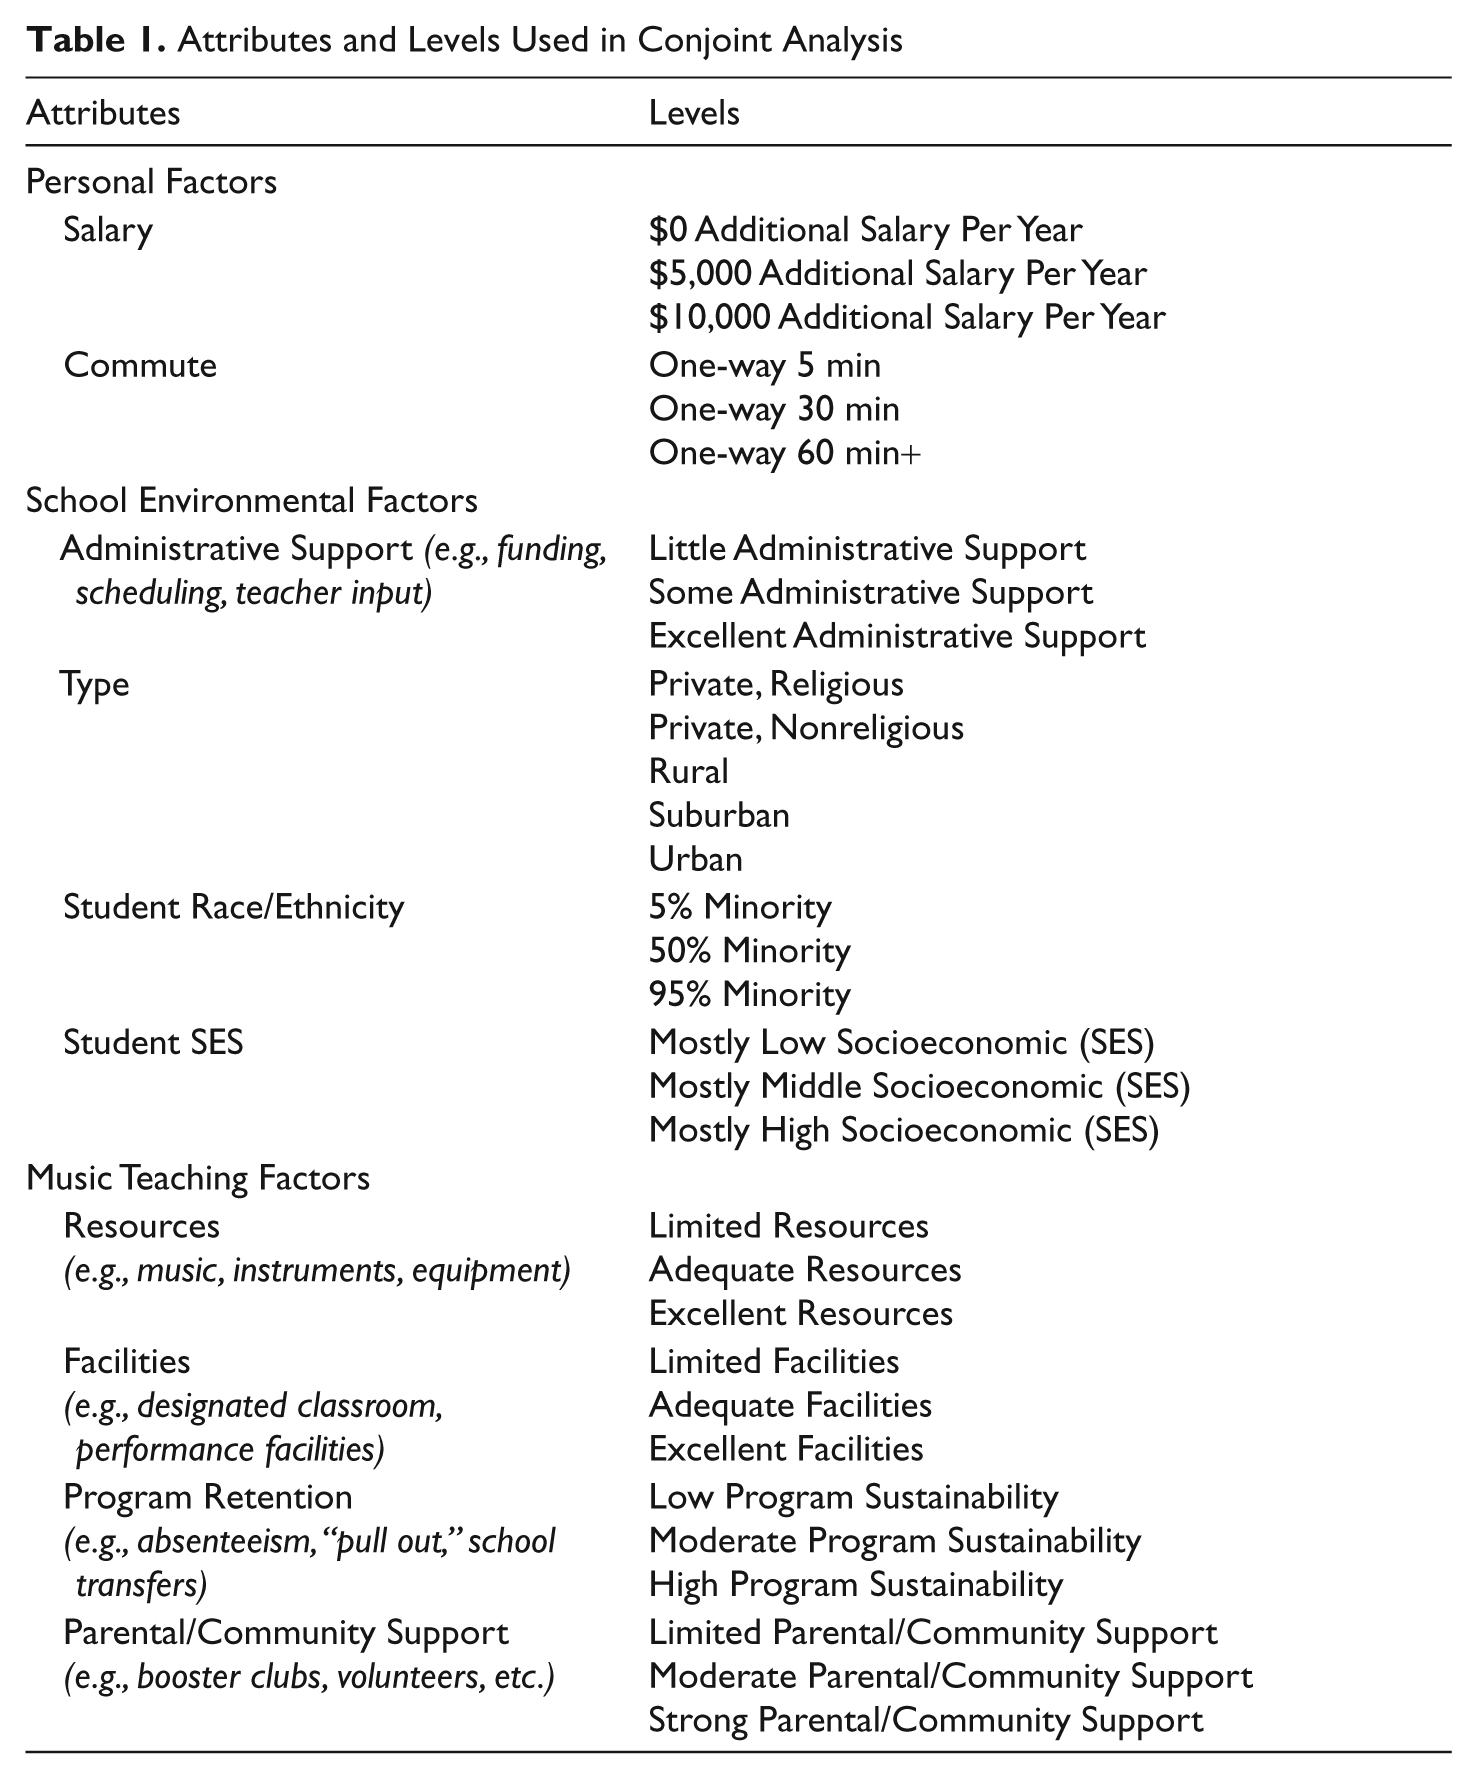
Data were collected using the ACA Sawtooth Statistical Software (Sawtooth Software, 2011). Survey questions were organized into three general categories: personal (e.g., salary, commute time), school environmental (e.g., administrative support, school type, student ethnicity, student socioeconomic [SES] composition) and music teaching (e.g., classroom resources, facilities, program sustainability, and parental and community support) factors. Table 1 details the attributes, levels of factors, and subcategories of each factor used in this study. Survey questions pertaining to personal factors and school environmental factors were replicated in part from the Horng (2009) study. Questions related to music teaching factors were derived from research and consultation with various music administrators, teachers, and students. Participants completed an interactive, web-based ACA survey including five demographic questions, 10 importance rankings statements, 20 forced-paired questions, and 10 hypothetical school scenarios that participants had to calibrate (or score). Completing the survey took approximately 15 min. At the conclusion of the survey, each participant received an individual analysis of his or her results.
Attributes and Levels Used in Conjoint Analysis
Results
The survey sample consisted of undergraduate music education majors attending 4-year public colleges and universities throughout the United States. Regional representation included 46 (24.6%) respondents from the NAfME Eastern Division, 54 (28.9%) from the North Central, 14 (7.5%) from the Northwest, 64 (34.2%) from the Southern, and 9 (4.8%) from the Southwestern Division; no surveys from the Western Division were returned. One hundred and eleven (59.4%) of the respondents were female and 76 (40.6%) were male; 38 (20.3%) indicated their degree classification as freshman, 31 (16.6%) as sophomore, 38 (20.3%) as junior, and 80 (42.8%) as senior. With respect to teaching concentration, 22 (11.8%) of the participants indicated elementary or general, 44 (23.5%) choral or vocal, 105 (56.1%) instrumental–band, and 16 (8.6%) instrumental–strings. Race-ethnicity demographics were as follows: 3 (1.6%) Asian, 5 (2.7%) Black or African American, 3 (1.6%) Hispanic or Latino, 173 (92.5%) White or Caucasian, and 3 (1.6%) Other.
The average utility values, reported in Figure 1, indicates that the respondents indicated they would prefer, in general, higher salaries (+46.94) to lower salaries (–49.61), excellent administrative support (+64.75) to little administrative support (–65.60), excellent resources (+48.55) to limited resources (–49.23), excellent facilities (+40.88) to limited facilities (–46.99), high program retention (+50.99) to low program retention (–56.50), shorter commutes (+44.24) to longer commutes (–53.24), and strong parental and community support (+51.57) to little parental and community support (–55.67). Results also indicated that preservice teachers would prefer teaching in schools where most of the students are from middle-income families (+21.27) to schools where most of the students are from low-income (–22.51) or high-income families (+1.83). In regard to student race-ethnicity, preservice music teachers indicated a preference to teach at schools where student populations are 50% minority (+19.29) versus schools with 95% minority (–17.83) or 5% minority (–1.36) populations. Respondents also appeared to desire to teach in suburban (+29.72) school environments more than in urban (–0.92), rural (–3.98), and private (both religious [–23.34] and nonreligious [–1.48]) schools.
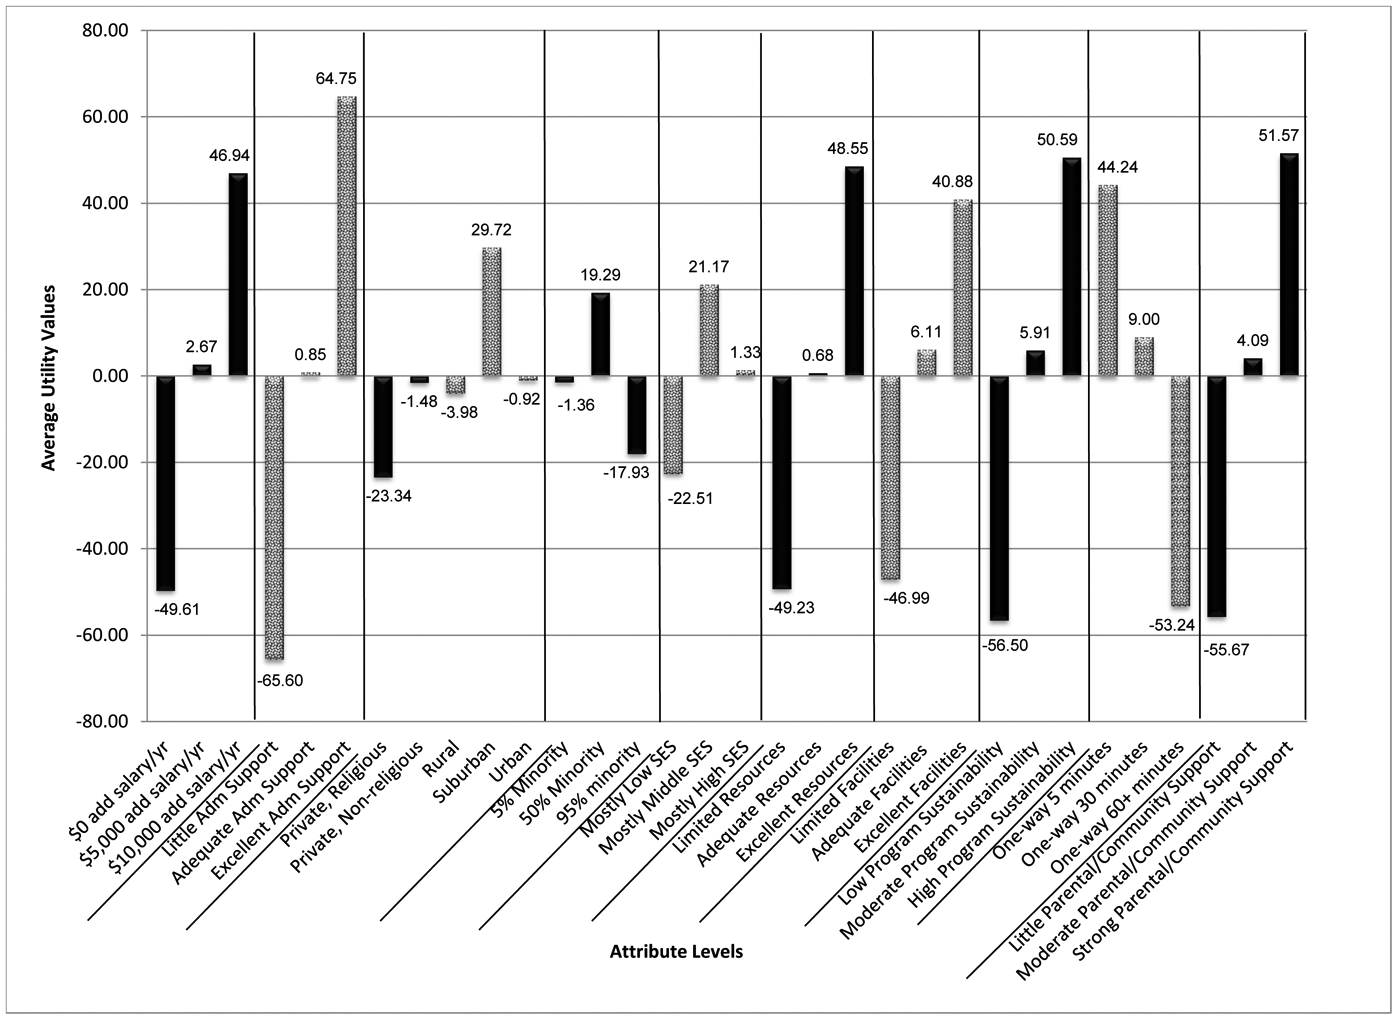
Average utility values for each level of employment factors
The importance scores across employment factors indicated that preservice music teachers perceived school administration (M = 13.11, SD = 4.43), parental and community support (M = 11.05, SD = 4.21), and program sustainability (M = 11.00, SD = 3.75) as the more important factors and student SES (M = 7.30, SD = 3.80) and student race-ethnicity (M = 7.04, SD = 3.80) as lesser important employment factors. Other factors, such as commute (M = 10.43, SD = 4.71), school type (M = 10.82, SD = 4.44), resources (M = 10.09, SD = 3.66), salary (M = 9.92, SD = 4.35), and facilities (M = 9.20, SD = 3.65) ranked closely together in the middle. Because scores indicated that the 10 employment characteristics were not equally preferred, two-tailed paired t tests were calculated to investigate the differences (Horng, 2009). Results indicate that a number of pairs were significantly different at the .001 level (the alpha level set to prevent Type 1 statistical error), as indicated in Table 2. Note that school administration was rated as significantly more important than any other factor and that all factors were listed as significantly more important than student SES or race-ethnicity.
T Values of Two-Tailed, Paired-Samples T Tests for Importance Scores of Employment Characteristics Variables
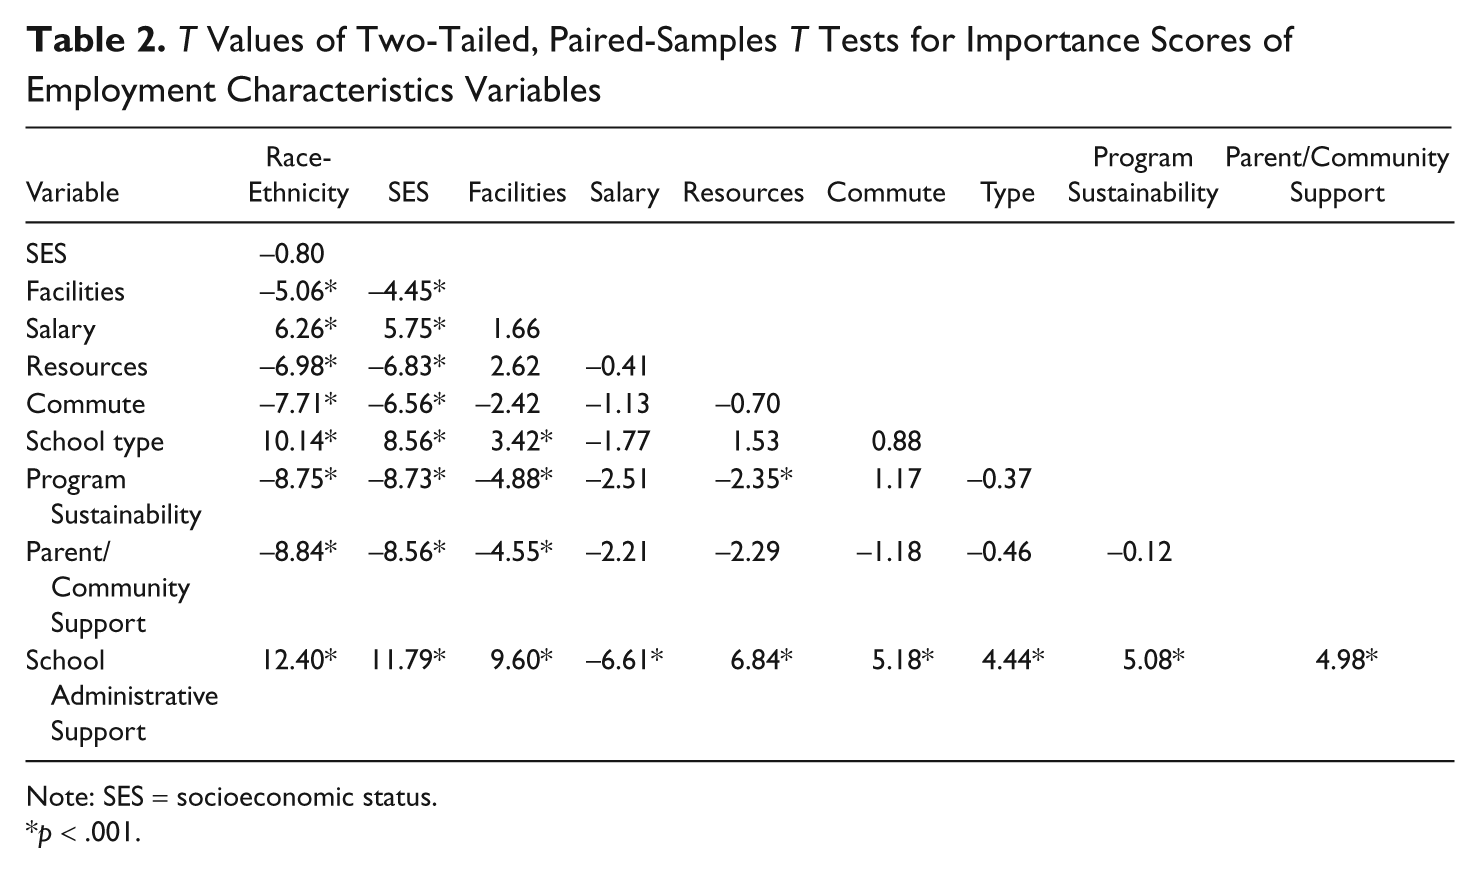
Note: SES = socioeconomic status.
p < .001.
Discussion
As education policy makers devise strategies to recruit and retain preservice music teachers in the profession, it may be advantageous to understand specific employment factors preservice music teachers deem important. When teachers choose a school or district in which to teach, in essence they are indicating their preference for specific employment conditions (e.g., salary, location, administrative support, student body composition). Schools with less favorable conditions have greater difficulty recruiting and retaining teachers and consequently have higher turnover rates than schools with more favorable conditions (Horng, 2009). Horng (2009) explained, At the individual teacher level, there are a myriad of unmeasurable [sic] factors which may persuade a teacher to select one school over another. At the aggregate level, however, teachers are more likely to choose a school and less likely to leave if teaching conditions are favorable. (p. 706)
In this study, I attempted to determine preservice music teachers’ perceptions of what is important in regard to personal, school environmental, and music teaching factors when considering employment. Specifically, when preservice music teachers are provided an opportunity to indicate employment factors of an “ideal” school, what does it look like? ACA was used to compute utility (or value) scores and importance scores for specific employment factors and to determine preservice music teachers’ perceptions of priority preferences. Not surprisingly, utility scores indicated preference for higher salaries to lower salaries, excellent administrative support to little administrative support, excellent resources to limited resources, excellent facilities to limited facilities, high program sustainability to low program sustainability, shorter commutes to longer commutes, and strong parental and community support to little parental and community support.
Preservice music teachers also indicated a stronger preference to teach in suburban schools than in urban, rural, and private (both religious and nonreligious) schools. These findings coincide with those of researchers who have suggested music education majors’ desire to teach in schools that are similar to those of their precollege music experiences (Kelly, 2003). A majority of participants (51.9%) in this study had attended large suburban public schools. Although preservice music teachers in this study indicated a preference to teach in suburban schools where the racial composition tends to be predominately White, they also indicated a preference to teach in schools with diverse socioeconomic and racial-ethnic student populations rather than schools with extremities in populations: very high (95%) or very low (5%) ethnic minority and socioeconomic-level populations. This slight contradiction may be an indication of the positive benefits of cultural curricular experiences that seem to be becoming increasingly more incorporated into undergraduate degree programs. Although preservice music teachers’ personal experiences, cultural backgrounds, and precollege music experiences may be a major factor when students seek employment (Kelly, 2003), results of this study may indicate that preservice music teachers are “open” to teaching student populations different from their personal experiences. Strategically diversified observations, field experiences, and student teaching placements may broaden music students’ experiences to prepare them better to work in more diverse environments.
Importance scores indicated that these preservice music teachers perceived administration (school environmental), parental and community involvement (music teaching), and program sustainability (music teaching) as the most important employment factors. It is interesting that preservice music teachers have the ability to understand the importance of these factors and how each may positively or negatively influence their ability to establish, develop, and sustain a successful school music program. Administrative support ranked the highest preference among importance scores and also was the only employment factor that was significantly higher when compared to all the other employment factors. These findings reflect research-based implications that the perception of strong administrative support may be the most positive effect on music teacher retention (Killian & Baker, 2006). Because of the unique nature of music teaching, music educators may interact with administration differently and more frequently than do nonmusic teachers; therefore, a lack of administrative support could actually be more detrimental to a music teacher or music program than to a nonmusic teacher or nonmusic academic area (Gardner, 2010; Killian & Baker, 2006). It is interesting that preservice music teachers understand and have an awareness of the importance of parental involvement on the success and failure of music learning (Davidson, Sloboda, & Howe, 1995/1996) and school music program retention (Hartley, 1996).
Interestingly, the preservice music teacher participants indicated student SES (school environment) and racial-ethnic composition (school environment) as the least important employment factors when considering a teaching position. These findings may contradict perceived impressions that teachers prefer not to teach minority and impoverished students. Although preservice teachers initially are inclined to accept teaching positions in high-poverty, high-minority schools, these teachers tend to transition from such schools to low-poverty, low-minority schools within 3 to 5 years (Guin, 2004; Ingersoll, 2001; Ingersoll & Smith, 2003; Lankford et al., 2002; Peske & Haycock, 2006). Horng (2009) used conjoint analysis to disentangle various aspects of working conditions and school environments and found that teachers moved more as a result of concern with school climate, behavioral climate, and school safety—not necessarily because of poverty and minority enrollment.
It is important to note some limitations of this study. First, the participants did not rank order each employment factor individually. The rankings of these factors were computed by the ACA software; computations were based on the participants’ responses to numerous forced-pair entries. It is also important to acknowledge that the importance scores are transformations of the data that ACA makes to permit comparisons across the various factors so that the relative importance of each factor to the other factors may be inferred.
This study only begins to reveal employment factors preservice music teachers may deem important when considering a teaching position. It is reasonable to infer that preservice music teachers may have concerns about specific employment factors similar to those of in-service teachers, even though they have had no actual teaching experience. It seems as though preservice music teachers gravitate toward the “known” rather than the “unknown” when selecting certain types of schools for employment; therefore, it is important that preservice music teachers receive a variety of diverse teaching experiences in the undergraduate curriculum. ACA is based on three interrelated concepts, which transferred to music education would suggest that (a) each district or school has a bundle of attributes (or factors), (b) each individual has unique values that reflect the desirability of different districts’ or schools’ characteristics or attributes, and (c) combining utilities for different attributes measures the individual’s overall preference for teaching in a specific district or school. With this in mind, further research regarding how best to ensure a complementary relationship between the music teacher’s intrinsic values and the employment characteristics of a specific school or district may be beneficial in understanding the distribution, and redistribution, of music teachers across the nation.
Footnotes
Declaration of Conflicting Interests
The author declared no potential conflicts of interest with respect to the research, authorship, and/or publication of this article.
Funding
The author received no financial support for the research, authorship, and/or publication of this article.