
Abstract
The purpose of this study was to describe the development of a valid and reliable rubric to assess secondary-level solo instrumental music performance based on principles of invariant measurement. The research questions that guided this study included (1) What is the psychometric quality (i.e., validity, reliability, and precision) of a scale developed to assess secondary-level solo music performance? (2) Do the proposed items fit the measurement model, and if so, how do the items vary in difficulty? and (3) How does the structure of the rating scale vary across individual items? The psychometric considerations in this study included calibrations of items, persons, raters, school level, musical instrument, and rating scale structure using the Multifaceted Rasch Partial Credit Measurement Model. A 13-member cohort of music content experts participated as raters in this study. A total of 75 video performances of secondary-level solo and ensemble performances were evaluated. The result was the development of the Music Performance Rubric for Secondary-Level Instrumental Solos (MPR-2L-INSTSOLO), a 30-item rubric consisting of rating scale categories ranging from two to four performance criteria. Implications for consequential validity, rater training, standard setting, and benchmarking are discussed.
In a data-driven educational environment, valid and reliable empirical evidence of student achievement and standardized assessment systems are at the forefront of policy-based decisions (U.S. Department of Education, 2009). In music, the call to move toward assessment systems that demand standardized measurement instruments with clear benchmarking/illustrative exemplar systems is evidenced nationally through the ongoing work of the National Association for Music Education’s (NAfME) Core Arts Standards and Model Cornerstone Assessment committees (Shuler, Norgaard, & Blakeslee, 2014) and internationally through the Associated Board of Royal Schools of Music’s (ABRSM) and Australian Music Examinations Board’s (AMEB) implementations of multiple exam systems. Furthermore, music educators are now subjected to teacher and curriculum effectiveness frameworks where individual student achievement data are an important evaluative component of such evaluations (Wesolowski, 2014, 2015). For teachers to be effectively evaluated, inferences drawn from student achievement measures must be valid and reliable. The validity of measures, however, has been called into question for many performance assessment contexts in the field of music, as students are often evaluated on nonperformance criteria when performance is the central focus of their classroom experiences (Wesolowski, 2015). The reason for this is dualistic (Wesolowski, 2014). First, states and districts are using measures not intended specifically for the context of music performance assessment as a mechanism for evaluating student performance achievement. In many instances, states and districts are implementing schoolwide measures of growth using externally created measurement instruments designed for the broad application of all grades and subjects (Buckley & Marion, 2011). As an example, the state of Georgia clearly maintains that new measures will not be designed for subject-specific areas because such measures developed across multiple courses and subject areas “are not cost-effective” (Georgia Department of Education, 2012: 98). Furthermore, some states are evaluating music teachers based on their students’ standardized mathematics and English Language Arts (ELA) evaluation reports (Steele, Hamilton, & Stecher, 2010). This poses serious consequential validity flaws in the evaluative system as the central purpose of a measurement instrument is predicated on the notion that it measures a specific and unique construct (Wilson, 2005). In these instances, measures intended for evaluating student performance were not intended by the measure developer to be used for evaluating teacher effectiveness (Messick, 1989). Second, because of the field’s lack of validated measurement instruments designed specifically for music performance assessment contexts, music educators often are required to develop their own measures (Buckley & Marion, 2011). Although music educators are content experts, a lack of adequate training in scale development and related psychometrics poses serious construct validity flaws in evaluation systems, particularly when the instruments are designed to provide student achievement data in lieu of data derived from standardized tests. Districts and states therefore are not obtaining an accurate representation of performance achievement of secondary-level music students.
The purpose of this study was to describe the development of a valid and reliable rubric to assess secondary-level solo music performance. The research questions that guided this study include (1) What is the psychometric quality (i.e., validity, reliability, and precision) of the scale developed to assess secondary-level solo music performance? (2) Do the proposed items fit the measurement model, and if so, how do the items vary in difficulty? and (3) How does the structure of the rating scale vary across individual items?
Phenomenography and Outcome Space in the Scale Construction Process
Wilson (2005) brings to light the method of phenomenography as an important scale construction process component. Marton (1986) defines phenomenography as “a research method for mapping the qualitatively different ways in which people experience, conceptualize, perceive, and understand various aspects of, and phenomena in, the world around them” (p. 31). In particular, Wilson argues that the inclusion of phenomenography in scale construction processes occurs through the active acknowledgment and development of an “outcome space” (p. 71). An outcome space includes all qualitative decision-making processes underpinning the development of the scale. It is where the theoretical intersects with the practical and the quantitative intersects with the qualitative. More specifically, these decision-making processes include the carefully crafted definition of the construct intended for measurement, a clear definition of the descriptive components of the item design, strategic development of the item pool, and post hoc refinement of the items.
Although these considerations are not unique to scale construction processes in music, this study offers a unique approach of strategically implementing phenomenographic processes. The outcome space was an integral part of the scale construction process via the inclusion of music content experts throughout the entirety of its development. As van der Linden (1992) notes, the state of the art of measurement related to test construction can be improved through these processes. In particular, he urges test constructors to start applying models in discussion with content experts . . . [and] to start pretesting items . . . we should be looking for the intersection between what content experts agree on and what fits the [measurement] model. This may be easier in psychological measurement, where we have much more theoretical background and where we construct real psychological variables. (5:33–6:18)
As is explained in the Method section, this study incorporated the active participation of a cohort of 13 music content experts (e.g., secondary-level music educators) throughout the entirety of the scale construction process. This process provided the content experts with the opportunity to (a) be engaged with and be thoughtful of the research and pedagogical literature; (b) draw on their unique classroom and teaching experiences; (c) reflect on the practicality of the items throughout the construct development, item design, and rating scale development processes; (d) actively engage with the preliminary rating scale through the evaluation of 75 distinct musical performances; (e) reflect on the scale development and rating processes through the debriefing of quantitative analysis and related results in a didactic manner; and (f) refine the rating scale through the post hoc rubric development process. The strength of this study, as van der Linden discusses, was to bring together the music practitioner community and the music measurement community to construct a measure in a way that uses language and content true to what secondary-level music educators are actively doing in their classrooms while establishing validity, reliability, and fairness in the scale construction process.
Psychometric Considerations
In the field of music education, factor-analytic (FA) approaches to rating scale construction most often are used as a psychometric mechanism for developing measurement instruments. FA methodologies have been used to accommodate instrument-specific performances (Abeles, 1973; Bergee, 1987; Jones, 1986; Nichols, 1991; Pazitka-Munroe, 2003; Russell, 2010; Zdzinski & Barnes, 2002), instrumental jazz improvisation (Horowitz, 1994; D. T. Smith, 2009), jazz improvisation achievement (Pfenninger, 1990), and ensemble performance (Cooksey, 1977; DCamp, 1980; B. P. Smith & Barnes, 2007; Wesolowski, 2016).
Applications of FA as a means for scale construction attempt to systematically establish common items to a particular performance area. Because the purpose of this study was to develop a new scale where confidence in the functioning of proposed items was not strong (e.g., exploratory investigations of local dependence and item fit were unknown), Rasch analysis was chosen to be the appropriate and most meaningful methodology (Christensen, Engelhard, & Salzberger, 2012). FA alone is arguably an insufficient methodology for the development of measurement apparatuses for several reasons: (a) its inability to address spurious evidence (Kreiner & Christensen, 2004); (b) factor analysis models alone do not separate respondent and item properties, resulting in factor loadings and item intercepts that are sample dependent and confounded across raters (Meredith, 1993); and (c) factor analysis methods often rely on problematic assumptions of interval scale properties of item scores (Wraugh & Chapman, 2005; Wright, 1996). Therefore, the Multifaceted Rasch Partial Credit Measurement Model (MFR-PC; Linacre, 1989) was used to evaluate the psychometric quality (i.e., validity, reliability, and precision) of the proposed scale.
The major benefit of the Rasch model is that when adequate fit to the model is observed, five requirements for invariant measurement are met. The five requirements for invariant measurement include (a) rater-invariant measurement of persons (i.e., the measurement of persons must be independent of the particular raters that happen to be used for the measuring), (b) non-crossing person response functions (i.e., a more able person must always have a better chance of obtaining higher ratings from raters than a less able person), (c) person-invariant calibration of raters (i.e., the calibration of the raters must be independent of the particular persons used for calibration), (d) non-crossing rater response functions (i.e., any person must have a better chance of obtaining a higher rating from lenient raters than from more severe raters), and (e) variable map (i.e., persons and raters must be simultaneously located on a single underlying latent variable; Engelhard, 2013). When the data fit the requirements of the Rasch model, then it becomes possible to support invariant measurement that also implies rater-invariant measurement of performances. In other words, construct-irrelevant factors (i.e., individual characteristics of persons, raters, or items) do not contribute any interference between observed data and expectations of the Rasch model.
The Partial Credit version of the model (Masters, 1982) adds an additional parameter to the model that allows for the investigation of rating scale structure across individual items. This formulation of the MFR-PC model makes it possible to test the null hypothesis of equidistant rating scale categories across all items. The addition of this parameter provides construct evidence of the measure through the verification of an increasingly monotonic relationship between adjacent categories (i.e., the preservation of increasingly positive ordering that establishes an intended direction of “more achievement”), acceptable discrimination between performances, appropriate distribution of frequency use by raters (i.e., multimodal use of all available rating scale categories), and levels of acceptable randomness for the stochastic process of probabilistic modeling (i.e., acceptable levels of unsystematic variability for probabilistic processes; Linacre, 2002). The PC model is specified as follows:
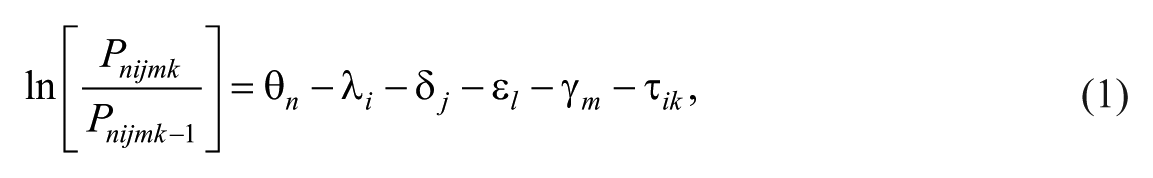
where ln[Pnijmk/Pnijmk–1] = the probability that Performance n rated by Rater i on Item j receives a rating in category k rather than category k – 1, θ n = the logit-scale location (e.g., achievement) of Performance n, λ i = the logit-scale location (e.g., severity) of Rater i, δ j = the logit-scale location (e.g., achievement) of Musical Instrument j, ϵ l = the logit-scale location (e.g., achievement) of School Level l, γ m = the logit-scale location (e.g., difficulty) of Item j, and τ ik = the location on the logit scale where rating scale categories k and k – 1 are equally probable for Rater i.
The logit scale can be conceptualized as a common “ruler” that measures the unidimensional latent construct. In this case, the unidimensional construct can be defined as secondary-level solo wind instrument performance achievement. The logit-scale locations (i.e., measures) for each element (i.e., each performance, rater, item, etc.) of each parameter (i.e., performance parameter, rater parameter, item parameter) indicated in the previous model are the specific locations on the “ruler.” This allows for a meaningful comparison of each parameter and/or element in the same unit. Analysis of the rating data was conducted using the computer program FACETS (Linacre, 2014).
Method
Rater Cohort of Content Experts
A cohort of 13 content experts participated in this study over a course of 6 weeks. The cohort had an average of 8.25 (SD = 5.59) years of secondary-level instrumental teaching experience. The cohort met for 4 days per week for 6 weeks. Each session lasted approximately an hour and a half. Cohort time was dedicated to (a) gleaning evaluative content from research literature, (b) developing and categorizing items, (c) gathering performance stimuli (e.g., videos of musical performances), (d) evaluating performances, (e) participating in think-aloud evaluation protocols, and (f) defining performance criteria.
Development of Initial Item Pool
In order to make the breadth of the item collection and validation process more manageable and to improve the practicality of future classroom implementation of this measure, instrumentation chosen to be evaluated was narrowed to five beginning instruments: flute, clarinet, alto saxophone, trumpet, and trombone (Duke & Byo, 2007). In particular, as Duke and Byo (2007) note, “many [educators] . . . teach homogeneous classes; others . . . teach mixed classes with two or more instruments together. . . . Double reeds, horns, tubas, and percussion all present unique problems” (p. 9). Members of the cohort were assigned into subcohorts based on a specific instrument (flute n = 3, clarinet n = 3, saxophone n = 3, trumpet n = 2, trombone n = 2) and given the task of gathering auditory, visual, and technique-related evaluative statements from instructional literature. A total of 133 descriptive statements were gathered from instructional literature related to flute, clarinet, saxophone, trumpet, and trombone (see Appendix A in the supplemental material available in the online version of the article). The descriptive statements were sorted and organized into seven a priori dimensions by the cohort: (a) technique, (b) tone, (c) articulation, (d) visual, (e) melody, and (f) time/rhythm. Subcohorts evaluated each of the descriptive statements gathered for each instrument and made notes related to the appropriateness of the descriptions for evaluation purposes. Additionally, each subcohort took notes of redundant items and provided suggestions for editing the descriptive statements to produce short, concise, and useful item stems appropriate for a Likert-type rating scale and applicable to all five instruments. The cohort then met to discuss concerns and suggestions related to the items and make finalized decisions regarding item construction. The cohort collectively approved a total of 47 items. Individually, each subcohort then evaluated the items for directionality, marking each item as positive, negative, or neutral. Upon completion of this task, the cohort met to confirm the evaluations. One hundred percent agreement was found in the directionality of the items, finding that 22 items were phrased negatively and 25 items phrased positively. No further items were edited or removed from the item pool. The 47 items were randomized using a random number generator and paired with a 4-point Likert-type scale (see Appendix B in the supplemental material available in the online version of the article). Response alternatives included strongly agree, agree, disagree, and strongly disagree. The specific labels were chosen because they can clearly be understood by raters, provide grounds for establishing rater self-opinion, and offer a mechanism that attracts rater responses into categories moving from “less” (e.g., strongly disagree) to “more” (e.g., strongly agree) (Wright & Douglas, 1986). A 4-point scale was chosen specifically to establish a forced-choice response set. The elimination of a neutral category provided a better measure of intensity of participants’ responses (Dumas, 1999) while avoiding violations of monotonicity in the rating scale category functioning (Wright, 1977).
Performance Stimuli
Members of the subcohorts collected a total of 75 videos of secondary-level solo performances (flute n = 15, clarinet n = 15, alto saxophone n = 15, trumpet n = 15, trombone n = 15) from district and state solo and ensemble performances. Thirty-seven videos represented middle school performances, and 38 videos represented high school performances. Each solo performance was accompanied by a piano, and the soloists performed in a standing position. The acceptability of video and audio stimuli quality was rated and verified by the cohort using the International Telecommunication Union’s ITU-T Rating Scale (Union, 2004).
Rating Sessions and Rater Assessment Network
Rating sessions were conducted for four consecutive days, at the same time and in the same room, for an hour and a half per session. Video performances were displayed on a projector with stereo sound and played repeatedly until each member of the cohort was finished responding to each item. Each rater used an individual laptop connected to an online response form (i.e., Google Docs) to submit ratings. The assessment design was a complete assessment network, consisting of a completely crossed two-facet design where each rater (N = 13) provided observed scores for each assessment component (i.e., Rater × Performance; Engelhard, 1997). Upon completion of the rating sessions and full collection of the rating data, negatively worded items were reverse coded before being subjected to empirical analysis.
Results
Variable Map
The variable map is provided in Appendix C (available in the online version of the article). The map is a graphical representation of the latent construct being developed in this study (i.e., secondary-level solo music performance). Each of the parameters included in the measurement model are displayed in each of the columns. The first column shows the logit scale. The second column shows each of the performance measures. An asterisk represents each performance achievement measure. The measures ranged from 2.45 logits to −0.71 logits (M = 1.11, SD = 0.68, N = 75). The third column represents the severity measures of the raters. The rater measures ranged from 0.82 logits to −0.94 logits (M = .00, SD = .48, N = 13). Severe raters are located at the top of the column and become more lenient moving further down the column. The fourth column shows the achievement measures for each musical instrument. The measures ranged from 0.43 logits to −0.26 logits (M = .00, SD = .27, N = 5). Higher achieving instruments are located at the top of the column and become lower achieving moving farther down the column. The fifth column shows the achievement measures for each school level. The measures ranged from 0.16 logits to −0.16 logits (M = .00, SD = .16, N = 2).
Summary Statistics
Summary statistics are provided in Appendix D (available in the online version of the article). As demonstrated in the table, the analysis indicated overall significant differences between performances (χ2 = 9,509.00, p < .01), raters (χ2 = 5,121.30, p < .01), items (χ2= 11,071.70, p < .01), musical instrument (χ2 = 1,589.80, p < .01), and school level (χ2 = 469.80, p < .01). Reliability of separation for performances (Rel > .99) can be conceptually compared to Cronbach’s coefficient alpha, implying that the measurement instrument is sensitive enough to distinguish between high-achieving and low-achieving performances with strong reproducibility of the logit locations. Reliability of separation for raters (Rel > 0.99), items (Rel > 0.99), instrument (Rel > 0.99), and school level (Rel > 0.99) implies that there is enough separation to confirm the construct validity of the measurement instrument. Mean square fit statistics represent the size of the random predictability within the measurement system. More specifically, they represent hypotheses of the response patterns based on expected predictability within the model. Infit mean square fit statistics (MSQ) represent sensitivity of the patterns of responses to on-target observations, otherwise known as an information weighted sum of model variance. Outfit mean MSQ represent the sensitivity to outlying, off-target responses and are based on the sum of squares standardized residuals. Good data fit to the model is evidenced by mean square fit values (infit mean squared error [MSE] and outfit MSE) close to the expected value of 1.00. Acceptable range for productive parameter-level MSQ is between 0.50 and 1.50 (Wright & Linacre, 1994).
Calibration of Student Performances
The calibration of student performances is provided in Appendix E (available in the online version of the article). Larger measures indicate higher performance achievement, and lower measures indicate lower performance achievement. Performance 60 was the highest achieving performance (2.45 logits), and Performance 18 was the lowest achieving performance (−0.71 logits). Evidence of misfit elements within facets of interest is based on infit MSE statistics outside of the rule-of-thumb ranges of 0.80 and 1.20 logits as indicated by Wright and Linacre (1994) and Engelhard (2009). Overfitting performances include Performances 1, 6, 7, 13, 16, 23, 24, 28, 29, 31, 33, 36, 42, 51, 62, 71, and 73. Underfitting performances included Performances 35, 41, 54, 57, and 75.
Calibration of Raters
The calibration of rater performances is provided in Appendix F (available in the online version of the article). The table specifies the objective rank ordering of raters based on levels of leniency/severity. Rater 5 was the most severe (observed average = 2.64, logit measure = 0.82), and Rater 13 was the most lenient (observed average = 3.56, logit measure = −0.94). Raters 5 and 10 demonstrated muted rating patterns as evidenced by infit MSE less than 0.80. Raters 9, 11, and 12 demonstrated haphazard rating patterns as evidenced by infit MSE greater than 1.20. Rater behavior was made anonymous to the members of the cohort during ex post facto psychometric analysis to avoid interference with future engagement of the scale construction process.
Calibration of School Level
The calibration of school levels is provided in Appendix G (available in the online version of the article). This calibration provides supporting evidence of concurrent validity as the measurement instrument is able to significantly distinguish between middle school and high school performances in an order that is logically expected. High school performances demonstrated higher performance achievement (observed average = 3.34, logit measure = 0.16), and middle school performances demonstrated lower performance achievement (observed average = 3.02, logit measure = −0.16).
Calibration of Musical Instruments
The calibration of musical instruments is provided in Appendix H (available in the online version of the article). The table specifies the objective rank ordering of musical instruments based on levels of achievement. Flute performers were found to be the highest achieving (observed average = 3.42, logit measure = 0.43). Clarinet performers were found to be the lowest achieving (observed average = 2.83, logit measure = −0.26).
Calibration of Items
The calibration of items is provided in Table 1. The calibrations represent the difficulty of each item. The larger the logit measure, the more difficult the item. The most difficult item was Item 25 (accurately adjusts for standard instrument-related discrepancies in intonation) (observed average = 2.33, logit measure = 1.33), and the easiest item was Item 44 (body is slouched) (observed average = 3.73, logit measure = −1.22). Items that demonstrated overfit included Items 20, 22, 28, 30, 34, 36, 41, 43, 44, and 45. Items that demonstrated underfit included Items 6, 7, 23, 25, 27, 29, 35, 42, 46, and 48.
Calibration of Item Facet.
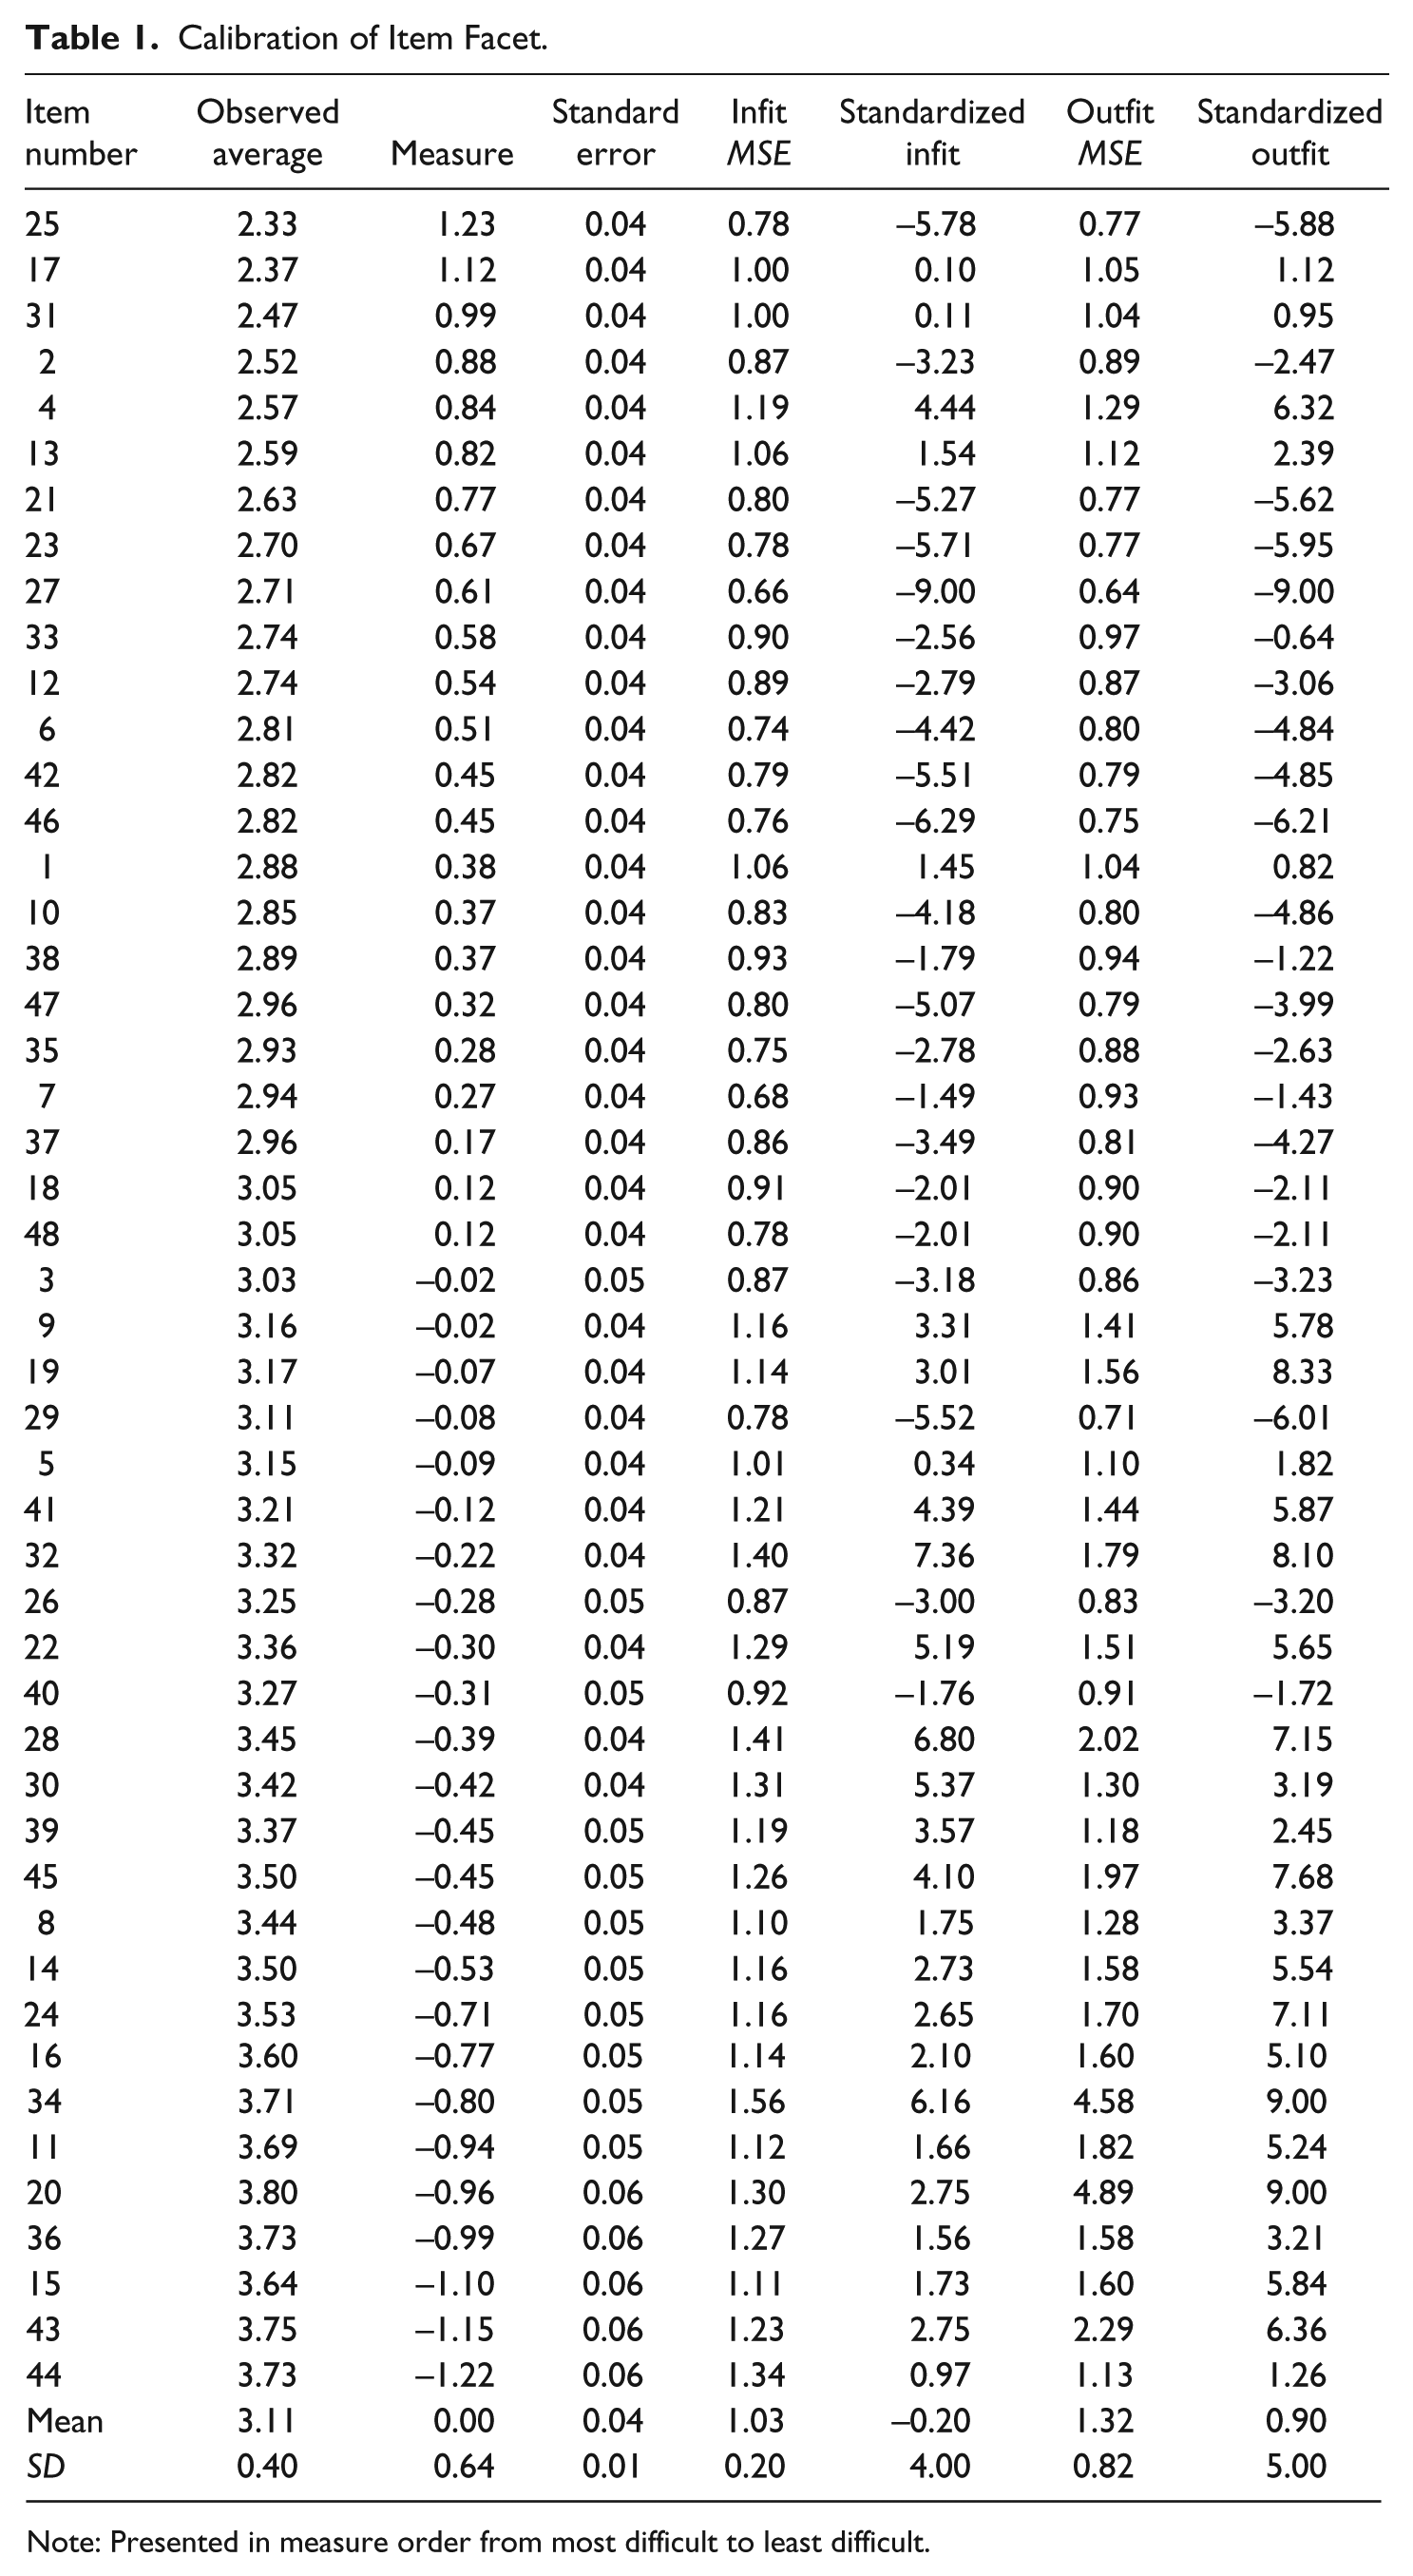
Note: Presented in measure order from most difficult to least difficult.
Rating Scale Category Diagnostics
After eliminating the misfitting items from the item pool, rating scale category structures were examined for the remaining fit items. As suggested by Linacre (2002), steps can be taken to optimize rating scale category structures. Modification of the structure based on this empirical methodology provides more rigorous examination and precise estimation of performances, ultimately addressing and improving validity issues surrounding construct validity of the measurement instrument. Additionally, this post hoc investigation can clarify the meaning of the collected data and improve subsequent use of the scale (Bond & Fox, 2015). Table 2 contains the necessary empirical data to be considered. First, frequency counts for each of the four categories were examined. Uniformly distributed frequency counts across each of the rating scale categories is optimal for the calibration of rating scale difficulties. Each of the frequency counts is above Linacre’s recommendation of 10 per category; however, Item 1 (Category 1), Item 3 (Category 1), Item 10 (Category 1), Item 20 (Categories 1, 2, and 3), Item 26 (Categories 1 and 2), Item 37 (Category 1), and Item 38 (Category 1) have observed category use with low enough frequencies to produce skewed, irregular distributions. Although the observed frequency counts met Linacre’s recommendation, there was still a considerable skew in the frequency use of the categories. Linacre notes that in these instances, there should be a clear “substantive pivot-point” (p. 7), where meaning of the ratings can be dichotomized into a clear bipolar response (e.g., good/bad, agree/disagree, positive/negative). Therefore, these categories were collapsed into adjacent categories to provide a more clear, substantive dichotomization between strongly disagree and disagree. Second, outfit mean squares (MSE) were examined for values ≥2.0. Values greater than 2.0 indicate excessive noise in the ratings. More specifically, categories exhibiting values ≥2.0 have been used by raters in unexpected contexts. Therefore, Items 5 (Category 1), 8 (Category 1), 9 (Category 1), 11 (Category 1), 14 (Categories 1 and 2), 15 (Category 1), 16 (Category 1), 19 (Category 1), 20 (Categories 1 and 2), 24 (Category 1), 32 (Category 1), and 36 (Category 1) were collapsed into adjacent categories. Third, average observed logit measures were examined for violations of monotonicity. Monotonocity can be described as the continuous advancement of threshold calibrations (Andrich, 1996). This is a requirement for inferential interpretability of the rating scale. In instances when incrementally higher measures were not observed, violating categories were collapsed into adjacent categories. The second categories of Item 5, Item 11, Item 14, Item 15, Item 16, Item 19, Item 24, Item 32, Item 39, and Item 44 demonstrated violations of monotonicity and therefore were collapsed.
Category Diagnostics for Fit Items: Category Usage, Average Observed and Expected Measures, and Outfit Mean Squared Error (MSE).
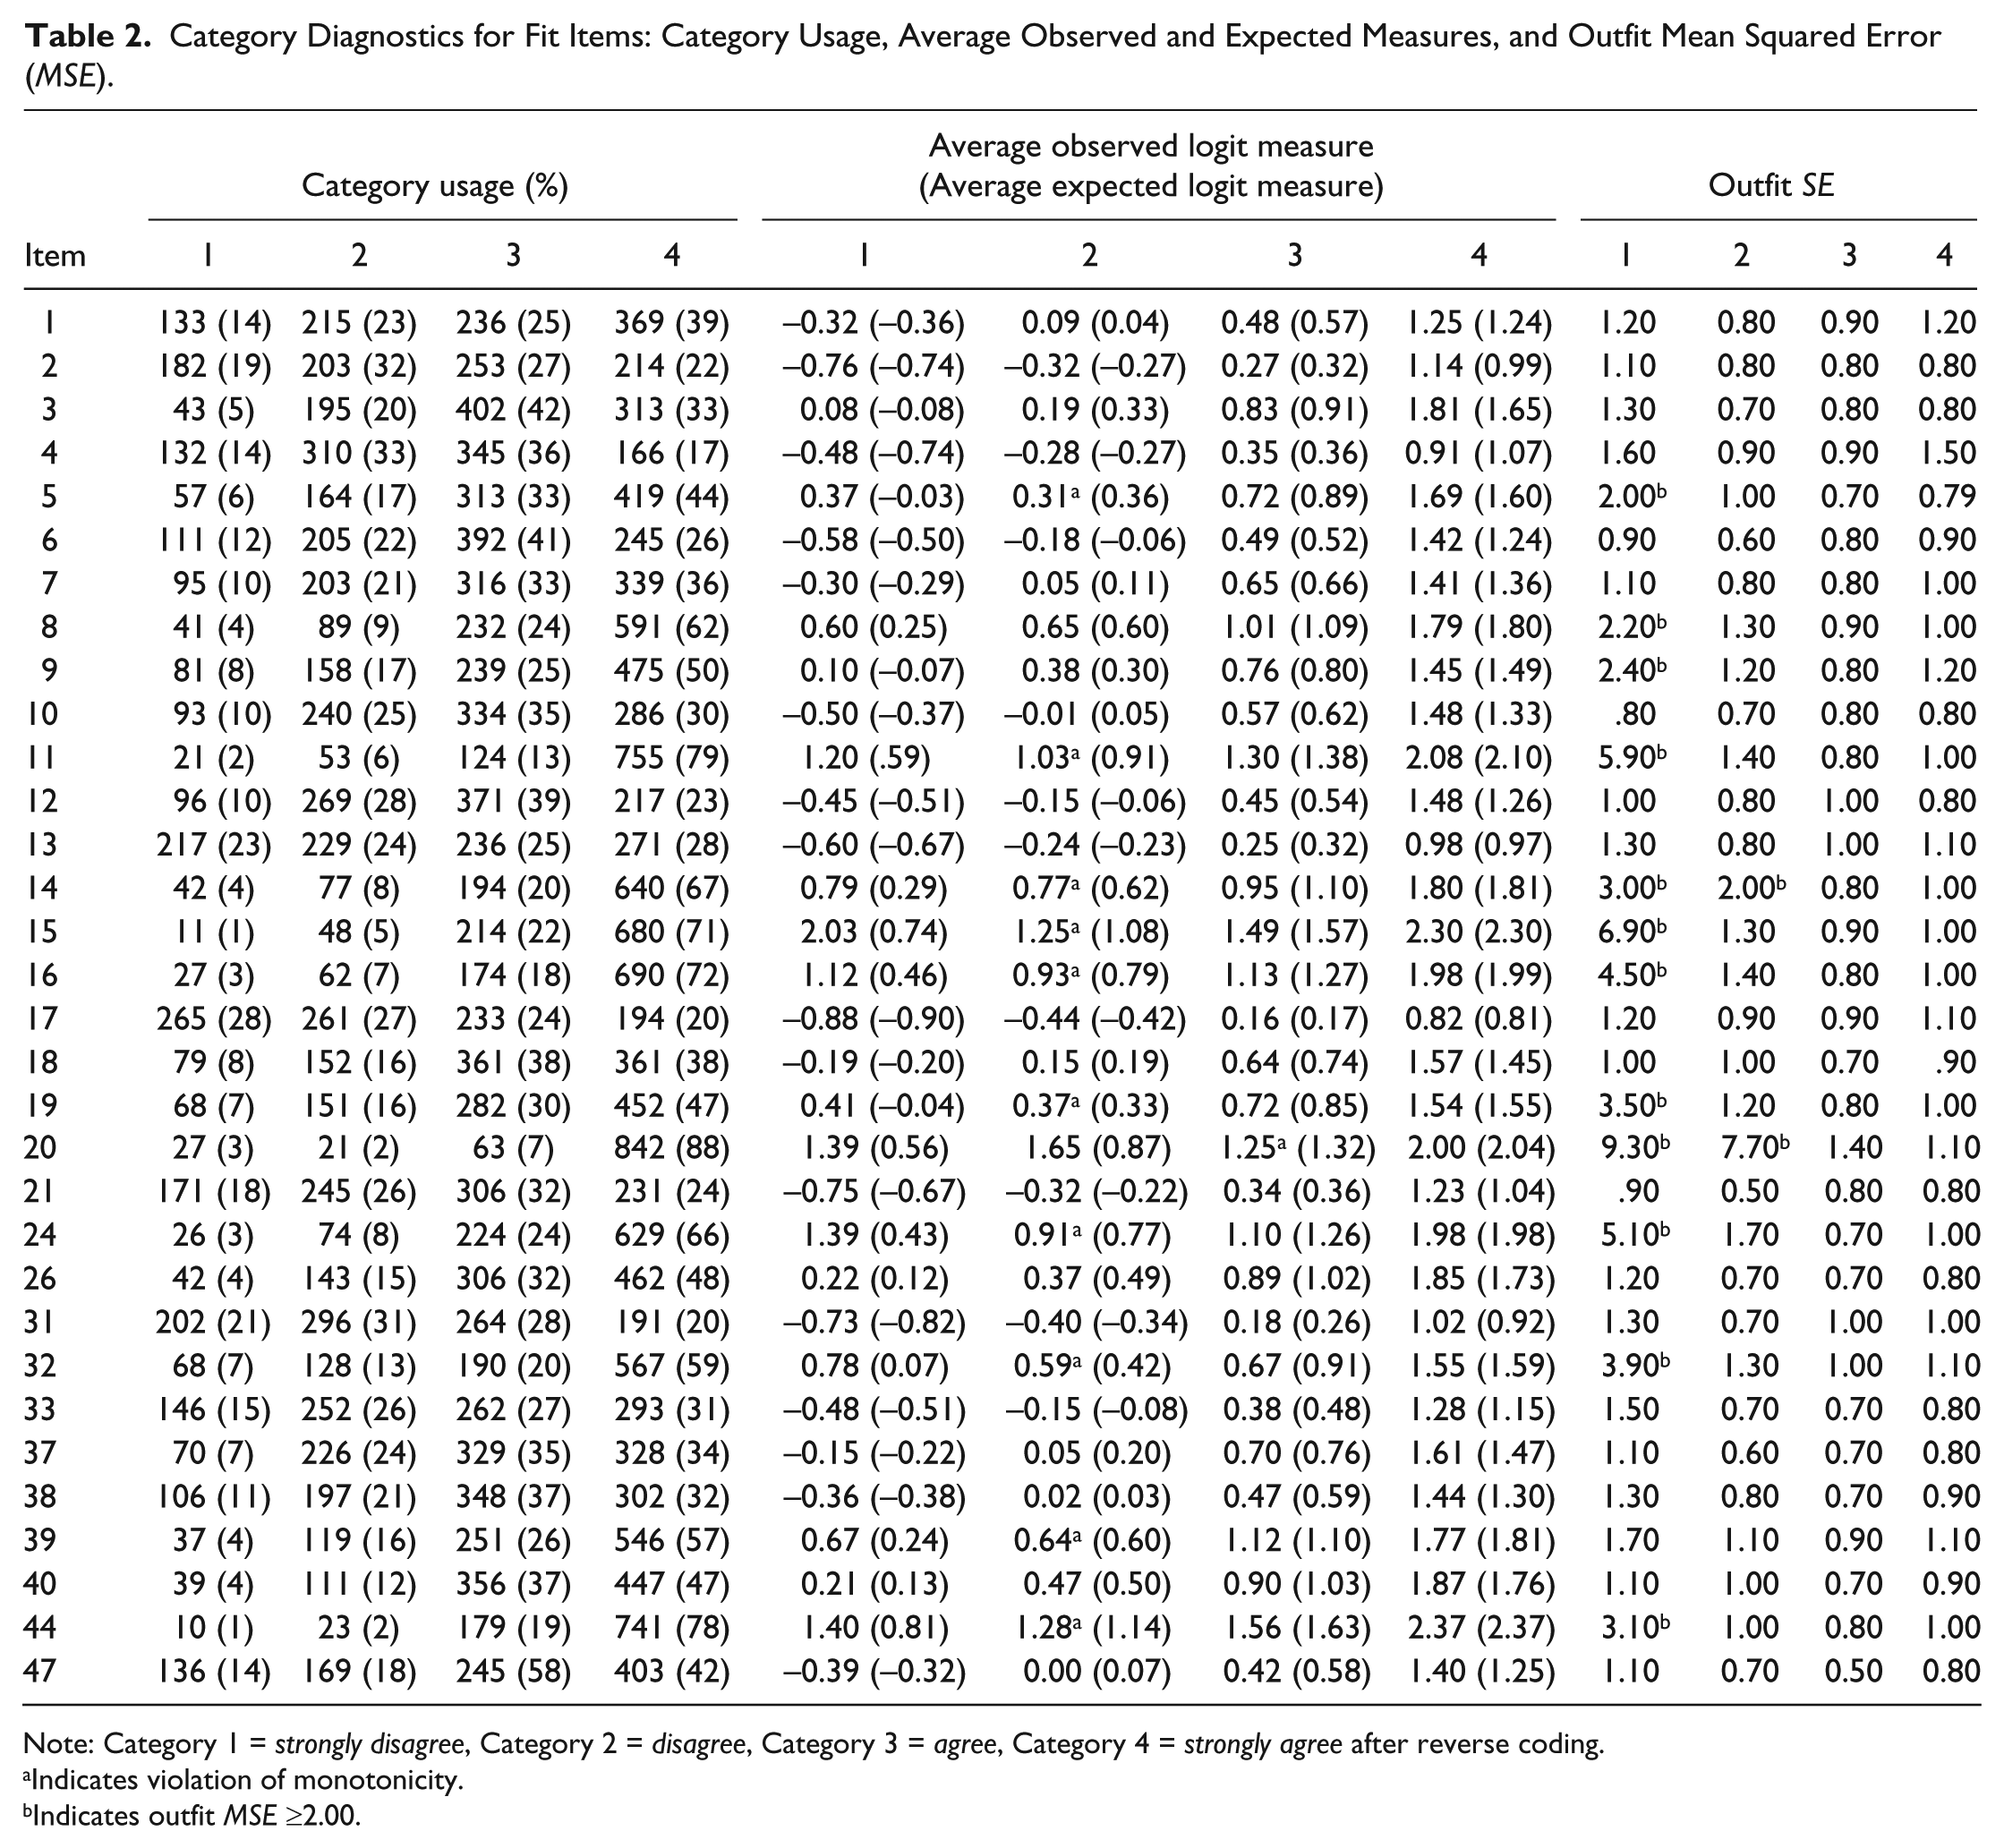
Note: Category 1 = strongly disagree, Category 2 = disagree, Category 3 = agree, Category 4 = strongly agree after reverse coding.
Indicates violation of monotonicity.
Indicates outfit MSE ≥2.00.
Rubric Development and Defining Performance Criteria Descriptors
Upon completion of the psychometric analyses, the cohort was debriefed on the quantitative results of the rating process. The cohort then participated in ex post facto qualitative analyses of psychometric results through the development of rating structure descriptions. The use of content experts in this phase of measure development helped provide methodological and epistemological insight into the scale development process. First, subcohorts worked independently to qualitatively define each of the remaining rating scale categories for the remaining fit items. The instructional literature used to develop the initial item pool was revisited to guide and facilitate the development of the descriptors. Upon completion of the task, the cohort met as a group and shared their interpretations of the performance criteria. Each of the subcohort’s descriptors were merged into a master rubric representing the fit items and respective rating scale categories. Collaboratively, the cohort evaluated the content for redundancy, appropriateness, and clarity and narrowed down the content to the best overall representation. In order to convert the items of the rating scale to learning outcomes in the rubric, all directionality within the item was removed in order to establish a nondirectional, content-based learning outcome. As an example, Item 33 (extraneous body motion) was adapted to body motion. In the process of developing meaningful descriptors for each criterion performance level (i.e., assigning narrative to each remaining rating scale categories), it was important to map the directionality appropriately. Therefore, the structure stemming from the reverse-coded items was used. This allows for each learning outcome and related proficiency levels to be coded uniformly in the same direction while maintaining the integrity of the collapsed rating scale category structures from the rating scale.
To focus on the continuity of narrative across the criterion performance level descriptors, the cohort collectively drew their attention to a series of pre-established anchors (Vagias, 2006). The application of specific anchors to each item across the criterion performance level descriptors were voted on and adapted to the rating scale structure by majority vote. Anchor selection included the categories of problem (Items 2, 3, 4, and 44), frequency (Items 2, 3, 5, 8, 16, 31, 37, 39), appropriateness (Items 9, 15, 17, 20, 21, 24, 26, 44, 47), barrier (Item 3), and detract (Item 18, 19, 26, 33, 40). A finalized version of the Music Performance Rubric for Secondary-Level Solos (MPR-2L-SOLO) is shown in Figure 1. Degrees of proficiency labels were not used to define the columns of the rubric for two reasons. First, degrees of proficiency range from two to four categories depending on the learning outcome. Second, labeling each column is counterproductive as it implies a specific standard that has not yet been determined. This is elaborated on in the following section.
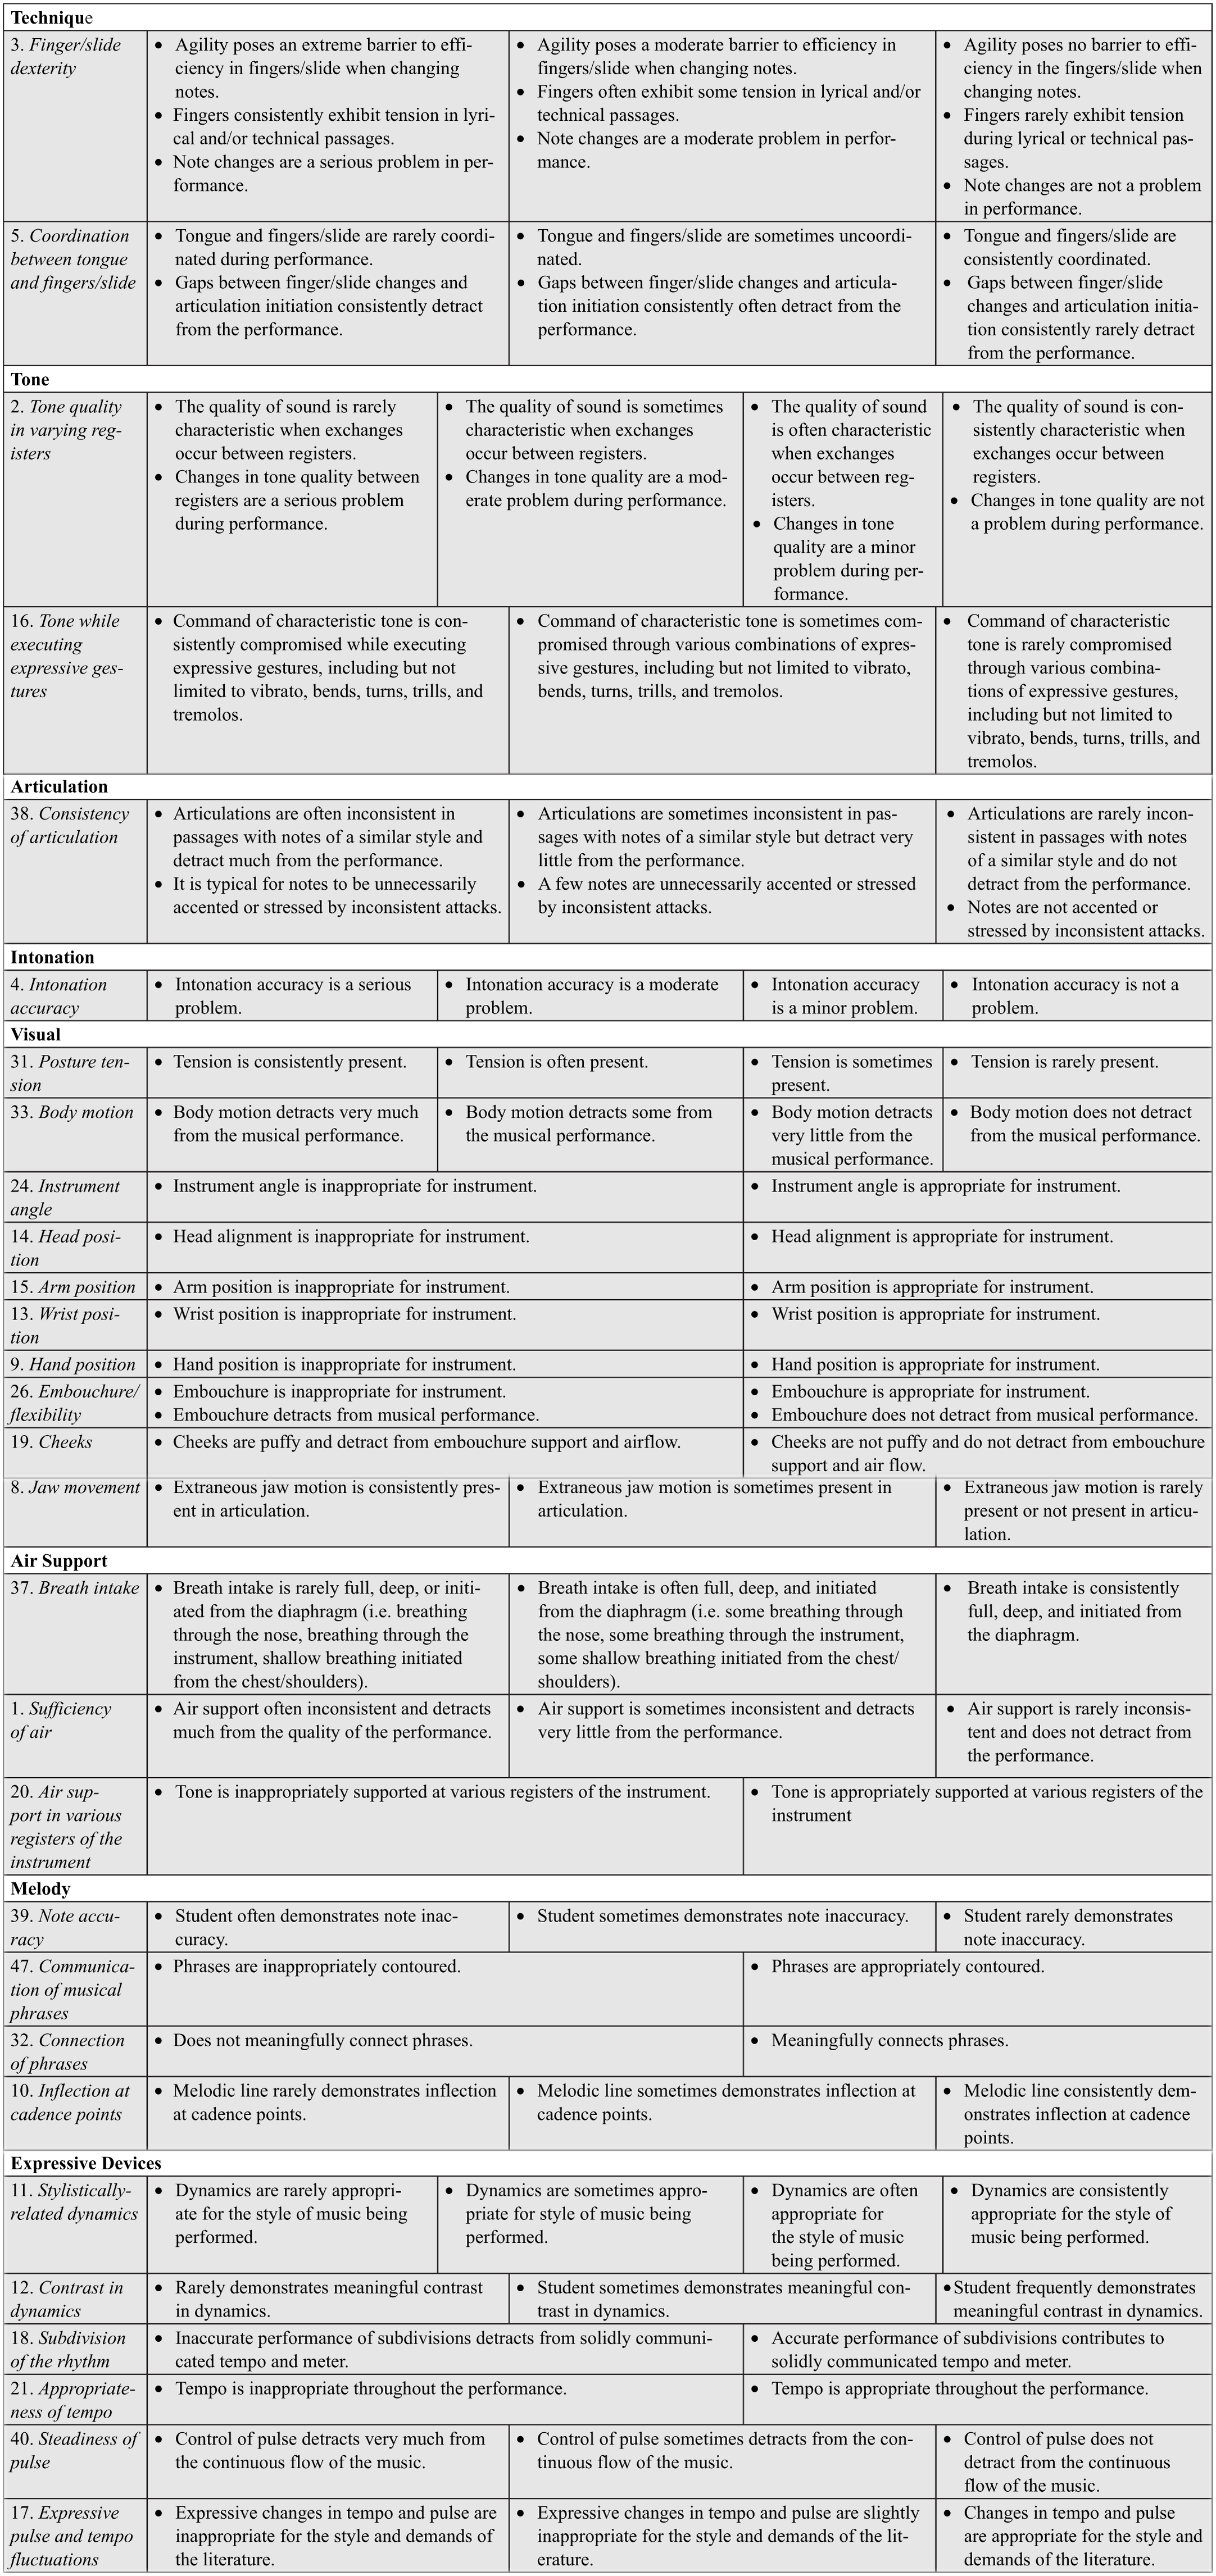
Music Performance Rubric for Secondary-Level Instrumental Solos (MPR-2L-INSTSOLO).
Conclusion and Future Research
The first research question referred to the psychometric quality of the scale developed to assess secondary-level solo music performance. In particular, psychometric quality represented the reliability, precision, and validity of the measure. The scale displayed overall good psychometric qualities. First, reliability of the measures was addressed by the information functions of the parameters used to estimate the value of the latent trait. High reliability of separation for persons and items served as reliability evidence. Small standard errors associated with each person and item served as strong precision evidence. The combined reliability and precision evidence indicates that the measure was able to strongly separate performances based on an ordered hierarchy along the latent continuum using an equal-interval, logit gradation. Additionally, this ordering is an important component of predictive validity as the difficulty ordering of the items can now be predicted prior to data collection with sample independence.
The second and third research questions address content and construct validity of the measure. The cohort of 13 content experts addressed content validity through the initial screening of the items and collection of information from pedagogical literature. It was verified that the items represented the intended construct of measurement and any extraneous material had been omitted. After psychometric analysis, 17 of the 47 items were found to not demonstrate acceptable levels of model fit based on the five requirements of Rasch measurement. In these instances, the items were not functioning to appropriately define the unidimensional variable. Underfitting items were found to be too predictable, and overfitting items were found to be too sporadic for the stochastic processes underscoring the measurement process. It can be hypothesized that these items represent instances of multidimensionality. As such, these items were candidates for either modification or deletion. Because modification was outside the scope of this particular study, items were deleted. Future work on developing the measure includes a principal components analysis of the residuals to examine dimensionality and make necessary modification of the items. Upon undergoing other testing conditions with revised items, reanalysis of the model may provide further insight into item functioning and further reexamination of the construct.
The third research question addressed concerns of the rating scale structure. The partial credit model as a choice of parameterization tested the null hypothesis that the set of proposed items share the same rating scale structure. The insertion of this additional parameter provided statistical and substantive evidence that all items did not share the rating scale structure equally. Clear violations of monotonicity, irregularities in observation distribution, and idiosyncrasies related to predictability were brought to light through the analysis. The modifications of the structure therefore provide a different measure with different measurement implications. Such modifications improved model fit, thereby enhancing precision of the rating scale structure and providing grounds for overall improvement of construct validity of the measure.
According to Messick (1989), only construct validity of a measure is under the constructor’s control as consequential validity (i.e., value implications and social consequences) moves beyond that of the test construction stage and into the implementation stage of the assessment process. Therefore, intended consequences of the measure should be discussed. First, performance standards need to be set. In particular, the development of cut scores and achievement levels need to be defined with respect to both the content skills outlined in the rubric and the new NAfME standards. As demonstrated in Appendix E (available in the online version of the article), each evaluated performance was given a logit measure that indicates the performance’s respective achievement level. This measure takes into consideration the independent variability of each of the facets included in the model: (a) performance achievement, (b) rater severity, (c) musical instrument achievement, (d) school-level achievement, (e) item difficulty, and (f) rating scale category difficulty. A limitation of the study is that these measures still lack substantive meaning. The measure is continuous in nature. Therefore, consideration of cut scores needs to be carefully considered based on the measure’s intended use. As an example, if the measure is intended to separate performances that are either “passing” or “failing,” “accepted” or “not accepted,” “scholarship” or “no scholarship,” and so on, then an agreed on logit measure needs to be realized in order to make such a dichotomous distinction. Additionally, this logit cut score may change depending on the needs and desires of the assessment context, such as (a) how many performers can “be accepted” or (b) how strict is “passing.” As another example, if the measure is intended to separate performances that are “superior,” “excellent,” “good,” “fair,” or “poor” or are being used to distinguish between “full scholarship,” “partial scholarship,” “no scholarship,” then agreed-on logit measures need to be realized in order to make such polytomous distinctions. In all these examples, cut scores can be derived by frequency counts from the process of moving down the ordered list from most achieving to least achieving. In some instances, this may be advantageous when targeting specific numbers of performers for ensemble seat positions, numbers of scholarships, and so on. However, this may not always be advantageous for two particular instances: (a) providing a clear expectation of the quality of performance required for the assessment context and (b) using a sample-dependent approach to the assessment context. It is recommended that a cohort consisting of content experts, psychometric experts, and policy makers devise a system consisting of clear-cut scores, achievement levels, and definitions of scoring values based on specifically chosen performance exemplars and in conjunction with demands of the assessment context.
Second, because the rubric’s items vary in difficulty and the rating scale category threshold and discrimination parameters vary by each individual category, it is not recommended to sum scores by items. Additionally, this practice assumes sum scores are interval-level data (i.e., measures) when they are truly ordinal-level data. Although such application may be useful in a classroom to communicate formative assessment needs to improve teaching and learning (see Appendix I, available in the online version of the article), the use of the rubric as a quantitative, summative scoring mechanism is not appropriate until performance standards are developed, tested, and validated under multiple assessment contexts. Furthermore, application of this rubric in its current form would produce a final logit score that controls for each of the parameters in the current model. An obvious limitation is the need for the raw data to be subjected to the measurement model. It is suggested that in order to apply the rubric in practical settings such as all-state ensemble auditions, solo and ensemble contest, or classroom assessment conditions, a digital online system be developed that would enable the raw data to be transformed to logit measures. The development of an online system combined with appropriately agreed-on cut scores as well as systematic rater training may provide significantly more reliable, valid, and fair assessments than the best-practice assessment scenarios currently employed.
Last, a potential source of construct-irrelevant variance in any performance assessment is rater severity. This was investigated and controlled for independently of item and person functioning through its insertion as a parameter in the model. Validity and reliability concerns stem from occasions where raters facilitate the assessment process. Variability in scoring has been shown to negatively affect the music performance assessment process due to several sources of error, including rater errors varying levels of leniency and severity (Wesolowski, Wind, & Engelhard, 2016b), varying use of rating scale categories (Wesolowski et al., 2016a), and differential rater functioning (Wesolowski et al., 2015). It is therefore important to carefully consider rater behavior and the function of evaluative cues (e.g., items and rating scale categories) set forth in assessment measures to provide a valid, reliable, precise, and fair assessment processes. Therefore, it is recommended that specialized rater training protocols be developed, tested, and implemented in conjunction with the rubric. Once the protocols are in place, the consistent management of rater behavior is necessary to provide valid, reliable, and fair assessment practices.
The MPR-2L-INSTSOLO provides important implications for the assessment of music performance. From a psychometric perspective, this is the first music performance assessment measure developed using item response theory techniques and, more specifically, Rasch measurement techniques. As such, we hope that the demonstrated methodology provides a strong foundation for the future development of much-needed measurement instruments in the field of music performance and related psychological areas of study. From a formal assessment perspective, we hope that the careful attention to concerns of validity spark both formal and informal discussions related to current assessment practices and the effects of such practices on valid, reliable, and fair measurement of student performances. Last, from a classroom perspective, we hope to see a more clear, concise, and integrated approach between authentic performance assessment and grading on students’ performance achievement. More specifically, we hope this rubric establishes a sound mechanism whereby teachers can provide concise empirical data to students, parents, administrations, and policy/decision makers that clearly communicates student musical performance achievement.
Footnotes
Declaration of Conflicting Interests
The author(s) declared no potential conflicts of interest with respect to the research, authorship, and/or publication of this article.
Funding
The author(s) received no financial support for the research, authorship, and/or publication of this article.
Author Biographies
References
Supplementary Material
Please find the following supplemental material available below.
For Open Access articles published under a Creative Commons License, all supplemental material carries the same license as the article it is associated with.
For non-Open Access articles published, all supplemental material carries a non-exclusive license, and permission requests for re-use of supplemental material or any part of supplemental material shall be sent directly to the copyright owner as specified in the copyright notice associated with the article.