



Abstract
The authors sought to (a) identify interventions that immediately increased the oral reading fluency of students with or at risk for disabilities, (b) estimate to what extent these gains maintained over time, and (c) evaluate whether particular characteristics of students (e.g., gender, disability status) predicted their response to fluency interventions. We used multilevel modeling to meta-analyze results from 44 single-participant studies involving 290 students. Results indicated that goal setting immediately increased fluency, and this gain continued over time. Word-level training was largely ineffective. Students with some types of disabilities (i.e., those with behavioral disorders or autism) responded significantly less well to interventions targeting fluency than did students with other types of disabilities (i.e., those with learning disabilities or visual impairments) and so may require more intensive and individualized fluency interventions.
Keywords
Fluency is the ability to read text “quickly, accurately, and with proper expression” (National Institute of Child Health and Human Development [NICHD], 2000, pp. 3–5). Theoretically, students who read fluently can better focus on comprehending a text’s meaning instead of attending only to word recognition (e.g., LaBarge & Samuels, 1974; Perfetti, 1988; Stanovich, 1984). Fluent readers should therefore display better reading comprehension skills. Empirical studies repeatedly find this to be the case (e.g., Fuchs, Fuchs, Hosp, & Jenkins, 2001; Hosp & Fuchs, 2005), although the directionality of this relation has yet to be established (Stecker, Roser, & Martinez, 1998). Fluency has been identified as a key characteristic of proficient reading (e.g., Adams, 1990; Allington, 1983; Fuchs et al., 2001; NICHD, 2000; Snow, Burns, & Griffin, 1998). Because historically it has been under-studied (Allington, 1983; Samuels, 2006), fluency—and the identification of effective fluency-building interventions—is currently a “hot topic” (Cassidy & Cassidy, 2003–2004).
Researchers have evaluated a wide range of fluency interventions (Wolf & Katzir-Cohen, 2001). Examples include repeated readings (e.g., Daly, Hintze, & Hamler, 2000; Meyer & Felton, 1999), training in phonics and other word-level word identification strategies (e.g., Daly, Martens, Kilmer, & Massie, 1996; Lane, O’Shaughnessy, Lambros, Gresham, & Beebe-Frankenberger, 2001), multicomponent interventions (e.g., Wolf & Bowers, 1999), peer or parent tutoring (e.g., Kamps, Locke, Delquadri, & Hall, 1989), goal setting (e.g., Faykus & McCurdy, 1998), and tangible reinforcement (Eckert, Ardoin, Daly, & Martens, 2002). Characteristics of these interventions vary substantially (Swanson, 1999). This is because they target distinct factors hypothesized to affect a student’s fluency. Some interventions target a student’s “skill.” For example, repeatedly reading a text (through a practice effect) or training in phonetic decoding should help increase the rate that a student recognizes particular words (Torgesen, Rashotte, & Alexander, 2001). Students with or at risk for disabilities may especially benefit from skill-building interventions. This is because these students often have difficulty identifying words while reading text (Snow et al., 1998). Other interventions target a student’s “will” or motivation to attempt to read text quickly. For instance, goal setting should increase a student’s self-monitoring of his or her reading (Reutzel, 2006) as well the student’s self-motivation (Martens & Witt, 2004). Providing reinforcement should also help increase a student’s efforts to read fluently. Students with or at risk for disabilities often display less goal-directed behavior and so may also respond well to interventions that elevate fluency’s importance (Sideridis, 2002).
Which of the varying interventions most effectively increase the fluency of students with or at risk for disabilities? This is an important question because so many students with disabilities are poor readers. For example, 64% and 65% of fourth and eighth graders with disabilities, respectively, scored below the basic level on the 2007 National Assessment of Educational Progress measure of reading achievement (U.S. Department of Education, 2009). Snow et al. (1998) estimated that about 80% of students with learning disabilities are not proficient readers. Identifying those interventions that are relatively more or less effective in increasing fluency should inform efforts to increase the reading proficiency of students with disabilities.
The Extant Meta-Analytic Research and Its Limitations
Meta-analysis is a well-validated methodology for systematically contrasting the effects of a range of possible interventions (e.g., Hunter & Schmidt, 2004; Lipsey & Wilson, 2001; Shadish, Cook, & Campbell, 2000). For example, and by using meta-analytical techniques, researchers have been able to identify (a) strategy instruction as much more effective than grammar instruction in increasing the writing skills of students with learning disabilities (Graham & Perin, 2007), (b) collateral skills interventions as somewhat more effective than peer-mediated interventions in increasing the social skills of students with autism (Bellini, Peters, Benner, & Hopf, 2007), and (c) pharmacological treatments as no more effective than cognitive-behavioral therapy in helping those with obsessive compulsive or anxiety disorders (Gould, Buckminster, Pollack, Otto, & Yap, 1997; Kobak, Greist, Jefferson, Katzelnick, & Henk, 1998).
To date, a number of meta-analytic syntheses of fluency interventions have been conducted (e.g., Chard, Vaughn, & Tyler, 2002; NICHD, 2000; Therrien, 2004; Wexler, Vaughn, Edmonds, & Reutebach, 2008; for important but non-meta-analytic reviews, see Fuchs et al., 2001; Kuhn & Stahl, 2003; Meyer & Felton, 1999; Wolf & Katzir-Cohen, 2001). For example, the NICHD (2000) estimated effect sizes for 77 studies evaluating the impact of repeated or guided oral reading. The NICHD’s analysis yielded a weighted average effect size of .41, indicating a small to moderate effect for these two types of fluency interventions. Morgan and Sideridis (2006) estimated effect sizes for 30 studies evaluating a larger range of fluency interventions (e.g., goal setting, repeated readings, reinforcement). Their analyses indicated that goal setting was much more effective in increasing fluency than training students to use word-level word identification strategies such as phonetic decoding.
Yet the extant meta-analytic work on fluency is limited in at least three ways. First, conclusions about the “best” type of fluency intervention are constrained by each meta-analysis’s research questions and methodology. Chard et al.’s (2002) meta-analysis focused only on elementary-aged children with learning disabilities. In contrast, Wexler et al.’s (2008) meta-analysis synthesized only those studies including secondary school students. Morgan and Sideridis’s (2006) meta-analysis was limited to students with learning disabilities. By estimating effects sizes only for students with learning disabilities, the groups of researchers were unable to report on the effectiveness of the interventions for students with other types of disabilities (e.g., autism, behavioral disorders), thereby limiting the generalizability of their findings. In addition, most of the meta-analyses did not include systematic comparisons among various intervention types (e.g., NICHD, 2000). Therrien (2004) estimated the effects of only one type of fluency intervention (i.e., repeated reading). Second, few of these meta-analyses (e.g., Morgan & Sideridis, 2006; Wexler et al., 2008) quantified results from single-participant studies. Yet many quasi-experimental studies have used such designs. For example, the search and inclusion procedures used to conduct this meta-analysis yielded 44 single-participant studies. Consequently, many of the extant meta-analyses have ignored a substantial knowledge base by not quantifying results from single-participant studies. Third, previous meta-analyses on fluency interventions have typically relied on tests of mean-level differences of interventions evaluated with group designs (e.g., NICHD, 2000; Therrien, 2004). Yet this effect size metric does not account for patterns of growth or decline resulting by a particular intervention. Thus, whether and to what extent the effects of the various fluency interventions increase, maintain, or decrease over time remains to be well established.
Using Multilevel Modeling Meta-Analysis to Estimate Treatment Effects
Traditionally, single-participant meta-analysts have employed a number of different effect size metrics (e.g., Campbell, 2004; Olive & Smith, 2005; Scruggs & Mastropieri, 1998). Examples include regression (e.g., Faith, Allison, & Gorman, 1996; Francis et al., 2005), standardized mean differences (Busk & Serlin, 1992; Onwuegbuzie, Levin, & Leach, 2003), percentage of nonoverlapping data (Burns & Wagner, 2008; Scruggs & Mastropieri, 2001; Scruggs, Mastropieri, & Casto, 1987; Wexler et al., 2008), and percentage reduction (Campbell, 2004; O’Brien & Repp, 1990). Yet all of these methods have their limitations, and their use has frequently been criticized (e.g., Campbell, 2004; Faith et al., 1996; Jenson, Clark, Kircher, & Kristjansson, 2007). The major flaw in using these methodologies is their inability to control for the correlated nature of time series data (i.e., control for autocorrelation or serial dependency), which can result in inflated parameter estimates (Huitema, McKean, & McKnight, 1999; Sideridis & Greenwood, 1997).
Multilevel modeling is increasingly recognized as a rigorous method for meta-analyzing time-series data (Nezlek, 2001, 2003; Raudenbush & Bryk, 2002; Van den Noortgate & Onghena, 2003). Meta-analysis itself can be considered a special case of multilevel modeling, in which participants (Level 1) are “nested” within studies (Level 2; Raudenbush & Bryk, 2002). Use of multilevel modeling has many methodological advantages (see, e.g., Roberts, 2004; Rowe, 2000). Multilevel modeling takes into account correlated data structures (Pollack, 1998). It estimates individual parameters and so is not unduly influenced by a limited number of observations. It allows a researcher to estimate growth trajectories, even when relying on data with unequal time intervals (i.e., multilevel modeling does not require “balanced” time-structure data). It provides robust tests of statistical significance of both intercepts and slopes. It allows researchers to include linear or nonlinear predictors (or outcomes) in the same model, and at different levels of the analysis (e.g., student or classroom level). Thus, multilevel modeling should yield more accurate estimates of an intervention’s “true” treatment effect because the time series observations (Level 1) can be examined after taking into account various child- or class-level characteristics (Level 2) as well as additional moderators at either level. Multilevel modeling can take into account the heterogeneity of studies within a category (in our case, participants) by applying a random effects model. Thus, this information is not ignored (i.e., as “measurement error”) but is instead modeled by applying different weights to studies (or participants) that contribute heterogeneous effects (de Leeuw & Hox, 2003). Multilevel modeling also should yield less biased estimates by employing empirical Bayesian methods of estimation for the Level 1 parameters (“shrunken” estimates), generalized least squares methods for Level 2 parameters, and maximum likelihood for the variances and covariances (Choi, 2001; Raudenbush & Bryk, 2002). Jenson et al.’s (2007) recent Monte Carlo study indicated that multilevel modeling controls well for Type I error. After contrasting four effect size metrics for single-participant studies (including percentage of nonoverlapping data), these investigators identified multilevel modeling as the “most promising approach for the analysis of single subject designs” (p. 483).
Study’s Purpose
We sought to identify interventions that effectively increase the fluency of students with or at risk for with disabilities. We first categorized fluency interventions as one of five types. We then estimated each type of intervention’s treatment effects, both immediately following its introduction and over time. That is, we contrasted the interventions in terms of their relative magnitude of impact by separately estimating each intervention’s initial treatment effect (i.e., the “intercept” level) and the extent to which this effect maintained (i.e., the “slope” level). Doing so allowed us to investigate whether a particular type of intervention’s effects on fluency steadily increased, remained constant, or began to “wash out.” We also systematically investigated whether there were differential effects in the response of particular subgroups to systematic attempts at fluency intervention (of whatever type). Such analyses are particularly timely given Wexler et al.’s (2008) preliminary finding that students with different types of disabilities may respond about equally well to fluency intervention. We systematically evaluated whether this or, instead, more heterogeneity in response to fluency intervention was the case. That is, we evaluated whether certain groups of students (e.g., older students, students with behavioral disorders) typically responded less well than other groups of students to fluency intervention and so may be more likely to need more individualized or intensive treatments.
Method
Search Procedures
We included a study if it met the following five criteria. First, the study had to have employed a single-participant design consisting of at least two phases (i.e., AB). Thus, we included studies that used ABAB type designs, multiple-baseline designs, and combinations of such designs. Second, the study had to have used a school-aged sample (i.e., students enrolled in Grades K–12). Third, the study had to have been published in a peer-reviewed journal. Fourth, the study had to have assessed a student’s oral reading fluency in English. Fifth, the study’s coded AB phases each had to have included at least three time points. Three time points is the minimum necessary for quantifying and projecting polynomial trajectories.
We then searched for studies meeting our inclusion criteria. We electronically searched the PsycINFO and ERIC databases. We used the same search terms used in the NICHD’s (2000) fluency meta-analysis. These were chunking, echo reading, speech pitch, punctuation, reading rate, repeated readings, reading fluency, paired reading, reading speed, automaticity, prosody, parsing, intonation, expression, phrasing, reading accuracy, neurological impress, assisted reading, inflection, verbal fluency, instance theory, oral reading, and fluency. Our electronic search yielded 2,659 abstracts.
We examined each abstract for relevance. A total of 42 studies met our inclusion criteria. We then hand searched nine major education and special education journals. We limited our hand search to studies published between January 1990 and January 2006. We hand searched these specific journals because each yielded more than one study during our electronic search. We hand-searched the following journals: Behavioral Disorders, Education & Treatment of Children, Journal of Applied Behavior Analysis, Journal of Behavioral Education, Journal of Learning Disabilities, Learning Disability Quarterly, Psychology in the Schools, Reading Research Quarterly, and School Psychology Review. Our hand search yielded two additional studies. Thus, our analyses are based on 44 studies.
Participants
The 44 studies involved 290 students. There were 223 boys and 67 girls at various grade levels. Of the students, 251 were White, 23 were of Black, 13 were Chinese, and 3 were Hispanic. Of the students, 188 were identified as learning disabled or considered as at risk for learning disabilities (i.e., receiving Title I services or referred by their teacher for special education services), 17 were nondisabled, 5 were visually impaired, 54 had emotional and behavioral disorders, 24 had mental retardation, and 2 had autism. Of the students, 234 were being educated in general education classrooms; 56 were receiving educational services in segregated settings. The sample of students was distributed unequally across grades. There were 41 first graders, 44 second graders, 74 third graders, 60 fourth graders, 8 fifth graders, 7 sixth graders, 10 seventh graders, 32 eight graders, 7 ninth graders, 6 tenth graders, and 1 eleventh grader.
Characteristics of the Studies
Intervention characteristics across the included studies varied substantially. To more parsimoniously analyze for treatment effects, we collapsed each study’s fluency intervention into one of five categories based on the characteristics of the intervention. An intervention could be placed into only one category. We grouped the fluency interventions into the following categories: (a) keywords, previewing, listening, and repeated reading; (b) goal setting with or without reinforcement; (c) reinforcement without goal setting but contingent on student responding, (d) word-level or phonological training; and (e) peer or pair tutoring. We used these groupings so as to contrast key features of the various intervention types. We characterized some interventions as targeting reading skill. Of these, some interventions (i.e., those teaching a student to make use of keywords, preview the passage, listen, or repeatedly read a passage) emphasized “whole-word” to text-level strategies. Other skill-type interventions (i.e., those teaching phonetic decoding or phonological awareness) emphasized “within-word” strategies. We characterized still other types of interventions (i.e., goal setting, reinforcement) as targeting a student’s will. These will-type interventions also differed. Some established a student-identified and -charted performance goal, whereas others relied only on reinforcement. Thus, we grouped the included studies in ways that allowed us to contrast general (i.e., skill vs. will) and specific (e.g., goal setting with and without reinforcement vs. reinforcement only) types of methods for increasing a student’s fluency. We further describe characteristics of each of these five categories below. The Appendix displays each study’s characteristics and classification.
Keywords, previewing, listening, and repeated readings
A teacher or researcher met with a student, and together they discussed a passage to be read (e.g., O’Donnell, Weber, & McLaughlin, 2003; Skinner, Cooper, & Cole, 1997). This discussion was designed to engage the student’s prior knowledge about the passage’s topic. The teacher or researcher identified and defined keywords that might better help the student understand the text’s meaning. The student was asked to repeat the keywords. The student was encouraged to ask questions about any word’s meaning or pronunciation. The teacher then read the whole passage out loud as the student followed silently along. Listening and repeated reading involved the student listening as the teacher read the passage out loud, with the student then repeatedly reading the passage out loud three to five times (e.g., Jones & Wickstrom, 2002; Valleley & Shriver, 2003; VanAuken, Chafouleas, Bradley, & Martens, 2002). A total of 153 participants (52.8%) contributed data for this intervention category.
Goal setting with or without reinforcement
The student was asked to set goals for the length of time it would take to read a passage out loud (e.g., Eckert, Ardoin, Daisey, & Scarola, 2000). The student was then given feedback on the number of his or her word reading errors, his or her time, and his or her overall accuracy. A teacher then asked the student to record his or her progress on a graph. Some interventions also provided a reinforcer when a student met or exceeded established criteria. The reinforcer had to be selected beforehand to ensure its valence. A total of 42 participants (14.5%) contributed data for this intervention category.
Reinforcement contingent on student responding
The student selected and then ranked his or her choice of two educationally relevant reinforcers (e.g., workbook, highlighter, eraser, pencil) from a larger set of such reinforcers (e.g., Billingsley, 1977). The student received the reinforcer of his or her first choice after reaching a prespecified goal of time to complete reading a passage (e.g., in less than 3 min) while also making only a minimum number of word recognition errors (e.g., fewer than 3). The student was given the reinforcer that was his or her second choice if the student failed to meet the prespecified goal but still performed within a reasonable length of time (e.g., 4 min) while making relatively few errors (e.g., fewer than 8). Not all the studies used the same reinforcer criteria (e.g., Daly, Martens, Hamler, Dool, & Eckert, 1999; see Note 1). A total of 21 students (7.2%) contributed data for this intervention category.
Word-level or phonological
The student first read the passage as his or her teacher followed along (e.g., Daly et al., 1996). If the student mispronounced a word, the teacher provided the correct pronunciation. The teacher then asked the student to repeat the word’s pronunciation. The teacher printed each mispronounced word on an index card. These cards were then shown individually to the student while the teacher pronounced them, typically phonetically. The teacher and the student read the cards in unison by sounding out the word together. The student sounded out the word both aloud and in a whisper. The student read the card and sounded out the word quietly. Finally, the student was asked to read the word aloud normally (Rosenberg, 1986). A total of 22 participants (7.6%) contributed data for this intervention category.
Peer or pair tutoring
During tutoring, a peer or a parent who was a skilled reader was paired and worked with a student who was a less skilled reader (e.g., Duvall, Delquadri, Elliott, & Hall, 1992; Hook & DuPaul, 1999). The dyads followed highly structured protocols. Practice opportunities and reinforcement were frequently provided. The reading activities included strategies for reading at the word (e.g., phonetic awareness, decoding, sight word recognition) or text level (e.g., identifying the main idea of a passage). Hook and DuPaul (1999) describe these procedures (for an additional example, see Fiala & Sheridan, 2003). A total of 52 participants (17.9%) contributed data for this intervention category.
Included studies’ methodological quality
All studies met the methodological requirements of the peer-reviewed journal in which they were published. Our coding indicated that interobserver data were reported in 96% of the studies. About 57% (see the appendix) of the included studies reported treatment fidelity.
Analyzed observations
Our analyses used the data points reported within the first A and B phases reported for each study’s participant (or, in the case of ABCD or alternating treatment designs, the orthogonal phases). To be included in our analyses, each of these phases had to include a minimum of three data points (as indicated in the appendix, studies often contributed more than three data points). We limited our analysis to the first A and B phases of a study for three methodological reasons. First, we considered a study’s subsequent phases as primarily demonstrations of experimental control and, hence, replications. In contrast, our purpose was to provide a point estimate of the intervention’s treatment effect, which we felt might better be estimated using data not confounded by any attempt to “reverse” fluency gains. Second, collapsing multiple A and B phase data together would inaccurately represent the data as uninterrupted time series. Third, restricting our analysis to a study’s A and B phases helped “standardize” the point estimates and resulting contrasts, as it avoided giving disproportionate weight to studies contributing data from replicating A and B phases.
As indicated above, students sometimes contributed data for more than one intervention. This was because some of the studies involved within-individual comparisons that contrasted different interventions (e.g., through use of mixed designs such as combinations of alternating treatments designs with reversal designs). To adjust for this potential confound, we weighted data by the amount of phases provided by each participant (i.e., weighting on participants). The weighting procedure is described below. Overall, the 290 participants provided data for 298 experimental phases and, consequently, for the same number of baseline phases.
Investigations of 22 of the meta-analyzed studies estimated a student’s oral reading fluency using unpracticed passages that were read following introduction of the particular intervention being evaluated. Investigators of the 22 other meta-analyzed studies reported a student’s oral reading fluency after asking the student reread the same (i.e., practiced) passage used during the intervention. However, we observed no evident pattern in which an intervention’s effects were appreciably and consistently associated with the type of passage (i.e., practiced vs. nonpracticed) employed by a study’s investigators. Nor did we observe that particular passage types were consistently used with specific interventions. Most (i.e., 23 of 44) of the studies used curriculum-based-type measures to evaluate a student’s oral reading fluency, in which a passage was read from a student’s textbook. Much less frequently used dependent measures included reading a word list (i.e., 3 of 44) and book reading (i.e., 1 of 44). Investigators of 19 of the meta-analyzed studies reported the duration of the particular intervention’s treatment sessions. The duration of these treatment sessions averaged 18 min (SD = 11.15)
Data Analysis
The effects from all studies were analyzed using an extension of multilevel modeling procedures (HLM; Bryk & Raudenbush, 1992; Raudenbush & Bryk, 2002). Examples of meta-analyses using multilevel modeling have been reported in education (e.g., de Leeuw & Hox, 2003), special education (Morgan & Sideridis, 2006), medicine (e.g., Thompson, Turner, & Warn, 2001), and developmental psychology (e.g., Maas, Hox, & Lensvelt-Mulders, 2004). One advantage of multilevel modeling over conventional methods of single-participant-design meta-analysis involves the simultaneous evaluation of both intercepts and slopes for both a person and a group (Hox & de Leeuw, 2003; Kreft & de Leeuw, 1998). That is, multilevel modeling allowed us to identify both “immediate” and “over-time” treatment effects. Analyzing both intercept and slopes is important in discerning a treatment’s effects. This is because an intervention’s effectiveness should be evaluated in its ability to result in both immediate and sustained improvements. Interventions that yield immediate effects but that then quickly “wash out” over time are of comparably less use to practitioners. Estimating growth is critical as it allows for an examination of whether and to what extent an intervention’s effects remain constant, steadily increase, or instead fade over time.
Figure 1 is illustrative of the potential utility of examining an intervention’s immediate and over-time effects. The figure displays how a random sample of students “behaved” in the goal setting condition compared to a random sample of students from the remaining interventions. Data from these random samples seem to indicate systematic variation in both the intercepts and slopes between those who did and those who did not participate in the goal setting intervention. That is, and relying here only on visual inspection, goal setting seems to have resulted in generally greater initial and over-time gain in oral reading fluency by students. Yet reliance on only visual inspection is problematic, especially because the effects of confounding covariates or factors cannot easily be taken into account. We therefore used multilevel modeling to more precisely estimate the intercept and slope terms for the intervention conditions, as well as student characteristics that were related to these terms. Thus, our method also has the advantage of modeling effects at both the intraindividual level of analysis (i.e., within-student variance) and the interindividual level of analysis (i.e., between-student variance). At the intraindividual level of analysis (Level 1), we fit the following equation to the data,

with bs representing Level 1 regression coefficients (slopes), Xij is the Level 1 predictor for case i belonging to group j, and rij is the Level 1 random effect (residual), assuming that it is normally distributed [rij ~N(0, σ2)].
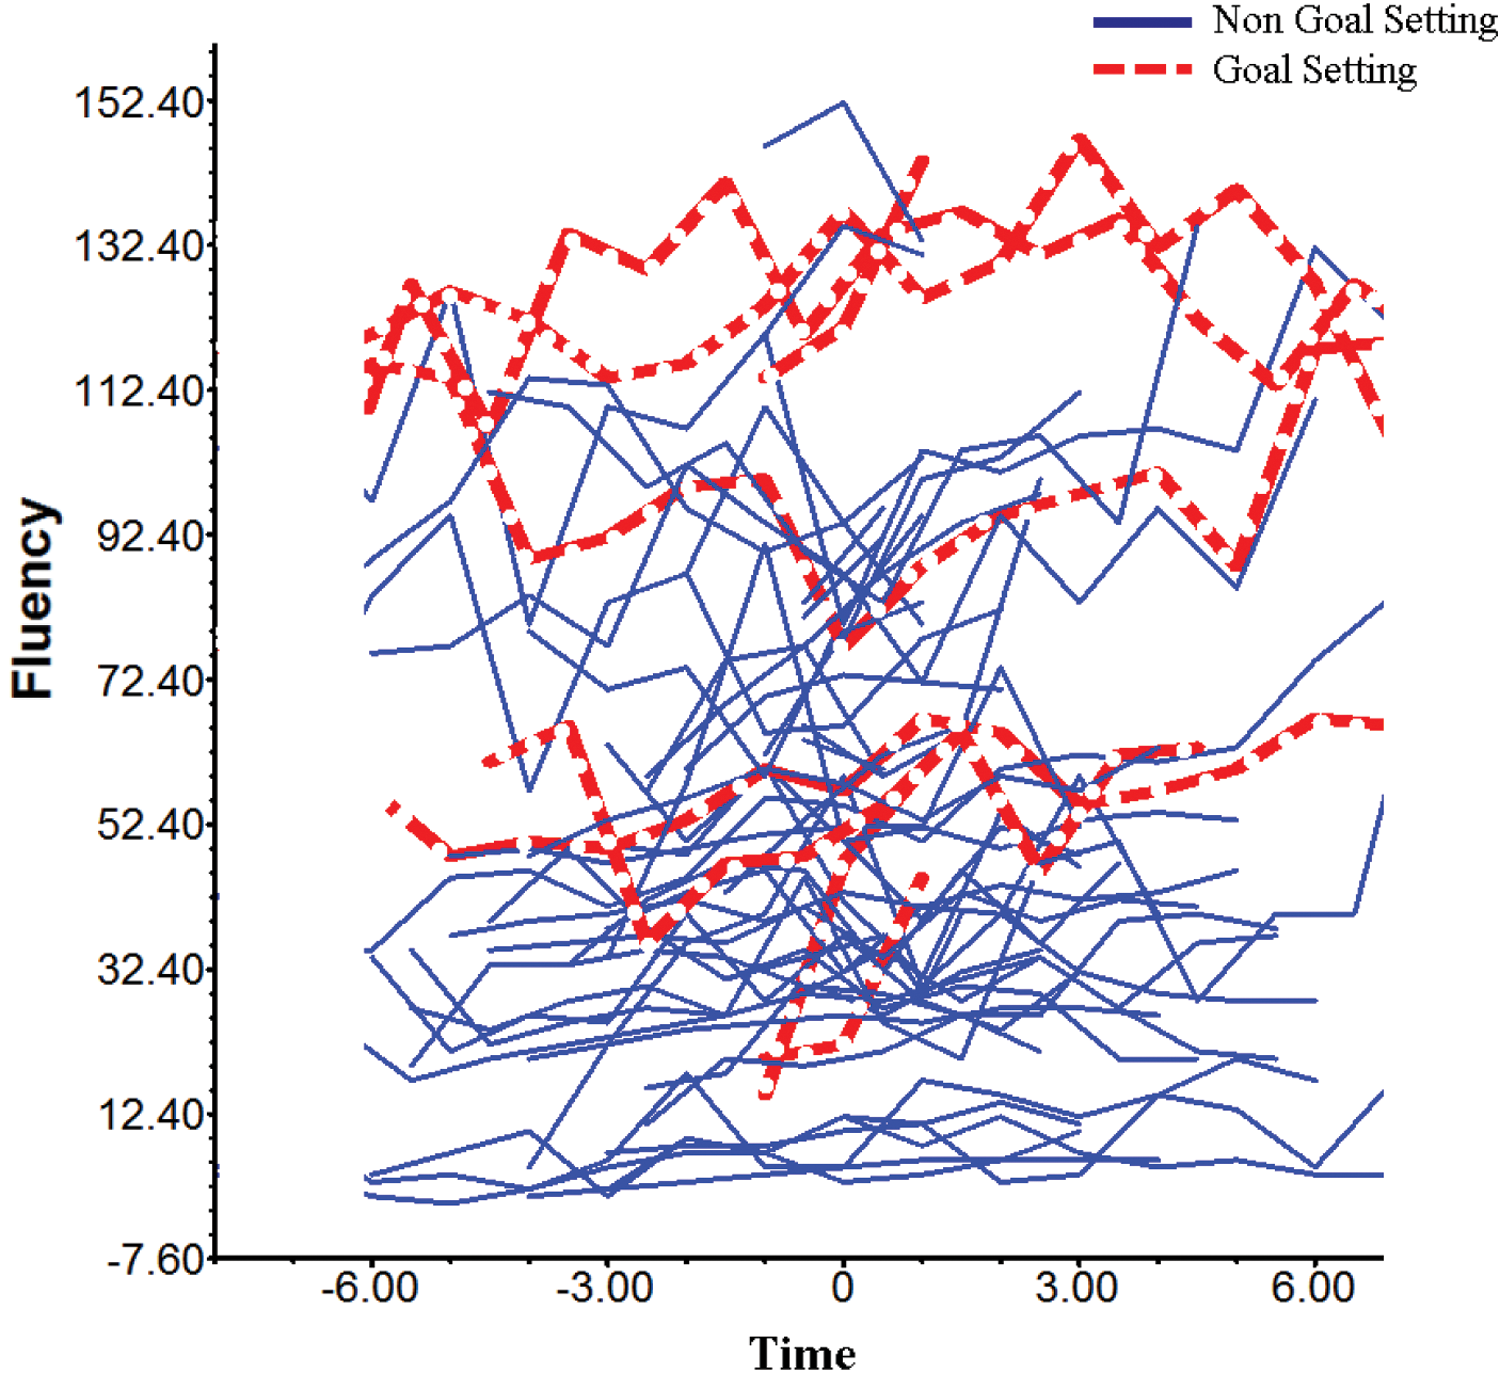
Slopes of a random sample of individual students in the goal setting condition (bold dashed lines) indicating intercepts and rates of growth compared to a random sample of students from the other interventions (solid lines).
Use of multilevel modeling also allowed us to account for between-student characteristics, such as differences between two students in their gender or placement (e.g., Shin, Espin, Deno, & McConnell, 2004). Thus, at the interindividual level of analysis (Level 2), we fit the following equation to the data,

with β q to the left of the equation representing intercepts and slopes at Level 1 that are now modeled as Level 2 dependent variables, γ q representing Level 2 regression coefficients (slopes), Wj representing independent variables (predictors) at Level 2, and uij representing the random error term at Level 2 (residual). More specifically, this meta-analysis’s models were run after statistically controlling for a student’s baseline level of fluency, gender, age, and placement as well as whether a particular study was contributing an unequal number of students. Thus, the slopes reported here represent partial regression coefficients, adjusted for a student’s attributes, characteristics, and background. We further detail this modeling below.
The number of students contributed by each study was weighted using the following formula (Asparouhov, 2004; Goldstein & Yang, 2000),

where pij represents the probability that student i from study j was included in the meta-analytic sample. Weighting then is represented by the inverse of this probability. Raudenbush and Bryk (2002) standardize this weight to have a mean of 1 because, for low probabilities pij, weighting values tend to be quite large. We set our statistical significance level at .05.
Results
Preliminary Analyses
We evaluated how well the different interventions improved fluency by fitting a two-level multilevel model to the data. We did so using the HLM 6.1 software (Raudenbush & Bryk, 2002). Changes in fluency were predicted by each intervention at both the intercept (i.e., when the intervention was initially introduced) and slope levels and after controlling for a number of covariates that were likely confounds of the effects attributable to the specific intervention types. We first aggregated scores for all the disability groups (i.e., to conduct a main effects analyses). We then created a series of dummy variables to represent each intervention. The number of dummy variables was equal to the number of intervention conditions, and these estimates were contrasted using chi-square difference tests with 1 df (Raudenbush & Bryk, 2002). The interventions’ contrasts entailed differences in means across conditions (HLM allows such comparisons by deleting the intercept from the model). Thus, each of the five intervention categories could be contrasted to each other, as each dummy variable represented the mean of a specific intervention category.
The following two-level model was applied to the data using random effects for the estimation of the intercepts and fixed effects to estimate the different trajectories:

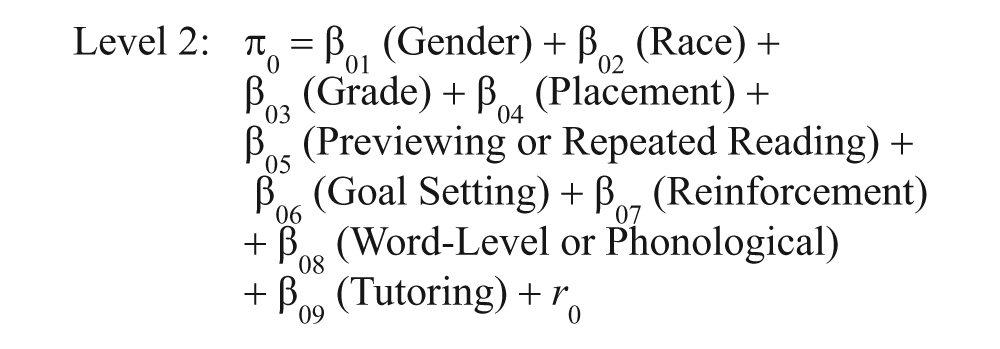
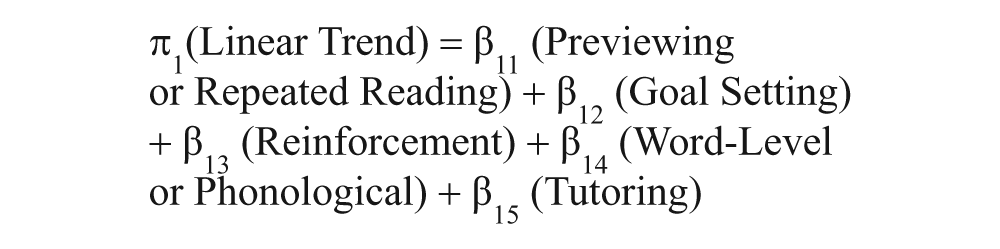
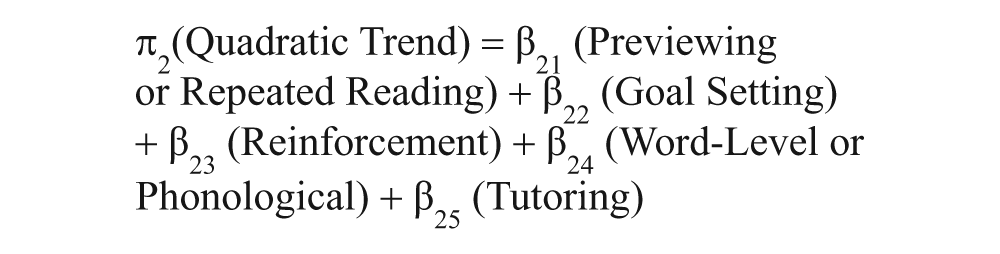
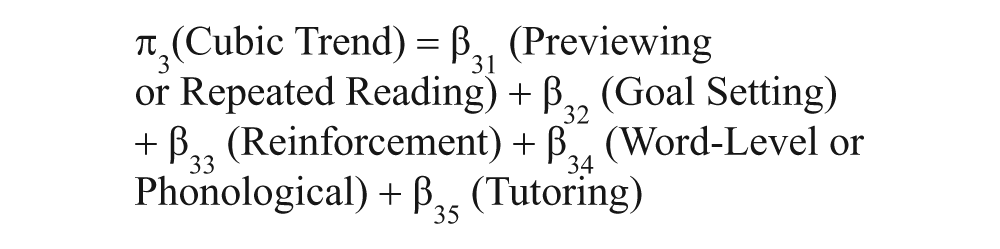
The term π0 represents the intercept of reading fluency, whereas the terms π1 through π3 represent the linear, quadratic, and cubic, trends respectively; the term π4 represents baseline levels of fluency. Thus, fluency levels were controlled for by the respective levels at baseline, allowing for a “pure” evaluation of the treatment effects (thus, the estimates can be considered a type of gain scores). The terms β01 through β04 represent the coefficients for the covariates and represented mean estimates for boys (gender = 1), minorities (race/ethnicity status = 1), grade (as a continuous variable), and integrated or inclusive settings (placement = 1). The terms β05 through β09 represent the fluency levels for each intervention condition, after controlling for the respective covariates (i.e., partial regression coefficients). We therefore contrasted the mean fluency level yielded by the intervention categories as well as their trends (i.e., linear, quadratic, cubic). We conducted between-intervention contrasts (post hoc) using chi-square difference tests. These post hoc tests allowed for contrasts of the interventions to each other rather than contrasting each intervention’s effects to a null hypothesis (i.e., to zero). Thus, with those post hoc tests we were able to classify interventions in terms of their relative effectiveness using statistically adjusted means. Level 2 variables were not standardized because they represented category memberships.
We then investigated whether there was adequate variability to conduct each level of analysis. Thus, we tested whether it was plausible to test effects at the linear, quadratic, and cubic levels from predictors at Level 2. If this was not the case, we could analyze the data using ordinary least squares methods. Results indicated that the linear and cubic trends were statistically significant; the quadratic trend neared significance (i.e., p = .08). However, given that the test of cubic effects requires the quadratic coefficient, we were obliged to retain that coefficient in subsequent modeling. Specifically, the Level 1 variance was associated with a chi-square statistic = 10006.426, p < .001. The variance accounted for by the different slope estimates was associated with the following chi-square statistics:
Multilevel Model Predicting Fluency Levels and Growth Parameters as a Function of Intervention Type
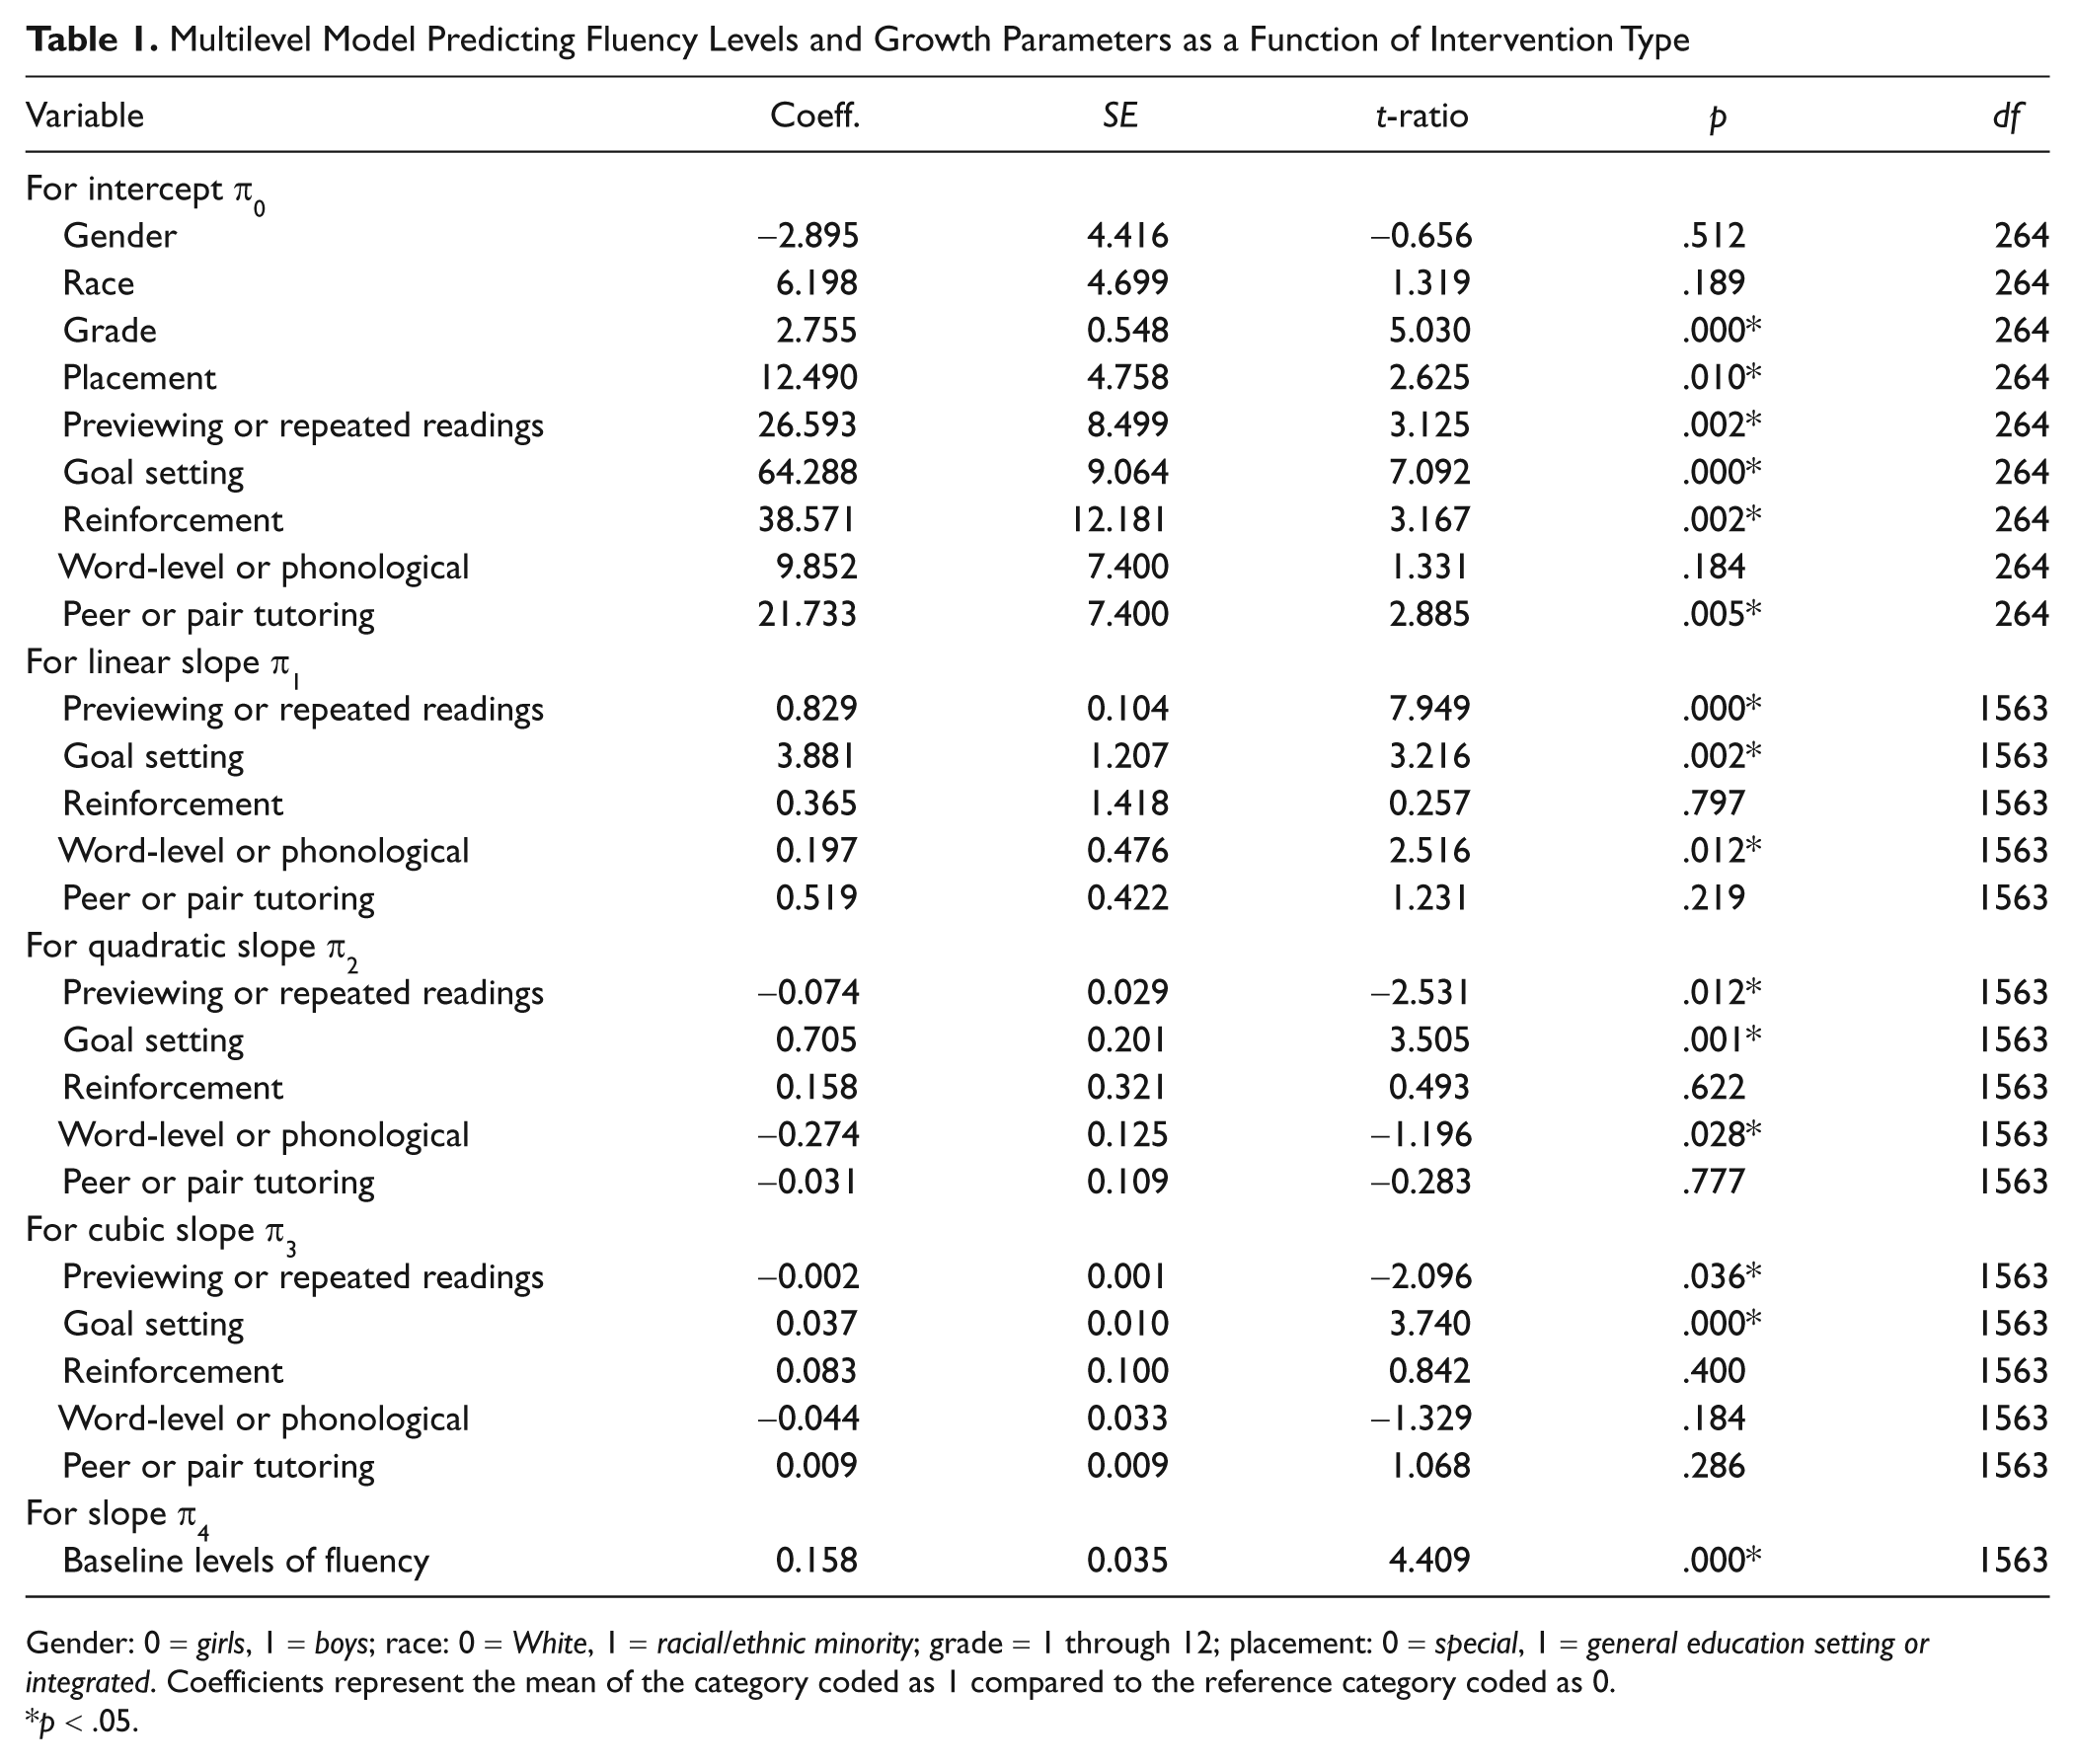
Gender: 0 = girls, 1 = boys; race: 0 = White, 1 = racial/ethnic minority; grade = 1 through 12; placement: 0 = special, 1 = general education setting or integrated. Coefficients represent the mean of the category coded as 1 compared to the reference category coded as 0.
p < .05.
Contrasts of the Interventions’ Initial Effects
Table 1 also indicates that every intercept except that for word-level or phonological intervention was significantly different from zero (i.e., the null hypothesis). The most effective intervention at the intercept level was goal setting, followed in magnitude by reinforcement, previewing or repeated reading, tutoring, and word-level or phonological. Goal setting resulted in a statistically significant mean effect of 64.29 correct words per minute (CWPM). This estimate of goal setting’s immediate effect on oral reading fluency is based on the grand mean of the sample of students who received the goal setting condition. Thus, the mean level of oral reading fluency of a student who received the goal setting intervention averaged about 64 words per minute, after accounting for the student’s baseline levels of fluency as well as additional factors (i.e., the student’s gender, race, grade, and placement). We note that this is not an absolute gain (i.e., it does not indicate that the oral reading of fluency of each student who received the goal setting intervention increased by 64 words). Instead, it is a point estimate of the average level of fluency of students participating in this condition, after controlling for a student’s baseline level of fluency and other characteristics. This goal setting CWPM effect was much stronger than, for example, peer or pair tutoring predicted effect of 22 CWPM. The least effective intervention was word-level or phonological training. This resulted in a statistically nonsignificant gain of 9.85 CWPM. Chi-square difference tests indicated that, for between-intervention differences, goal setting was significantly more effective compared to previewing or rereading (χ2 = 46.235, p < .001), reinforcement (χ2 = 6.288, p < .05), word-level or phonological (χ2 = 89.243, p < .001), and tutoring (χ2 = 36.516, p < .001). Reinforcement was significantly more effective compared to word-level or phonological (χ2 = 9.802, p < .01). Previewing or repeated reading was significantly more effective compared to word-level or phonological (χ2 = 22.420, p < .001). Peer or pair tutoring was significantly more effective compared to word-level or phonological (χ2 = 5.396, p < .01).
Contrasts of the Interventions’ Over-Time Effects
Linear effects
As shown in Table 1, three out of the five linear terms indicated statistically significant growth. In terms of their magnitude, the intervention associated with the most significant CWPM growth was goal setting. This was followed by previewing or rereading and then word-level or phonological interventions. Neither reinforcement nor tutoring was associated with statistically significant linear growth. Contrasts of the coefficients between interventions (Figure 2) indicated that goal setting was significantly more effective compared to previewing or rereading (χ2 = 6.372, p < .05), word-level or phonological (χ2 = 4.236, p < .05), and peer or pair tutoring (χ2 = 6.918, p < .01). No other intervention category’s linear growth effect was statistically significant.
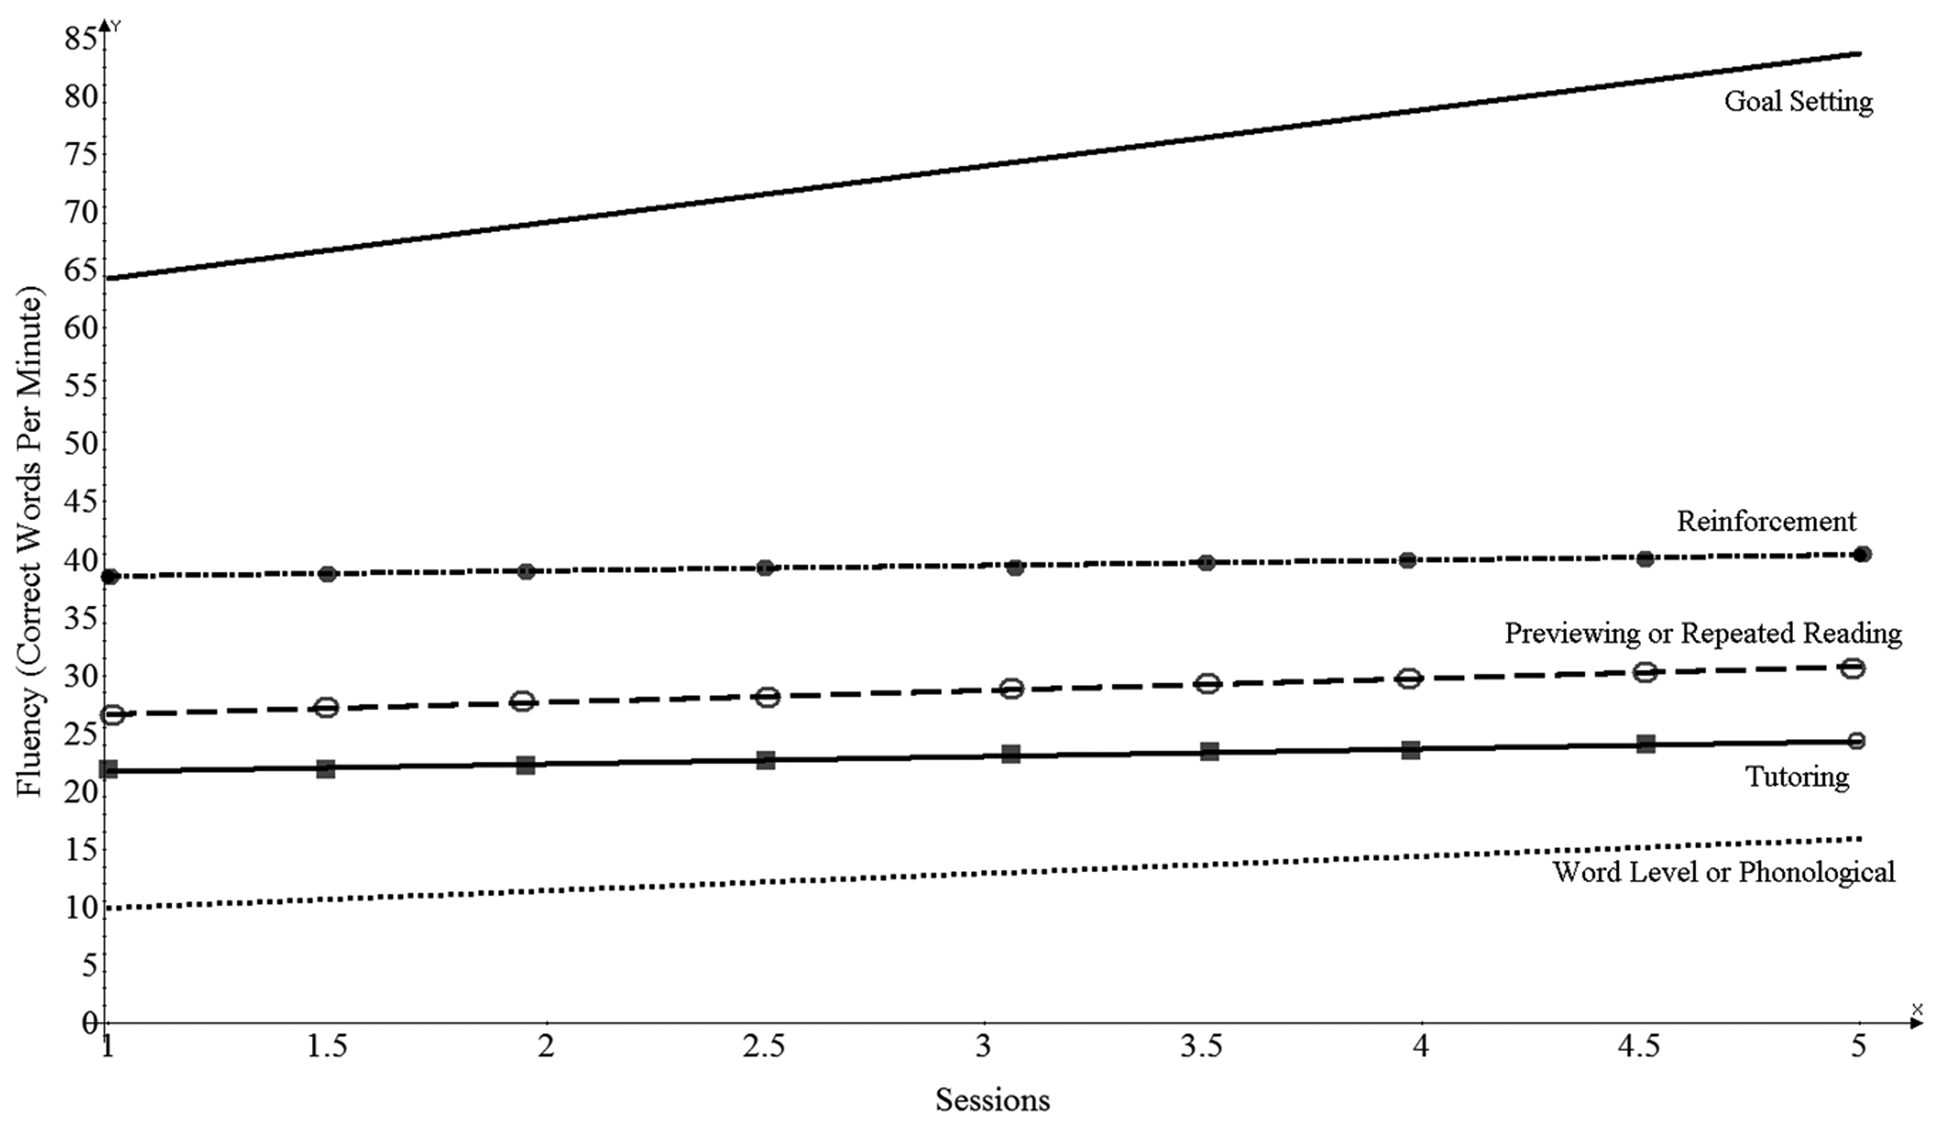
Differences between interventions on fluency at the mean level (intercept) and on rate of growth (slope).
Quadratic effects
Our analyses also indicated that there were three statistically significant quadratic effects (see Table 1 and Figure 3). Two of these were negative; one was positive. The negative quadratic paths suggest that two intervention types (i.e., previewing or rereading and word-level or phonological) become gradually less effective over time. The positive quadratic effect suggests that, over time, one intervention (i.e., goal setting) became increasingly more effective. Chi-square tests of these slope effects indicated that there were statistically significant differences between goal setting and previewing or rereading (χ2 = 14.702, p < .001), goal setting and word-level or phonological (χ2 = 17.276, p < .001), and goal setting and tutoring (χ2 = 10.409, p < .01). Each of these contrasts favored the goal setting intervention.
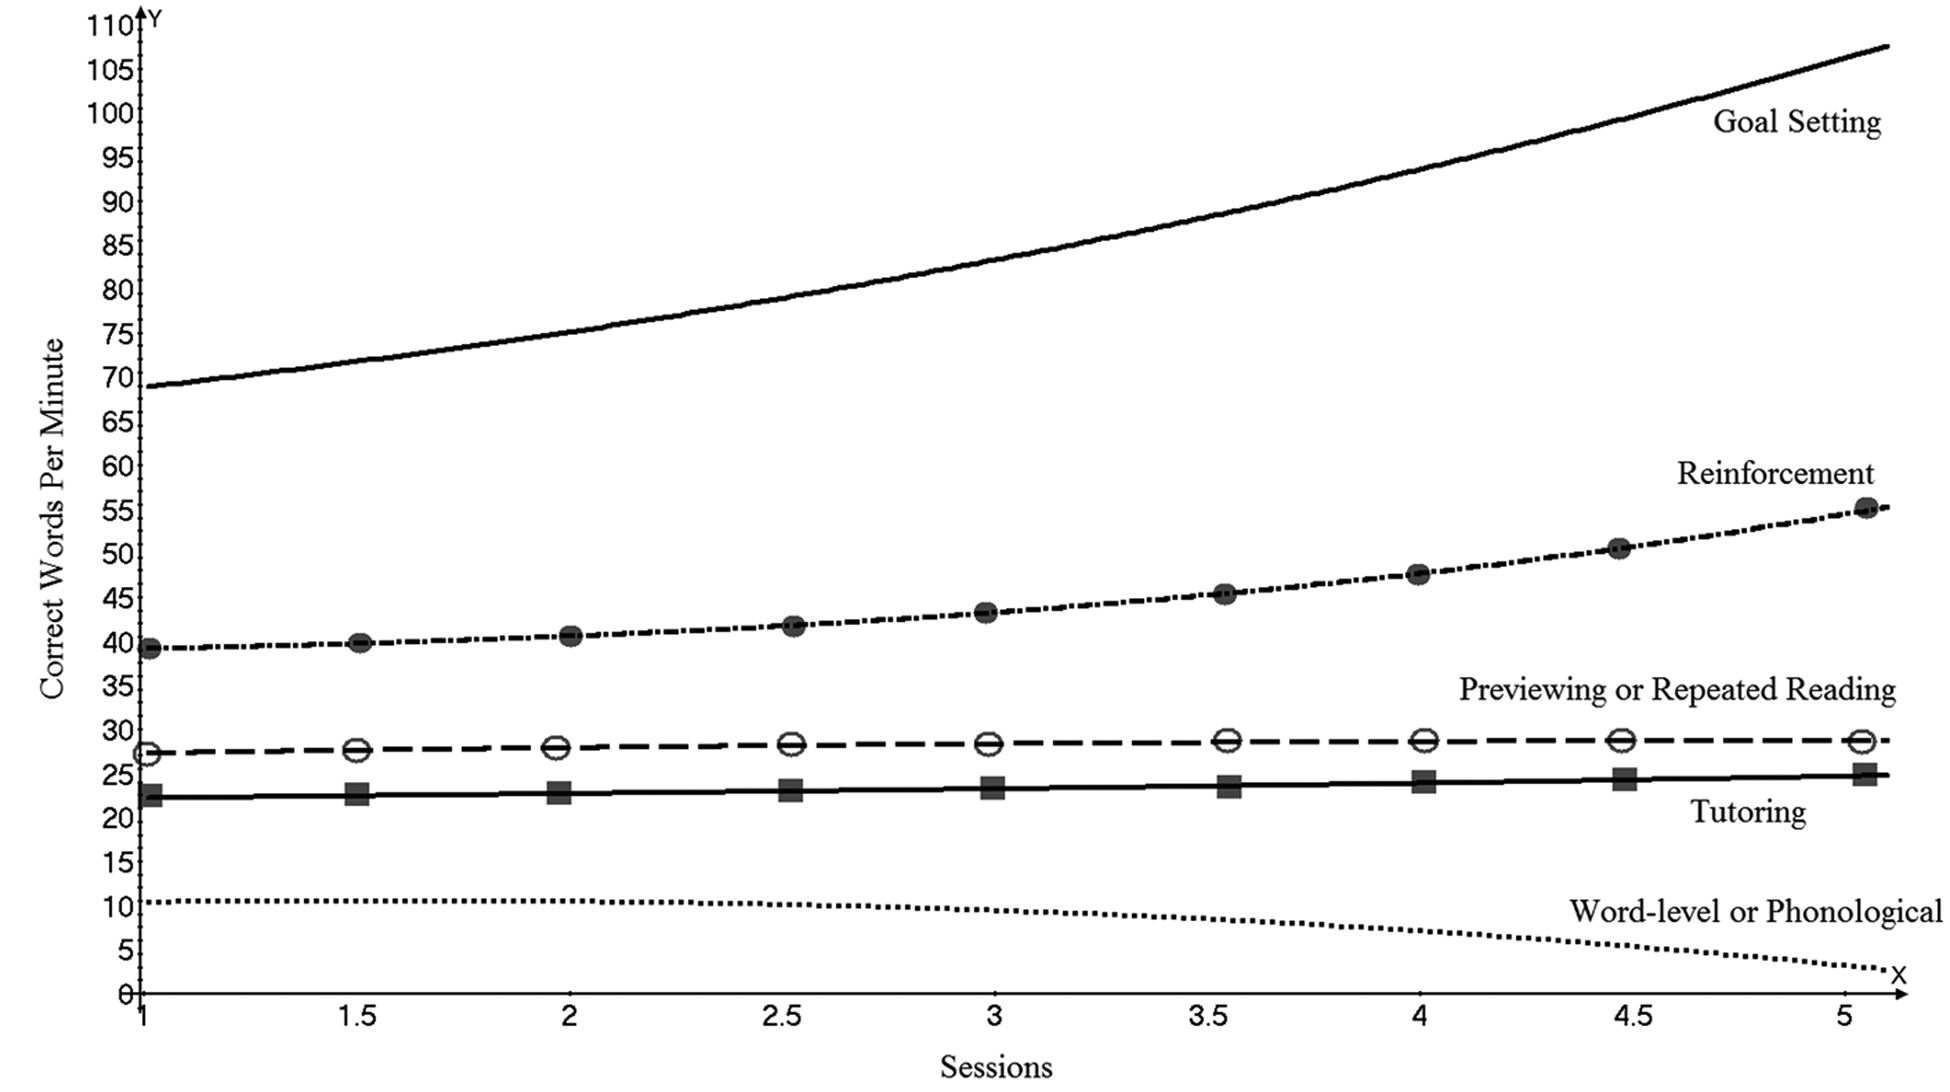
Differences between interventions at the polynomial level.
Cubic effects
There were two statistically significant cubic slope effects. Previewing or repeated readings yielded a negative effect; goal setting yielded a positive effect. However, goal setting’s positive effect size is small and close to zero.
Contrasts by Student Sociodemographics, Placement, and Disability Status
We then investigated to what extent particular student subgroups varied in their intercept levels of fluency after statistically accounting for baseline levels of fluency and all other covariates. We did so by “collapsing” the intervention contrasts. These analyses can be characterized as contrasting the response of particular groups of students to a systematic attempt at fluency intervention (of any type). We applied the following multilevel model to the data using robust standard errors:

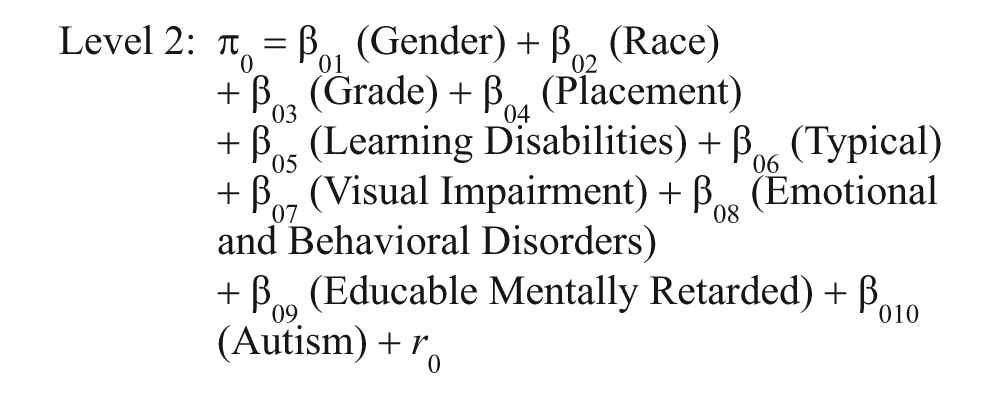

The description of the coefficients is as above. The basic tenet of this model was to estimate mean baseline levels for each group of students, after controlling for various demographic factors and initial levels of oral reading fluency.
Table 2 displays results from these analyses. Students of minority racial/ethnic heritage responded well to systematic fluency intervention (16.43, p = .002), as did older students (1.70, p = .008). Our analyses yielded no statistically significant effects by either gender or by placement. Students without disabilities displayed significantly greater fluency gains than students with disabilities. Students with visual impairments and learning disabilities made the greatest gains over their baseline levels of fluency (65.87, p < .01, and 44.92, p < .000, respectively), although students with each of the evaluated disability conditions displayed statistically significant fluency gains. Chi-square difference tests confirmed this variation in the response of students with disabilities. Students with learning disabilities typically made significantly greater fluency gains following intervention than students with behavioral disorders (χ2 = 38.847, p < .05), mental retardation (χ2 = 5.323, p < .05), or autism (χ2 = 21.944, p < .001). Students without disabilities made statistically greater gains than students with behavioral disorders (χ2 = 6.817, p < .05) or autism (χ2 = 6.172, p < .05). Students with visual impairments made significantly greater gains than students with behavioral disorders (χ2 = 7.180, p < .01), mental retardation (χ2 = 4.341, p < .05), or autism (χ2 = 7.609, p < .01).
Multilevel Model Predicting Fluency Levels From Various Sociodemographic and Disability Groups
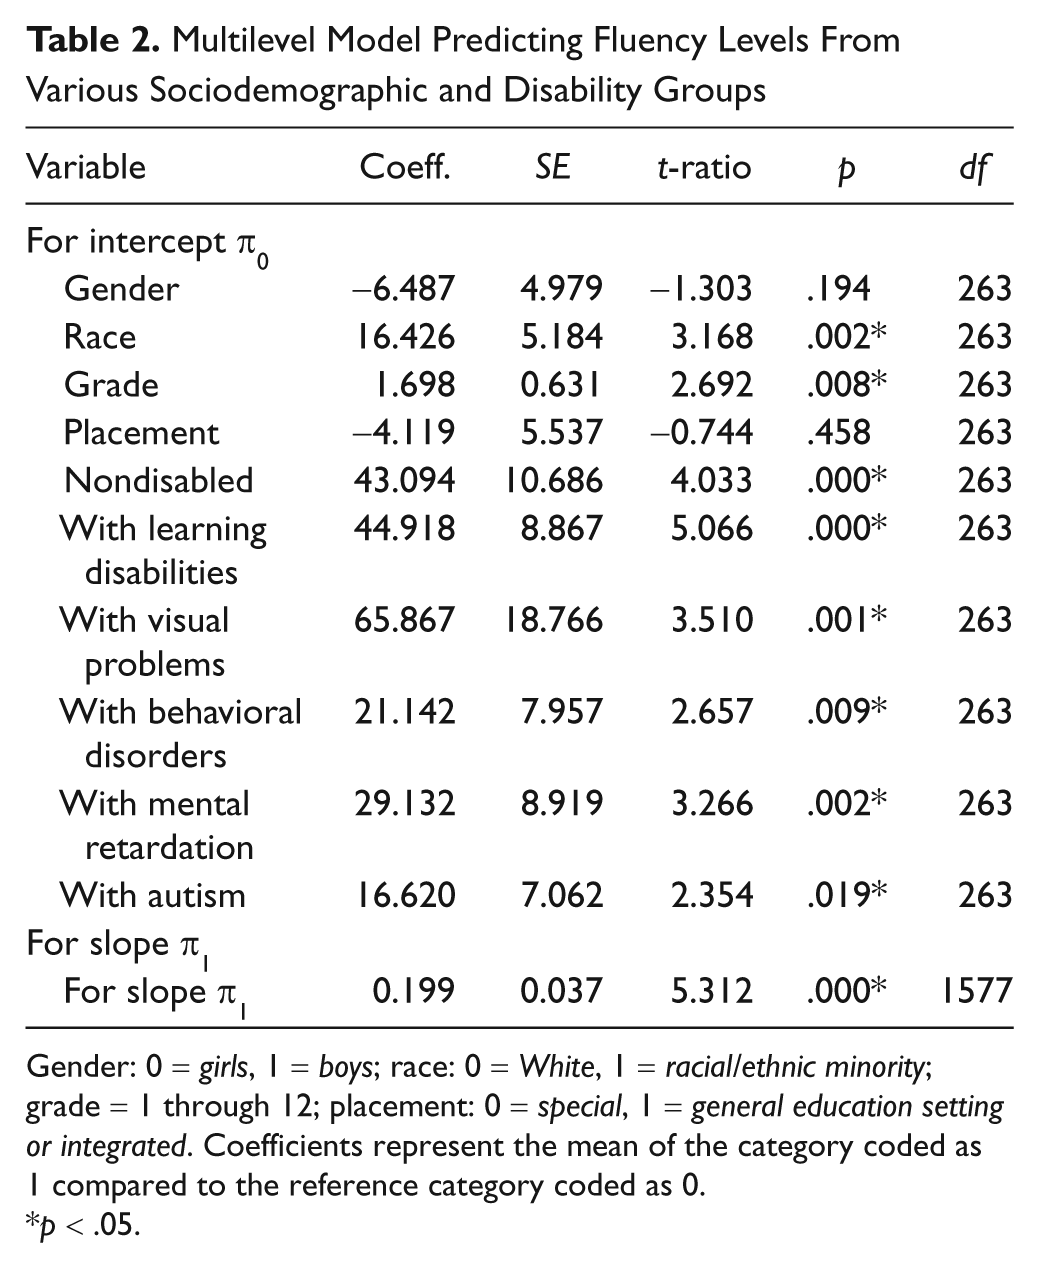
Gender: 0 = girls, 1 = boys; race: 0 = White, 1 = racial/ethnic minority; grade = 1 through 12; placement: 0 = special, 1 = general education setting or integrated. Coefficients represent the mean of the category coded as 1 compared to the reference category coded as 0.
p < .05.
Discussion
We contrasted the effects of interventions designed to increase the oral reading fluency of students with or at risk for disabilities. Doing so allowed us to identify, relative to one another, the most effective interventions. To better estimate these effects, we conducted three sets of analyses. First, we contrasted the intercept-level effects of the interventions. Doing so allowed us to identify those fluency interventions that resulted in the largest initial treatment effects. Practitioners are often seeking to introduce interventions that lead students to make immediate gains in fluency. Six of the seven interventions (with the exception being word-level or phonological training) had statistically significant and positive intercept-level effects. Goal setting had the largest such treatment effect. Use of goal setting resulted in an average gain of 64.29 CWPM. The next most initially effective intervention was reinforcement, which resulted in an average gain of 38.57 CWPM. Chi-square analyses indicated that goal setting was more effective than previewing or rereading, reinforcement, word-level or phonological training, and peer or pair tutoring. Our analyses indicated that the types of fluency interventions that resulted in the most immediate gain in a student’s oral reading fluency were those targeting the student’s “will.”
Second, we contrasted the slope-level effects of the interventions. These analyses estimated each intervention’s over-time treatment effects. Doing so allowed us to investigate whether and to what extent an intervention’s effects increased, maintained, or “washed out.” Special education practitioners are often interested in introducing interventions that result in sustained as well as immediate gains in fluency. To the degree possible, we estimated an intervention’s effects using linear, quadratic, and cubic growth trajectories. Analysis of the linear slope terms again identified goal setting as the most effective intervention, followed by previewing or rereading and word-level or phonological intervention. Neither reinforcement nor tutoring resulted in statistically significant linear growth. Chi-square difference tests indicated that goal setting was significantly more effective than previewing or repeated reading, word-level or phonological training, and peer or pair tutoring. Analysis of the quadratic terms indicated previewing or repeated reading and word-level or phonological training become gradually less effective over time. In contrast, these analyses identified goal setting as an intervention that became increasingly more effective. Chi-square difference tests of quadratic slope effects indicated statistically significant differences between goal setting and previewing or repeated reading, word-level or phonological training, and tutoring. Analysis of the cubic slope terms again indicated that use of goal setting resulted in statistically significant and positive growth in a student’s fluency. Thus, we observed goal setting to be the most effective fluency intervention in terms of both its initial and over-time effects.
Third, we investigated whether particular subgroups of students varied in their response to systematic attempts to increase their fluency. These analyses indicated that students of minority racial/ethnic heritage responded well to fluency intervention, as did older students. These analyses yielded no statistically significant effects for either gender or placement. Students without disabilities displayed significantly greater fluency gains than students with disabilities. The evaluated interventions may need to be delivered with greater intensity if students with disabilities are to display immediate fluency gains that approximate those without disabilities. Thus, these analyses provided no contravening evidence against the contention that interventions designed to bolster a student’s fluency work about as well whether the student is male or female, is being educated primarily in special or general education settings, or is disabled or not disabled. Moreover, and importantly, these analyses also indicated that students with some types of disabilities responded significantly less well than students with other types of disabilities. Although students with any particular type of disability displayed increases in their fluency subsequent to receiving intervention, those students with autism, mental retardation, or behavioral disorders typically made much smaller gains than students with learning disabilities or visual impairments. Students with autism, mental retardation, or behavioral disorders may therefore require more intensive and individualized fluency interventions than those currently being evaluated, at least if they are to make gains similar to those made by students with learning disabilities or visual impairments.
Limitations
This meta-analysis has several limitations. Because of small sample sizes, we were unable to report on interactions between a particular intervention (e.g., word-level or phonological training) and the characteristics of a student (e.g., his or her race, grade level, or specific disability). Relatedly, we assumed a fairly equal distribution of subgroups of students across the intervention categories, such that a particular student subgroup (e.g., students of minority racial/ethnic heritage, students with behavioral disorders) was not overly represented in the samples used to evaluate a specific category of intervention (e.g., goal setting, reinforcement). However, this is a tentative assumption (Kavale & Forness, 1987; Van den Noortgate & Onghena, 2003). Furthermore, the type of single-participant design used may have confounded our estimates of the effectiveness of certain interventions. This is because some single-participant designs may be more sensitive to carryover effects (e.g., alternating treatments) than others (e.g., the ABAB). Meta-analysis is necessarily constrained by characteristics of the set of studies being synthesized. None of the studies employed here were true experiments. True experiments are necessary to provide unbiased estimates of a treatment’s effects (Shadish et al., 2002). Some of our analyses (e.g., those estimating treatment effects of word-level or phonological training, or for students with visual impairments) were based on especially low frequencies and thus may not be robust because of these small cell sizes. The unequal number of data contributed by each participant may have affected our estimates of the slope-level effects of the interventions as well as resulted in varying levels of statistical power. If each intervention had been evaluated for an equally long period of time, we would have been able to provide better estimates of each intervention’s effects.
This Meta-Analysis’ Contributions to Research and Practice
Our results contribute to both research and practice. For researchers, this meta-analysis indicates that goal setting (with or without reinforcement) may be an especially effective method for increasing a student’s oral reading fluency. This finding extends those reported by prior meta-analyses (e.g., NICHD, 2000; Therrien, 2004; Wexler et al., 2008), which have mostly been restricted to evaluating the effects of only one type of fluency intervention (i.e., repeated reading). This study’s analyses indicate that goal setting may be even more effective than repeated reading, at least as categorized here. This finding contrasts with that of Burns and Wagner (2008). These investigators reported that goal setting was less effective than interventions primarily using listening, previewing, and/or repeated reading. However, substantial methodological variation may account for these contrasting findings. Our estimates were derived using multilevel modeling to meta-analyze 44 studies. Burns and Wagner analyzed a smaller set of studies (i.e., 13) using another type of effect size calculation (i.e., percentage of nonoverlapping data). Randomized control trials that rigorously compare the treatment effects of goal setting over interventions targeting listening, previewing, and repeated reading are clearly warranted.
The mechanisms responsible for goal setting’s effects also require further study. Why exactly is it that targeting a student’s “will” may increase his or her “skill” in reading quickly and accurately, particularly more so than interventions directly targeting word-level reading skill? A lack of will is not typically considered a contributing factor to poor fluency (Breznitz, 2001; Torgesen et al., 2001) and thus a target for remediation (Chard, Pikulski, & McDonagh, 2006; see Note 2). However, results from this meta-analysis do provide support for hypotheses and findings by other researchers about fluency’s resistance to interventions targeting only word recognition skills (e.g., Lyon & Moats, 1997; Torgesen, Rashotte, Alexander, Alexander, & MacPhee, 2003; but see Levy, 2001; Levy, Abello, & Lysynchuk, 1997). Although word-level instruction (i.e., phonetic decoding) is a well-established method of increasing word recognition skills (e.g., NICHD, 2000), it is less clear whether such instruction is also sufficient to bolster fluency (Torgesen et al., 2003). Here, word-level or phonological training was far less effective than the other fluency interventions. At the intercept level, its effect was only one fifteenth of the magnitude of goal setting’s effect (i.e., 9.85 vs. 64.29). Instead, our meta-analysis supports attempts to increase a student’s fluency by targeting the student’s motivation and goal directed behavior. This conclusion is consistent with earlier work reporting characteristics of effective interventions for students with learning disabilities (Deci & Chandler, 1986; Fuchs, Bahr, & Rieth, 1989; Grimes, 1981; Margalit & Heiman, 1986; Margalit & Shulman, 1986). Targeting a student’s will also can have sustained effects, at least as evidenced by goal setting’s slope-level estimates.
For practitioners, results from this meta-analysis indicate that targeting a student’s word recognition skills is unlikely to result in gains in his or her fluency. Practitioners should instead consider using goal setting, with or without reinforcement. Introduction of goal setting can immediately result in a student making large gains in fluency, with these gains increasing over time. Other relatively effective interventions, especially initially, are reinforcement and previewing or repeated reading. Yet our analyses indicate that practitioners will likely encounter substantial variation in response to fluency-targeting interventions by students with and without disabilities. Special education practitioners may need to anticipate providing students with disabilities with fluency interventions of relatively greater intensity than those typically provided to students without disabilities, as well as providing certain groups of students with disabilities with comparatively more individualized and intensive interventions, as students with some types of disabilities (e.g., behavioral disorders, autism) may respond less well than students with other types of disabilities (e.g., learning disabilities).
Footnotes
Appendix
Single-Participant Intervention Studies on Fluency Included in the Meta-Analysis
| Study | Participants and characteristics | Intervention characteristics | Research design | Data points in intervention phase (by participant) | Reliability or treatment fidelity reported |
|---|---|---|---|---|---|
| 1. Barton-Arwood, Wehby, and Falk (2005) | Sam: 8 years old, male, with emotional disturbances and language impairments; Gerald: 8 years 6 months old, male, with emotional disturbances; Rich: 8 years old, male, with other health impairments, learning disabilities, and language impairments; Jack: 8 years 2 months old, male, with learning disabilities, other health impairments, and language impairments; Emma: 8 years 1 month old, female, with emotional disturbances; Kim: 8 years 6 months old, female, with emotional disturbances and learning disabilities | Peer-assisted learning and direct instruction | Multiple baseline | 13 for Gerald, 16 for Sam, 17 for Rich, 17 for Jack, 10 for Emma, and 10 for Kim | Reliability and treatment fidelity |
| 2. Billingsley (1977) | Pupil 4: 10 years 5 months old with reading difficulties; Pupil 5: 10 years old with reading difficulties; Pupil 6: 9 years 9 months old with reading difficulties | Reinforcement | ABAB | 7, 9, and 9 for Pupils 4 through 6, respectively | Reliability |
| 3. Bonfiglio, Daly, Martens, Lin, and Corsaut (2004) | Camille, 3rd grade girl |
Reinforcement; Repeated readings and error correction; and Goal setting, feedback and reinforcement |
ABAB | 6 when combining the two intervention phases | Reliability and treatment fidelity |
| 4. Daly, Hintze, and Hamler (2000) | Manny: 1st grader identified by teacher as being at “frustrating levels” in reading | Listening and repeated readings | Alternating treatments | 21 | None |
| 5. Daly and Martens (1994) | Two students with identified LD; they were both 11 years 11 months old | Listening and repeated readings only | Alternating treatments | 7 | Reliability |
| 6. Daly, Martens, Kilmer, and Massie (1996) | Jim and Jon were classified as having LD and were instructed in self-contained classrooms; their age ranged between 8 years 6 months to 12 years | Phonics | AB | 4 | Reliability and treatment fidelity |
| 7. Daly, Persampieri, McCurdy, and Gortmaker (2005) | Two students selected by their teacher as having reading difficulties: Joshua: 10 years 10 months; Elly: 9 years 3 months | Goal setting, feedback and reinforcement | AB with experimental probes | 13 and 14 for Joshua and Elly respectively | Reliability and treatment fidelity |
| 8. Dawson, Venn, and Gunter (2000) | Bob: 8 years 6 months old male in Grade 2 with EBD; Jerry: 7 years 11 months old male in Grade 1 with EBD; Susan: 7 years 6 months old female in Grade 2 with EBD; Brady: 8 years 2 months old male in Grade 1 with EBD | Teacher or computer modeling | Alternating treatments | 7 sessions for all students in each condition | Reliability |
| 9. Duvall, Delquadri, Elliott, and Hall (1992) | Steven: 8 years 11 months old with RD; Anna: 7 years 10 months old with RD; Dean: 7 years 5 months old with RD | Parent tutoring | Multiple baseline | 10 for each student | Reliability and treatment fidelity |
| 10. Eckert, Ardoin, Daisey, and Scarola (2000) | Four male students selected by their teacher as having reading difficulties; Abel: 7 years 8 months; Grafton: 7 years 3 months; Brett: 8 years 5 months; Rubin: age N/A; all students were subjected to all conditions |
Listening and repeated readings; Goal setting and feedback; Reinforcement; Goal setting, feedback and reinforcement; other combinations were excluded because of low frequency with regard to occurrence across studies |
Alternating treatments | 3 | Reliability and treatment fidelity |
| 11. Eckert, Ardoin, Daly, and Martens (2002) | Hunter: 2nd grade student with teacher-identified reading difficulties; Stephen: 3rd grade student with teacher-identified reading difficulties; Bethany: 7 years old with teacher-identified reading difficulties; Mason: 8 years old with teacher-identified reading difficulties; Alison: 9 years old with teacher-identified reading difficulties; Vilna: 9 years old with teacher-identified reading difficulties |
Listening and repeated readings; Goal setting and feedback; Reinforcement; Goal setting, feedback, and reinforcement |
Alternating treatments | 3 | Reliability and treatment fidelity |
| 12. Faykus and McCurdy (1998) | Charlie: male, age 14 with an IQ of 68; Jimmy: Male, age 11 with an IQ of 61; Howard: Male, age 15 with an IQ of 71; Nicki: Female, age 14 with an IQ of 65; Chris: Male, age 11 with an IQ of 71; Nicole: Female, age 16 with an IQ of 57 | Goal setting and feedback as students were graphing and monitoring their performance through a goal line | ABC | 10 for Charlie, 13 for Jimmy, 10 for Howard, 8 for Nicki, 15 for Chris, and 8 for Nicole | Reliability |
| 13. Fiala and Sheridan (2003) | Bob: 9 years old, was receiving Title I reading services | Parent tutoring | Multiple baseline | 13 | Reliability and treatment fidelity |
| 14. Freeman and McLaughlin (1984)† | Six students with LD | Listening and repeated readings | Multiple baseline | 5, 6, 3, 4, 6, and 6 for Students 1 through 6, respectively | Reliability |
| 15. Gilbert, Williams, and McLaughun (1996) | Three students with LD ranging in age between 7 years 1 month and 7 years 4 months | Listening and repeated readings | Multiple baseline | 28, 25, and 22 for Students 1 through 3 | Reliability and treatment fidelity |
| 16. Hitchcock, Prater, and Dowrick (2004) | Cinnamon: 7 years 3 months old with SLD; Indigo: 6 years 4 months old considered for special ed. services; Navy: 6 years 11 months old with SLD | Tutoring only was assessed; tutoring plus video or audio modeling represented a low frequency category and was excluded | Multiple baseline | 6/7, 3/4, and 7/7 for Cinnamon, Indigo, and Navy, respectively, for tutoring/tutoring and modeling | Reliability and treatment fidelity |
| 17. Hook and DuPaul (1999) | Joey: 2nd grader with reading difficulties; Susan: 3rd grader with reading difficulties; Thomas: 2nd grader with reading difficulties and recipient of Chapter I services; Scott: 2nd grader with reading difficulties | Parent tutoring | Multiple baseline | 18, 12, 18, and 12 for Joey, Susan, Thomas, and Scott, respectively | Reliability and treatment fidelity |
| 18. Houghton and Bain (1993) | Eight Grade 9 students whose English was a second language; 5 were male and 4 female; their age ranged between 14 years 5 months and 15 years 4 months | Tutoring | Multiple baseline | Sessions ranged between 15 and 19 across students | Reliability and treatment fidelity |
| 19. Jones and Wickstrom (2002) | Jeff: 1st grade, referred for LD and recipient of Title I services; Jay: 2nd grade, referred for LD and recipient of Title I services; Dan: 2nd grade, referred for LD and recipient of Title I services; Mark: 3rd grade, referred for LD and recipient of Title I services; Joey: 3rd grade, referred for LD and recipient of Title I services |
Listening and repeated readings; Listening and previewing plus error correction |
Alternating treatments | 4/8, 4/8, 5/6, 5/6, and 9 for Jeff, Jay, Dan, Mark, and Joey for previewing or repeated readings, respectively | Reliability and treatment fidelity |
| 20. Kamps, Locke, Delquadri, and Hall (1989) | Two male elementary school students with autism; Student 1 was 9 years old with an IQ of 50 and Student 2 was 11 years old with an IQ of 50 as well | Classwide peer tutoring | Multiple baseline | 19 for student 1 and 16 for student 2 | Reliability |
| 21. Lane, O’Shaughnessy, Lambros, Gresham, and Beebe-Frankenberger (2001) | Derk: 92 months, boy, with EBD and reading difficulties; Karina: 80 months, girl, with EBD and reading difficulties; Lilah: 89 months, girl, with EBD and reading difficulties; Nicholas: 77 months, boy, with EBD and reading difficulties; Steven: 74 months, boy, with EBD and reading difficulties; Timmy: 88 months, boy, with EBD and reading difficulties; Willard: 89 months, boy, with EBD and reading difficulties | Phonological awareness training | Multiple baseline with postintervention and follow-up conditions | 7 for Derk, 9 for Karina, and 10 for the remaining students | Reliability and treatment fidelity |
| 22. Lionetti and Cole (2004) | Stephanie: 4th grader; John: 4th grader; Susan: 5th grader; Scott: 4th grader; they all had reading difficulties and were reading 1 to 2 grades below their grade level; their ages ranged from 9 to 12 years old | Previewing through listening to text in a fast rate | Alternating treatments | 8, 8, 9, and 9 for Stephanie, John, Susan, and Scott, respectively | Reliability and treatment fidelity |
| 23. Nelson, Alber, and Gordy (2004) | Student 1: 9 years 6 months old with LD; Student 2: 8 years 10 months old with ADHD; Student 3: 8 years 3 months old with LD; Student 4: 8 years 2 months old with LD | Listening and rereading with error correction | Multiple baseline | 11, 8, 5, and 5 for Students 1 through 4, respectively | Reliability and treatment fidelity |
| 24. Noell et al. (1998) | Three 4th graders with reading difficulties and ADD |
Reinforcement; Listening and repeated rereadings |
Multiple baseline | For reinforcement: 4/3/2 for the three students; for listening and rereading: 4/3/6 for the three students | Reliability and treatment fidelity |
| 25. O’Donnell, Weber, and McLaughlin (2003) | Ralph, 10-year-old 5th grader, at risk because of inability to think and process information that was in English | Keywords and previewing | ABAB | 10 | Reliability |
| 26. Pattillo, Heller, and Smith (2004) | Chris: 11-year-old male, Grade 6, with retinitis pigmentosa; Melissa: 13-year-old female, Grade 8, with cataractus nystagmus; Nick: 14-year-old male, Grade 8, with maculopathy nystagmus; Michael: 12-year-old male, Grade 7, with retinopathy of prematurity, nystagmus, and cataracts; Serena: 12-year-old female, Grade 7, with retinal colobomas | Goal setting with the use of voiced reading software | Changing criterion | 12 for Chris, 15 for Melissa, 14 for Nick, 13 for Michael, and 15 for Serena | Reliability |
| 28. Rose (1984a) | Five male students ranging in age between 9 years 3 months and 12 years 1 month with behavioral disorders |
Previewing; Listening and repeated readings |
Alternating treatments | 11–13 data points for Learners 1 through 5 in the previewing condition and 11–12 in the listening and repeated readings condition | Reliability |
| 27. Rose (1984b) | Three male and two female students with EMR and ages between 9 years 1 month and 12 years 4 months; their IQ ranged between 59 and 68 points |
Previewing; Listening and repeated readings |
Alternating treatments | 10–12 data points for Learners A through E in the previewing condition and 11–13 data points for the same learners in the listening and repeated readings condition | Reliability |
| 29. Rose (1984c) | Six students ranging in age between 9 years 6 months and 13 years 2 months; they were all receiving resource room instruction and several of them had been retained in previous grades; they had significant deficits in reading |
Previewing; Listening and repeated readings |
Alternating treatments | For previewing: 10, 9, 10, 10, 10, and 10 for Learners 1 through 6; for listening and rereading there were 10 data points for each learner | Reliability |
| 30. Rose and Beattie (1986) | Participant 1: 10 years old with LD; Participant 2: 11 years 6 months old with LD; Participant 3: 8 years 7 months old with LD; Participant 4: 9 years 1 month old with LD; all students were receiving additional instruction in a resource room | Listening and rereading only was selected because the “taped” procedure was identical with only difference being the use of the tape player | Alternating treatments | 11, 12, 9, and 11 for Participants 1 through 4, respectively | Reliability |
| 31. Rose, McEntire, and Dowdy (1982) | Five students ranging in age from 8 years 7 months to 11 years 6 months who were receiving LD resource room instruction; they were 2 to 4 years behind in academic achievement | Phonics only was included; there was an error correction procedure that represented a low frequency category | Alternating treatments | 10, 9, 10, 10, and 12 for Learners 1 through 5 | Reliability |
| 32. Rose and Sherry (1984) | Five students with a diagnosis of LD; their age ranged between 14 years 10 months and 16 years 2 months; they were also receiving resource room instruction | Listening and rereading was evaluated only | Alternating treatments | 11, 12, 12, 12, and 13 for Learners 1 through 5 | Reliability |
| 33. Scott and Shearer-Lingo (2002) | Tony: 7th grade male with EBD; Billy: 7th grade male with EBD; John: 7th grade male with EBD | “Teach Your Child” and “Great Leaps”; both categorized as “word-level or phonological” interventions | Multiple baseline with multiple treatments | 3, 2, and 2 data points for “Teach Your Child” and 15, 19, and 5 data points for the “Great Leaps” program for Tony, Billy, and John, respectively | Reliability (treatment fidelity mentioned but there was no data) |
| 34. Shapiro and McCurdy (1989) | Five students with significant reading difficulties (were reading below Grade 6) aged between 14 and 16 years; three had LD and one EMR; all presented themselves with emotional problems as well | Listening and repeated readings | Multiple baseline | 18, 17, 13, 15, and 20 for Students 1 through 5, respectively | Reliability and treatment fidelity |
| 35. Skinner, Cooper, and Cole (1997) | John: 12 years old with LD; Jack: 12 years old LD and EBD | Listening and repeated readings (slow presentation) | Multiple baseline | 6 for John and 8 for Jack | Reliability and treatment fidelity |
| 36. Skinner, Johnson, Larkin, Lessley, and Glowacki (1995) | Charles: 7 years 11 months boy with an IQ of 86 points; Susan: 8 years 10 months girl with an IQ of 54 points; Bill: 9 years 8 months boy with an IQ of 71 points | Taped Words | Modified alternating treatments followed by conditions of replication and maintenance | 58 for Charles, 30 for Susan, and 33 for Bill | Reliability |
| 37. Skinner and Shapiro (1989) | Four students ranging in age between 14 and 18 years with behavioral disorders; their IQ ranged between 85 and 95 | Taped Words | Alternating treatments | Sessions ranged between 9 and 12 across the four students | Reliability and treatment fidelity |
| 38. Smith (1979) | John: 12 years old with significant deficits in reading | Listening and repeated readings without error correction was assessed only | Multiple-treatments ABCD | 5 | None |
| 39. Sterling, Robinson, and Skinner (1997) | Chad: 12 years 2 months old male with an IQ of 70; Ross: 11 years 8 months old male with an IQ of 65; Joey: 10 years 4 months old male with an IQ of 48 | Taped Words, (listening and previewing) | Alternating treatments | 8, 9, and 20 for Ross, Chad, and Joey, respectively | Reliability and treatment fidelity |
| 40. Strong, Wehby, Falk, and Lane (2004) | Steve: 14 years old with LD plus a history of behavioral problems | Listening and repeated readings with error correction | Multiple baseline | 4 | Reliability and treatment fidelity |
| 41. Swain and Allinder (1996) | C.C.: 8 years 1 month old with LD; A.B.: 7 years 8 months old with LD; R.B.: 7 years 8 months old with LD; all students were receiving special education services for more than 1 year; they were receiving reading instruction in a resource room | Listening and repeated readings | Multiple baseline | 18, 12, and 6 for C.C., A.B., and R.B., respectively | Reliability |
| 42. Tingstrom, Edwards, and Olmi (1995) | Student 1: 9 years old at risk for academic and behavioral problems; Student 2: 10 years old at risk for academic and behavioral problems; Student 3: 12 years old at risk for academic and behavioral problems; all students were recommended by the teacher as needing remedial services in reading | Listening and repeated readings | Alternating treatments | 4, 9, and 4 for Students 1 through 3 | Reliability |
| 43. Valleley and Shriver (2003) | John: 16 years old with LD; Steve: 16 years old with LD; David: 15 years old with LD | Listening and repeated readings | Multiple baseline | 22, 21, and 24 for John, Steve, and David, respectively | Reliability and treatment fidelity |
| 44. VanAuken, Chafouleas, Bradley, and Martens (2002) | Three students identified by their teacher as having reading difficulties; William: 7 years 2 months; Jack: 8 years 3 months; Rachel: 8 years 10 months | Listening and repeated readings intervention selected because other condition included reading material below grade level for students | Alternating treatments | 10 | Reliability and treatment fidelity |

LD = learning disabilities; EBD = emotional and behavioral disorders; RD = reading disabilities; SLD = specific learning disability; ADD = attention deficit disorder; EMR = educable mentally retarded. The interventions described above may not be all the interventions described in a given study. Interventions may have been excluded for several reasons. For example, interventions sometimes could not be classified into a category with adequate frequencies. All interventions included estimation of fluency in passages, except one (†) that included word lists.
Declaration of Conflicting Interests
The author(s) declared no potential conflicts of interest with respect to the authorship and/or publication of this article.
Funding
The author(s) received no financial support for the research and/or authorship of this article.