



Abstract
The focus of this study was on increasing the knowledge base on students with disabilities at the secondary level. Data were gathered on 559 classified secondary students with disabilities served in four educational options: cotaught classes, resource rooms, alternate day support programs, and no direct supports. Results indicate that there are associations between classification and placement options, differences in full-scale IQ by placement option, differences in the numbers of related services and the number of testing accommodations students receive based on placement option, associations among placement option and both related services and testing accommodations, and no differences in grades by placement option. Implications for future research and practice are discussed.
Keywords
Recent amendments to the Individuals with Disabilities Education Act of 2004 (IDEA, 2004) are clearly designed to better align special education policies and services with the larger national school improvement efforts (e.g., No Child Left Behind Act [NCLB], 2002). IDEA presumes that the vast majority of students in special education will develop the knowledge and skills to access the general education curriculum often defined as earning passing grades and making adequate yearly progress based on demonstrated success in standardized state and local assessments. In other words, To the maximum extent appropriate . . . removal of children with disabilities from the regular educational environment occurs only when the nature or severity of the disability is such that education in regular classes with the use of supplementary aids and services cannot be achieved satisfactorily. (IDEA, 2004, chap. 33, sec. 1412[a][5][A])
At the same time, the current climate in schools seems to be focused on greater accountability, increased standards, and high-stakes testing for all students (Browder, Spooner, Wakeman, Trela, & Baker, 2006; Thurlow & Wiley, 2006). This “standardized, one-size-fits-all approach” (Mihalas, Morse, Allsopp, & McHatton, 2009, p. 109) may not always mesh with the individual instructional and support needs of students with disabilities (Browder et al., 2006; Goodman, Hazelkorn, Bucholz, Duffy, & Kitta, 2011). Another factor that may influence outcomes for students with disabilities is the way in which many states have chosen to operationally defined NCLB’s call for “highly qualified teachers,” especially at the secondary level, solely on knowledge of content rather than pedagogy (Boudah, Schumacher, & Deshler, 1997; Mihalas et al., 2009). Focusing exclusively on content knowledge overlooks what we know from the research on teaching, namely that teachers’ manner and practices (i.e., pedagogy) play a pivotal role in improving academic achievements and strengthening the self-efficacy of struggling learners at the secondary level (Deshler, Schumaker, & Woodruff, 2004; Linnenbrink & Pintrich, 2003; Pintrich & Schunk, 2002; Schunk & Zimmerman, 1997).
Also, although both families and professionals identify the importance of collaboration in terms of planning for and meeting the needs of students with disabilities, collaboration at the secondary level is rare (Blue-Banning, Summers, Frankland, Nelson, & Beegle, 2004). Morningstar, Turnbull, and Turnbull (1995) report that students feel that school professionals place little attention on getting student input as part of the planning process and that they devote little effort to actually plan for the future as part of the transition process, even though research on transition planning and goal setting now links student and family participation and student self-determination with increased graduation rates, employment, and the achievement of positive postschool outcomes (Benz, Lindstrom, & Yovanoff, 2000; Mason, McGahee-Kovac, Johnson, & Stillerman, 2002; Wehmeyer & Palmer, 2003; Wehmeyer & Schwartz, 1997). Recent findings from the National Longitudinal Transition Study–2 (Cameto, Levine, & Wagner, 2004) indicate that while in school almost half of all secondary students with disabilities planned to attend college, yet 2 years postgraduation only 19% of students with disabilities were actually attending college, as compared to 40% of their peers without disabilities.
On a more positive note, more and more students with disabilities are being served in general education classes than ever before. According to recent national statistics data (National Center for Education Statistics [NCES], 2010), 95% of school populations served under IDEA are enrolled in regular schools, and more than half of students with disabilities receive a significant portion of their daily instruction in general education classrooms. The high percentage of special education students who are educated in general education classrooms demonstrates the considerable influence of the IDEA’s requirements on contemporary educational practice (Bull & Reedy, 2007).
One way of increasing access to the general education curriculum is to educate students with disabilities in general education classrooms (Goodman et al., 2011; Yell & Katsiyannis, 2004). Increasingly, coteaching classes in which general education and special education teachers collaboratively deliver instruction are used to include students with disabilities in general education classes (Murawski & Swanson, 2001; Walther-Thomas, 1997). At the secondary level, coteaching is one of the most frequently suggested models for meeting the individual needs of students with disabilities in an inclusive environment (Magiera & Zigmond, 2005; Murawski, 2006; Zigmond & Magiera, 2001).
Although some researchers express concerns about the effectiveness of coteaching on the academic, social, and behavioral outcomes of secondary students with disabilities (e.g., Boudah et al., 1997; Hang & Rabren, 2009; Murawski, 2006; Vaughn, Elbaum, Schumm, & Hughes, 1998; Weichel, 2001), others report that coteaching improves the academic outcomes of secondary students with disabilities across content areas such as reading (Hang & Rabren, 2009), math (Fontana, 2005; Hang & Rabren, 2009; Rea, McLaughlin, & Walther-Thomas, 2002), and science (McDuffie, Mastropieri, & Scruggs, 2009). Other studies also support the positive impact of coteaching on self-concept, social skills, study skills, and behaviors of students with disabilities (Fontana, 2005; Rea et al., 2002; Walther-Thomas, 1997). Furthermore, research also demonstrates that coteaching is a preferred option of students and teachers with both groups reporting benefits of coteaching (Scruggs, Mastropieri, & McDuffie, 2007; Wilson & Michaels, 2006). Secondary students with and without disabilities viewed coteaching positively as a result of the increased opportunities to receive assistance afforded by having two teachers in the classroom (Wilson & Michaels, 2006).
Despite the body of literature reporting that coteaching promotes positive learning and behavioral outcomes for students with disabilities, other research suggests that students with disabilities, especially students with emotional disturbance, learning disabilities, and behavior disorders, may not be doing better than their counterparts in resource rooms or pull-out programs (Boudah et al., 1997; Fore, Hagan-Burke, Burke, Boon, & Smith, 2008; Hang & Rabren, 2009; Vaughn et al., 1998). Instruction in resource rooms has traditionally been a combination of remediation of basic skills and strategy instruction focused on general education content standards; and although resource rooms have been a part of the continuum of services since the passage of Public Law 94-142 in 1975 (i.e., the Education of All Handicapped Students Act), there is scant research on who is being served in resource rooms and their effectiveness (Bentum & Aaron, 2003; Fore et al., 2008).
There is also ongoing debate in the field of special education on the usefulness of intellectual ability (i.e., IQ) in terms of informing or predicting educational outcomes of students with disabilities (Jimenez, Siegel, & Lopez, 2003). In fact, low achievement rather than IQ has been found to be more of a determining factor in special education placement decisions (MacMillan & Forness, 1998). In the areas of learning disabilities (LD) and emotional and behavioral disorders (EBD), there is growing criticism of using IQ as a predictor of student academic and behavioral potential (Francis et al., 2005; Jimenez et al., 2003) with current policies leaning toward identifying students with LD through a process involving early screening and intervention using a response-to-intervention model (Siegel, 2003; U.S. Department of Education, Office of Special Education and Rehabilitative Services, 2002).
In addition, under IDEA (2004), students with disabilities in all placement options along the continuum are entitled to related services and testing accommodations and modifications as specified in their individualized education programs (IEPs). However, little research exists to determine whether differences in related services and testing accommodations exist across placement options (Forness, 2001).
“The only certainty regarding the effects of class placement is that there is no consensus” (Fore et al., 2008, p. 56), and there is little evidence that academic achievement differs by placement option. In fact, many have questioned how decisions are made about how students with disabilities are placed into educational options along the continuum of services and what ancillary services and instructional supports (i.e., related services and accommodations or modifications) are actually provided to these students to facilitate access to the general education curriculum (Bull & Reedy, 2007; Guardino, 2008; Yell & Katsiyannis, 2004); and if such a large percentage of students with disabilities are currently being educated in general education classes, how are they actually performing academically. Recently, Goodman et al. (2011) reported on data for the state of Georgia suggested that although inclusion of students with disabilities in general education classrooms increased 64% over the 6-year period addressed in their study, the overall graduation rate for these students remained unchanged at slightly less than 30%. Goodman et al. focused solely on graduation rates and did not examine factors associated with inclusive settings.
Thus, the current investigation focused on how special education services and supports are actualized for secondary students with disabilities in relation to placement into various settings by exploring the characteristics of students (i.e., disability classification, IQ, and usage of both related services and testing accommodations or modifications) and their academic performance across placement options. Specifically, to better understand secondary-level students with disabilities currently participating in a variety of settings within the continuum of service options, four research questions were addressed:
Is there a relation between disability classification and special education service delivery option (i.e., coteaching class, resource room, alternate day support program, no direct services)?
Are there differences in the intellectual ability of secondary students with disabilities (i.e., full-scale IQ) by service delivery option?
Are there differences or relations in related services and testing accommodations or modifications provided to students by service delivery option?
Are there differences in content area performance of students with disabilities (i.e., grades in English, mathematics, science, social studies) by service delivery option?
Method
Participants and Setting
This study was conducted in a large suburban, metropolitan school district consisting of two middle schools (Grades 7 and 8) and three high schools (Grades 9 through 12), serving approximately 6,000 students in New York State. At the time that these data were collected, 90.7% of students with disabilities in New York State received part of their daily instruction in general education classrooms and 24.13% received more than 60% of their daily instruction in resource rooms or segregated special education settings within a public school (National Center for Education Statistics, 2010). The participating district was engaged in coteaching in all major content areas. The district’s commitment to include coteaching at the secondary level was part of a larger reform effort focused on eliminating like-ability-level class groupings (tracking and self-contained classes) while raising performance expectations or content standards for all students.
This sample of 559 students represents more than 85% of the district’s secondary students with disabilities. Classified students not included in this sample were those for whom data were incomplete and those with more severe disabilities, who were in self-contained special education classes or in out-of-district placements.
Table 1 presents the demographic information of the secondary special education students who composed our sample. Approximately two thirds of the secondary students with disabilities were male (65%). Students were fairly equally distributed among grades—ranging from the smallest representation with 7th grade students (15.9%, n = 89) to the largest representation shared by the 8th grade and the 11th grade students (18.1%, n = 101 each). In terms of classification for special education services and supports, our sample was composed primarily of students with high-incidence disabilities. The majority of students were classified as students with specific learning disabilities (SLD; 59.1%, n = 325), followed by students with other health impairments (OHI; 21.5%, n = 118), students with speech and language impairments (SLI; 11.5%, n = 63), and students with EBD (4.2%, n = 23). A small number of students with a variety of other special education classifications (e.g., mental retardation, orthopedic impairments, and autism) were included in a catchall category we called “other” (3.8%, n = 21).
Demographic Information on Participating Students With Disabilities.

Note. N = 559.
As information on ethnicity and socioeconomic status is not typically recorded on individual students as part of the special education record keeping, information on ethnicity and socioeconomic status was taken instead from the district’s State Report Card. Approximately 4% of students within the district were identified as American Indian, Alaskan, Asian, or Pacific Islander; 1.1% were identified as African American; 2.8% were identified as Hispanic; and 92.1% were identified as White. As an indication of parent or family socioeconomic status, approximately 6% of the student population qualified for reduced-price lunch and 1% qualified for free lunch (New York State Education Department, 2005).
The pie chart in Figure 1 depicts the special education services and supports that the 559 secondary students in our sample were receiving. The largest group of students in our sample received resource room supports—classes taught by a special education teacher, limited to no more than five students (approximately 50%, n = 252). The second largest group was composed of students supported in cotaught classes—classes that according to the district exposed students to regents-level curriculum in a collaborative teaching setting (approximately 33%, n = 180). Of this group of cotaught students, approximately 85% were in cotaught classes for all four major content subjects (i.e., English, mathematics, science, and social studies). A third group of students received special education services through an alternate day support model—classes in which a special education teacher provided support and supplemental instruction to students on an alternate day schedule, emphasizing study skills (approximately 15%, n = 84). Last, the final group of students was described as receiving no direct supports (6.0%, n = 33). This smallest group was composed of students with disabilities who were receiving consultant teacher services, related services, and/or a variety of the accommodations and/or modifications within general education classes.
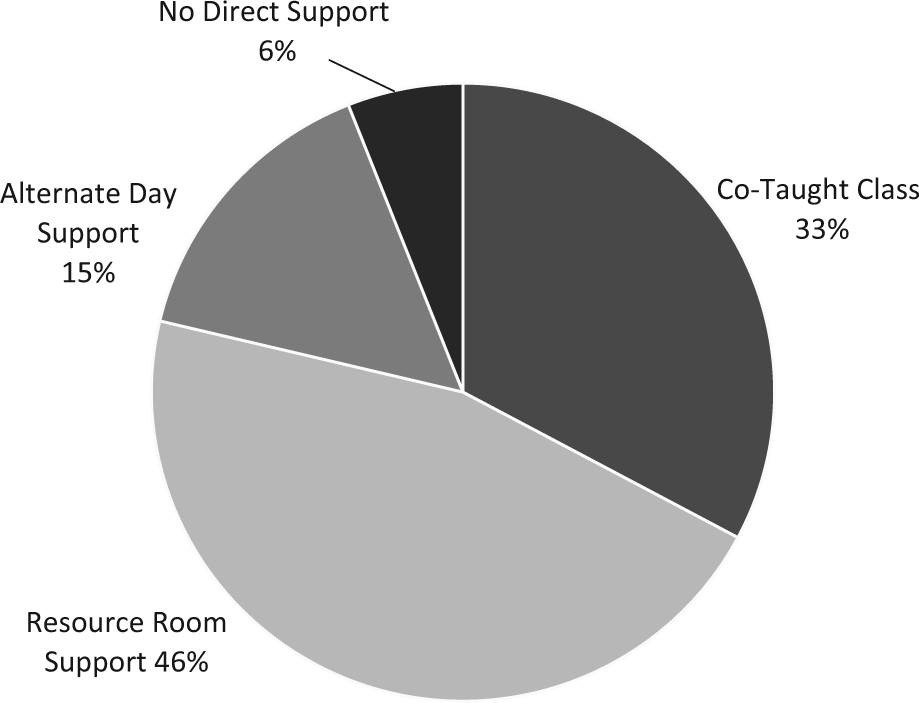
Percentages of secondary special education students assigned to each education placement option.
In terms of demographic information about the use of related services within our sample of secondary special education students, only two were used with any frequency. Approximately 22% of the students in the sample received speech services (n = 119) and approximately 11% of received counseling services (n = 58). Students in our sample were provided nine testing accommodations or modifications with any frequency (i.e., 20% or more). These testing accommodations or modifications included extended time for exams (96% of the sample, n = 538); testing with a flexible schedule or in an alternate location (79% of the sample, n = 443); having test directions explained, revised, rephrased, or restated (67% of the sample, n = 375); having a test directions read (54% of the sample, n = 303); ability to use a calculator for exams (37% of the sample, n = 206); ability to use a word processor for exams (30% of the sample, n = 170); having a reader for the exam (27% of the sample, n = 150); ability to record test answers directly on the test booklet rather than transferring answers to an answer sheet (22% of the sample, n = 123); and having spelling requirements waved (20% of the sample, n = 112).
Data Collection and Analysis
Data were gathered on the 559 secondary students with disabilities in our sample through electronic and paper-based file and document review including IEPs, report cards, and formal assessment reports. Two graduate-level research assistants entered study data, without student names or any other identifying personal information, into an SPSS Version 11.5 database. Percentages were calculated for all nominal-level variables connected with the five research questions. Associations or relations among nominal variables were analyzed using the chi-square test of independence, which is typically used to test an association between two categorical variables (Argyrous, 2005). Means and standard deviations were calculated for all interval-level variables connected with the five research questions. Differences between nominal and interval variables were analyzed using the one-way analysis of variance (ANOVA) test. All significant ANOVAs were followed up by post hoc analyses, using the Scheffe method. The Scheffe method was selected as the most conservative post hoc approach to minimize potential Type I errors (Argyrous, 2005).
Results
Relation Between Classification and Education Placement Option
The first research question focused on identifying potential relation or association between classification for special education and education placement option. Table 2 presents descriptive statistics on the types of students with disabilities served in each placement option (i.e., proportion of students with SLD, EBD, OHI, SLI, and other disabilities served in each placement option). Table 2 suggests that the proportion of types of disabilities was different across the placement options; however, in each placement option students with LD made up the largest disability group (approximately 58% of the cotaught class [n = 108], 63% of the resource room group [n = 155], 61% of the alternate day program students [n = 53], and 27% of the no direct support group [n = 9]).
Types of Disabilities Served in the Four Educational Placement Options.

Note. SLD, specific learning disabilities; EBD, emotional and behavioral disorder; OHI, other health impaired; SLI, speech and language impaired.
Figure 2 presents this information in pie chart format by category of disability (i.e., a separate pie chart for each disability category across placement options). This may actually be a more useful way of looking at these data as using the overall percentages of students assigned to each placement within disability category controls for the overall differences in numbers of students by category (i.e., the large number of students with LD in all placement options relative to the other disability categories). Figure 2 shows that the largest percentages of students with SLD (48%), EBD (48%), and OHI (51%) were served in resource rooms, whereas the largest percentages of students with SLI (44%) and in the other category (66%) were served in cotaught classes.

Percentages of students with disabilities by special education classification assigned to each education placement option.
Nonparametric statistical analysis was conducted to assess potential relation between classification and educational options. The chi-square test indicated that there was an association between students’ special education classifications and their education placement option (χ2 = 48.706, df = 12, p < .001).
Differences in Intellectual Ability and Placement Options
The second research question focused on identifying differences in overall intellectual ability as measured by full-scale IQ across education placement options. Table 3 presents the results of the ANOVA for IQ across special education placement options. Table 3 also presents intellectual ability means and standard deviations for each placement option and the results of the post hoc comparisons for IQ and education placement option.
Means, Standard Deviations, ANOVA, and Post Hoc Analyses for IQ by Education Placement Option.

p < .01. **p < .001.
On average, the highest IQ was noted for students who received no direct support (M = 101.8, SD = 16.77), followed by students in the alternate day support classes (M = 98.25, SD = 10.76). Students who received resource room support were next in terms of IQ (M = 96.84, SD = 10.59), followed by students in cotaught classes who tended to have the lowest full-scale IQ (M = 88.62, SD = 12.2). The ANOVA for IQ by placement option was statistically significant (F = 24.709, df = 3, 519, p < .001). Scheffe post hoc analyses indicate statistically significant differences (i.e., p < .001) between students in the cotaught class and those receiving resource room support (mean difference = −8.2133), students in the cotaught class and the alternate day support class (mean difference = −9.6343), and students in the cotaught classroom and students who received no direct services (mean difference = −13.1779).
Differences in Related Services, Testing Accommodations, and Placement Options
The third research question consisted of (a) two individual questions related to the provision of related services to students in our sample and (b) two individual questions related to the provision of testing accommodations or modifications to the students in our sample.
Provision of related services across placement options
The first question about the provision of related services focused on overall differences in number of related services provided to students by education placement option. The second question about related services focused on relations or associations in the types of related services provided to students and education placement option.
Table 4 presents the overall percentages of students who received related services in each placement option. The two most frequently provided related services for students across our sample were speech services and counseling services. Figures 3a and 3b graphically depict the percentage of students within each placement option receiving speech services (Figure 3a) and counseling services (Figure 3b). As shown in Figures 3a and 3b, more than a third of all students in cotaught classrooms were provided with speech services (39.3%), whereas only a tenth of students in resource room supports received speech (10.2%). In terms of counseling services, more than 25% of the secondary students in the no direct support option received counseling as a related service (26.5%), whereas less than 4% of students in alternate day support class received this service (3.6%).
Percentage of Students Who Receive Each Related Service by Educational Option.

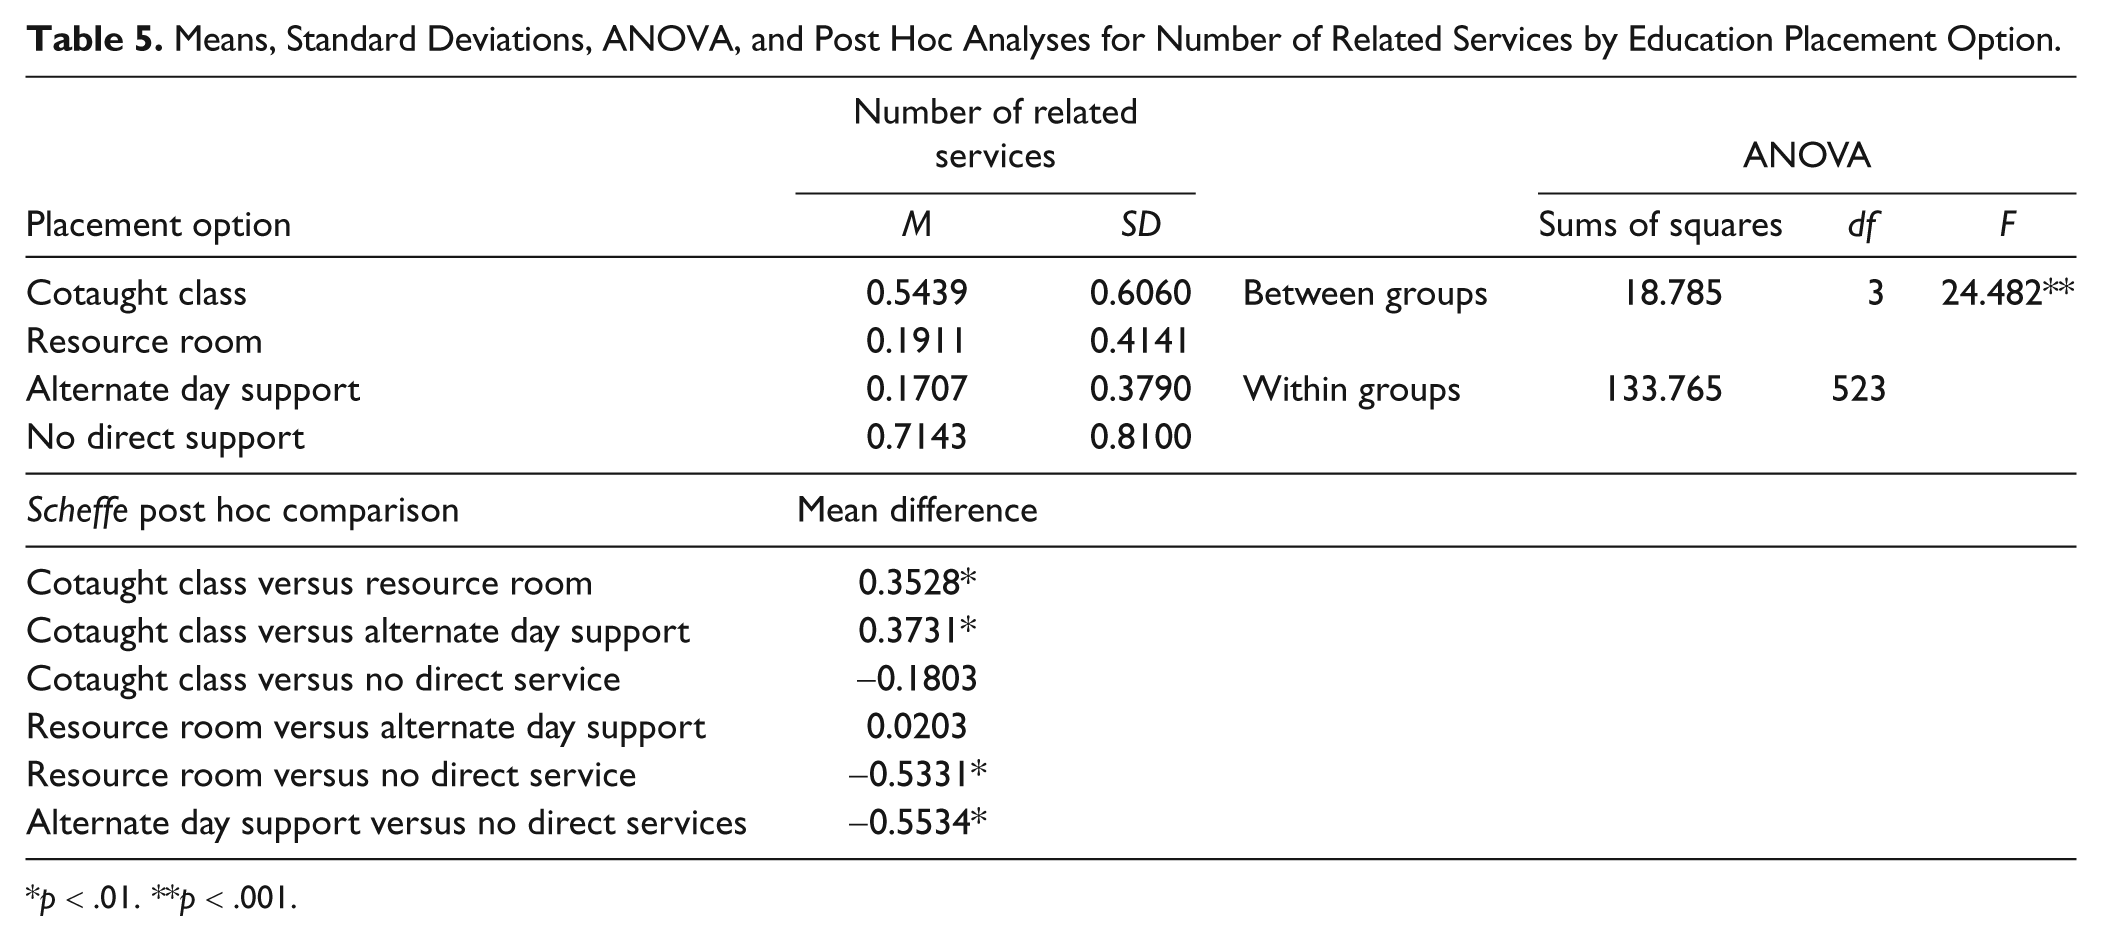
In answering the question about overall differences in the number of related services, Table 5 presents the results of the ANOVA comparison for total number of related services by education placement option. Table 5 also presents the means, standard deviations, and ANOVA and post hoc comparisons for each placement option. On average, students in the alternate day programs received the least related services (M = 0.17, SD = 0.38), whereas students who received no direct supports tended to receive the most related services (M = 0.71, SD = 0.81). The ANOVA indicates a statistically significant difference in the number of related services by placement option (F = 24.482, df = 3, 523, p < .001). Post hoc analyses indicate statistically significant differences (i.e., p < .01) between students in the cotaught class and those receiving resource room support (mean difference = 0.35), students in the cotaught class and the alternate day support class (mean difference = 0.37), students who received resource room support and students who received no direct services (mean difference = −0.53), and students receiving alternate day support and those receiving no direct services (mean difference = −0.55).
Means, Standard Deviations, ANOVA, and Post Hoc Analyses for Number of Related Services by Education Placement Option.
p < .01. **p < .001.
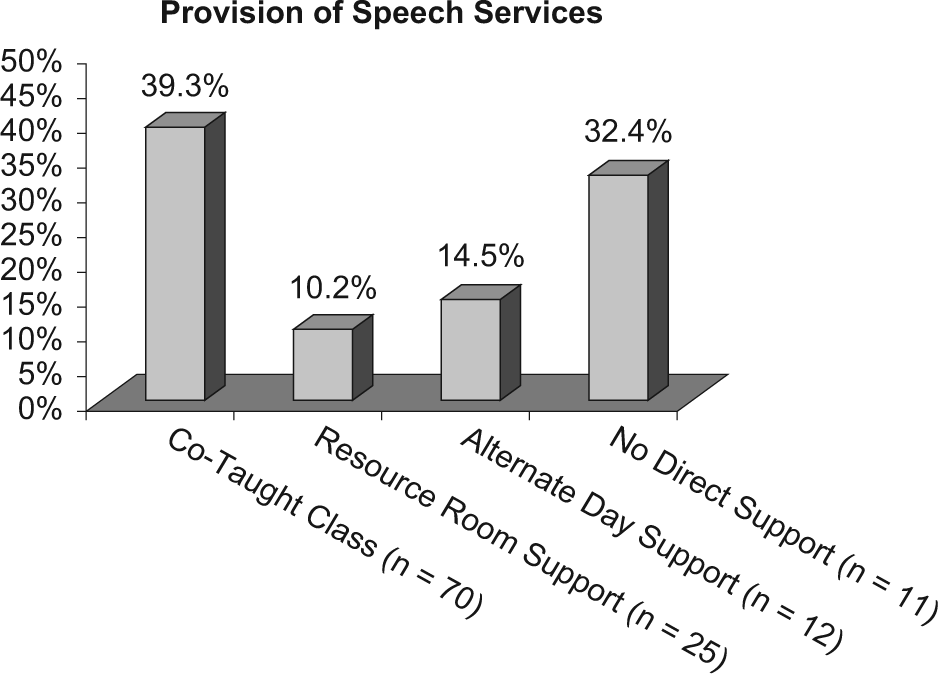
Percentages of students with disabilities who were receiving speech services by assigned education placement option.

Percentages of students with disabilities who were receiving counseling services by assigned education placement option.
To address the question regarding any association in the types of related services provided to students and education placement option, the chi-square test of independence was conducted for the two related services that were most frequently provided to the secondary students with disabilities in our sample—speech services (see Figure 3a) and counseling services (see Figure 3b). The chi-square test was statistically significant for both related service options (χ2 = 56.33, df = 3, p < .001 for speech services, χ2 = 14.25, df = 3, p < .01 for counseling services), indicating that there appears to be an association between both speech service and counseling service and a student’s special education classification.
Provision of testing accommodation across placement options
The two questions associated with the provision of testing accommodations or modifications were similar to the questions associated with related services. The first focused on differences in the total number of testing accommodations and modifications provided to students by placement option, and the second focused on associations in the types of testing accommodations and modifications and education placement option.
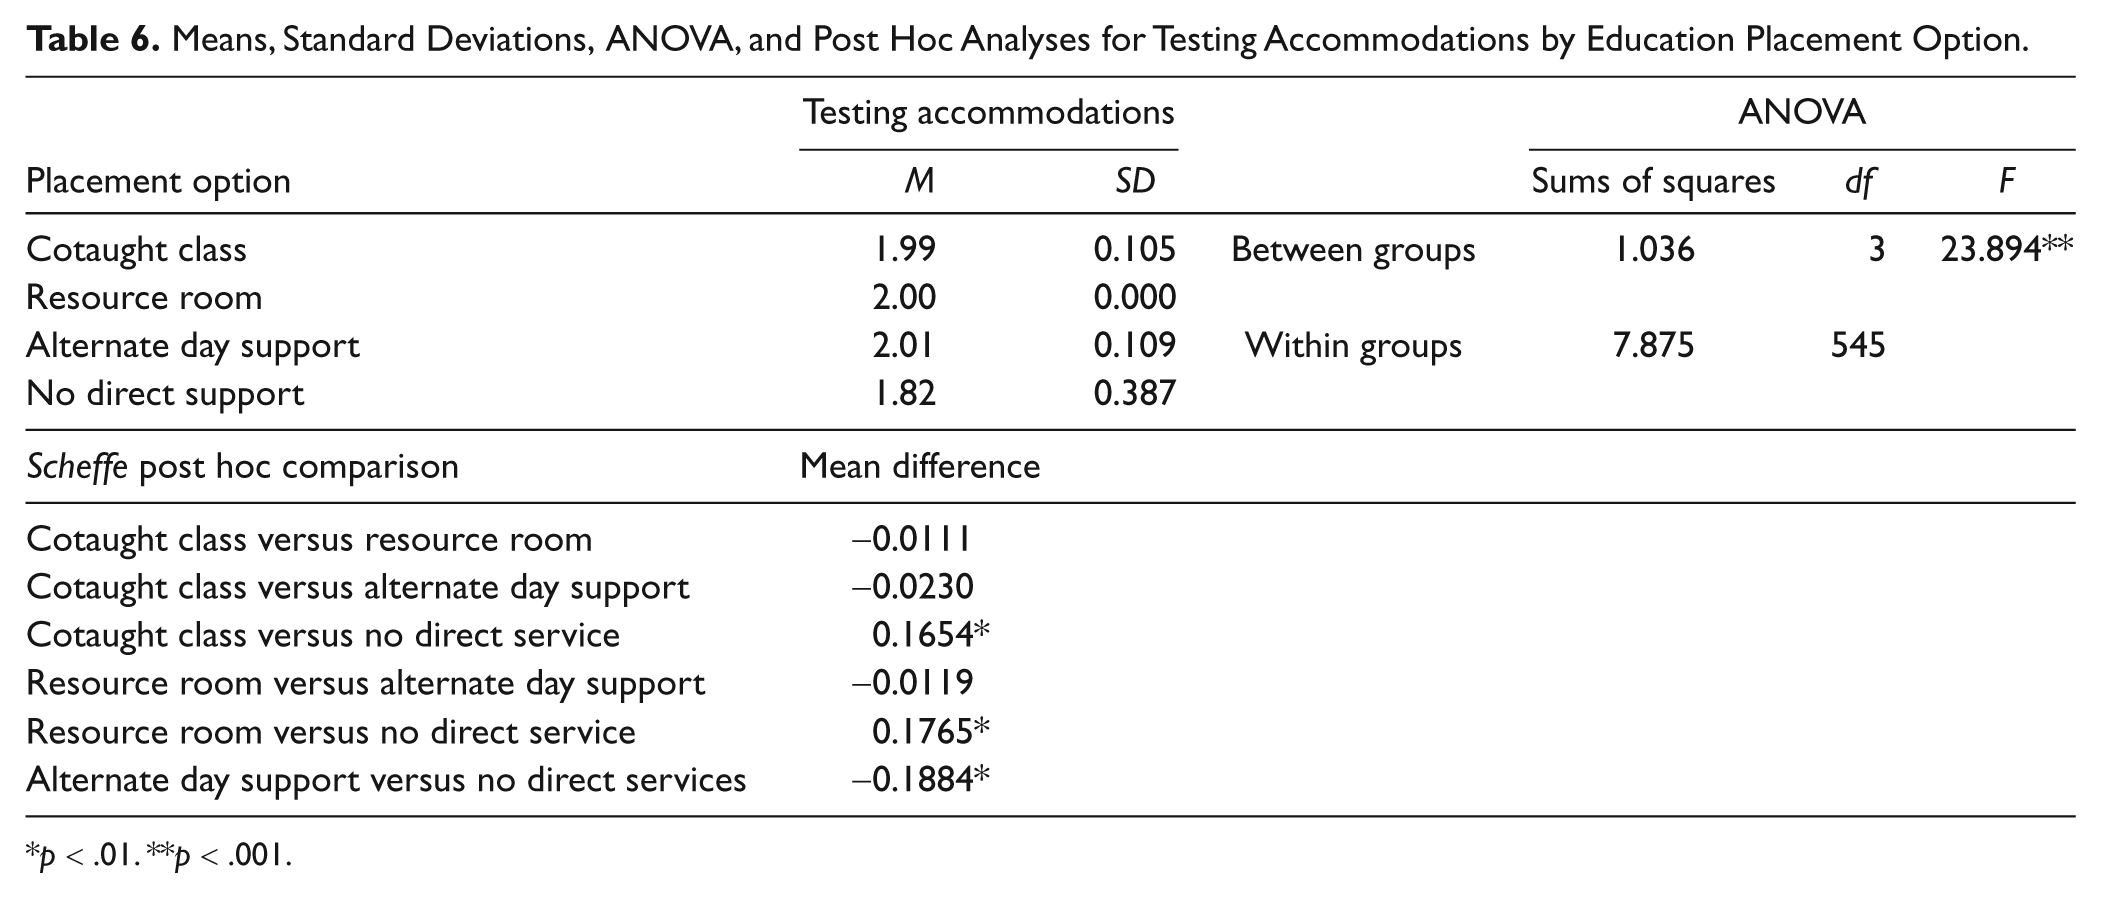
Table 6 presents the results of the ANOVA to answer the first question regarding the number of testing accommodations by placement option. Table 6 also presents the means, standard deviations, and post hoc comparisons for the number of testing accommodations for each placement option. On average, students receiving resource room supports were provided with the most testing accommodations (M = 2), whereas students in the no direct support option seemed to receive the fewest testing accommodations (M = 1.82). The ANOVA was statistically significant (F = 23.894, df = 3, 545, p < .001). Post hoc analyses indicate significant differences (i.e., p < .01) between students in the cotaught class and those receiving no direct services (mean difference = 0.17), students receiving resource room support and students receiving no direct services (mean difference = 0.18), and students receiving alternate day support and those receiving no direct services (mean difference = 0.19).
Means, Standard Deviations, ANOVA, and Post Hoc Analyses for Testing Accommodations by Education Placement Option.
p < .01. **p < .001.
The second question related to testing accommodations focused on associations between accommodations and placement options. The chi-square test of independence was conducted for the 13 most frequently provided accommodations or modification to students in our sample. Table 7 presents information about the percentage of students who received each testing modification or accommodation across placement options. Table 7 also highlights the eight chi-square tests of independence that were statistically significant (p < .01): the provision of extended time (χ2 = 56.81); testing in a flexible setting or location (χ2 = 13.21); having directions explained, revised, rephrased, or restated (χ2 = 16.60);having a reader provided for directions (χ2 = 22.06); ability to use of a calculator for exams (χ2 = 64.28); ability to use of a word processor for exams (χ2 = 11.73); provision of a reader for exams (χ2 = 57.55); and provision of a reader for nonreading tests (χ2 = 13.73).
Percentages of Students Who Receive Each Testing Modification or Accommodation by Educational Option.
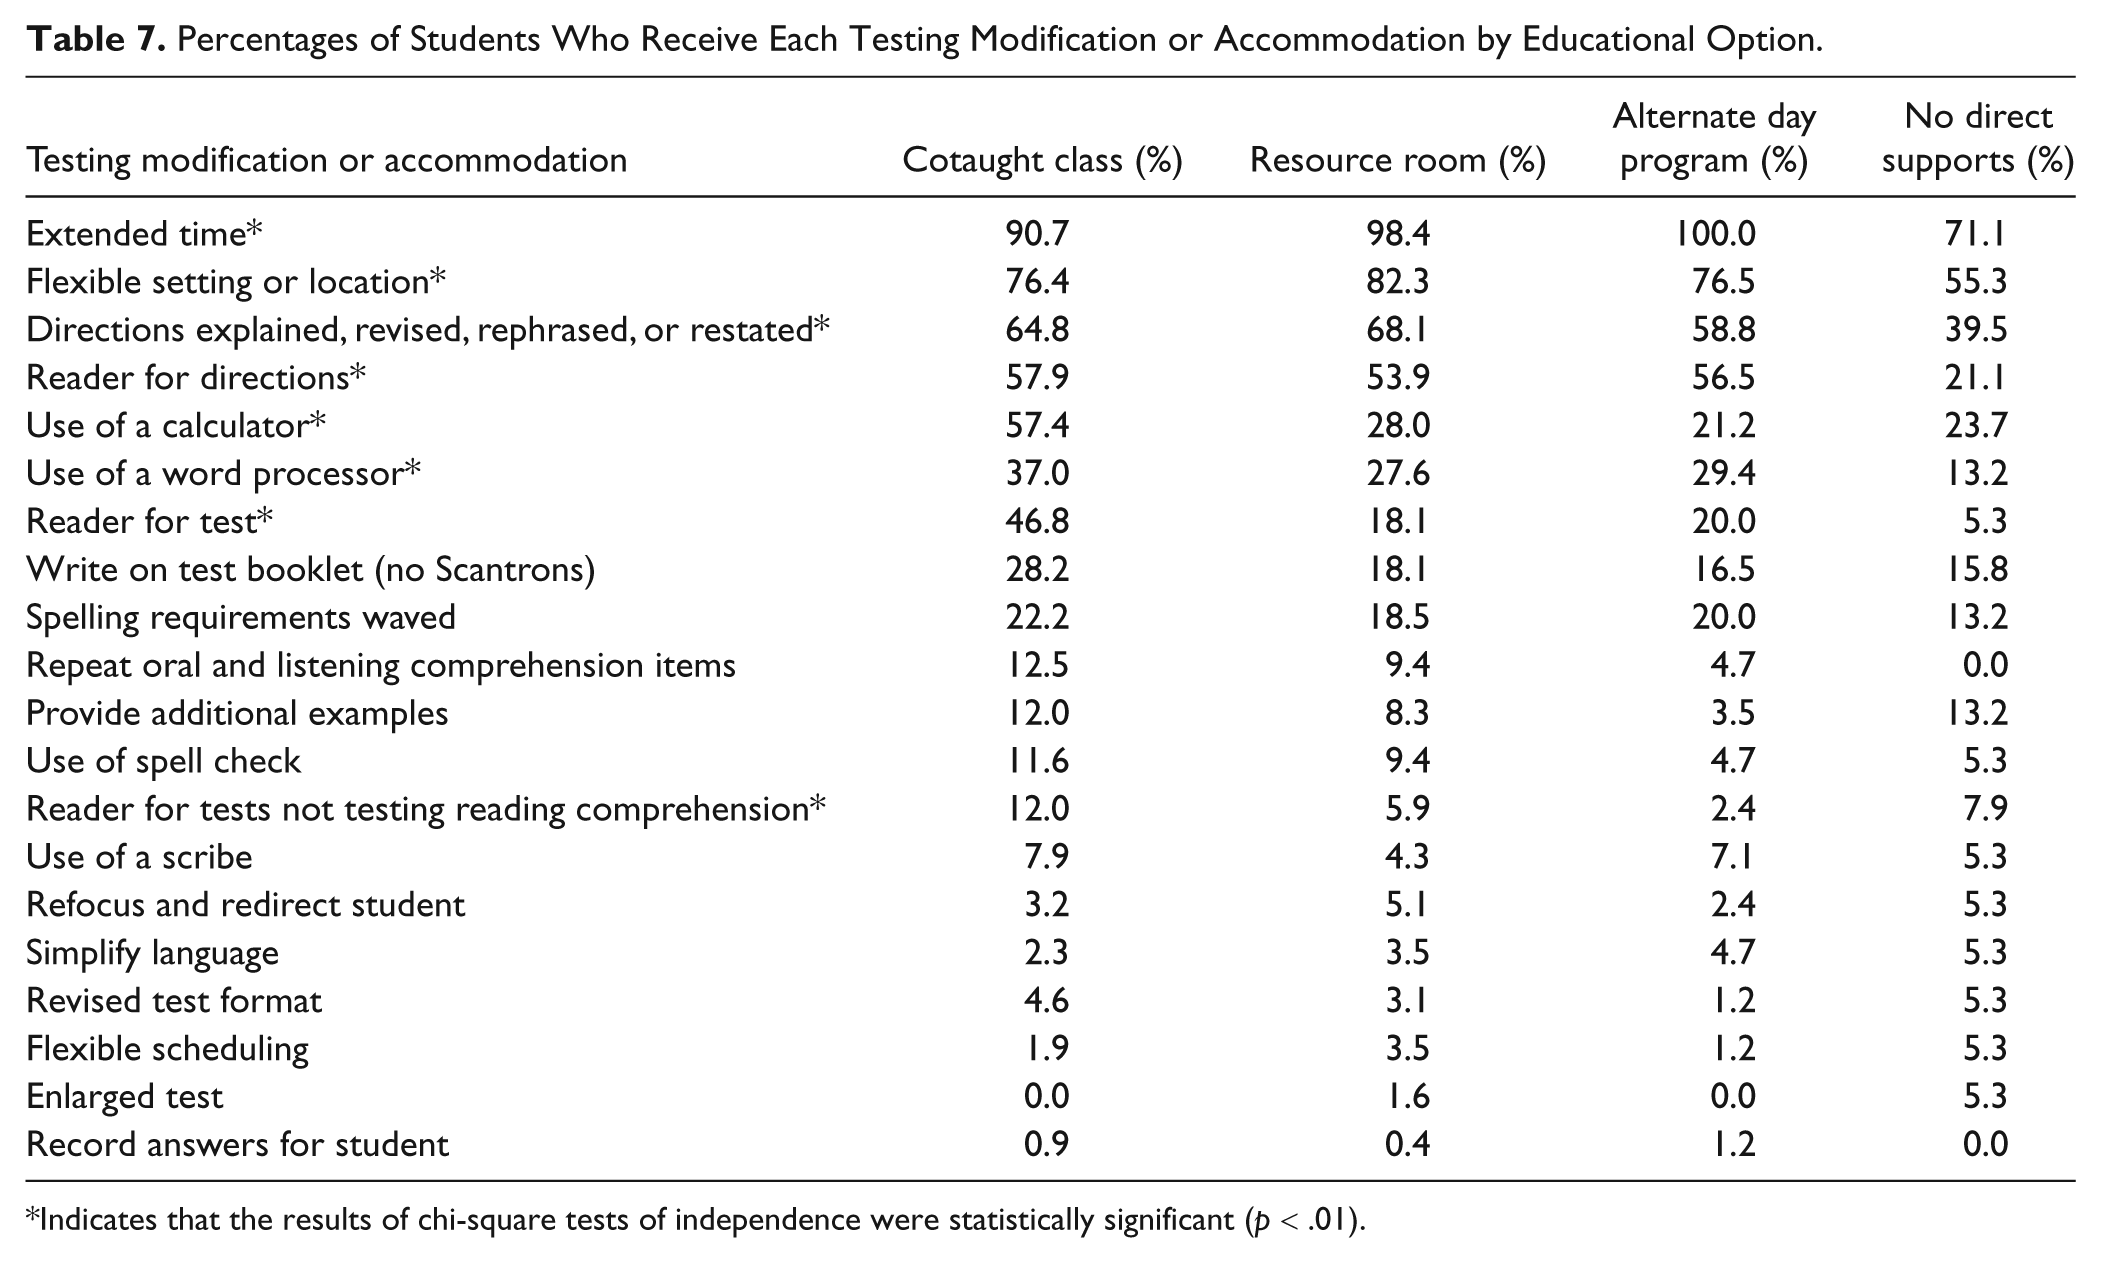
Indicates that the results of chi-square tests of independence were statistically significant (p < .01).
Differences in Content Area Performance and Placement Options
The final research question focused on identifying differences in how the secondary students with disabilities in our sample were doing in their content classes (i.e., English, math, science, and social studies) across education placement options. How students were doing was operationally defined as their report card grades. For this analysis, report card grades in core content subjects were average across the first three marking periods of the year for which data collection occurred.
Table 8 presents results of the ANOVAs conducted to answer this last question about academic performance across placement options. This table also presents the means, standard deviations, and post hoc analyses for academic performance in each content area by placement options. The ANOVA analyses indicate no significant differences in academic performance (i.e., grades) across education placement options in English, mathematics, and social studies. A statistically significant difference in academic performance was found for the ANOVA for science (F = 6.096, df = 3, 345, p < .001). Post hoc analyses for grades in science indicate only one statistically significant differences comparison (p < .01) for students in cotaught classes and students receiving alternate day support (mean difference = −7.85). Students in alternate day support performed better than students in cotaught classes.
Means, Standard Deviations, ANOVA, and Post Hoc Analyses for Grades by Education Placement Option.
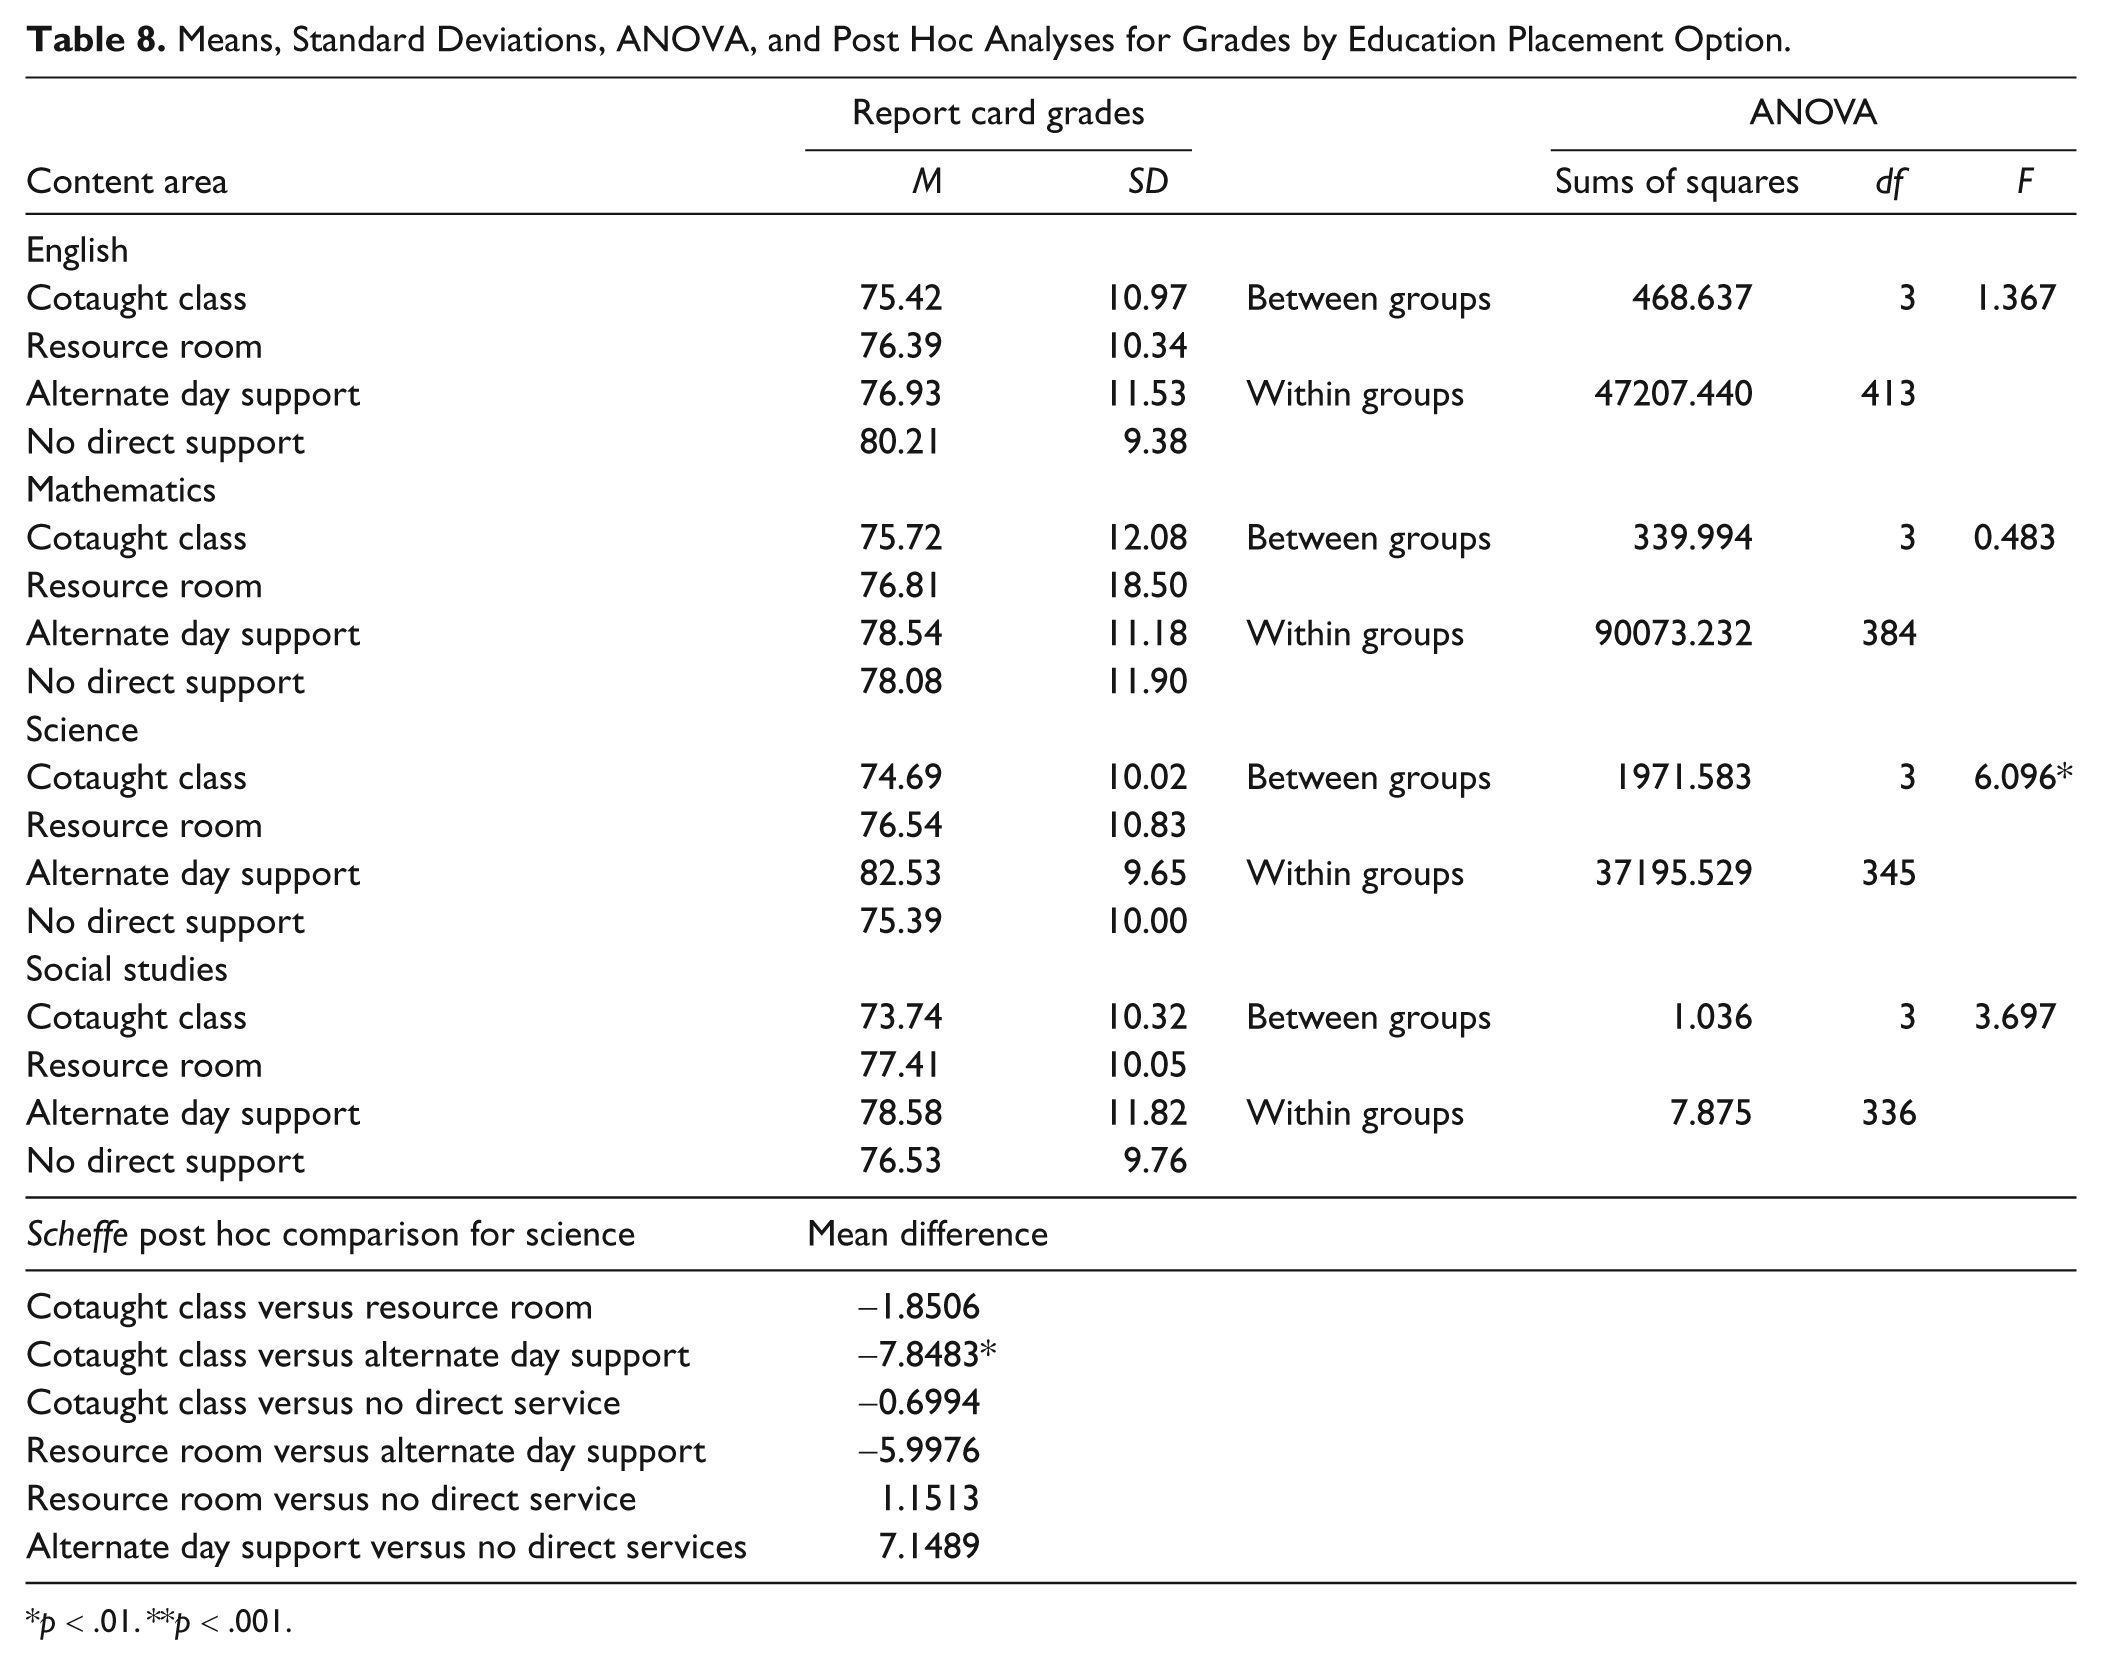
p < .01. **p < .001.
Findings by Placement Option
This final section of the results summarizes study findings across research questions by the four placement options to provide a more complete snapshot of the characteristics of students with disabilities in each secondary placement.
Characteristics of secondary students with disabilities in coteaching classes
The secondary students with disabilities in cotaught classes from our sample included students classified as students with SLD (58%), students with OHI (16%), students with SLI (15%), students who we combined into a category “other” (8%), and students classified with EBD (3%). The average full-scale IQ of students with disabilities in cotaught classes was approximately 89 (±12 points for 68% of this cotaught group). The two related services that students in the cotaught classes received with any frequency were speech services (42%) and counseling services (14%). The most frequent provided testing accommodation for students in cotaught classes (i.e., more than 50% of students received these accommodations) were extended time, a flexible setting or location for taking exams, having directions rephrased or restated, having a reader for exam directions, and being allowing to use a calculator for exams.
Characteristics of secondary students with disabilities in resource rooms
The secondary students with disabilities in resource rooms from our sample included students classified as students with SLD (63%), students with OHI (24%), students with SLI (7%), students classified with EBD (4%), and students in our other category (1%). The average full-scale IQ of students with disabilities in resource rooms was approximately 97 (±11 points for 68% of this group). For the two related services provided to students in our sample with any frequency, students with disabilities in resource rooms received speech services (10%) and counseling services (9%). The most frequently provided testing accommodations for students in resource rooms were providing extended time to take exams, providing a flexible testing setting or location for exams, allowing exam directions to be rephrased or restated, and allowing exam directions to be read to students.
Characteristics of secondary students with disabilities in alternate day supports
The secondary students with disabilities in the alternate day supports, which the participating district defined as classes in which a special education teacher provided support and supplemental instruction primarily focusing on study skills on an alternate day schedule, included students classified as students with SLD (61%), students with OHI (22%), students with SLI (11%), students classified with EBD (2%), and students in our other category (2%). The average full-scale IQ of students with disabilities in alternate day supports was approximately 98 (±11 points for 68% of this group). For the two related services provided to students in our sample with any frequency, students with disabilities in alternate day supports received speech services (16%) and counseling services (4%). The most frequently selected testing accommodation for students in alternate day supports included providing extended time for exams, providing a flexible testing setting or location, allowing for exam directions to be rephrased or restated, and allowing for test directions to be read out loud to students.
Characteristics of secondary students with disabilities in no direct supports
Last, the secondary students with disabilities in no direct supports, which the district described as students who were receiving consultant teacher services, related services, and/or a variety of accommodations or modifications in general education classes, included students classified as students with SLD (27%), students with OHI (27%), students with SLI (21%), students classified with EBD (15%), and students in our other category (9%). The average full-scale IQ of students with disabilities in no direct supports was approximately 102 (±17 points for 68% of this group). For the two related services provided to students in our sample with any frequency, students with disabilities in the no direct supports received speech services (34%) and counseling services (26%). For students in no direct supports, the most frequent test modifications included providing extended time for exams and providing a flexible setting or location for exams.
Discussion
The purpose of this study was to explore some of the factors that may be associated with how decisions are made about placing students with disabilities along the continuum of services and what ancillary services and instructional supports (i.e., related services and accommodations or modifications) are actually provided to these students to facilitate access to the general education curriculum (Bull & Reedy, 2007; Guardino, 2008; Yell & Katsiyannis, 2004). Specifically, the relations and differences among disability classification, IQ, and usage of related services and testing accommodations among secondary students with disabilities across educational placement options were evaluated. Differences in academic performances in the key content areas of English, mathematics, science, and social studies across educational placement options were also assessed. Educational placement options examined in this study included coteaching classes, resource rooms, alternate day support programs, and no direct support. Findings indicated that there were associations between disability classification and placement options; differences in full-scale IQ by placement option; differences in the numbers of related services and the number of testing accommodations students receive based on placement option; associations among placement option and both related services and testing accommodations; and basically no differences in student performances in English, mathematics, and social studies by placement option. These findings are consistent with previous research reporting that class placement for students with disabilities is not correlated with academic achievement (e.g., Fore et al., 2008).
Although the literature is filled with the “how-tos” and “where-tos” of education of students with disabilities (Zigmond, 2003), emphasis on how students are responding must actually drive practices (Vaughn, Bos, & Schumm, 2011). In other words, empirical data on students’ responses to various placement options are essential to any attempts to verify effective special education practices. This study then represents an initial step in gathering these data for secondary-level students with disabilities.
Statistically significant differences were found in terms of full-scale IQ and educational placement. Students in cotaught classes had lower full-scale IQs than students in resource room or alternate day support or those receiving no direct support. Our finding that classified students in the coteaching classes had statistically significant difference in IQ when compared to their classified peers in other placement options, while achieving academically as well, we believe is substantial. Given the fact that in spite of significant IQ differences and related services and testing accommodation or modification needs, there were virtually no differences in academic performance in key content subjects across settings or placement options (with the exception of science). We believe our findings, although exploratory in nature, support the viability of coteaching classes for students with disabilities in terms of academic performance in the general education curriculum. On the other hand, the grades earned by students with disabilities in cotaught classes need further investigation. It is possible that report card grades reflect the collaboration of coteachers and their increased understanding of students’ needs as well as students’ content mastery.
Although it was beyond the scope of this study, we believe that our findings may support the revised understanding of the field that special education is a service and not a place. It is important to explore the assumption that although reflecting a full-time placement in general education classrooms, coteaching classes are considered a more restrictive placement option than placement in resource room settings. Historically least restrictive environment referred to the level of segregation from typical peers and typical learning environments (Crockett, 1999–2000). From this historical perspective the cotaught class, which allows students with disabilities to interact with their peers without disabilities for 100% of the school day, while simultaneously focusing on the general education curriculum in the general education classroom, might seem like the least restrictive environment. However, based on the potential availability of a special education teacher in these inclusive environments, cotaught classes are viewed as more restrictive. Our findings indicate that many of the secondary students in our sample had access to supports from special education teachers for three to four periods a day.
In terms of related services, statistically significant differences were noted among the total number of related services provided across educational placements. Students in the cotaught classes received a greater number of related services than students in either resource room or alternate day supports. Students receiving resource room support and those who received alternate day support were provided with fewer related services than students who received no direct special education services.
Similarly, in terms of accommodations or modifications, statistically significant differences were noted among total number of accommodations or modifications provided across educational placements. Students in the cotaught classes on average received a greater number of accommodations or modifications than students receiving no direct services. Statistically significant associations were noted for educational placement options and the provision of accommodations or modifications for extended time; flexible setting or location; directions explained, revised, rephrased, or restated; reader provided for directions; use of a calculator; use of a word processor; provision of a reader for test; and provision of a reader for nonreading tests.
The fact that students in cotaught classes were provided with more related services and testing accommodations or modifications further supports the intensity of need for special education services and supports of secondary students with disabilities placed into cotaught classes and the notion that placement in cotaught classes reflects a higher intensity special education environment than other service delivery options.
Also, although it was beyond the scope of this study, our findings make us question the effectiveness of the resource room setting. One would expect students with seemingly fewer academic challenges to be performing better than their counterparts in coteaching settings; however, our data indicate that this was not the case. Resource room services have remained substantially unchanged for the past 35+ years, whereas expectations for students, curriculum demands (standards), and high-stakes testing have increased steadily (e.g., Bentum & Aaron, 2003).
Our research suggests that at least at the secondary level, coteaching settings are being selected as a placement option for supporting students who may have previously been served in self-contained classes, rather than students who were historically served in resource room settings. Longitudinal research efforts should continue to investigate who is actually served in both resource room and coteaching settings and how they are doing in those settings not only academically but also socially and emotionally (see Wiener & Tardif, 2004).
Several study limitations must be considered. The first relates to our sample. Although our sample size was sufficient for the analyses related to our research questions, the sample was drawn from only one secondary-level school district with two middle schools and three high schools representing four suburban or urban communities. Although there are commonalities across districts in implementation of coteaching, the external validity of our findings to other districts, especially to more diverse urban environments, may be limited. Further research related to student characteristics and student progress in both coteaching classes and resource room settings across districts is important, especially at the secondary level, given the national focus on increasing the percentage of both students who meet academic benchmarks (standards) and those who graduate.
In terms of academic achievement, we looked solely at course grades (i.e., report card grades) to determine how well the classified students in our study were doing. Although grades are perhaps the biggest indicator of academic success or failure, performance on high-stakes tests is extremely important given the current political climate, and in fact in some states poor performance on these exams can prevent graduation. This study did not look at student performance on these high-stakes exams. Future research should examine overall graduation rates by placement option, potential differences in the provision of transition services and supports, or students’ level of self-determination or differences in the achievement of meaningful postschool outcomes by placement option. Despite these limitations, our study contributes to the knowledge base on secondary students with disabilities and provides empirical data on who they are, where they are taught, and how they are doing in key content classes.
Footnotes
Declaration of Conflicting Interests
The author(s) declared no potential conflicts of interest with respect to the research, authorship, and/or publication of this article.
Funding
The author(s) received no financial support for the research, authorship, and/or publication of this article.