
Abstract
Disproportionate representation of racially diverse students in special education is a well-documented problem, yet few studies have systematically evaluated disproportionate representation of diverse students with autism. This study examined disproportionate representation of racially diverse students with autism by determining risk and logistical odds ratios among racially diverse and White students from the national population between 1998 and 2006. Although overall risk of autism increased for all racial groups every year, White students were twice as likely to be identified with autism as Hispanic and American Indian/Alaskan Native students during most years of the sample. Although initially overrepresented, the odds ratios for Asian/Pacific Islander and Black students with autism continuously declined in recent years. Hispanic and American Indian/Alaskan Native students were significantly underrepresented every year in the analysis. Potential cause and implications of underrepresentation are described, along with directions for research.
Disproportionate representation, the over- or underidentification of racially diverse students in special education eligibility categories, has long been a topic of research and discussion in special education (Donovan & Cross, 2002; Dunn, 1968; Kauffman, Hallahan, & Ford, 1998; Oswald & Coutinho, 2001; Trent & Artiles, 1995). Despite a long-standing focus among researchers and policy makers, contemporary data suggest that, on the whole, racially diverse students continue to be overrepresented in special education (Coutinho & Oswald, 2000; De Valenzuela, Copeland, Qi, & Park, 2006; Gravois & Rosenfield, 2006; Hosp & Reschly, 2003).
Most research on disproportionate representation has centered on overrepresentation in disability categories that are influenced by some degree of subjectivity (Waitoller, Artiles, & Cheney, 2010). Learning disability, emotional or behavioral disorder, and intellectual disability (ID) have been characterized as “soft” (Skiba et al., 2008), “judgmental” (Donovan & Cross, 2002), and “socially determined” (Coulter, 1996) disability categories. It has been suggested that overrepresentation in these categories is influenced by variations in disability definitions, regional population differences, socioeconomic factors, invalid assessment tools, individual and institutional bias, and cultural differences between educators and students (Artiles, Harry, Reschly, & Chinn, 2002; Skiba et al., 2008). Conversely, it is argued, “nonjudgmental” or “hard” disability categories (e.g., orthopedic impairment, hearing impairment, and autism spectrum disorder) are less influenced by social variables (Donovan & Cross, 2002; Skiba et al., 2008) and therefore less subject to disproportionate representation (Parish, 2002).
Autism spectrum disorder (autism) is a clinically defined disorder (American Psychiatric Association, 2000). The Individuals With Disabilities Education Improvement Act (IDEA; 2004) relies heavily on clinical criteria to define autism for special education eligibility, namely, deficits or delays in the acquisition and production of language and engagement in repetitive or stereotyped behaviors. Early theorists believed that autism primarily affected White children from middle- and upper-class backgrounds (Bettelheim, 1967; Kanner, 1949). Rimland (1964) and subsequent researchers dispelled this myth. Fombonne (2007), for example, examined international studies on prevalence, finding that race, ethnicity, or country of origin did not predict diagnosis of autism. Parish (2002) also found that, as a whole, the proportion of racially diverse students with hard disabilities, including autism, was minimally different from that of White students with hard disabilities, leaning toward slight overrepresentation. Parish suggested that factors mitigating disproportionate representation in soft categories (e.g., poverty) did not appear to influence the representation of racially diverse students in hard disability categories.
Given that autism is a clinically defined disorder that appears to be exempt from social variables traditionally associated with disproportionality, it seems likely that racially diverse students with autism should be proportionately represented in special education. Despite this logic, racial disparities in autism identification and diagnosis have been reported in the literature.
Mandell, Listerud, Levy, and Pinto-Martin (2002) examined 406 cases of children with autism receiving Medicaid services in Philadelphia and found that African American children required 3 times the number of visits over a period 3 times as long as White children before being diagnosed with an autism. They also found that African American children typically received autism diagnosis 1.5 years later than White children. Further evidence of disparity was found by Mandell et al. (2009). Their analysis of 2,568 eight-year-old children indicated that, as a whole, racially diverse students were less likely to be identified with autism than were White children. Mandell et al. concluded that racial disparities in diagnosis existed between White and racially diverse children with autism. Race related to timeliness and accuracy of identification, particularly in children with increased cognitive impairment.
Donovan and Cross (2002) used 1998 data sets from the Office of Civil Rights and the Office of Special Education Programs to measure disproportionate representation of racially diverse students in special education. Their analysis included the calculation of odds ratios (ORs) to examine the extent of disproportionality among racially diverse students in all special education eligibility categories. They found that Hispanic and American Indian/Alaskan Native students were underrepresented in autism (OR = 0.67 and 0.58, respectively) and that Asian/Pacific Islander students were overrepresented (OR = 1.17). Finally, they found that African American children were overrepresented in autism (OR = 1.21).
Using data from the 28th Report to Congress on IDEA, Tincani, Travers, and Boutot (2009) also examined the representation of students with autism in special education. The 2006–2007 demographic data on the number of students with autism in each racial category were compared with national enrollment demographic data obtained from the National Center for Education Statistics (NCES). Tincani et al. found that African American, American Indian/Alaskan Native, and Hispanic students were substantially underrepresented in autism in 2006–2007 (OR = 0.70, 0.49, and 0.47, respectively). They found Asian/Pacific Islander students were identified at proportionately similar levels as White students with autism (OR = 0.94).
Dyches, Wilder, Sudweeks, Obiakor, and Algozzine (2004) calculated percentage of students with autism according to race using data from both 1998–1999 and 1999–2000 school years. Overall, administrative prevalence was twice the median of epidemiological prevalence, but varied according to race. African American and Asian/Pacific Islander students were identified as having autism at twice the rate of White students. American Indian/Alaskan Native and Hispanic students were identified at about half the rate of White students.
More recently, Morrier and Hess (2010) used composition and risk indices to determine whether there were differences in 2007–2008 special education eligibility for autism according to race. They calculated composition differences, risk indices, and risk ratios for three age groups: (a) 3 to 5 years, (b) 6 to 21 years, and (c) 3 to 21 years. The risk ratios for the groups of students ages 3 to 21 years and 6 to 21 years indicated national underrepresentation of Hispanic students with autism, but no other disparities were found at the national level for other racial groups. Conversely, analysis of the national group ages 3 to 5 year indicated that American Indian/Alaskan Native students were the only underrepresented group and Asian/Pacific Islander students were the only overrepresented group. Morrier and Hess also found that regions of the country had differences in relative risk for certain racial groups, indicating the possibility that regional differences in diagnostic procedures and eligibility requirements may influence the decisions of eligibility teams, particularly when the student is from a racially diverse background.
Inconsistent findings in the limited reports regarding disproportionate representation of students with autism warrant further investigation to verify the extent to which racially diverse students are over- or underrepresented. In turn, this research could facilitate further studies on strategies to mitigate disproportionate representation through culturally responsive assessment and practice (Artiles & Bal, 2008; Gravois & Rosenfield, 2006). For example, response to intervention (RTI) is an evolving approach that seeks to reduce overrepresentation by providing culturally and linguistically diverse students with effective general education, early screenings, and targeted group interventions to prevent unnecessary placement in special education (Harris-Murri, King, & Rostenberg, 2006). If racially diverse students are overrepresented in autism, this finding would illustrate the need for similar strategies, including effective early education and accurate and unbiased assessments, to balance special education service delivery. Conversely, if racially diverse students are underrepresented because of limited access to quality health care and subsequent delays in identification (e.g., Mandell et al., 2009), this would underscore the need for improved early screening and detection practices targeting racially diverse groups.
The purpose of this study was to examine the degree of disproportionate representation of students with autism in special education by using measures of composition and risk as well as logistic regression analysis from a national population between 1998 and 2006. Specifically, the investigation sought to determine (a) the extent to which racially diverse students are over- or underrepresented in autism and (b) what, if any, changes in disproportionate representation have occurred between 1998 and 2006.
Method
Procedures
The reauthorization of IDEA (2004) maintained a provision that required states to analyze demographic data and address instances of disproportionate representation. States are mandated by IDEA to devise, implement, and revise policies to address disproportionality at state and local levels. The provision also requires the use of quantitative data analysis using research-based methods of analysis (20 U.S.C. 1412(a)(24)); however, specific methods for analysis are not stipulated in the law. Thus, states may use various methods, including those that may not provide useful data, to measure racial representation of students with disabilities in special education. Consequently, a task force was convened to develop and disseminate a technical assistance document to guide state education agencies in calculating and interpreting measures of disproportionate representation (Westat, 2004). The methods outlined in the technical assistance document included composition and risk indices. The present study used risk indices as one method for understanding racial representation in the autism eligibility category. However, composition indices were inappropriate for understanding differences in groups. Therefore, this study also used logistic regression to understand differences in odds of identification of autism between racial groups.
Data regarding special education eligibility due to autism were retrieved from the Annual Reports to Congress on the Implementation of IDEA (U.S. Department of Education, 2000; 2001a; 2001b; 2005a; 2005b; 2007; 2009) as well as IDEA data at the Department of Education website between the 1998–1999 and 2006–2007 school years. Enrollment figures according to race also were obtained from the NCES. Together, these data sets were used to calculate risk index (RI) and logistic ORs for each year. The demographic data from the Annual Reports and the Department of Education website represent students receiving special education ages 6 to 21 (16 years), whereas the NCES data represent students in Grades K to 12 (13 years). Because these two data sets represented two different ranges of count data, an adjustment to the IDEA data set was necessary to account for the differences in the data sets prior to conducting the analyses. Similar to Dyches et al. (2004), the number of students from the IDEA report was multiplied by 13 / 16 (.8125) prior to all calculations.
Risk Index
Risk Index (RI) is the percentage of all enrolled students from a racial group with a specific disability (e.g., the percentage of all African American students who have autism). The percentage of students in a racial group with a disability can be used for comparison with other racial groups to examine disproportionality. For example, Donovan and Cross (2002) obtained a RI of .08% for Hispanic students with autism versus .12% RI for White students with autism, indicating higher risk for White students when compared with Hispanic students. In this study, RI was calculated using the following formula: ([students with autism from a racial group × .8125] / [total student enrollment from racial group]) × 100% = RI. An overall RI was also calculated using the formula ([all students with autism × .8125] / [total student enrollment]) × 100% = overall RI.
Odds Ratios and Logistic Regression Analysis
An odds ratio (OR) is the proportion of the odds between two groups. Odds are calculated by dividing the probability of an occurrence of an event by the probability of the event not occurring. For example, to calculate the odds of autism in Black students, the probability that autism will occur in Black students is divided by the probability that autism will not occur in Black students. The obtained odds for a racial minority group is divided by the odds for White students (the dominant group) to obtain an OR. ORs for racially diverse students that are at or close to 1.00 represent proportionate representation to that of White students (i.e., a one-to-one ratio). Results lower than 1.00 indicate underrepresentation and results higher than 1.00 indicate overrepresentation. The meaning of a descriptive OR is idiosyncratic to each analysis and therefore inherently difficult to interpret. Therefore, the data were imported to SPSS to calculate logarithmic ORs for all years between 1998 and 2006. A 95% confidence interval was used to detect statistically significant differences of autism according to race. If the OR for a group, inclusive of the confidence intervals, did not overlap with 1.00 (i.e., the OR for White students), then the difference between the groups were statistically significant.
Logistic regression analysis was used to understand the relationship differences in prevalence of autism by race and changes in the prevalence by race over time. Year was a categorical model and was entered as a predictor. We used 1998 as the reference year because it was the first Year in the model, and we were interested in changes in time compared with 1998. Initially, a logistic regression model using race and year as predictors was used to understand whether the ORs for prevalence for each racial group changed over time. We also conducted a logistic regression analysis to determine whether there was an interaction between race and year. To understand the trends in the prevalence rates by year, we also conducted separate logistic regression analyses for each year because the population was different each year and because we were interested in understanding the ORs for each racial group for each of the 9 years. Changes in ORs for each racial group by year allowed us to understand trends in disproportionate representation over time. This approach allowed us to understand changes in ORs by year.
Results
Risk Indices
The results from the overall RI and the RI for each racial group from 1998 to 2006 are presented in Table 1. The overall RI for students with autism increased every year that was included in the analysis, indicating that, on the whole, students with autism were an increasing portion of the public school population. In 1998, the overall RI was .09%. By 2002, the overall RI more than doubled to .20%. The overall RI again nearly doubled to .37% in 2006. The RI for White students increased every year between 1998 (RI = .10%) and 2006 (RI = .45%), indicating increased risk of autism in White students.
Risk Index of Students With Autism According to Race From 1998 to 2006.
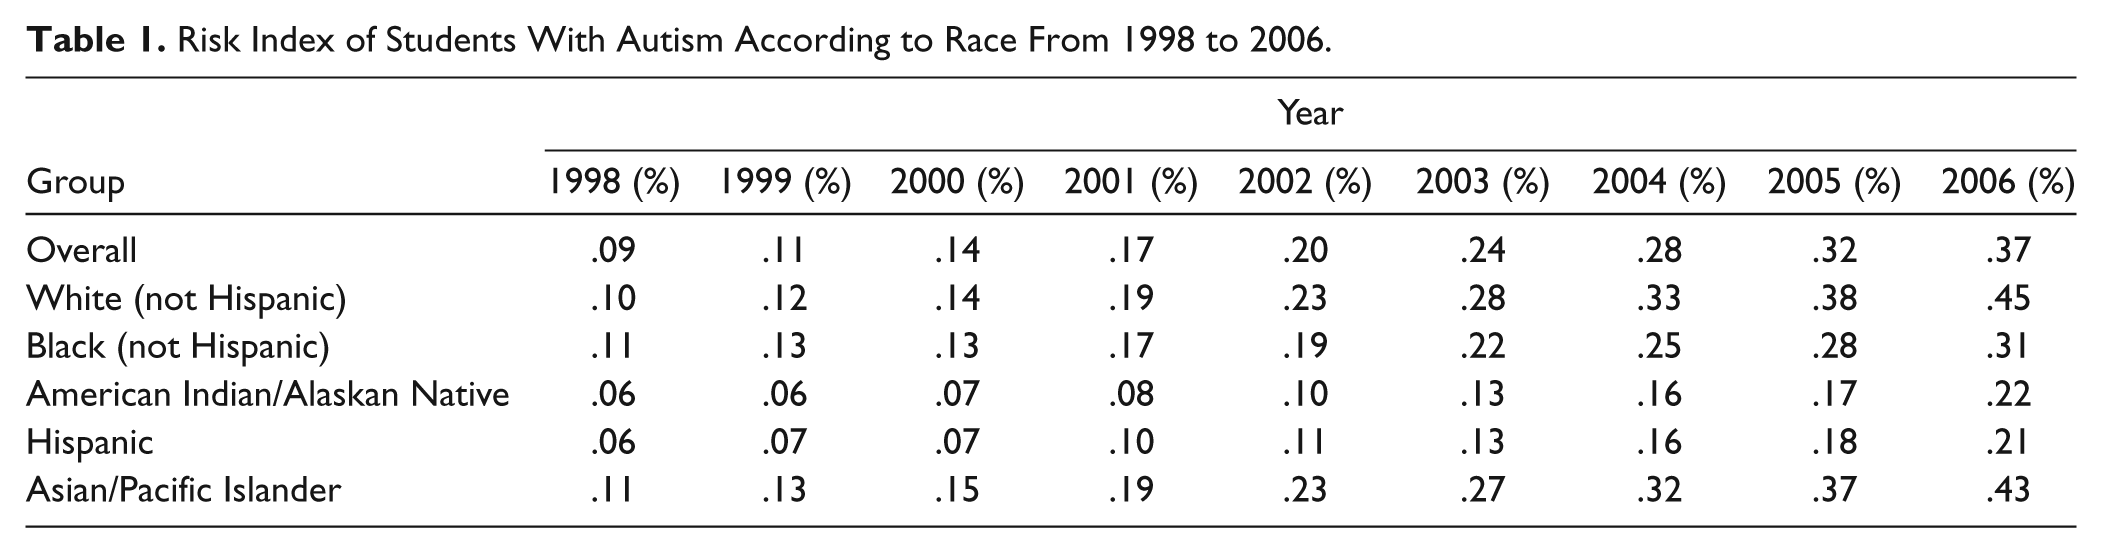
In 1998, Asian/Pacific Islander students and Black students had identical risk indices (RI = .11%) that were higher than the RI for Whites (RI = .10%). However, although the risk indices increased each year for all groups, the change was different for each racial group. By 2000, the RI for White (.14%) and Asian/Pacific Islander (.15%) students surpassed Black students (RI = .13%). The differences in RI increased between Black students and White and Asian students every year from 2000 to 2006.
Hispanic students and American Indian/Alaskan Native students had similar RI profiles. Although the RI for these groups increased every year, these two groups had the lowest RI for every year in the analysis. Also, these two groups experienced the smallest increases in RI for all 9 years. By 2006, the RI for these groups was nearly 3 times lower than the combined RI and was less than half the RI of White students (see Table 1).
Logistic Regression Analysis
Initially, we conducted a logistic regression model using race and year as predictors to understand whether the ORs for prevalence for each racial group changed over time. The overall model was significant, χ2(12) = 212,570, p < .001. The B coefficients were significant (p < .001) for each of the 9 years, ranging from 0.97 in 1999 to 3.35 in 2006. The B coefficients were significant for Black (0.82), Hispanic (0.5), and American Indian/Native Alaskan (0.47) students, with p < .001 for each group. The B coefficient for the Asian/Pacific Islander group (0.99) was not significant (p = .066).
We also conducted a logistic regression analysis to determine whether there was an interaction between race and year. We entered race, year, and the interaction of race and year into the model. The overall model was significant, χ2(44) = 216,300, p < .001. We found that the exponentiated B coefficients were significant for the Black (exp B = 1.2, p < .001), Hispanic (exp B = 0.66, p < .001), Asian/Pacific Islander (exp B = 1.16, p < .001), and American Indian/Native Alaskan (exp B = 0.58, p < .001) groups. The exponentiated B coefficients were significant for years 2000 to 2006 (p < .001), with exp B coefficients ranging from 0.17 in 2000 to 3.85 in 2006. The exponentiated B coefficients for the interaction of year by race were significant for the Black, Hispanic, and American Indian/Native Alaskan groups for every year. The exponentiated B coefficients for the interaction of race by year were significant for the Asian group for every year but 1999.
The overall model was significant at the p < .001 level for each of the 9 years. Figure 1 displays the ORs and the 95% confidence intervals for all racial groups from 1998 to 2006. The ORs are the exponentiated B coefficients from the logistic regression analysis. The OR for each racial group represents the ratio of the odds for that racial group to the odds for the White group.

Odds ratios with 95% confidence intervals for autism by race from 1998 to 2006.
Black group
The ORs for the Black group were significantly higher than 1.0 (p < .001) in 1998 and 1999, with small 95% confidence intervals. The OR for the Black group in 2000 (0.97) was significantly less than 1.0 (p = .009), but the OR was close to 1.0. The ORs for the Black students continuously decreased from 0.89 (p < .001) in 2001 to 0.7 (p < .001) in 2006. The ORs were significantly less than 1.0 (p < .001) in each of those years.
Hispanic group
The ORs for the Hispanic group were significantly less than 1.0 for each of the 9 years (p < .001). The OR for the Hispanic group was highest in 1998 (0.66) and lowest in 2005 (0.465) and 2006 (0.467).
American Indian/Native Alaskan group
The ORs for the American Indian/Native Alaskan group were also significantly less than 1.0 for each of the 9 years (p < .001). The OR for the American Indian/Native Alaskan group was highest in 1998 (0.58) and lowest in 2002 (0.43). The ORs for the American Indian/Native Alaskan group were below 0.5 for 8 of the 9 years.
Asian/Pacific Islander group
The ORs for the Asian/Pacific Islander group were significantly higher than 1.0 (p < .001) in 1998 and 2000, and significantly higher than 1.0 in 1999 (p = .003). The ORs for the Asian/Pacific Islander group were not different from 1.0 from 2001 until 2003. The OR for the Asian/Pacific Islander group was significantly less than 1.0 in 2004 (p = .013), although the 95% confidence interval was close to 1.0. The ORs for the Asian/Pacific Islander group were significantly less than 1.0 (p < .001) in 2005 (0.95) and 2006 (0.95), but the confidence intervals were close to 1.0 for both years (see Figure 1).
Discussion
This study examined the prevalence rates of students with autism in multiple ways. Contrary to previous conceptions about the insensitivity of hard disability categories to social variables (Donovan & Cross, 2002; Parish, 2002; Skiba et al., 2008), a main finding is that the representation of racially diverse students with autism revealed a considerably and statistically significant different profile in comparison with White students for years 1998 to 2006.
The risk indices indicated underrepresentation of diverse students with autism. Risk indices for all racial groups increased over the 9 years examined, but there were differences in the magnitude of the changes. White students became most at risk over the period with a RI of more than 4 times greater in 2006 than in 1998. Consequently, we found that the risk indices for Hispanic and American Indian/Pacific Islander students were less than the overall risk and consistently less than the risk indices for White students for each of the 9 years. The risk indices for Black students, which in 1998 and 1999 were initially higher than overall RI and White RI, were subsequently less than the overall RI and the RI for White students for most years, with the gap increasing over time.
The logistic regression analysis allowed us to understand the differences in the risk indices and compare the differences statistically. We found that race and year were significantly predictive of prevalence rates. The findings displayed in Figure 1 showed that there were significant differences in the prevalence rates by race and that there were changes in the prevalence over time.
When interpreted together, the RI and logistical regression indicate disproportionate representation of specific groups in the autism eligibility category and interesting differences in the trends of the prevalence rates over time. In 2006, White students were more likely to be eligible for special education due to autism than students from any other racial category, whereas Hispanic students and American Indian students were the least likely to be identified as having ASD. The changes in prevalence rates for Black students were unusual. They were overrepresented in 1998 and 1999 but significantly underrepresented in later years.
Two factors could account for the reported disproportionate representation of racially diverse students in the autism category. First, as an administrative category, students with autism may be subject to diagnostic substitution; that is, their educational classification may change from one category to another over time because of the differences in assessment practices. Diagnostic substitution has been identified as a possible reason for observed increases in the prevalence of autism during the last several decades, as children who were previously identified with other disabilities are now diagnosed with autism (Volkmar, Lord, Bailey, Schultz, & Klin, 2004). Investigators have recently reported that increases in administrative prevalence of autism accompanied decreases in administrative prevalence of ID, providing support for diagnostic substitution between autism and ID categories (Coo et al., 2008; Newschaffer, 2006; Shattuck, 2006). Given the historically disproportionate representation of racially diverse students in special education, particularly African American students in the ID category (Donovan & Cross, 2002), collectively these findings raise a possibility that some diverse students have been underrepresented because they have been identified as having an ID or other disability rather than autism.
A second potential reason for the underrepresentation of autism in Black, Hispanic, and American Indian/Alaskan Native students relates to the reported latency of autism diagnosis for African American children (Mandell et al., 2002) and to the generally lower reported clinical prevalence of autism among racially diverse students (Mandell et al., 2009). Children from racially and ethnically diverse families may be less likely to receive a timely clinical diagnosis of autism outside of the school setting and instead may rely on special education screening and assessment processes for autism identification. If so, this could delay the administrative identification and reported prevalence of autism among diverse students in public schools.
The findings in this study raise a possibility that racially diverse students are being identified with autism at later ages or are misidentified. Consequently, students are not receiving early intensive behavioral interventions during the critical time period in which they are likely to confer the greatest benefit. For example, emerging research examining autism eligibility of preschool students in five southern states found that child ethnicity predicted autism (Morrier & Gallagher, 2010).The educational implications of delayed or misidentification of autism among racially diverse students are worth considering. A substantial body of research indicates that early intensive behavioral interventions delivered to young children with autism can produce significant gains in language, adaptive behavior, and intellectual ability (Reichow & Wolery, 2009). Moreover, the educational strategies best suited for students with autism are not necessarily those applied to students with intellectual or other disabilities, thus resulting in poor congruence between educational programming and students’ disability-related characteristics.
An intriguing finding was the decline in identification in Black (not Hispanic) students between 1998 and 2006. In 1998 and 1999 Black students were significantly overrepresented, but in 2000 and every subsequent year they were significantly underrepresented. The data do not permit an analysis of why this trend is occurring. Increasing awareness of autism, broadening diagnostic criteria, and systematic screening and identification policies have been credited for recent increases in the reported prevalence of autism among the general population (Saracino, Noseworthy, Steiman, Reisinger, & Fombonne, 2010). If disparities in access to health care, screening, and disability identification existed between Black and White students as suggested by Mandell et al. (2002) and Mandell et al. (2009), and if Black students were less likely to benefit from increased awareness, broader diagnostic criteria, and systematic screening and identification policies, then this could translate into a decreasing shift in the proportion of Black students identified with autism, as evidenced in the current data set. The OR of the Asian/Pacific Islander group was very close to 1.0 and this suggests that disproportionality among the Asian students, in comparison with White students, is not meaningful.
The data have potential implications for culturally responsive professional training. For instance, in a national survey of school psychologists, Loe and Miranda (2005) found a high degree of ethnic incongruence between predominately White practitioners and the racially diverse populations they served. Most respondents reported that cultural diversity training could be improved by increased exposure to diverse populations. Given that school psychologists play a primary role in identification of students with autism, the current data suggest a need to improve training in the detection of autism among minority students, with specific attention to how referral and assessment factors differ based on cultural and linguistic diversity factors (Tincani et al., 2009). Similarly, the data underscore a need for improved teacher training in culturally responsive practices related to the classroom environment, family engagement, access to the general education curriculum, and instructional practices (Harmon, Kasa-Hendrickson, & Neal, 2009).
Finally, Parish (2002) and others have characterized autism as a hard disability category that lacks the subjectivity of so-called soft disabilities like learning disability, emotional disturbance, and ID. However, systematic variation in prevalence of autism according to race, as evidenced in the current data set and previous studies, suggests that cultural factors may influence administrative identification of autism. Therefore, autism may be more consistent with traditionally soft or subjective disability categories. This distinction may be useful when considering factors that contribute to disproportionate representation in autism.
Limitations
A major limitation of this study is the aggregated data reported in the IDEA Congressional Reports and the NCES data sets, which do not permit an analysis of variables that mediate disproportionate representation. Location, variations in demographic data collection by local education agencies, state variations of disability definitions, local assessment practices, access to health care and early screening services, and socioeconomic status are variables that could mediate the number of students from various racial groups identified with autism. The current data sets reveal only large-scale trends in identification according to race and, consequently, the possible reasons for underrepresentation of Black, Hispanic, and Native American/Alaskan Native students in the autism category (e.g., diagnostic substitution, delayed diagnosis and identification) are at best speculative. Furthermore, the unique policies, practices, demography, and so on may result in state-level profiles of autism that markedly differ from a national profile. The findings reported in this study will not likely correspond with findings of every state or local education agency. However, the national profile in this study illustrates the need for research that explores and compares racial profiles of autism between states as well as between school districts within states.
Related, the data do not show the number of racially diverse and White students identified with autism according to age. These data are essential to identifying patterns between disproportionate representation and age. For example, if Black, Hispanic, and American Indian/Alaskan Native students are identified with autism in later ages, one would expect to see a higher degree of disproportionate representation among students at younger ages. The current data do not permit these analyses.
Finally, data in the current study represent risk indices using administrative diagnosis of autism. Administrative diagnosis lacks the precision of clinical diagnoses, and differences in screening, assessment, and identification processes across schools, school districts, and states are very likely. The data should be interpreted with caution with this limitation in mind.
Future Research
Importantly, future research should focus on confirming underrepresentation of autism among racially diverse students and examining variables that moderate disproportionate representation. Researchers could evaluate patterns of identification by race at state and district levels, in relation to location (i.e., urban, suburban, or rural), socioeconomic status, increases or decreases in students served in other disability categories (e.g., ID), referral and assessment practices, screening and identification policies, and state definitions of eligibility. These data would enable researchers to pinpoint specific factors contributing to disproportionate representation and would provide essential information to guide policy intended to alleviate disproportionate representation in the autism eligibility category.
Although technical assistance has been disseminated to states to aid in identifying disproportionate representation, education agencies need scientifically validated interventions to address findings of disproportionate representation in autism (or any other disability). However, validated approaches have yet to be articulated in the literature. Research should explore interventions designed to address an array of problems (e.g., recent and significant underrepresentation vs. significant and chronic underrepresentation).
Another avenue of research should examine the relationships between race and educational placement of students with autism. Ensuring access to the general education environment is a core philosophy of special education. Understanding whether a relationship exists between disproportionate eligibility and disparate access to the general education environment is critical to refining special educational legislation and the development of policy. Although states are required to collect data regarding educational placement, the data are not readily available to researchers. If the data were easily obtained, then researchers and education agencies could examine whether racially diverse students experience access disparities. If placement disparity is found, contributing factors could be explored and may address larger issues of disproportionality in autism eligibility.
Footnotes
Declaration of Conflicting Interests
The author(s) declared no potential conflicts of interest with respect to the research, authorship, and/or publication of this article.
Funding
The author(s) received no financial support for the research, authorship, and/or publication of this article.