




Abstract
Although students with autism spectrum disorders (ASD) are least likely to attend and participate in transition planning meetings, little is known about factors related to their involvement. Using a national data set, we conducted regressions to identify predictors of the involvement of 320 youth with ASD. Attendance positively related to higher expressive language skills, greater time spent in general education, and more frequent discussions about postschool plans at home. Attendance negatively related to greater parent involvement at school. Active participation was shown by students who had higher self-advocacy skills, spent more time in general education, and more often discussed postschool plans at home. Active participants were also more likely to be younger and Caucasian. Implications for research and practice are discussed.
Since the initiation of transition planning for youth with disabilities, reauthorizations to the Individuals with Disabilities Education Act have emphasized the role of students in this process (Wagner, Newman, Cameto, Javitz, & Valdes, 2012). Currently, students must be invited to attend meetings in which transition goals are discussed. If students do not attend, the individualized education program (IEP) team is still required to consider the student’s interests and preferences in the development of transition services. These requirements reflect a desire to include the student voice in planning for life after high school. In addition, educators and researchers in the field of special education have recognized participation in transition planning as an authentic way for students to learn and practice self-determination skills (Test et al., 2004).
In recent years, student attendance at IEP and transition planning meetings has increased. Documenting this positive trend, Trach and Shelden (2000) analyzed the IEPs of two cohorts of students in their final years of high school (1991–1993 vs. 1996–1998). In the first cohort (n = 531), 53% attended their IEP meetings; in the second cohort (n = 253), 64% attended. More recently, a study of 393 IEP meetings for students in middle and high school reported a 70% attendance rate (Martin, Marshall, & Sale, 2004). Increasingly, then, more students are attending these meetings.
Although they may attend their planning meetings more often, students are not necessarily active participants. Martin et al. (2006) observed 109 middle and high school IEP meetings and surveyed the IEP team. In rating the students’ participation, 40.6% of special education teachers reported that students participated a lot. The study’s observational results, however, reported that students spoke only 3% of the time. Although the cause of this discrepancy is unclear, the authors suggest that teachers may have equated student attendance with participation. Other studies have similarly documented the frequent occurrence of students attending but not participating. In a survey of 523 educators involved in IEP meetings, 46% of students reportedly attended the meeting, but otherwise did not participate (Mason, Field, & Sawilowsky, 2004). Likewise, teacher reports from the National Longitudinal Transition Study–2 (NLTS2) reveal that 24.6% of students were present, but participated little (Cameto, Levine, & Wagner, 2004).
Despite the interest in student involvement in transition planning, only recently have studies examined predictors of meeting attendance and participation. Using data from the Special Education Elementary Longitudinal Study and NLTS2, Wagner et al. (2012) found that students with autism spectrum disorders (ASD) were the only group of students less likely to attend and to participate in transition planning meetings than students with learning disabilities (LD). Although both students with intellectual disability (ID) and students with ASD are likely to have limited participation, students with ASD are the least likely to attend meetings at all (Shogren & Plotner, 2012). Wagner et al. also found that participation is related to higher functional skills and social skills, that older students were more likely to attend meetings and to participate actively, and that Caucasian students (vs. African American and Hispanic students) were more likely to take an active role. Compared with those from lower income families, higher income students were less likely to actively participate in transition planning.
Various aspects of parent involvement and expectations were also related to student participation (Wagner et al., 2012). Students whose parents were actively involved with their education at home were more likely to both attend and to take an active role in transition planning; those whose parents were actively involved at school were more likely to participate actively. Students whose parents attended their transition planning meetings were also more likely to attend these meetings, and high parent expectations regarding postsecondary education were positively associated with both student attendance and participation.
Finally, two school experiences were associated with differential participation in transition planning (Wagner et al., 2012). First, students who spent more time in general education settings were more likely to attend and participate actively. Second, students who received instruction specifically focused on transition planning were also more likely to attend and participate actively. Thus, Wagner et al. (2012) have provided an overview of the characteristics that relate to involvement in transition planning among students with disabilities overall.
Building on this work and recognizing that youth with ASD face unique challenges, certain factors may specifically relate to their involvement. Because impairment in communication and social skills is a hallmark characteristic of ASD (Tager-Flusberg, Paul, & Lord, 2005), and because participation in transition planning typically involves engaging in social interaction and communication, it follows that students with ASD may find participation in transition planning to be a challenge. Thus, of all students with disabilities, students with ASD are the least likely to be involved in the transition planning process (Wagner et al., 2012).
Youth with ASD also experience challenges afterhigh school. Compared with youth with LD, ID, and speech-language impairments, youth with ASD are employed at the lowest rates (Shattuck et al., 2012), yet, few effective vocational interventions exist for these youth (Taylor et al., 2012). Youth with ASD also experience high rates of service disengagement after high school (Shattuck, Wagner, Narendorf, Sterzing, & Hensley, 2011); this transition—from receiving mandated, school-based services to receiving little from the adult service system—has far-reaching consequences. Whereas youth with ASD experienced improvements in maladaptive behaviors during high school, this improvement has been found to slow after exit (Taylor & Seltzer, 2010). Mirroring this trajectory, improvements in the mother–child relationship during high school were found to slow or stop after students with ASD exited high school (Taylor & Seltzer, 2011). This decline in behavioral improvement and in the mother–child relationship might be attributed in part to the unmet service needs of these youth and their families.
Taken together, these findings reveal that youth with ASD and their families face unique challenges in the transition out of high school. Thus, a closer examination of transition planning for this group is warranted (Shattuck et al., 2012). Compared with students with other disabilities, students with ASD as a group are the least likely to attend and actively participate in transition planning meetings (Shogren & Plotner, 2012; Wagner et al., 2012). Yet, we know little about why the majority of students with ASD are less involved, while some do take an active role in the planning process. In addition, because few intervention studies have included students with ASD, the literature provides little evidence regarding the effectiveness of interventions to promote participation in transition planning among these youth (Griffin, 2011).
To better understand the influences related to involvement among students with ASD, we posed the following question: “Of variables related to demographics, student characteristics, educational experiences, and parent involvement, which are related to differences in student involvement in transition planning?” Using NLTS2 data, the goal of this study was to identify the factors related to involvement in transition planning among students with ASD.
Method
NLTS2 Sample and Measures
NLTS2 is a longitudinal study of more than 11,000 transition-aged youth receiving special education services. Participants were selected in two stages. First, school districts were stratified based on geography, district size, and community wealth; then a random sample was selected. In all, more than 500 school districts and more than 30 special schools were recruited. Second, schools provided rosters of students receiving special education services. Stratified by primary disability category, a random sample was selected. Using multiple surveys, data were collected from youth, parents, and school staff in five waves. This study used data from the Parent Interview, School Characteristics Survey, School Program Survey, Teacher Survey, and Transcript Data.
Parent Interview
Parents were interviewed via telephone, using automated interviewing technology. Parents who could not be reached were mailed surveys (Cameto et al., 2004). Items in the Parent Interview are related to demographics and the student’s school experiences.
School Characteristics Survey
A school staff member completed the survey, which included items about community and school demographics, as well as school policies.
School Program Survey
The staff member most knowledgeable about the student completed the School Program Survey (Cameto et al., 2004). It included items about the students’ school program (e.g., special and vocational education classes, transition planning).
Teacher Survey
If a student took at least one general education class, the teacher of the student’s first general education class of the week responded to a survey about that class.
Transcript Data
Students’ most recent transcripts were requested of participating schools from 2002 to 2009; additional information (e.g., setting of courses) was also requested.
Sample Selection and Participant Characteristics
Sample selection for this study first focused on students with ASD for whom data were available on involvement in transition planning. Of the five waves of NLTS2 data, Wave 2 of the School Program Survey had data for the most youth with ASD. Of 560 students with ASD in Wave 2, data on role in transition planning were available for 480. The next phase of sample selection is related to whether data were available for two key predictor variables: whether the student received instruction related to transition planning at school, and how often the student talked about his or her postschool plans at home (see Figure 1). These items are theoretically important in that they relate to experiences students have at school or at home that prepare them to participate in planning for life after high school. For each participant, then, data were available on (a) the student’s role in transition planning, (b) whether the student received instruction in transition planning, and (c) how often the student discussed postschool plans at home.
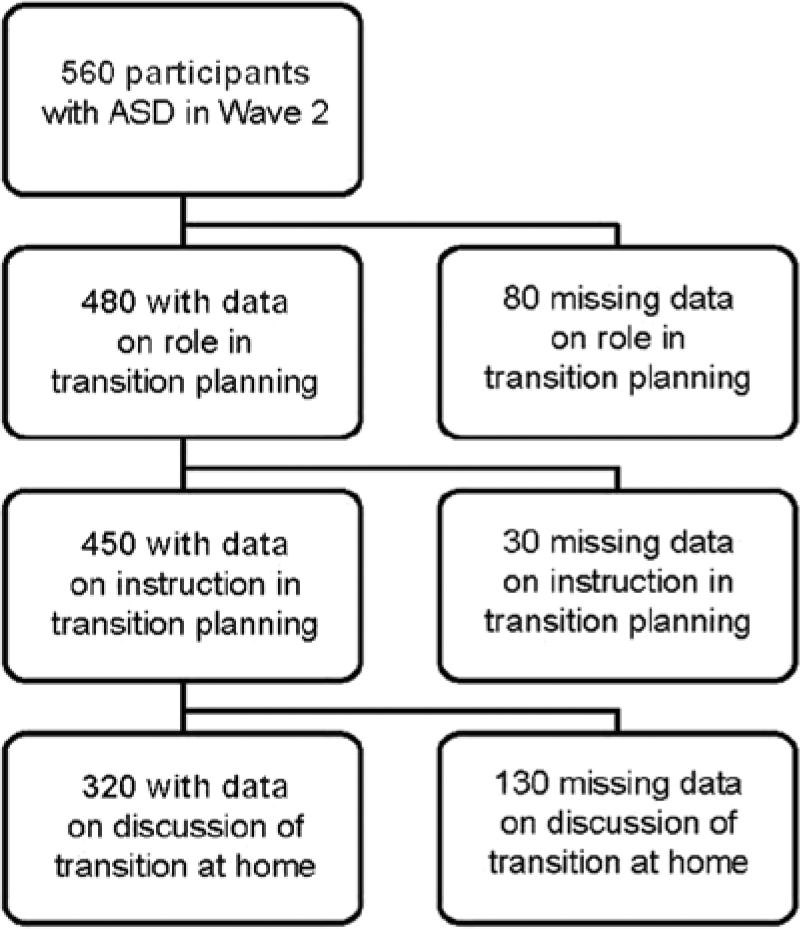
Participant selection flow.
The final sample included 320 high school students with ASD; 84.2% were male (n = 270) and 15.8% were female (n = 50). The sample was 66.5% Caucasian (n = 210), 16.8% African American (n = 50), 10.8% Hispanic (n = 30), 3.8% Asian/Pacific Islander (n = 10), and 2.2% Other (n = 10). Following NLTS2 guidelines, all frequencies are rounded to the nearest 10; therefore, numbers may not always sum to the sample size or correspond with percentages.
We calculated chi-squares to compare students included in the sample with those excluded due to missing data. The two groups differed in terms of ethnicity, income, ID diagnosis, functional skills, and time spent in general education. African American students were more likely to be excluded than Caucasian students, χ2(2, N = 560) = 13.92, p ≤ .001, and students from lower income families were more likely to be excluded than higher income students, χ2(2, N = 490) = 12.69, p = .002. Moreover, students with ID were more likely to be excluded, χ2(1, N = 450) = 4.20, p = .04, as were students with low functional skills, χ2(2, N = 430) = 9.08, p = .01, and those who spent less time in inclusive settings,χ2(2, N = 530) = 6.85, p = .03. However, the groups did not differ on the outcome or the 15 other predictor variables.
Outcome and Predictor Variables
Outcome variable
Teachers rated student involvement in transition planning as follows: the student (1) did not attend meetings or participate; (2) was present, but participated little/not at all; (3) was a moderate participant; and (4) took a leadership role. Because few students were rated a 4 (n = 20), the last two categories were combined for analyses.
Predictor variables
For all predictors, we used reverse scoring to ensure that higher scores denoted higher levels of a construct. Values were imputed with the mean score if only a single value was missing for 3- and 4-item scales, or if less than 4 values were missing for 11-item scales. If few respondents chose a given option, categories were combined for analyses.
Demographics
Demographic variables included gender, age, and ethnicity (Caucasian, African American, Other). Family demographics included main language spoken at home (English, Other), household income (≤US$25,000, US$25,001–US$50,000, >US$50,000), and parent education level (<high school, high school/general educational development [GED], some college, BA or higher degree). Finally, analyses included the nature of the school’s surrounding community (rural, suburban, urban).
Student characteristics
Students’ skills and behaviors (e.g., diagnosis of ID, functional skills) were also analyzed in relation to level of student involvement.
Diagnosis of ID: Participants were considered to have a comorbid ID if either the district or a parent indicated that the student was diagnosed with ID in Wave 1 or 2 of data collection.
Functional skills: On a 4-point scale (1 = not well, 4 = very well), parents rated their child’s ability to tell time on an analog clock, understand common signs, count change, and look up phone numbers/use a phone. Cronbach’s alpha equaled .85. Items were summed and scores of 4 to 8 were considered low, 9 to 14 were considered medium, and 15 to 16 were considered high.
Expressive and receptive communication: On a 4-point scale (1 = not well, 4 = very well), parents rated their child’s ability to communicate clearly (expressive communication) and to understand others (receptive communication).
General social skills: On a 3-point scale (0 = never, 2 = always), parents rated how often their child engaged in 11 behaviors (e.g., receives criticism well). Cronbach’s alpha equaled .69. Items were summed; scores 0 to 10 were considered low, 11 to 16 were considered medium, and 17 to 22 were considered high.
Classroom social skills: On a 4-point scale (1 = not well, 4 = very well), teachers rated students on getting along with peers, following directions, and controlling behavior. If applicable, they were rated in general, special, and vocational education classes; data from multiple settings were averaged. Overall, Cronbach’s alpha was .87. Cronbach’s alpha was .76, .77, and .78 for general, special, and vocational education classes, respectively. Items were summed; scores 3 to 7 were considered low, >7 to 9 were considered medium, and >9 to 12 were considered high.
Self-advocacy: On a 4-point scale (1 = not well, 4 = very well), teachers rated how well students ask for what they need across up to three settings: general, special, and vocational education classes. If students had scores in more than one setting, these were averaged.
Educational experiences
Students’ experiences at school (e.g., percentage of instruction received in general education settings) were also analyzed in relation to the outcome.
Percentage of instruction in general education: This value was determined by calculating the percentage of credits earned from courses in general education settings. Data were drawn from school transcripts; if unavailable, data from the School Program Survey were used (Wagner et al., 2012). Scores 0% to 33% were considered low, 34% to 66% were considered medium, and 67% to 100% were considered high.
History of suspension or expulsion: Based on parent report, a dichotomous variable indicated whether a student had ever been suspended or expelled.
Instruction in transition planning: Teachers responded to a dichotomous item regarding whether the student had received instruction in transition planning.
Parent involvement
Several aspects of parent involvement (e.g., involvement at their child’s school) were also analyzed in relation to student participation in transition planning.
School involvement: On a 5-point scale (0 = never, 4 = greater than 6 times), parents rated the frequency of their participation (e.g., at meetings, events; volunteering). Cronbach’s alpha equaled .63. Items were summed; scores of 0 to 2 was considered low, 3 to 5 was considered medium, and 6 to 12 was considered high.
Parent participation in transition planning: Teachers responded to a dichotomous item regarding whether students’ parents were active participants in transition planning meetings.
Discussion of transition at home: On a 4-point scale (1 = not at all, 4 = regularly), parents rated how often they discussed postschool plans with the student at home.
Data Analysis
As this study used data from a small subset of the larger NLTS2 sample, we did not use the NLTS2 sampling weights (see Carter, Austin, & Trainor, 2012). Thus, findings cannot be interpreted as representative of the national population of students receiving special education services. For variables missing data, values were imputed based on the most frequent category for categorical variables or the median for continuous variables (Harrell, 2001). This method is recommended for variables missing less than 5% of the sample, which describes all predictors except one: the student’s main language spoken at home. Because this variable was missing slightly above Harrell’s rough guideline (5.4%), the same method was used for imputation.
As it is unclear whether involvement in transition planning is an ordinal variable, we considered it to be nonordered and used nonparametric statistics throughout. First, chi-squares were calculated to describe relationships between the predictor and outcome variables. Because the last two categories of the outcome variable were combined, the following categories were used in calculating the chi-squares: the student (a) did not attend meetings or participate; (b) was present, but participated little/not at all; or (c) was a moderate participant or took a leadership role.Then, we calculated Spearman’s rho correlations to describe relationships among the predictors.
Similar to Wagner et al. (2012), attendance and participation were considered separately in logistic regression analyses. In Regression A, we compared students who were absent with those who were present (i.e., attended but participated little, participated moderately, or took leadership roles). In Regression B, we compared (a) students who were absent or present but participated little with (b) those who participated moderately or took leadership roles. All predictors were included in regression analyses; dummy coding was used for categorical variables.
Results
Overall, involvement in transition planning was low. Of the 320 students, 62.5% (n = 200) either did not attend meetings or were present but participated very little (see Table 1). However, the data reveal interesting disparities in relation to certain predictors. For example, 80.5% (n = 100) of the students who participated actively were Caucasian compared with just 8.5% (n = 10) who were African American. Similarly striking, 85.4% (n = 40) of students who were absent were those students who spent the least time in inclusive, general education settings.
Relationships Between Predictors and Student Involvement in Transition Planning.
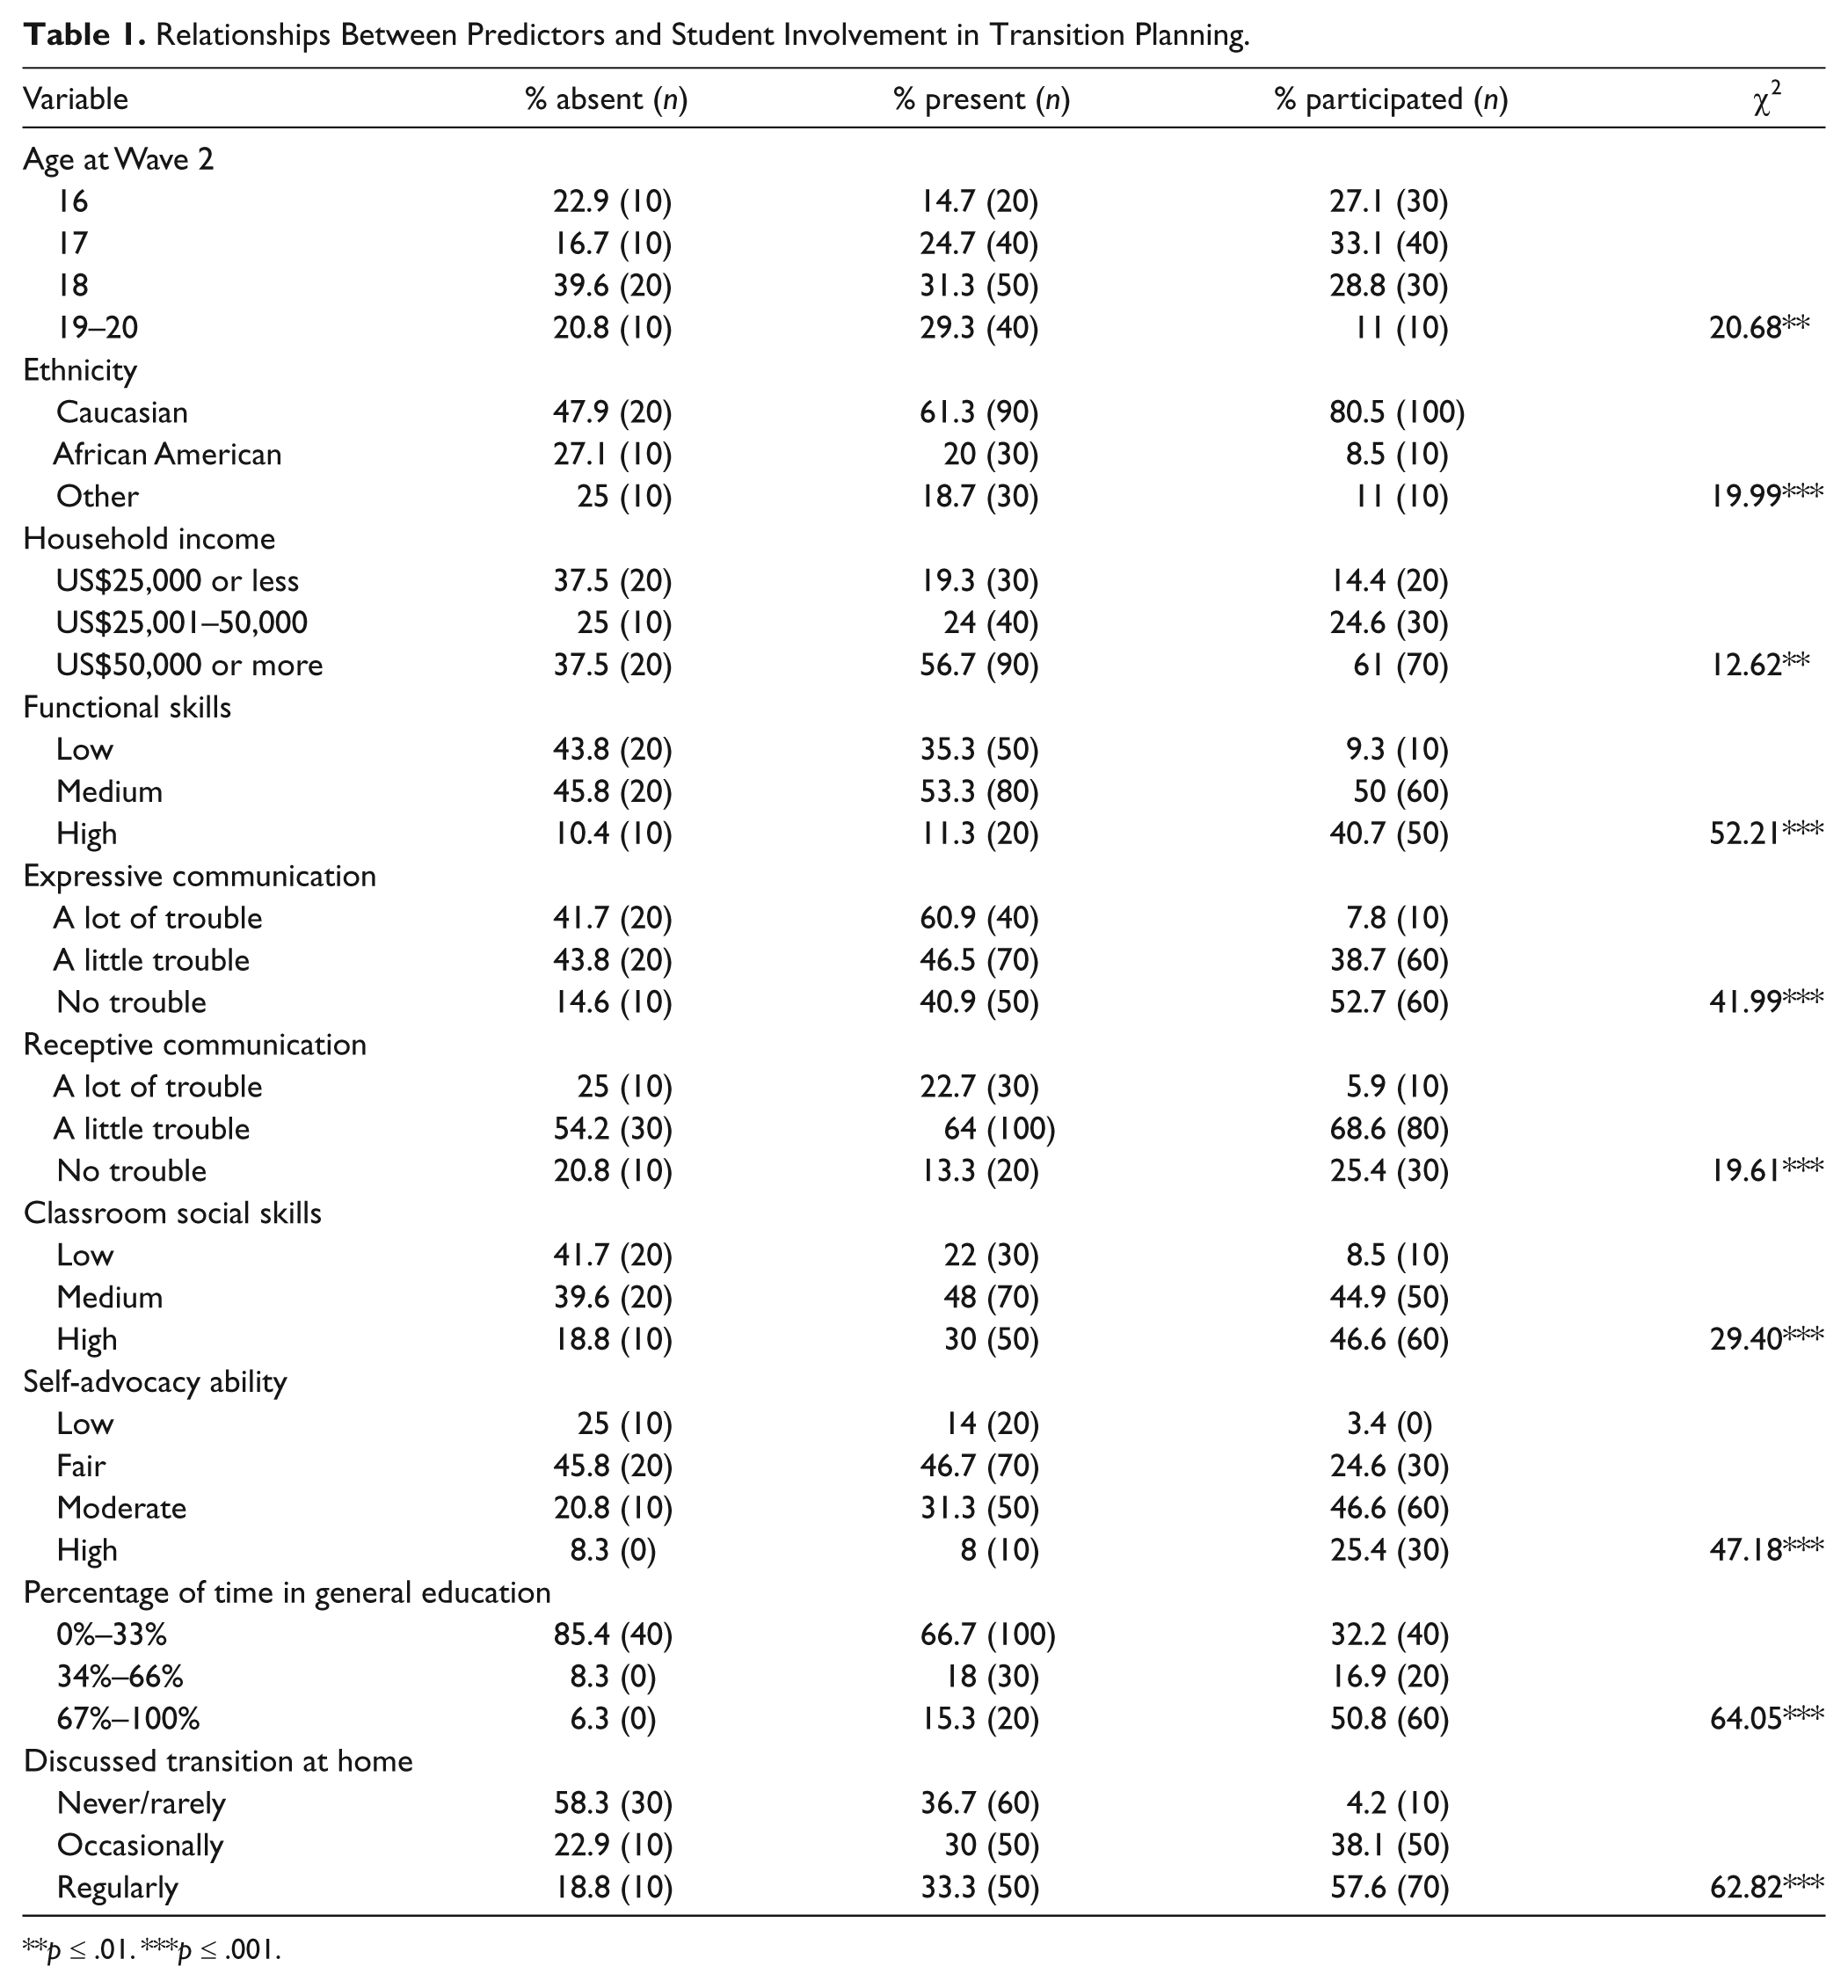
p ≤ .01. ***p ≤ .001.
Univariate Analyses
Chi-square statistics were calculated to describe relationships between predictor and outcome variables. For ease of presentation, results significant at the .01 or .001 levels are reported in Table 1; the only significant value that did not reach this level is related to general social skills,χ2(4, N = 320) = 11.39, p = .02. The highest chi-square values are related to the frequency of discussions about postschool plans at home and to percentage of time spent in general education. The more frequently students discussed their plans after high school with a parent, the more likely students were to be involved in transition planning meetings, χ2(6, N = 320) = 62.82, p ≤ .001. Likewise, students who spend more time in general education are more likely to have greater involvement, χ2(4, N = 320) = 64.05, p ≤ .001.
To describe relationships between predictors, Spearman’s rho correlations were calculated (see Table 2). For ease of presentation, we report only those with correlations of .30 or above. The highest correlation was between functional skills and time in general education, rs(320) = .62, p < .001. Prior to conducting the regressions, we examined collinearity statistics to determine whether any variables were so highly correlated that they should be excluded. Because none had a tolerance value less than .20, or a variance inflation factor greater than 2.5, multicollinearity was not indicated (Cohen, Cohen, West, & Aiken, 2003; Menard, 2002).
Spearman’s Rho Correlations Between Predictor Variables.
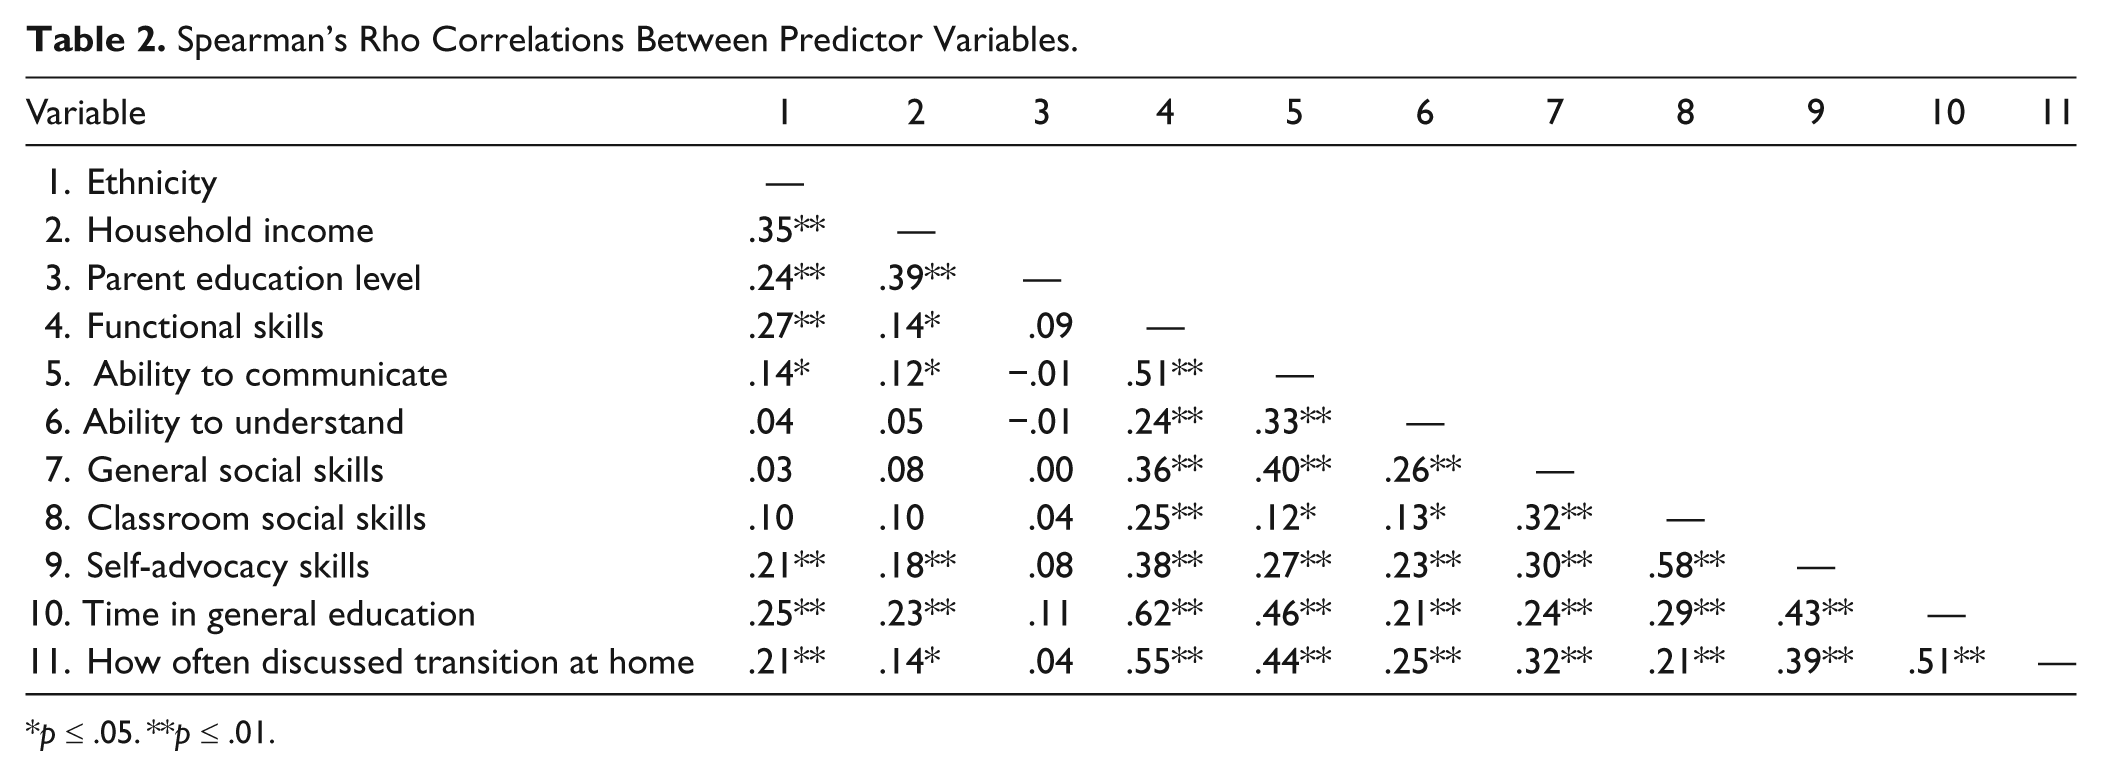
p ≤ .05. **p ≤ .01.
Regression Analyses
Logistic regression models with all predictor variables were fit separately to the binary outcomes—attendance and participation. Variables making a significant contribution to either analysis are reported in Table 3. Time spent in general education settings and how often postschool plans are discussed at home were significant predictors in both Regression A (student attendance at meeting) and Regression B (moderate student involvement or student leadership in meeting). Other variables uniquely predicted either student attendance or participation.
Predictors of Student Attendance and Participation in Transition Planning.
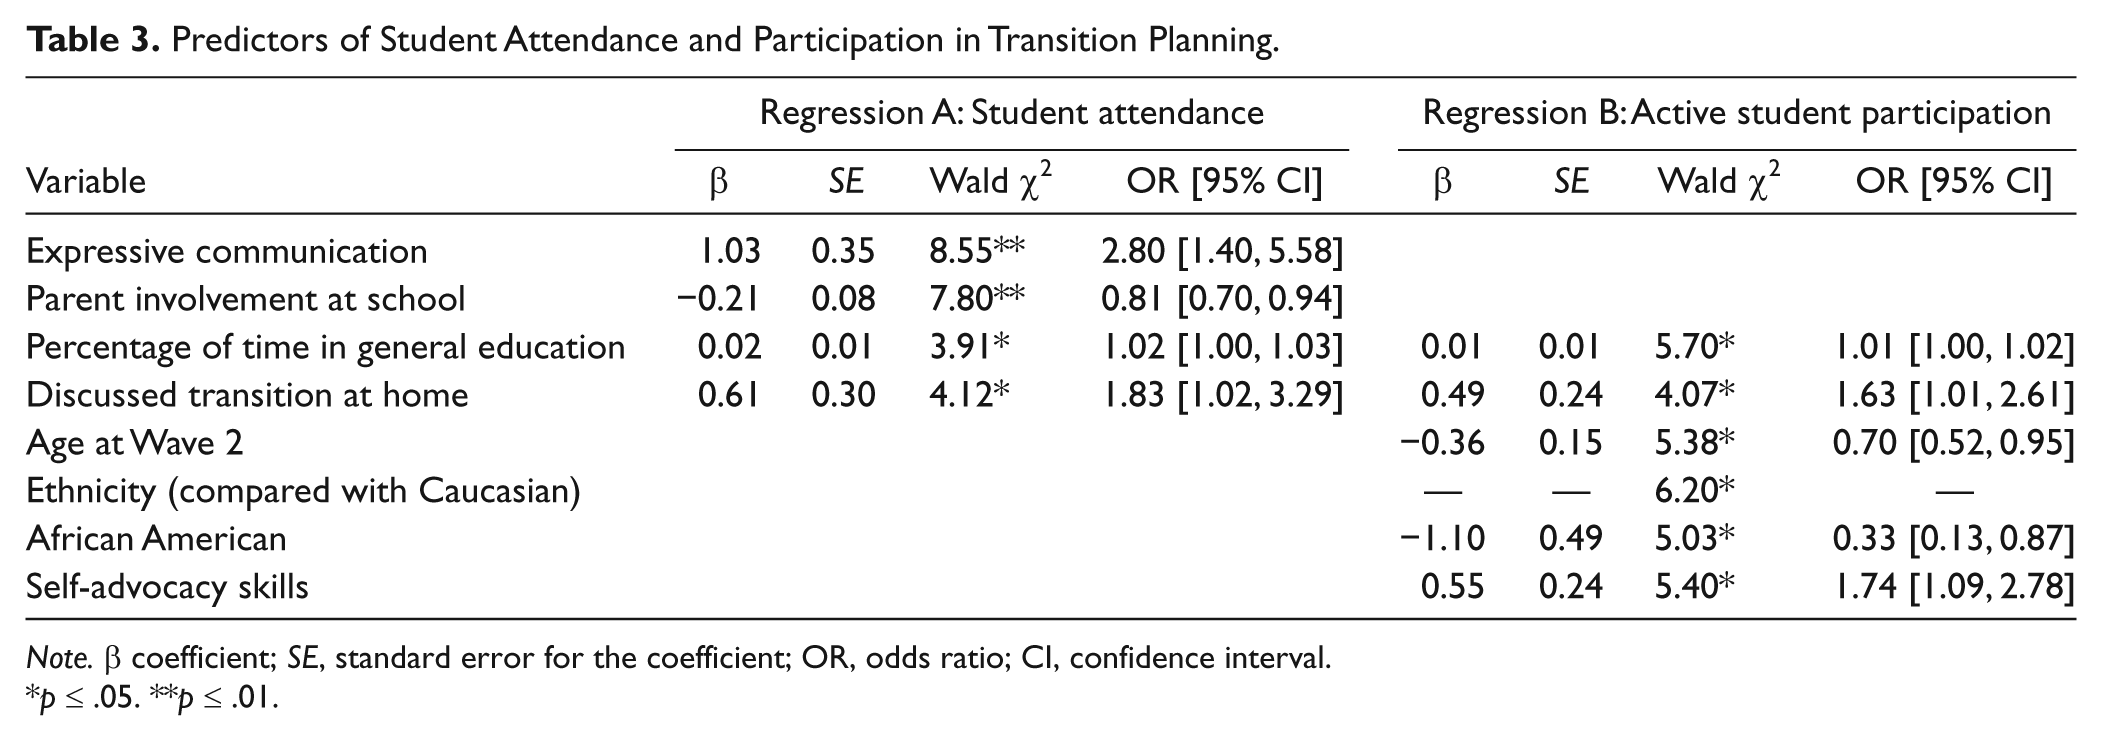
Note. β coefficient; SE, standard error for the coefficient; OR, odds ratio; CI, confidence interval.
p ≤ .05. **p ≤ .01.
Regression A showed that four variables predicted student attendance, χ2(22, N = 320) = 67.84, p < .001. These predictors included having higher expressive communication skills, spending a greater percentage of time in inclusive settings, having more frequent discussions about postschool plans at home, and having lower parental involvement at school. In Regression B, five variables significantly predicted student participation, χ2(22, N = 320) = 129.94, p < .001. African American (vs. Caucasian) students were less likely to actively participate in transition planning, as were older (vs. younger) students. Moreover, student participation was related to the students having higher self-advocacy skills, spending a greater percentage of time in general education, and engaging in more frequent discussions at home about postschool plans.
Discussion
By identifying the factors related to involvement in transition planning among students with ASD, this study provides insight into an important but neglected topic. A primary finding concerns the predictors of both attendance and participation. Similar to Wagner et al. (2012), the percentage of time spent in general education predicted both outcomes. Students who spent more time in general education settings were generally higher functioning (see Table 2) and likely had the skills needed to participate effectively in transition planning. In addition to students’ skills, teachers and parents may also perceive these students as more capable, thereby providing greater opportunities and encouragement to be involved than their peers who are not perceived this way.
Likewise, discussing transition-related issues at home was significant in both regressions. Wagner et al. (2012) similarly found that both student attendance and participation were positively related to greater parent involvement at home. This finding validates the importance of family involvement in developing self-determination among students with developmental disabilities (Field & Hoffman, 1999), and likely relates to two issues. First, parents who more often discuss life after high school with their children are more likely to provide opportunities and encouragement for these students to engage similarly in transition planning at school. Second, by engaging in conversations at home, students are likely more aware of the issues around transition, and likely benefit from practice in communicating their perspectives.
Our second main finding concerns those variables that predicted either attendance or participation, but not both. Expressive communication uniquely related to attendance. Although this connection is not readily apparent, it may be that the perceptions of teachers and parents are related to communication skills. Also uniquely related to attendance was parent involvement at school (e.g., frequency of attendance at meetings and events, and of volunteering at school).
Whereas attendance was positively related to frequent discussions at home about postschool plans, it was negatively related to greater parent participation at school. Although seemingly counterintuitive, the distinction between home- and school-based support has been noted before. Among typically developing youth, parent involvement at school is less desired and may be less effective (Hill & Tyson, 2009). In addition, some have suggested that students with disabilities who have overly involved parents might be less likely to advocate for themselves (Korbel, McGuire, Banerjee, & Saunders, 2011). Pejoratively referred to as “helicopter parents,” overly involved parents are thought to “hover” around their children, interjecting in situations in a way that inhibits the engagement of their children. Thus, an overly involved parent may inhibit the development of a child’s self-advocacy skills. However, as parent involvement was not significant in the univariate analyses, this interpretation must be made cautiously.
Several factors were solely predictive of participation, as well. Students with higher self-advocacy skills were more likely to participate than peers with lower skills. Similar to Wagner et al. (2012), Caucasian students were more likely to participate than African American students. Compared with older students, younger students were more likely to participate. Although divergent from the results of Wagner et al., this is likely attributable to differences in the samples; Wagner et al. included elementary students, whereas our study was restricted to high school students. In our sample, older students were lower functioning and less included in general education classes.
Our third main finding is that in analyses limited to students with ASD, some of the usual predictors were not found. Among students with disabilities overall, for instance, having received instruction in transition planning was a predictor of both attendance and active participation in transition planning meetings (Wagner et al., 2012). But among students with ASD, instruction in transition planning did not relate to differences in student involvement.
Implications for Research and Practice
In identifying variables related to involvement in transition planning, this study has implications for both research and practice. Notably, instruction in transition planning was not found to be an influential variable related to involvement among students with ASD. As suggested by Shogren and Plotner (2012), research on the nature of this instruction is needed. Future research could provide insight into the type of instruction provided to students by describing the length, frequency, focus, and mode of this instruction. Furthermore, research is needed on the effectiveness of such instruction. Findings might guide the adaptation and development of interventions to promote greater involvement among students with ASD.
We found that students who attended and participated in transition planning meetings were generally higher functioning (e.g., had higher communication and self-advocacy skills, were included more in general education). In addition to including students with ASD as participants, researchers should focus particularly on students who have lower communication and self-advocacy skills. In this vein, teachers and parents should ensure that lower functioning students are afforded the opportunities and supports needed to attend and participate in their own transition planning meetings.
Researchers and practitioners should also focus on encouraging involvement in transition planning among African American students. Echoing the results of Wagner et al. (2012), African American (vs. Caucasian) students were less likely to attend transition planning meetings. African American students with ASD also experience poor outcomes after school—lower rates of involvement in postsecondary education and employment, and a greater risk of receiving no services after high school (Shattuck et al., 2011; Shattuck et al., 2012). As a field, we need to focus on improving the transition out of high school for these youth. One area for future research would be to include more African American youth and their families in intervention studies focused on transition planning and outcomes.
To encourage involvement in transition planning among youth with ASD, teachers might use current interventions (e.g., Arndt, Konrad, & Test, 2006), or adapt interventions to meet individual needs (e.g., Held, Thoma, & Thomas, 2004). Instructional materials should incorporate research-based methods to support communication. Additionally, many students might benefit from learning to use new technologies that can support and enhance their involvement in transition planning meetings (Skouge, Kelly, Roberts, Leake, & Stodden, 2007). For example, students might record a video about their interests that could be played during the meeting; alternately, a student might want to lead his or her own meeting with the aid of PowerPoint.
Finally, our findings have implications for parent involvement. Among parents of youth with disabilities, the transition from high school can be stressful—filled with concerns about securing adult services, identifying employment or postsecondary education opportunities, and meeting social and residential needs. For parents of youth with ASD, such concerns seem compounded. Youth with ASD are the least likely to have no support needs (Shogren & Plotner, 2012), even as they face a “steep decline in service receipt” after high school (Shattuck et al., 2011, p. 143). They are also the least likely to participate in postsecondary employment or education (Shattuck et al., 2012). Thus, compared with all parents of youth with disabilities, parents of youth with ASD consider transition planning the least useful (Shogren & Plotner, 2012).
These negative experiences highlight the need for greater communication between teachers and parents of youth with ASD. Researchers and practitioners should consider how best to partner with parents in transition planning, so that efforts at home and school align. In developing transition-related instructional materials for students, researchers should develop parallel materials to be sent home. Such ready-made materials may prompt teachers to send information about transition-related instruction home, thus initiating contact more often. This effort may increase not only the communication between home and school but may also encourage more frequent discussion between parents and children about life after high school.
Although this study has contributed to the understanding of involvement in transition planning among students with ASD, it has several limitations. First, participants missing data on the outcome and key predictor variables were excluded, resulting in a sample disproportionately composed of Caucasian, higher income, and higher functioning students. Despite this limitation, the excluded participants and the final sample did not differ on the outcome variable and many of the other predictors. Second, this study was limited to the questions included in NLTS2. For example, only one item related to instruction in transition planning; more detailed information about this instruction would have been informative. Finally, teachers and parents provided ratings of student skills and behaviors for this study, and it is unclear whether observational data would differ or whether students would rate their own skills and behaviors differently.
Despite these limitations, analysis of the NLTS2 data has allowed insight into the factors that predict attendance and participation in transition planning among more than 300 students with ASD. Our findings can help practitioners and researchers target the students most in need of intervention, and can inform the instruction provided to students with ASD. Perhaps more importantly, this study has revealed the influential role parents play in the lives of their transition-age children with ASD. By taking a holistic approach, practitioners and researchers might better support the transition out of high school for these youth and their families.
Footnotes
Declaration of Conflicting Interests
The author(s) declared no potential conflicts of interest with respect to the research, authorship, and/or publication of this article.
Funding
The author(s) disclosed receipt of the following financial support for the research, authorship, and/or publication of this article: This work was supported in part by the Melvyn I. Semmel Dissertation Research Award (Department of Special Education, Peabody College, Vanderbilt University); the National Institute of Mental Health (K0 1MH92598, J. L. Taylor, PI); and the Eunice Kennedy Shriver National Institute of Child Health and Human Development (P30 HD15052, E. M. Dykens, PI).