
Abstract
The two most frequently used methods for assessing performance on chained tasks are single opportunity probes (SOPs) and multiple opportunity probes (MOPs). Of the two, SOPs may be easier and less time-consuming but can suppress actual performance. In comparison, MOPs can provide more information but present the risk of participants acquiring steps from probing alone. The authors reviewed and summarized 20 years of single-case design literature that evaluated methods of teaching chained tasks to individuals with disabilities. The authors identified a total of 33 studies. Individual tiers of multiple baseline and probe design graphs were analyzed to evaluate possible differences in participant responding within and between baseline and intervention conditions. Differences were evident, but none considered statistical when comparing data from SOPs and MOPs. The authors discuss possible publication bias as a reason for these findings and offer future research ideas to extend the literature on probe procedures.
When de-institutionalization occurred for individuals with disabilities in the 1960s and 1970s, researchers in the field of behavior analysis began to discuss the importance of intervening on behaviors of social importance (Baer, Wolf, & Risley, 1968; Nirje, 1969). This shifted focus in the field from selecting dependent variables out of experimental convenience to those of social significance (Baer et al., 1968). Conscientious researchers began conducting more studies that evaluated interventions for teaching skills essential for participants’ independence and community inclusion (e.g., Nirje, 1969). Some early studies targeting skills with social application to participants with disabilities focused on skills such as sewing (Cronin & Cuvo, 1979), dressing (Knapczyk, 1975), teeth brushing (R. D. Horner & Keilitz, 1975), household cleaning (Williams & Cuvo, 1986), janitorial work (Cuvo, Leaf, & Borakove, 1979; DeMars, 1975), envelope stuffing (Brown & Pearce, 1970), and operating a drill-press (Crosson, 1969). Naturally, many of these were chained tasks; meaning, the skills were comprised of a series of discrete responses (Cooper, Heron, & Heward, 2007). As the focus of dependent variable selection for evaluating treatments evolved, assessment procedures used to evaluate intervention effects on chained tasks remained relatively unchanged (Williams & Cuvo, 1986).
Two long-accepted methods for the assessment of chained tasks in the field of single-case design (SCD) and disability literature are single opportunity probes (SOPs) and multiple opportunity probes (MOPs; Cooper et al., 2007; Gast & Ledford, 2014; Snell & Brown, 2000). Probe procedures are typically used for three distinct purposes: (a) to assess pre-intervention ability to perform chained tasks, (b) to assess progress toward criterion during intervention, and (c) to assess maintenance of skills over time (Snell & Brown, 2000). Table 1 presents the generally accepted procedures for using both SOP and MOP procedures adapted from Snell and Brown (2000).
Procedures for Single and Multiple Opportunity Probe.

Although widely used, the similarities and differences inherent to the procedures should be compared when selecting between using SOP and MOP. With both probe procedures, data are collected on correct and incorrect responding. If praise or other forms of reinforcement are to be provided in intervention contingent on correct responding, this should also occur in baseline in either probe procedure to ensure that the manipulation of this independent variable (e.g., verbal praise) does not influence the change in effect between conditions. When measuring errors in both SOP and MOP, there are four possibilities: (a) incorrect completion of a step (i.e., topographical), (b) untimely initiation of a correct response (i.e., latency), (c) correct initiation without timely completion (i.e., duration), and (d) completion of steps out of order (i.e., sequence). The main difference between the two procedures is how the investigator responds to an error. With SOP, the researcher stops the probe session when the participant makes an error, and all subsequent steps are scored as incorrect despite the participant not having an opportunity to attempt the remaining portion of the chain (Snell & Brown, 2000). In MOP, participants have an opportunity to complete each step in the task analysis, regardless of errors made. Procedurally, when a participant engages in an error, the researcher obstructs his or her view of materials, completes the step, and then provides him or her an opportunity to complete the subsequent step (Snell & Brown, 2000). These differences in responding to errors in SOP and MOP have both practical and experimental implications.
Benefits of using one procedure over the other with chained tasks have been documented anecdotally in the literature. In regard to practicality, SOPs are more cost and time efficient than MOPs (Schuster, Gast, & Wolery, 1988). MOPs require enough materials and time to complete a target task in each session; whereas SOPs only require sufficient materials and time to complete the steps a participant is able to independently perform before engaging in an error (Godsey, Schuster, Lingo, Collins, & Kleinert, 2008). Snell and Brown (2000) suggested that SOPs allow for more instructional time for all students because probe sessions are typically quicker. With these ultimately quicker procedures, SOP can provide less information than MOP because the researcher has no record of whether the participant can engage in correct responding after making a single error (Cooper et al., 2007).
In addition to pragmatic arguments between SOPs and MOPs, considerations as to experimental rigor have been suggested. MOPs in comparison with SOPs may provide a more accurate measure of baseline level responding by allowing a researcher to observe the participant’s ability to complete each step in isolation (Gast & Ledford, 2014; Moon, Inge, Wehman, Brooke, & Barcus, 1990). SOPs, therefore, may result in suppressed baseline performance by only allowing researchers to count and identify the steps a participant correctly completes prior to the first error (Gast & Ledford, 2014). Comparatively, MOPs have been reported to result in more stable responding in baseline (Farlow, Loyd, & Snell, 1987). For example, with SOP, if a participant makes an error early in the task analysis in one session, but does not in other sessions, the difference between the data of the two probe sessions will be much greater. In addition, MOPs allow participants to access reinforcement more often when provided with praise for correct responding. SOPs only provide the same number of opportunities for reinforcement as correct steps, until the participant makes an error and the session ends. Finally, by allowing participants to view correctly completed steps following an error in a MOP, a facilitative testing effect can occur (e.g., Hammond, 2011; Snell & Brown, 2006). Probe procedure selection should, therefore, be an important consideration when developing procedures and evaluating experimental control.
Concerns from these reported weaknesses of the two probe procedures lead to important considerations when interpreting data collected. First, baseline data collected using SOPs are typically low, indicating a possible underestimation of a participant’s ability. This could lead to an abrupt and large change between the last data point in baseline and the first data point in intervention, producing an overestimation of intervention effects. Concurrently, using MOP procedures in baseline can inadvertently lead to an accelerating trend or acquisition prior to the implementation of intervention. This possible facilitative testing effect and eventual higher baseline level would result in changes upon introduction of intervention appearing smaller and less pronounced. Although examples of this appear in the literature, the differences in data patterns of SOPs and MOPs have not been summarized and examined empirically. As such, the purpose of the current study was to address this gap in the literature on probe procedures by examining studies that evaluated instructional methods for teaching chained responses to individuals with developmental disabilities. The following research questions are addressed when comparing studies that use SOP with those that use MOP:
Method
Study Selection and Inclusion Criteria
An electronic search yielded nine peer-reviewed journals that typically publish SCD data on chained response instruction for individuals with developmental disabilities. To ensure that all samples were collected from those journals, the researchers conducted hand searches of all volumes and issues between 1992 and 2012 in the following journals: Education and Training in Autism and Developmental Disabilities, Exceptional Children, Focus on Autism and Other Developmental Disabilities, Journal of Applied Behavior Analysis, Journal of Autism and Developmental Disabilities, Journal of Physical and Developmental Disabilities, The Journal of Special Education, Research in Developmental Disabilities, and Remedial and Special Education. Individual studies were selected for inclusion in the review if they met the following criteria: (a) an experimental study demonstrated experimental control through SCD methodology, (b) the study used either a multiple probe or multiple baseline design to assess the effects of the independent variable(s) on the chained response(s) being targeted, (c) participants included in the study had an identified developmental disability (e.g., intellectual disability, autism spectrum disorder), (d) data on at least one chained task were collected using task analytic reporting, (e) data were reported on a line graph for individual participants and behaviors (i.e., chained tasks), (f) either a MOP or a SOP was used to assess performance, (g) the same topography of behavior was assessed across conditions, and (h) the number of steps for the chained task was included in the study.
Studies were excluded if there was not enough information to determine what probe procedure was used, or procedures other than SOP or MOP were conducted to assess participants’ ability on chained tasks. In addition, if graphed data did not align with what was expected, given the number of steps reported in the article, it was excluded. For example, if a study reported that there were five steps in the task analysis (i.e., possible points at 0%, 20%, 40%, 60%, 80%, and 100%), but a data point hovered around 30%, it would be difficult to rely on the graphed results to make any conclusions.
Variables Coded
For each study that met the criteria, the following information was coded: (a) identifiable information (e.g., year, volume, authors), (b) independent and dependent variables, (c) targeted tasks (e.g., food preparation, social skills), (d) probe procedure (i.e., SOP, MOP), (e) reinforcement used in baseline and intervention, (f) research design, (g) number of total tiers and first tiers within the design, and (h) number of and age range of participants. The authors determined the code for the particular probe procedure in one of two ways: (a) the probe procedure used was explicitly stated in the manuscript or (b) the authors determined that the procedure used was MOP or SOP based on study descriptions. For example, if the procedures stated that the participant’s view was blocked and that the participant was given an opportunity to complete each step, it was scored as a MOP. Likewise, if the study stated that as soon as the participant engaged in an error, the session ended, it was scored as a SOP.
Table 1 includes information on guidelines used to determine categorization between SOP and MOP procedures. As evident in Table 1, there are many similarities between the two probe procedures. The researchers set up the materials, provide a task direction, and give the participant a specific latency and duration to complete the first step in the chain. The difference between procedures in a SOP and MOP relates to how the researcher responds to participants’ errors. When examining articles included in the current review, the authors used the Snell and Brown (2000) descriptions to determine how the researchers responded to errors. These guidelines assisted with the identification of SOP and MOP when the articles did not explicitly state the probe procedure used.
After data were obtained from the articles, individual tiers from the studies were examined to analyze participants’ performance within and between baseline and intervention conditions. The first tier(s) of the multiple probe/baseline graphs in each article were isolated and de-identified. Only first tiers were included to eliminate added variance from extended baselines in subsequent tiers. The authors labeled each tier with a code to reference for further analysis. A conversion table was created; whereby, each coded tier included the number of steps and percentage value possible for correct completion of each step (available upon request from the first author). The table allowed the authors to look at each graph and quickly determine the number of steps correct for specific data points through visual inspection. For example, if the first data point hovered around 10% and the number of possible steps was 19, the table would reveal that 10.5% would equate to two steps correct for that data point.
Using the conversion table and looking at the de-identified tiers, the authors collected information on the following: (a) first data point in baseline, (b) last data point in baseline, (c) number of sessions in baseline, (d) first data point in intervention, (e) last data point in intervention, and (f) number of sessions in intervention. Each of the four data points were then converted to percentages by dividing the number of steps completed by the total number of steps and multiplying by 100. This allowed for the data across studies to be compared and compiled with a common metric. For example, two studies may have the first data point at two steps correct, but without the researchers referencing the number of steps to convert a percentage, these data cannot be compared accurately. If the first study had a possible of 10 steps and second study a possible of 5 steps, the conversion for the first data points would be 20% (2 steps correct/10 possible steps × 100) and 40% (2 steps correct/5 possible steps × 100), respectively. If a procedure was used in which participants did not have an opportunity for independent responding in initial sessions (e.g., 0 s delay trials in constant time delay [CTD]), these data points were not reported as the first data point or included in the number of sessions for intervention. Only sessions in which participants had an opportunity to independently respond were included (e.g., 5 s delay trials in CTD). The number of sessions without opportunity for independent responding was determined through procedural descriptions in the narrative or labeling of data points on the graph.
Statistical Analysis
Five dependent variables were calculated based on four individual data points (i.e., first and last in baseline and intervention) and two sets of total data points (i.e., baseline and intervention). The level changes in baseline and intervention (first and second research questions) were calculated by subtracting the first data point from the last data point in each condition (i.e., within condition absolute level change; Gast & Spriggs, 2014). Similarly, the change from baseline to treatment (third research question) was calculated by subtracting the last data point in baseline from the first data point in intervention (i.e., between condition absolute level change; Gast & Spriggs, 2014). To compute simple baseline and intervention slopes (fourth and fifth research questions), the first data point was subtracted from the last and then divided by 2 for each condition (Keppel & Wickens, 2004). Two box plots (i.e., one for each probe procedure) were created for each of the five research questions using the data obtained. Finally, five independent sample t tests were conducted on each set of data to assess possible statistical differences between SOP and MOP procedures.
Interobserver Agreement
A second data collector independently coded a total of seven SOP (20.6%) and nine MOP (22%) tiers to check reliability across the data collected. Tiers were randomly selected from a list generator for each set of graphs (i.e., SOP and MOP). The following information was coded for reliability using the same procedures described above: (a) first data point in baseline, (b) last data point in baseline, (c) number of sessions in baseline, (d) first data point in intervention, (e) last data point in intervention, and (f) number of sessions in intervention. Each of the six pieces of information were compared with the original data set and scored as an agreement or a disagreement. Percent agreement was calculated for each tier by dividing the total number of agreements by 6 and multiplying by 100. Percent agreement was 100% for SOP graphs and 96% for MOP graphs (range = 83%–100%), with an overall agreement of 98%. Both the disagreements in MOP were on the last data points in baseline.
Results
Study Characteristics
Using the criteria outlined, a total of 33 studies were identified that met the criteria. Seventeen studies used SOP and 16 used MOP. Tables 2 (SOP) and 3 (MOP) are comprised of information on the studies included (i.e., author[s], year, journal, independent variable[s], target skills, and number of first tiers pulled for analysis). Publication dates for selected studies ranged from 1993 to 2012 (SOP), and from 1992 to 2012 (MOP). Studies were found in eight of the nine journals searched (i.e., no articles met the criteria in Remedial and Special Education). Independent variables used included response prompting procedures (e.g., CTD, system of least prompts, simultaneous prompting), video-based instruction (e.g., prompting and modeling), computer-based instruction, and community-based (in vivo) instruction. From these articles, a total of 75 (i.e., 41 MOP and 34 SOP) first tiers were extrapolated to obtain the individual data needed to calculate the dependent variables for each of the five research questions.
Studies Included That Used Single Opportunity Probes.
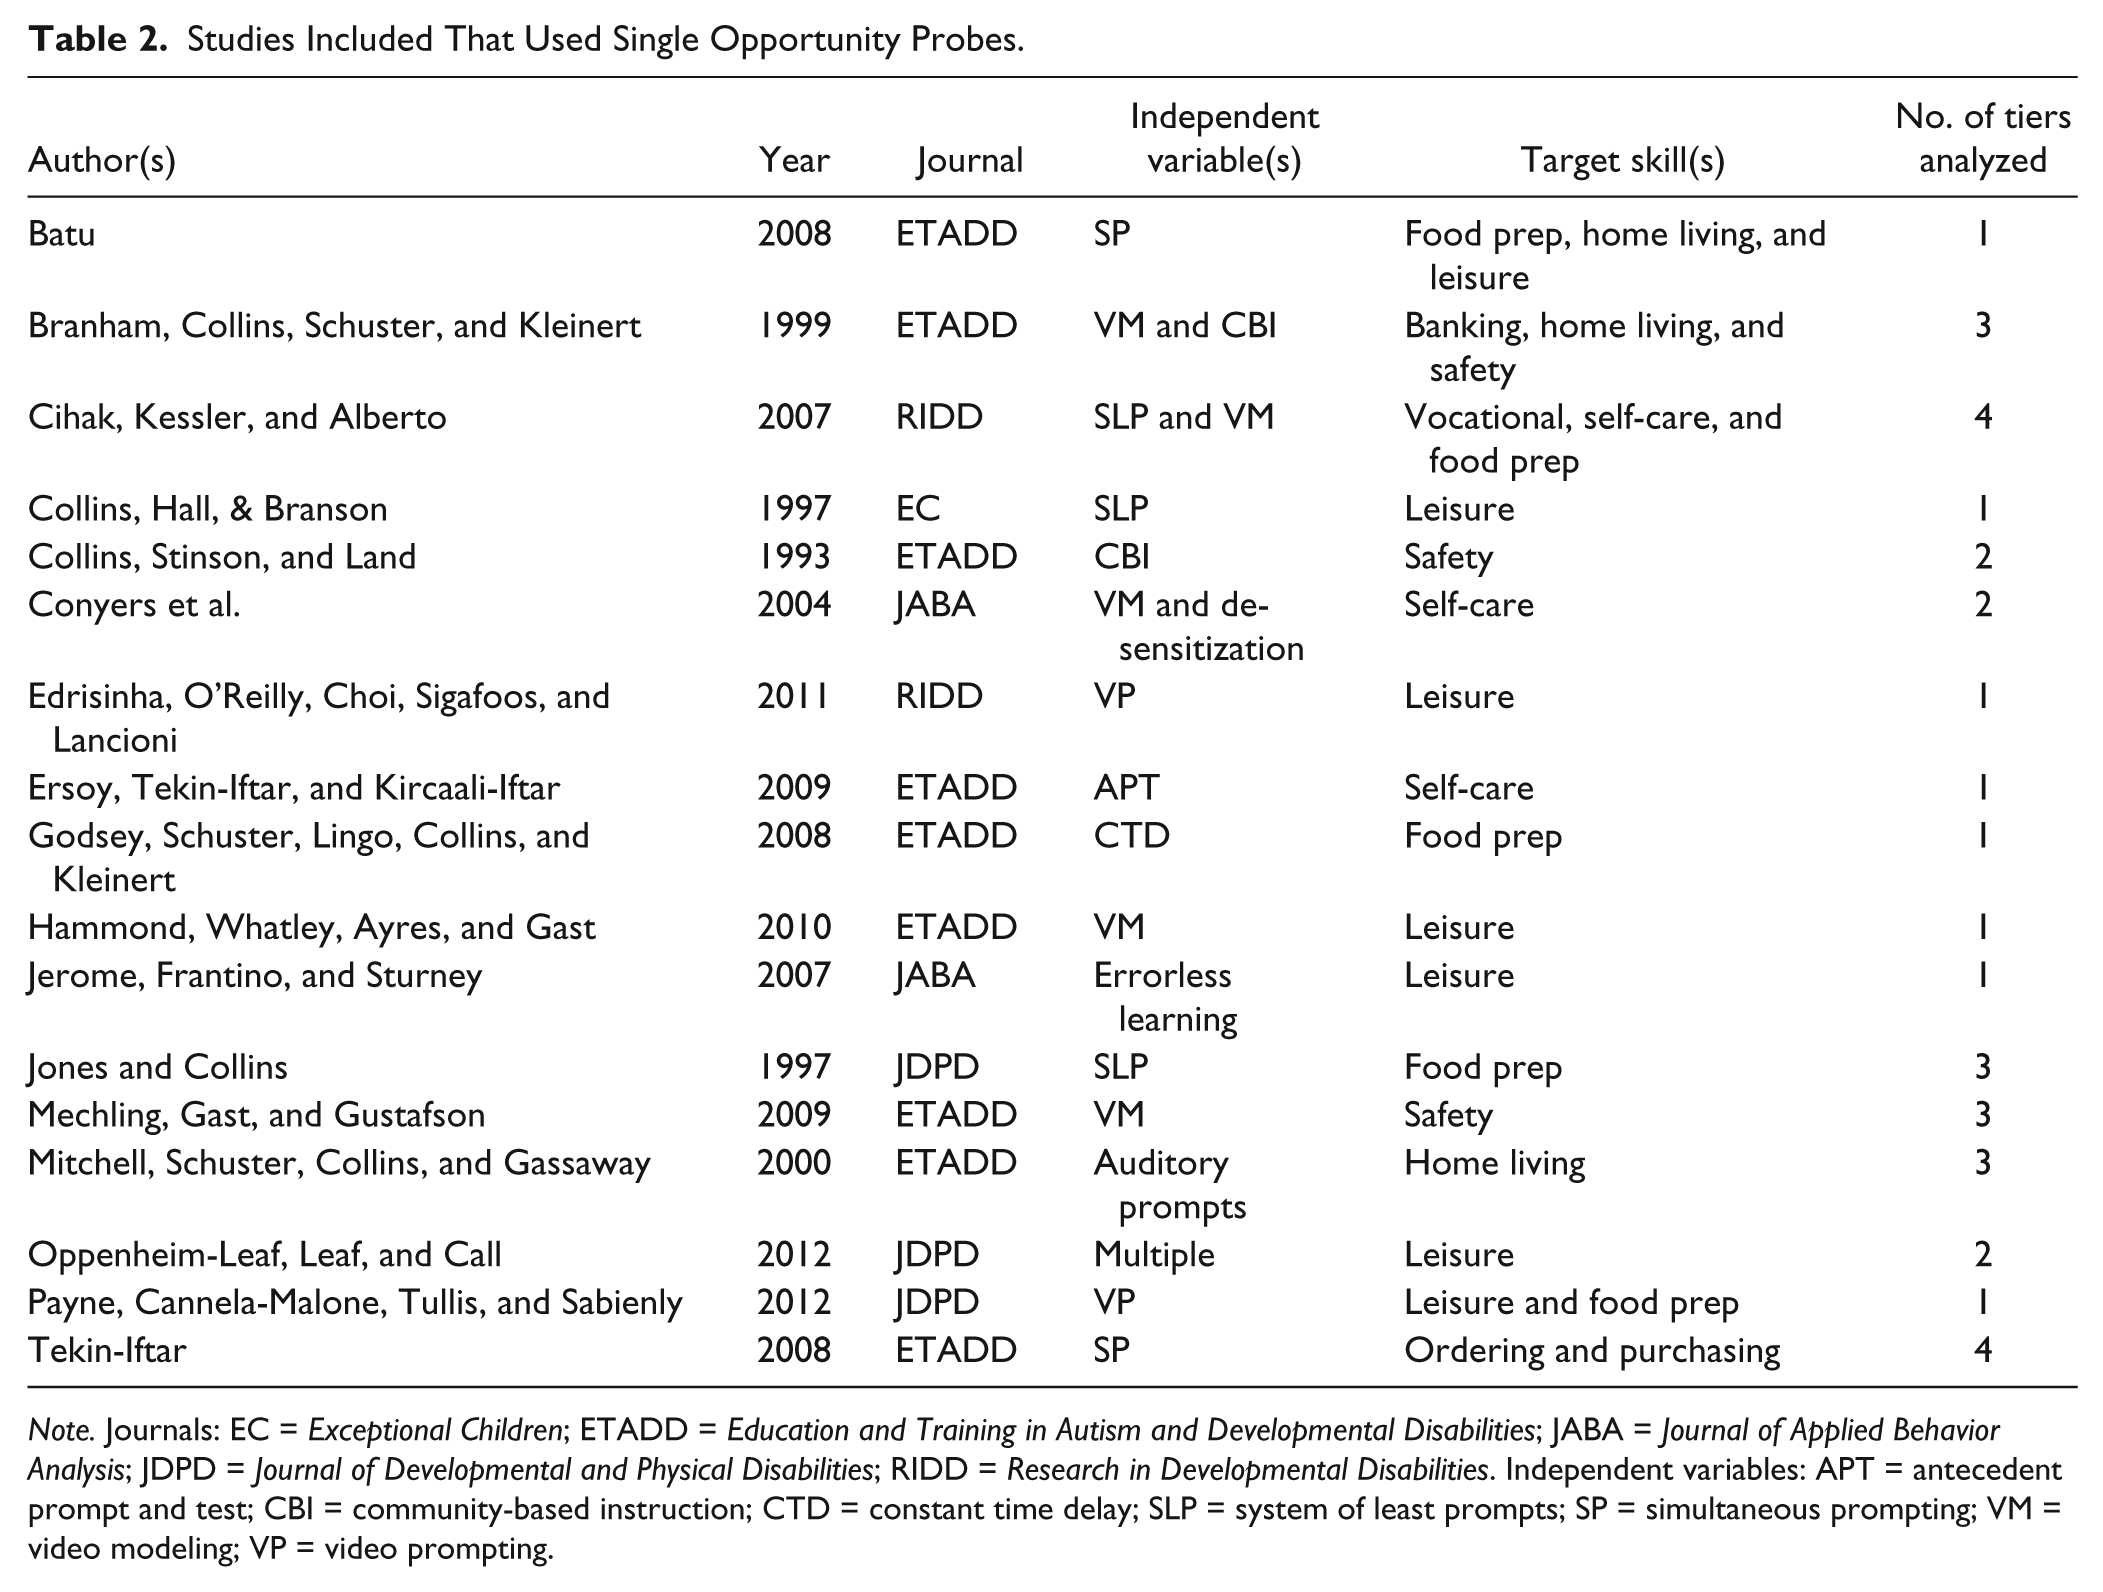
Note. Journals: EC = Exceptional Children; ETADD = Education and Training in Autism and Developmental Disabilities; JABA = Journal of Applied Behavior Analysis; JDPD = Journal of Developmental and Physical Disabilities; RIDD = Research in Developmental Disabilities. Independent variables: APT = antecedent prompt and test; CBI = community-based instruction; CTD = constant time delay; SLP = system of least prompts; SP = simultaneous prompting; VM = video modeling; VP = video prompting.
Studies Included That Used Multiple Opportunity Probes.
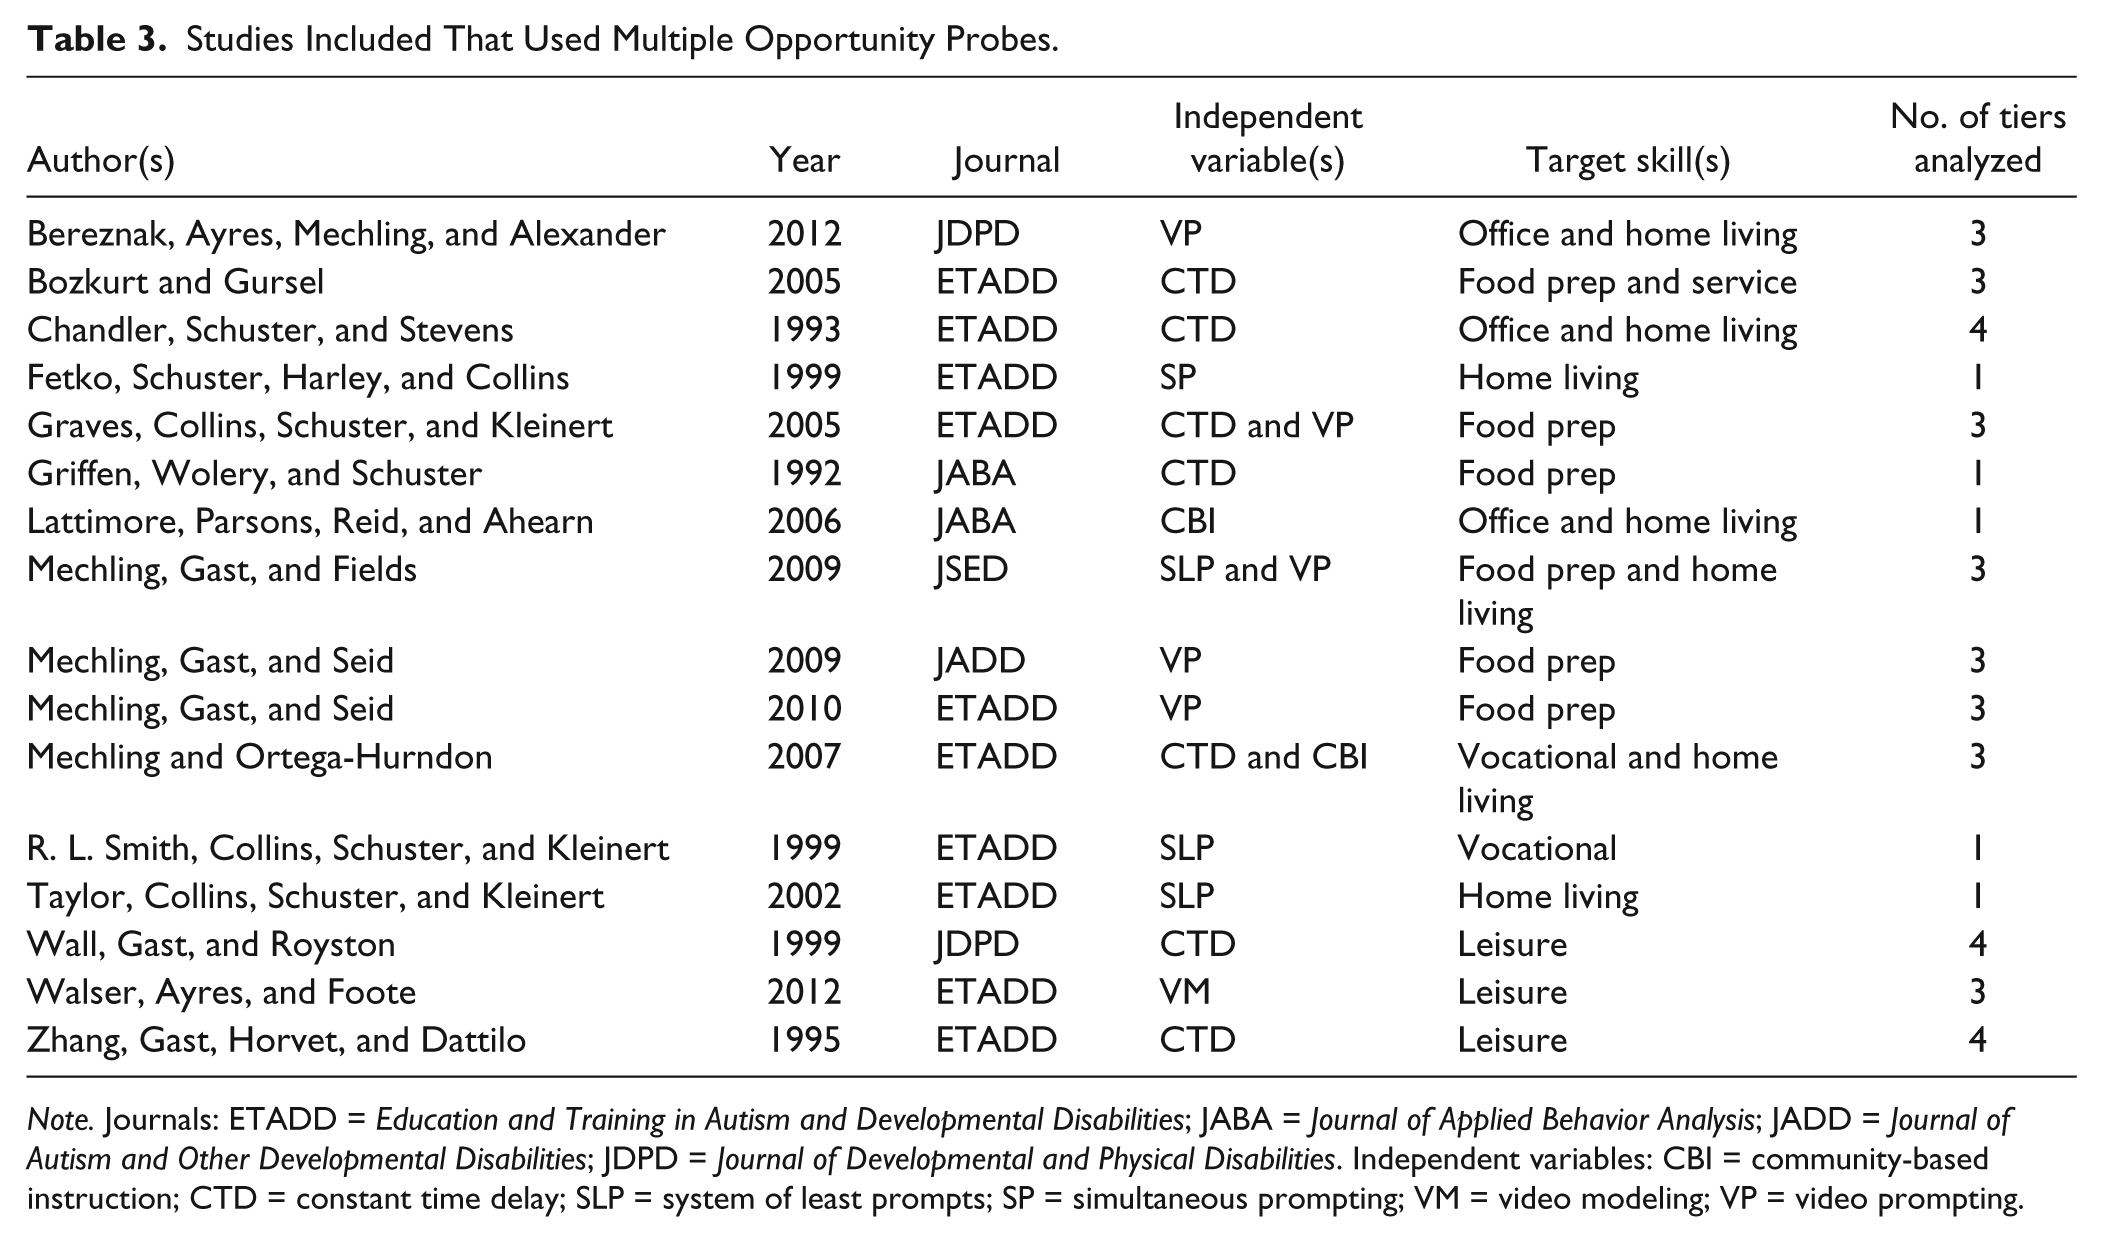
Note. Journals: ETADD = Education and Training in Autism and Developmental Disabilities; JABA = Journal of Applied Behavior Analysis; JADD = Journal of Autism and Other Developmental Disabilities; JDPD = Journal of Developmental and Physical Disabilities. Independent variables: CBI = community-based instruction; CTD = constant time delay; SLP = system of least prompts; SP = simultaneous prompting; VM = video modeling; VP = video prompting.
Comparisons
Figure 1 displays the box plots created using the data obtained, and Table 4 displays the descriptive statistics (i.e., mean, median, range, standard deviation) for each of the probe procedures for each research question. There were differences found between probe procedures, but none statistical (α = .05) in any of the five independent sample t tests. Results for each research question are discussed below.

Box plots created from the data obtained for the five research questions.
Descriptive Statistics for the Five Research Questions.
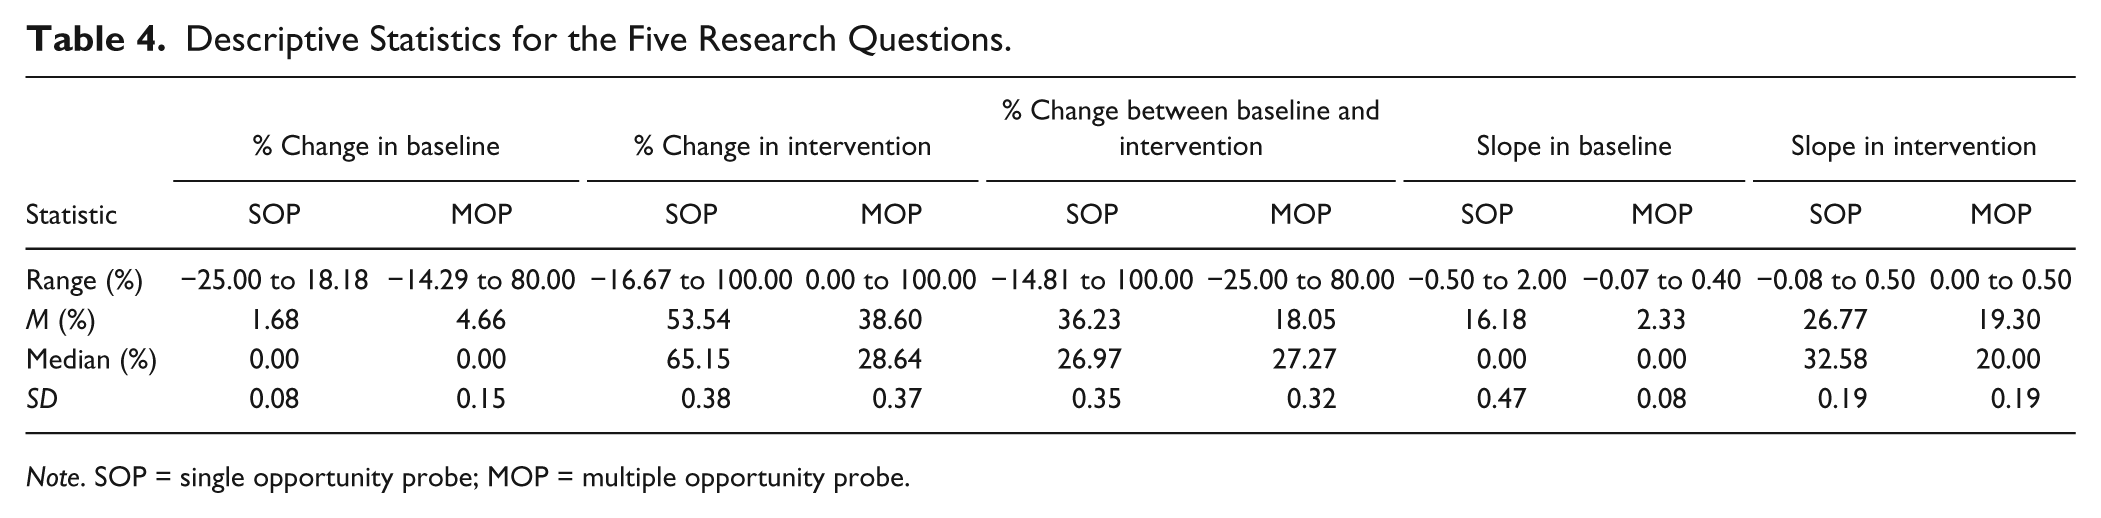
Note. SOP = single opportunity probe; MOP = multiple opportunity probe.
Difference between percent change in baseline
Data from individual tiers were more variable with MOP (SD = 0.15) than SOP (SD = 0.08). The mean change in baseline was higher for MOP at 4.66% (range = −14.29% to 80.00%) than for SOP at 1.68% (range = −25.00% to 18.18%). According to independent samples t test (α = .05), the mean difference was not significant (p = .35). For SOP, all of the data falling within the interquartile range (IQR) were at 0%; therefore, no box was created. The MOP box plot displays a small IQR with more data falling outside the IQR and larger outliers than SOP.
Difference between percent change in intervention
Variability was similar with SOP (SD = 0.38) and MOP (SD = 0.37). The mean change in intervention was higher for SOP at 53.54% (range = −16.67% to 100%) than for MOP at 38.60% (range = 0% to 100%). According to independent samples t test (α = .05), the mean difference was not significant (p = .61). The IQRs for SOP and MOP are similar, but differences in median were large. SOP had more data falling outside the IQR, while the summary of data from neither procedure resulted in outliers.
Difference between percent change from baseline to intervention
When evaluating change from baseline to intervention, the data were similarly variable with SOP (SD = 0.35) and MOP (SD = 0.32). The mean change between baseline and intervention was higher for SOP at 36.23% (range = −14.81% to 100%) than for MOP at 18.05% (range = −25.00% to 80.00%). According to independent samples t test (α = .05), the mean difference was not significant (p = .26). IQRs for both SOP and MOP are similar, but slightly larger with MOP. Medians are almost identical, and more SOP data fell outside the IQR when compared with MOP.
Difference in slope in baseline
When evaluating slope in baseline, data were more variable with SOP (SD = 0.47) than MOP (SD = 0.08). The mean slope in baseline was steeper for SOP at 16.18% (range = −0.50% to 2.00) than for MOP at 2.33% (range = −0.07% to 0.40%). According to independent samples t test (α = .05), the mean difference was not significant (p = .07). Similar to percent change in baseline, most of the data for slope in baseline fell within the same IQR, and the median for both procedures was at 0%. The data for SOP did not result in a box plot, but albeit small did for MOP. Outliers for SOP were greater with SOP than with MOP.
Difference in slope in intervention
When evaluating slope in intervention, the data were similarly variable with SOP (SD = 0.19) and MOP (SD = 0.19). The mean slope in intervention was steeper for SOP at 26.77% (range = −0.08% to 0.50%) than for MOP at 19.30% (range = 0% to 0.50%). According to independent samples t test (α = .05), the mean difference was not significant (p = .61). Box plots for SOP and MOP are similar with comparable data falling within and outside the IQR for both. Neither experienced any outliers, and the medians were similar.
Discussion
When comparing SOP with MOP using the method described here to evaluate testing threats, there are no statistically significant differences between the two procedures. These findings are surprising, considering numerable accounts of difficulty obtaining accurate baseline data from either of the two frequently used probe procedures (Snell & Brown, 2000). Many authors justify the use of MOP over SOP to get a more accurate representation of baseline performance by allowing them to attempt all steps (e.g., Bereznak, Ayres, Mechling, & Alexander, 2012; Griffen, Wolery, & Schuster, 1992). Hammond (2011) and K. A. Smith, Ayres, Alexander, and Mataras (2013) reported a participant in each study, improving in baseline from repeated exposures to MOP (i.e., facilitative testing threat). Others have justified their use of a SOP, to avoid participants learning from baseline (e.g., Tekin-Iftar, 2008).
The findings from this study should be interpreted with caution, as publication bias is a problem for any review (R. H. Horner et al., 2005). In the case of the present analysis, this may hold true because the issues examined were intently focused on potential threats to internal validity related to probe procedures. For example, a participant’s data may not be reported if he or she meets mastery in baseline (albeit slowly) and never encountered the intervention. Another example exists when one or more participants learn in baseline (possibly from the probe procedure), and the researcher does not publish his or her findings because of an inability to introduce intervention with a reasonable number of participants to demonstrate a functional relation. Therefore, although statistical differences were not detected, researchers should weigh the experimental risks and benefits of using one procedure over another. Although no statistical findings were found, overall differences in descriptive statistics are worth discussion. The first and fourth research questions in regard to percent change in baseline and slope in baseline were an attempt to evaluate any testing effects from the two procedures in baseline. Researchers expected differences with possible inhibitive effects from SOP (i.e., suppressed or decelerating baseline) and facilitative threats with MOP (i.e., accelerating trend). When comparing mean percent change, MOP is slightly higher than SOP, but the difference is minimal (i.e., about 3 percentage points). When comparing mean baseline slope, SOPs are steeper than MOP. This difference is in the opposite direction of what the authors expected.
If inhibitive threats are inherent to SOP, then suppressed baseline would lead to a more immediate effect in intervention. Likewise for MOP, a facilitative threat would lead to a more moderate effect between baseline and intervention conditions. Findings from the third research question, on the percent change from baseline to intervention, verify this assumption with the mean change in SOP greater than MOP (i.e., 36.23% and 18.05%, respectively). The last assumption evaluated was the effect on the acquisition in intervention. Specifically, the authors were interested in the percent change (second research question) and slope of change (fifth research question). When comparing the mean percent change, SOP (55.54%) was larger than MOP (38.60%). It is possible that this difference can be attributed to inhibitive threats with SOP. For example, if data are suppressed in baseline because the participant did not know how to complete the first steps in the chain, the initial data point in intervention may be similar to the last baseline data point. Once the individual is taught the beginning during the first and second intervention sessions, the change from the first and last data point in intervention may be drastic because the participant already knew how to complete later steps in the chain. When comparing slopes in intervention, they were similar between the two procedures; SOP at 26.77% and MOP at 19.30%. Although a small difference, this is in line with the authors’ assumption that the SOP would have a greater slope from a suppressed baseline.
When deciding what procedure to use, researchers might consider that possible inhibitive (SOP) and facilitative (MOP) testing threats may be task and participant specific. With MOP, the facilitative threat may be greater if the task being measured requires the researcher to put something in the hands of the participant or put the participant’s hands on something. For example, in a study evaluating techniques for teaching a chained task where the task is mailing a letter, with a MOP the experimenter may have to put the envelope in the participant’s hand if the participant fails to pick up the envelope to complete the next step. There is no feasible way to screen this from the view of the participant. If this study involved SOP, a facilitative threat would be less likely. This consideration is unnecessary for tasks that don’t include steps in which a researcher would have to physically guide the participant upon an error.
A consideration with SOP as a potential inhibitive threat involves situations where the participant is highly motivated by praise (as a reinforcer). In contrast to MOP, SOP procedures may offer fewer chances to provide reinforcement because they simply involve fewer steps of the chained response being evaluated in baseline or early acquisition. Thus, for a participant who is failing to encounter positive reinforcement, the negative reinforcement of being able to escape the task quickly (when it ends after a single missed trial in SOP) may be temporarily more motivating.
A limitation to the analysis may be the number of studies that met inclusion criteria. The review only spanned 20 years and only examined nine journals. Including more studies for review could result in more data and allow detection of differences. For all of the tiers, only a few data points were used to calculate percent change and slope. This has many issues, as the data referenced were all time-series data. Although time-series data are typical of SCD, these analyses are usually used with pre-/post-test measures within group designs. Although this is an inherent flaw in the calculations, to date, there are no acceptable means for calculating statistical significance in SCD (R. H. Horner, Swaminathan, Sugai, & Smolkowski, 2012).
Researchers are charged with three tasks given these data. First, researchers should consider publishing results when participants have ascending baselines, particularly when MOPs are used. Although the participant may never receive intervention, thus not answering investigator’s research questions, the data are important for future decisions regarding assessment of baseline performance for practitioners and researchers, alike. Second, the field of SCD should continue to explore ways to summarize and report effect size for a variety of independent variables and other factors like probe procedures that are originally reported in time-series data (R. H. Horner et al., 2012). Finally, researchers should take an experimental approach to analyzing possible differences and threats of the two probe procedures. For example, what are the repeated effects of a SOP and MOP on responding? Are there differences in responding related to participant characteristics (e.g., cognitive ability, age)? Are there differences in responding related to task characteristics (e.g., number of steps, prior history with materials)? The information provided in this study is only descriptive in nature. Given the fact that reported threats with MOP and SOP may be task or participant specific, a study that can control for these variables could provide a wealth of additional information.
Footnotes
Authors’ Note
The opinions expressed are those of the authors and do not represent views of the Institute or the U.S. Department of Education.
Declaration of Conflicting Interests
The author(s) declared no potential conflicts of interest with respect to the research, authorship, and/or publication of this article.
Funding
The author(s) disclosed receipt of the following financial support for the research, authorship, and/or publication of this article: The research reported here was supported by the Institute of Education Sciences, U.S. Department of Education, through Grant R324A100094 to the University of Georgia.