
Abstract
The present study investigated relationships among technical assistance, school leadership quality, and multitiered system of support (MTSS) implementation. The findings indicated technical assistance improved school leadership quality, and improved leadership significantly mediated the relationship between technical assistance and MTSS implementation for both behavior and academic systems. These results provide support for the foundational role of school leadership in MTSS implementation. Implications for providers of technical assistance are discussed.
Keywords
The interests of students with disabilities and educators with specialized expertise are increasingly intertwined with school leadership, culture, systems, and practices. During the past decade, the concept of inclusive education has been evolving from simply placing students with disabilities in general education classrooms to engaging these students in general curriculum through whole-school applications, and providing full membership and belonging among age peers (Sailor, 2017). With the advent of multitiered system of support (MTSS) as a mechanism for inclusively meeting student needs and societal concerns about equity, the scope of inclusive education widened to equitable education for all students, including those with disabilities and those classified in racial, linguistic, and socioeconomic subgroups (Kozleski & Waitoller, 2010).
Even as place-based definitions of inclusive education permeate and shape much of local education policies, systems, and practices, an equity-based definition is emerging in federal law. The 2004 reauthorization of Individuals With Disabilities Education Act (IDEA; Pub. Law 108-446) clearly requires schools to educate all students, including students with disabilities, with access to general education curriculum in general education classrooms to the maximum extent appropriate. The Every Student Succeeds Act of 2015 (ESSA; Pub. Law 114-95) reinforces this requirement with a focus on achievement and equity for all students, including those who are marginalized and/or who need extensive support. This macroevolution to concern for broader categories of students than just those with disabilities resulted in a shift from place-based concerns for education to a focus on resource management grounded in equity for all students (Artiles & Kozleski, 2016; Sailor, 2017).
These legislative demands for improved outcomes and inclusive and equitable education for all students create a need for many schools to reshape their policies, systems, and practices (Waldron & McLeskey, 2010). To make these changes sustainable, the literature suggests transformational leadership, in which Principals play a necessary change-agent role (Camburn, Rowan, & Taylor, 2003). Principals and other school administrators can influence student learning in indirect ways that are mediated by a variety of school social conditions (Heck, 2010; Heck & Hallinger, 2009). Effective Principals utilize instructional leadership methods, which influence how students experience classroom learning and transformational leadership, which leverages wider organizational systems to enable, stimulate, and support classroom learning conditions (Leithwood & Sun, 2012; Marks & Printy, 2003; Robinson, Hohepa, & Lloyd, 2009).
When Principals apply their leadership influence with all students in mind, they give rise to equitable learning environments for students with all types of learning needs (Kozleski & Huber, 2012). Key leadership activities for installing a system to support diverse student needs include (a) creating a culture of shared vision, (b) building a collaborative work structure, (c) enabling need-based teacher supports (e.g., professional learning), (d) using data to make decisions, and (e) reviewing and participating in policy changes in collaboration with local educational agencies (LEA) administrators to prompt changes (Furney, Aiken, Hasazi, & Clark/Keefe, 2005). The expected result is equity-based inclusive education that provides an instructional match to measured student need that enhances outcomes for all students (e.g., those with Individualized Education Programs [IEPs], with culturally diverse backgrounds, who receive English language learner services, who live in poverty), and all students have access to general education curriculum and environment (Burrello, Sailor, & Kleinhammer-Tramill, 2013; Sailor & Roger, 2005).
Equity-based inclusion, however, does not entail using the same instructional strategies and approaches with all students. We argue that this approach to education instead requires a MTSS with universal design for learning (UDL) and differentiated instruction to meet diverse educational needs of all students (Choi, Meisenheimer, McCart, & Sailor, 2017; Nelson, 2014; Novak, 2014). MTSS provides a framework to extend evidence-based instruction and supportive interventions to serve all students, including those who need extensive academic or behavior supports and those who are assessed with alternate assessments using alternate achievement standards (AA-AAS; Sailor & McCart, 2014; Sailor & Roger, 2005). MTSS generally contains six essential components regardless of subject area of instruction: (a) supplemental evidence-based interventions supported by fully trained interventionists, (b) a continuum of tiered support system with increased intensity, (c) problem-solving protocols for assessment and instructional decisions, (d) progress monitoring and data-based decision rules for intervention changes, (e) implementation integrity, and (f) systematic screening for early identification of students. These components of MTSS enhance the processes of prevention, identification, and intervention through systematic, data-driven collaborative processes (Sugai & Horner, 2009).
Multiple assessment tools that measure fidelity of MTSS provide definition of school leadership functions within MTSS through subscale items. Such instruments include Implementation Fidelity Rubric for the Response to Intervention Framework (Ruffini, Miskell, Lindsay, McInerney, & Waite, 2016), RTI Framework Integrity Rubric and Worksheet (National Center on Response to Intervention, 2010), Schoolwide Implementation Review (SIR; Wisconsin RTI Center, 2015), Self-Assessment of Multi-Tiered System of Supports Implementation (Florida Department of Education, 2014), School-wide Evaluation Tool (Sugai, Lewis-Palmer, Todd, & Horner, 2001), Schoolwide Benchmark of Quality (Kincaid, Childs, & George, 2010), and SWPBIS Tiered Fidelity Inventory (Algozzine et al., 2014). Common elements of a school leadership role on these fidelity instruments are (a) administrator support with clear vision to drive implementation forward; (b) team members representing grade levels, school subteams, and multidisciplinary educators including special education; (c) consistent regular meeting with agenda and minutes; (d) set clear action plans and monitor its progress; (e) decisions about resource allocation including staff responsibilities and professional development; and (f) ongoing monitoring and overall MTSS effectiveness with data.
Schoolwide Integrated Framework for Transformation (SWIFT) Center, a federally funded technical assistance (TA) project to support inclusive school reform, helped whole schools provide high-quality academic and behavior instruction for all students by implementing equity-based inclusive education (www.swiftschools.org). This whole-school system is framed in five domains and 10 features (i.e., two features for each domain) each supported by evidence-based from research (McCart, Sailor, Bezdek, & Satter, 2014). MTSS and Administrative Leadership are two of these five domains. Administrative Leadership, comprised of two features—Strong and Engaged Site Leadership and Strong Educator Support System—layouts essential attributes of school leadership as measured by SWIFT Fidelity of Implementation Tool (SWIFT-FIT; Morsbach Sweeney et al., 2014). SWIFT’s Administrative Leadership domain describes the school Principal as an active instructional leader, reciprocal communicator, and trust builder with a clear vision to improve student outcomes. Such a leader empowers school teams, coaches, and educators to make decisions, exchange ideas, and request supports for teaching and learning. A school leadership team within this framework is comprised of grade-level and other school representatives, including family partners. The leadership team meets regularly to review data and make decisions to support other school teams (e.g., grade-level instructional teams) and educators. These decisions may include identifying areas of professional development, refining or redirecting the use of resources (e.g., co-teachers, interventionists, paraprofessionals), assigning team tasks for problem-solving, and developing an agenda for district support needs (e.g., policy change). It is also expected that school leaders fully support educators through professional development, coaching, and constructive evaluation feedback in SWIFT-supported schools. SWIFT contextualizes this leadership in MTSS for inclusive academic instruction (i.e., academic MTSS) and inclusive behavior instruction (i.e., behavioral MTSS).
SWIFT TA for MTSS was conceptualized to install and implement components of MTSS (Sugai & Horner, 2009) in academic (i.e., reading and math) and behavior areas through professional learning institutes and ongoing supports (e.g., facilitated team meetings, transformation coaching, self-assessment). SWIFT TA employs differentiated TA within an implementation science framework designed to facilitate ownership and increase capacity within the LEA to support the system for lasting success (Fixsen, Blase, Metz, & Van Dyke, 2015; McCart, McSheehan, Sailor, Mitchiner, & Quirk, 2016).
Continuous attention has been paid to the role of leadership for MTSS implementation and its scale-up at the state educational agency (SEA) and LEA levels (Charlton et al., 2018); however, little research has been done on relationships among TA, MTSS implementation, and school-level leadership. The purpose of this study was to investigate relationship between school leadership and MTSS implementation within the context of SWIFT TA. We reasoned that a better understanding of the school leadership role in MTSS implementation will inform how TA providers, transformation coaches, and leadership teams at LEA and SEA levels can support and develop school-level leadership and accelerate MTSS implementation. Our primary research question addressed the extent to which TA, school leadership, and MTSS are related. Specifically, we documented the relationships among SWIFT TA, MTSS, and Administrative Leadership as well as the mediating effect of school leadership on the relationship between SWIFT TA and MTSS implementation. We hypothesized that Administrative Leadership and MTSS implementation would be influenced by SWIFT TA, and that improved Administrative Leadership would mediate the relationship between targeted TA for MTSS and MTSS implementation (see Figure 1).

Logic model for implementing MTSS through Administrative Leadership enhancement.
Method
The following descriptive, longitudinal, and predictive studies are based on secondary data sources developed in the context of authentic TA supporting inclusive school transformation in K–8th grade schools. The purposive sample of participants, the TA intervention, technically validated FIT for measuring Administrative Leadership and MTSS, data collection procedures, and analytic methods follow.
Participants
In 2012, SWIFT used a rigorous process to select five SEAs to receive SWIFT TA that included capacity building at the state, district, and school levels to install, implement, sustain, and scale up MTSS (Mitchiner, 2014; Sailor, McCart, & Choi, 2018; U.S. Department of Education, Office of Special Education Programs, H326Y120005). Invitation to participate was extended to all SEAs in the United States through multiple networks (e.g., Institutions of Higher Education, Council of Chief State School Officers, National Association of State Directors of Special Education). A SWIFT selection committee interviewed SEA representatives and assessed their needs, enthusiasm, current context, and readiness using the Hexagon Tool (Blase, Kizer, & Van Dyke, 2009). Ultimately, five states partnered with SWIFT and agreed to data-use agreements to support ongoing program evaluation and resultant quality control.
These state agencies, in turn, recruited 17 LEAs and 64 elementary and middle schools that agreed to engage in whole-system transformation supported by SWIFT TA. In each of three states, 16 schools were selected for participation; eight schools were selected in each of the two smaller states. Five of these schools withdrew from the project in the first year prior to collecting sufficient data for use in analysis. This study thus analyzed data from the remaining 59 schools that participated for two consecutive years.
These schools served grade levels distributed as follows: 59% elementary schools (PreK–2, 4, 5, or 6 grade), 24% middle (5–8 or 6–8 grade), and 17% combined schools (PreK–8). For the school year 2014–2015, 41 schools out of 59 (69%) had a schoolwide Title I program (National Center for Education Statistics, 2018). Their geographic locations settings varied with nine schools in cities, five schools in suburbs, 18 schools in smaller towns, and 27 schools in rural settings. Fifty-seven percent of the students received free lunch and 5% reduced-price lunch.
Measurements and Data Collection
SWIFT-FIT
SWIFT-FIT (Morsbach Sweeney et al., 2014) measures fidelity of implementation, that is, the extent to which a school is practicing the 10 features of SWIFT’s framework for inclusive education (McCart et al., 2014). SWIFT-FIT contains items aligned with essential components of Administrative Leadership (e.g., the school principal as an active instructional leader and reciprocal communicator) and MTSS (e.g., components of MTSS) as well as other SWIFT features. A preliminary technical adequacy study indicated SWIFT-FIT is a reliable and valid measure for assessing SWIFT fidelity of implementation (Algozzine et al., 2017). The average content validity index (CVI) for each feature subscale ranged from 0.87 (for Strong Educator Support System feature) to 1.0 (for the Fully Integrated Organizational Structure and Trusting Family Partnerships feature), which provides appropriate evidence of expert validity (Polit & Beck, 2006). Cronbach’s alpha for SWIFT-FIT total mean score was .96, and an average interrater agreement was 82.3% (Algozzine et al., 2017). For construct validity, SWIFT-FIT scores obtained from six schools practicing inclusive education, called knowledge development sites, and baseline SWIFT-FIT scores from sampled initial partner schools were compared. The results revealed that scores for the sampled partner schools (M = 37.83, SD = 11.34) and knowledge development sites (M = 57.94, SD = 15.69) differed in the desired direction (t = −2.32, p < .05; Effect Size = 1.77; Algozzine et al., 2017). For its usability, assessors favorably rated SWIFT-FIT’s ease of use. The overall mean of 3.1 for SWIFT-FIT usability was obtained from a questionnaire item with a four-point Likert-type scale (1 = strongly disagree, 4 = strongly agree). These collective findings provide support for the use of SWIFT-FIT in the present analysis.
SWIFT-FIT was administered by formally trained assessors on an annual basis. An assessor visited a school for a full day of interviewing leadership team members, educators, parents, and other necessary staff; reviewing documents; and performing classroom observations. For the baseline, SWIFT-FIT data collection in the school year 2013–2014 (i.e., fall 2013), SWIFT TA staff and trained SEA/LEA personnel participated as assessors. Interrater reliability was established between trained assessors in 14 schools. The average reliability was 79.6% (ranging from 60%–96%). Scores were reviewed by school personnel along with student outcome data (i.e., academic and behavior screening and annual state assessment) to plan training and TA to improve their implementation. SWIFT-FIT data were collected again in fall 2014. Researchers planned to collect SWIFT-FIT data biannually at that time; however, decided to change to annual for better reliability with consistent spring administration. In spring 2015, interrater reliability was collected again in six schools. The average interrater reliability was 90.1% (ranging from 82%–96%).
TA log
SWIFT TA providers recorded their activities in a TA log beginning in January 2014, the second semester of the 2013–2014 school year and continued until the end of the SWIFT project. They completed a log entry after engaging in a TA practice, specifying the activity format (e.g., coaching, training, measuring/data review, presenting, facilitating, consulting), target audience (e.g., individual; coach; team at LEA, SEA, or school level), activity effects and location (e.g., specific LEA, SEA, school), and type and specific area of activity (e.g., exploration/foundation, feature-specific activities, implementation capacity). The records in the TA log were limited to TA activities delivered to school or LEA staff to implement SWIFT. SWIFT TA providers frequently and regularly contacted school and LEA coordinators to prepare TA activities, but did not note these preparation activities in TA logs.
TA log data were collected through a password-protected online survey in Qualtrics. SWIFT TA providers had weekly meetings to share TA activities and update the current implementation status in partner schools. Data collected on TA logs were summarized and shared with TA providers at their meetings. The log data were also used to plan future TA activities within the continuous improvement cycle frame (i.e., plan–do–study–act cycle). TA providers were continuously encouraged to record all assistance activities in the log. The SWIFT TA variable in the analysis represents the number of log entries marked as a feature-specific activity, with the feature being Inclusive Academic Instruction (i.e., SWIFT TA for Academic MTSS) or Inclusive Behavior Instruction (i.e., SWIFT TA for Behavior MTSS)—the two SWIFT features that provide indicators of implementation of MTSS.
SWIFT TA practices
SWIFT TA practices are designed to provide differentiated interventions and accomplish sustainable transformation that eventually results in sustainable student improvement in academic and behavioral outcomes. The major TA practices are (a) design/visioning, (b) data snapshot reviews, (c) priority and practice planning, (d) resource mapping and matching, (e) teaming, and (f) coaching (McCart et al., 2016). SWIFT TA begins by building a shared understanding about the school’s direction for the future, sometimes designing a new operational vision, and other times aligning an existing vision with SWIFT framework features. During the TA process, schools engage in body-of-evidence reviews using data reflecting their current practices to help select near-term priorities for moving toward their transformational goals for the future. These priorities are the focus of a stage-based process in which specific evidence-based practices are selected and implemented. Intertwined with these processes, schools engage in mapping out available resources and then matching these resources to assist implementation of new or improved practices. Schools reorganize and reallocate existing resources to achieve planned priorities, such as reassigning building space and staff, or accessing untapped resources available through their district, state, or community. Teaming and coaching are overarching practices that support all these other practices. Teaming includes communication strategies within and among the multilevel organizations (e.g., school, LEA, SEA) involved in carrying out planned activities. Coaching is the intensive, stable, ongoing negotiated relationship between the TA providers and the TA recipients (McCart et al., 2016).
In the present study, at the outset of SWIFT TA, the Center hosted a 3-day intensive training, or professional learning institute for partnering SEA, LEA, and school teams. This training included knowledge development site school staff sharing their successful experiences with inclusive education and facilitated visioning activities during which each school, LEA, and SEA attendees generated their own vision statements. Next, assigned SWIFT TA providers for each state worked with schools, LEAs, and SEAs to follow up on realizing their visions. They conducted weekly meetings with school Principals and LEA staff to exchange information and construct monthly agendas for the LEA leadership team meetings. SEA teams adopted the same approach in a bi-weekly meeting format. SWIFT TA practices were embedded in these regular meeting agendas as well as subsequent state and national professional learning institutes.
Data Analysis
Administrative Leadership and MTSS fidelity
Overall improvements in Administrative Leadership and MTSS fidelity of implementation were analyzed with descriptive statistics. Consistently collected scores across the 59 schools’ SWIFT-FIT assessments were aggregated, and averages of SWIFT-FIT feature scores were compared.
Effects of SWIFT TA on Administrative Leadership and MTSS improvements
The effect of SWIFT TA on Administrative Leadership and MTSS in schools was analyzed in relation to longitudinal SWIFT-FIT scores. SWIFT-FIT score increases (referred to here as improvement) from the baseline (fall 2013) to spring 2015 were calculated for each school and separate repeated measure ANOVA and Kruskal–Wallis H tests were conducted to examine the effect of SWIFT TA on the Administrative Leadership or MTSS features (i.e., Academic MTSS and Behavior MTSS) improvement.
Mediation effects of Administrative Leadership on the relationship between SWIFT TA for MTSS and MTSS implementation
Structural equation modeling (SEM) using maximum likelihood was conducted in AMOS©25 to examine the mediating role of Administrative Leadership in the relationship between SWIFT TA for MTSS and MTSS implementation. The amount of SWIFT TA for academic and behavior MTSS in TA logs served as independent variables, the SWIFT-FIT score changes on the MTSS features implementation during the SWIFT TA served as dependent variables, and the SWIFT-FIT score change of Administrative Leadership domain during the SWIFT TA (i.e., Administrative Leadership) served as a mediator. The relationships among these variables were analyzed with data from 59 schools that implemented the SWIFT framework for two consecutive years. A basic path model testing the mediation effects is presented in Figure 2. All statistical analyses were performed with the Statistical Package for the Social Science (IBM SPSS, version 25; IBM SPSS, Armonk, NY). The SEM approach for mediation analysis (Frazier, Tix, & Barron, 2004) with a bootstrapping method (i.e., resampling method; MacKinnon, Lockwood, & Williams, 2004) was employed.
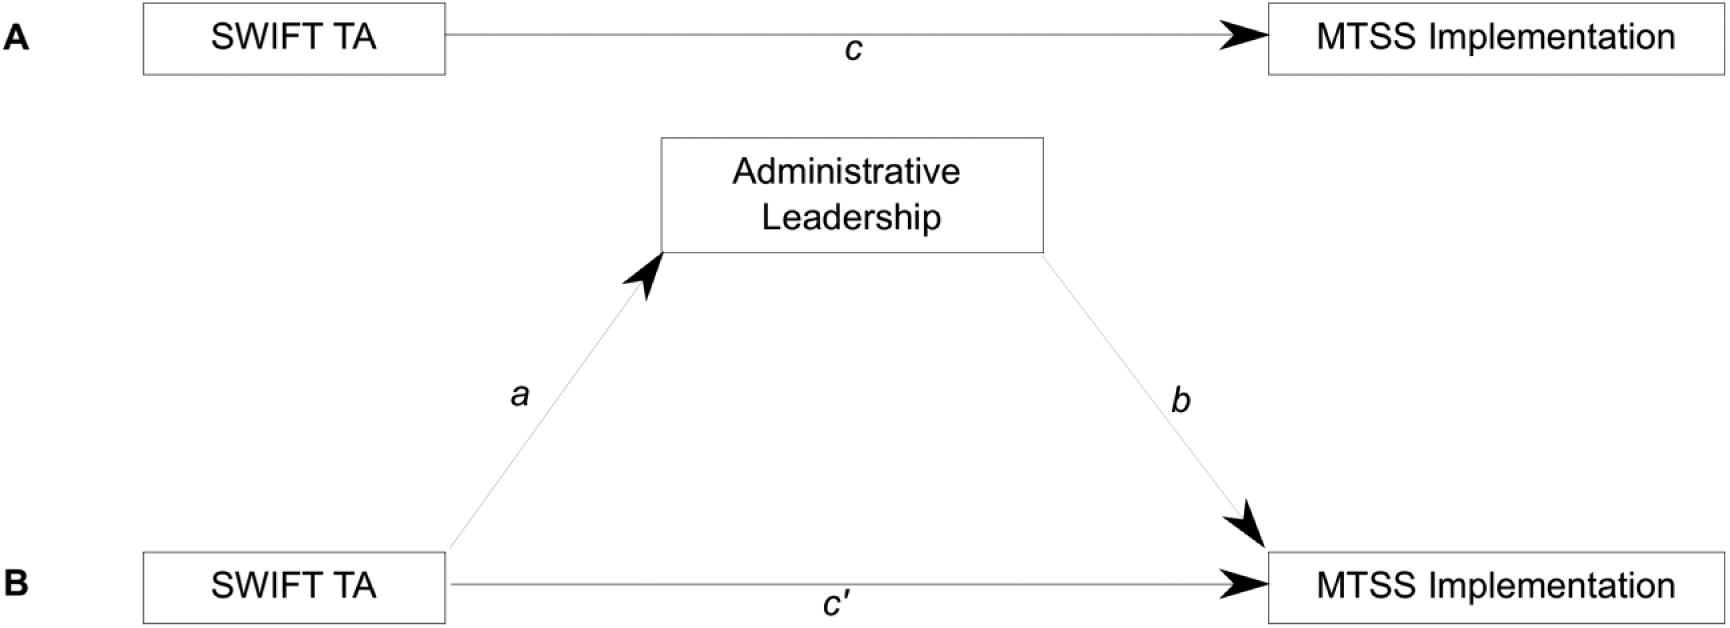
Basic path model for mediation effect.
The SEM approach to mediation entails the test of three conditions: (a) (Step 1) test the significance of total effect for the association between SWIFT TA and MTSS Implementation (the path c in Figure 2), (b) (Step 2) test the significance of indirect effect of SWIFT TA on MTSS Implementation through Administrative Leadership (the a and b path in Figure 2), and (c) compare the direct of effect of SWIFT TA (the c′ path in Figure 2, which is about the impact of SWIFT TA on MTSS Implementation after controlling for Administrative Leadership) with the total effect of SWIFT TA (the c path from Step 1). If the c′ path is not significant, Administrative Leadership fully mediates the association between SWIFT TA and MTSS Implementation. If the c′ path is reduced but still significant, it can be concluded that Administrative Leadership is a partial mediator. In Step 2, the indirect effect of SWIFT TA on MTSS Implementation is calculated as the product of the two coefficients, a × b in Figure 2. And b is the effect on MTSS Implementation of Administrative Leadership after controlling for SWIFT TA.
Although it is preferred to meet all three conditions to test the mediation effect, a consensus exists among statisticians that the total effect condition (i.e., Step 1) is not necessary and should not block tests of mediation, and some researchers have tested mediation effect based on other two conditions only (Hayes, 2009; Kenny, Kashy, & Bolger, 1998; Shrout & Bolger, 2002). Frazier et al. (2004) provided several conditions of mediation effect without a significant relationship between the independent and dependent variables, including a research design issue in which the independent variable occurs much earlier than the dependent variable (Shrout & Bolger, 2002). Therefore, current study placed more focus on the indirect effect and direct effect.
A bootstrapping method was employed due to its two major advantages. First, the method does not require the assumption of normal distribution for the coefficients a and b (Preacher & Hayes, 2008). Second, bootstrapping does not require a large sample size nor does it reduce power (Preacher & Hayes, 2008). Bootstrapping replaces data with a superficially large number of random samples. From the sampling distribution, it estimates the indirect effect, total effect, and direct effect, and defines a confidence interval (CI) for the bootstrapped indirect effect as within some range of percentiles. In the current study, the significance of paths was tested with a confidence level set at 0.95 and bootstrap bias-corrected (BC) samples set at 5,000 (Preacher & Hayes, 2004). The criteria for a good model fit to the data were nonsignificant χ2, comparative fit index (CFI) ⩾ .95, and root mean square error of approximation (RMSEA) ⩽ .06 (Hu & Bentler, 1999; Schreiber, Nora, Stage, Barlow, & King, 2006).
Results
Improvement on Administrative Leadership and MTSS
Overall SWIFT implementation fidelity measured by SWIFT-FIT improved from 40.6% (fall 2013) to 56.8% (spring 2015). The aggregate SWIFT-FIT data comparison revealed that scores of the two features in the Administrative Leadership domain—strong and engaged site leadership and strong educator support system—were initially high and made a relatively large improvement. In contrast, features in the MTSS domain—Inclusive Academic Instruction and Inclusive Behavior Instruction—had initially poor scores and showed lower improvements compared with the other features (see Figure 3). Site Leadership made a relatively large improvement from fall 2013 (M = 54.4%, SD = 0.24) to spring 2015 (M = 73.4%, SD = 0.18), as did Educator Support System (baseline: M = 58.6%, SD = 0.21; spring 2015: M = 77.4%, SD = 0.18). The features in the MTSS domain, however, showed minimal improvement. Academic MTSS, especially, showed the least improvement compared with the other features (baseline: M = 38.6%, SD = 0.16; spring 2015: M = 44.1%, SD = 0.20). Behavior MTSS improvement was also relatively low (baseline: M = 29.5%, SD = 0.21; spring 2015: M = 41.4%, SD = 0.21). The scoring pattern across SWIFT features remained almost the same in spring 2015 from baseline assessments. Feature scores on Administrative Leadership remained higher than most other subscale scores, and MTSS remained lower than most others.

SWIFT-FIT feature score changes between the baseline (fall 2013) and the spring 2015.
SWIFT TA Impact on Administrative Leadership and MTSS
The results of descriptive TA Log data analyses showed that for the first 2 years of SWIFT TA, SWIFT implementation activities were more frequently labeled as “exploration” and “foundation,” the initial stages of implementation science (Fixsen et al., 2015), than were “feature-specific” or “implementation capacity.” Table 1 summarizes the type and number of TA activities delivered to schools preceding the spring 2015 assessments. About seven exploration and foundation-related TA activities on average were delivered per school. Foundational TA activities included, but were not limited to, introduction of SWIFT domains and features and SWIFT tools (e.g., SWIFT-FIT, MTSS Starter Kit), baseline administration of SWIFT-FIT, and facilitation of visioning and data review activities to set and prioritize goals. Relatively fewer SWIFT feature-specific TA activities were delivered during this period. Each school received about two feature-specific TA activities on average for a total of 125. Among feature-specific TA activities, features in the MTSS domain were specified more frequently than any other feature. A total of 66 TA activities were devoted to Behavior MTSS, and 58 activities were targeted to Academic MTSS. The next most frequent feature-specific TA activities related to Administrative Leadership features.
TA Delivered to 59 Schools in the First Two Implementation Years.

Note. TA = technical assistance; MTSS = multitiered system of support; LEA = local educational agencies.
Separate repeated measure ANOVAs with between-subject factors and Kruskal–Wallis H tests were conducted to examine the significance of differences in SWIFT-FIT feature score improvements between schools that received feature-specific TA and those that did not receive feature-specific TA. For the Site Leadership feature, SWIFT-FIT data were transformed using the arcsine square root transformation formula to normalize the variance (Gomez & Gomez, 1984). The results indicated that the main group effect (i.e., TA received or not) was not significant, F(1, 57) = 2.77, p = .10, showing that there was no overall difference in two groups regardless of time. There was, however, a significant time effect in Site Leadership indicating that both groups improved over time, F(1, 57) = 44.45, p < .001. Moreover, the interaction between time and group was significant, F(1, 57) = 6.57, p < .05, which means that the group of schools that received TA for Site Leadership made greater improvement than those that did not. Nonparametric Kruskal–Wallis H tests were employed for other SWIFT features due to the violation of normality assumption in the repeated measure ANOVA. Results showed that greater improvements in SWIFT-FIT scores were observed for the schools that received feature-specific TA than those that did not, across the Educational Support System and MTSS features; however, no statistically significant group effects were found. Table 2 provides descriptive statistics, repeated ANOVA, and Kruskal–Wallis H test results.
Descriptives, RM ANOVA, and Kruskal–Wallis H Test Results.

Note. SWIFT-FIT = Schoolwide Integrated Framework for Transformation–Fidelity of Implementation Tool; MTSS = multitiered system of support; TA = technical assistance; RM = repeated measure; SY = school year.
p < .05. **p < .01
In summary, results of the SWIFT-FIT feature score and TA log data analysis showed that more TA was provided to improve MTSS and Administrative Leadership domains than other domains during the first two implementation years. However, meaningful SWIFT-FIT score improvements were observed only in features of the Administrative Leadership domain, while feature score improvements in the MTSS domain were relatively small. When the SWIFT-FIT score improvements were compared between schools that received feature-specific TA and those that did not, SWIFT TA for the Site Leadership feature accounted for the significant differences between the two school groups. However, SWIFT TA for MTSS did not result in statistically significant differences for its associated features.
The Mediation Effects of Administrative Leadership
Our hypothesis was that Administrative Leadership mediates the relationship between SWIFT TA for MTSS and MTSS Implementation. The multivariate assumptions were tested with outliers and multicollinearity. The results of Cook’s distance demonstrated no serious outliers and influential points among variables. The multicollinearity statistics results revealed that tolerance values for all independent and mediator variables were above 0.8, which is above the required minimum value of 0.1 (Hair, Black, Babin, & Anderson, 2010). Their variance inflation factors (VIFs) were between 1.1 and 1.3, which are far less than 10, indicating the collinearity is negligible (Hair et al., 2010). Those results showed that they were free from multicollinearity problems. Table 3 presents correlations and descriptive statistics for the relationships among SWIFT TA, Administrative Leadership, and MTSS Implementation.
Correlations, Means, and Standard Deviations of Variables (N = 59).

Note. SWIFT = Schoolwide Integrated Framework for Transformation; TA = technical assistance; MTSS = multitiered system of support.
p < .05. **p < .01.
The SEM model had a very good fit to the observed data on the following fit indices: χ2(3) = 0.49, p = .92; CFI = 1.0; Tucker–Lewis index (TLI) = 1.1; RMSEA = 0.0, p = .94, 90% CI = [0.000, 0.075]. The results indicated that the mediation effect of Administrative Leadership occurred on the both Academic and Behavior MTSS Implementation. Figure 4 provides the path model testing the mediation effect of Administrative Leadership between SWIFT TA for MTSS and MTSS Implementation with standardized regression coefficients for each path.

Path model testing the mediation effects of Administrative Leadership between SWIFT TA for MTSS and MTSS implementation.
In the model, 37% of the variance in Behavior MTSS Implementation and 39% in Academic MTSS Implementation were explained. The total effect of SWIFT TA for Academic MTSS on Academic MTSS Implementation was significant (β = .32, p < .05, BC 95% CI = [0.057, 0.539]); however, SWIFT TA for Behavior MTSS on Behavior MTSS Implementation was not significant (β = .17, p = .097, BC 95% CI = [–0.03, 0.362]). SWIFT TA for Behavior MTSS had a significant indirect effect on Behavior MTSS Implementation through Administrative Leadership (β = .19, p < .01, BC 95% CI = [0.073, 0.341]), as the path coefficient for the direct effect of SWIFT TA for Behavior MTSS to Behavior MTSS Implementation was nonsignificant (β = −.03, p = .81). Both paths for indirect effect were significant (SWIFT TA for Behavior MTSS to Administrative Leadership: β = .31, p < .05; Administrative Leadership to Behavior MTSS Implementation: β = .62, p < .001). SWIFT TA for Academic MTSS also had a significant indirect effect on Academic MTSS Implementation through Administrative Leadership (β = .16, p < .05, BC 95% CI = [0.034, 0.319]), while no statistical significance was found in the path for a direct effect (β = .16, p = .15). The indirect effect paths were significant for both (SWIFT TA for Academic MTSS to Administrative Leadership: β = .29, p < .05; Administrative Leadership to Academic MTSS Implementation: β = .54, p < .001).
For Academic MTSS, a full mediation of Administrative Leadership occurred since the total effect and indirect effect were significant, but direct effect was not significant in the model, which satisfied all required conditions for a full mediation effect. Behavior MTSS failed to meet all conditions since total effect of SWIFT TA for Behavior MTSS was not significant; however, it is legitimate to conclude that Administrative Leadership mediated the relationship between SWIFT TA for Behavior MTSS and Behavior MTSS Implementation because total effect condition can be ignored (Hayes, 2009; Kenny et al., 1998; Shrout & Bolger, 2002). All other conditions (i.e., significant indirect effect and nonsignificant direct effect) of Administrative Leadership mediation in the relationship between SWIFT TA for Behavior MTSS and Behavior MTSS Implementation were met for full mediation. In addition, the SEM results showed that covariance between behavior and academic SWIFT TA variables was significant (converted to r = .35) in the model. The results also revealed significant indirect effects of SWIFT TA for Behavior MTSS on Academic MTSS Implementation (β = .17, p < .01, BC 95% CI = [0.062, 0.288]) and SWIFT TA for Academic MTSS on Behavior MTSS Implementation (β = .18, p < .05, BC 95% CI = [0.041, 0.353]) through Administrative Leadership.
Discussion
The present study investigated relationships among TA, school leadership, and MTSS. The implementation fidelity measure showed schools made relevant improvements on the Administrative Leadership domain; however, scores for academic and behavior MTSS features showed smaller changes even with a larger amount of implementation efforts directed to those features during the first 2 years. We found a statistically significant difference between schools that received TA for the Site Leadership feature (within the Administrative Leadership domain) and those that did not. Conversely, we found no significant difference between recipient and nonrecipient schools of feature-specific TA on MTSS. The results of SEM showed that the relationship between TA for MTSS and MTSS implementation was mediated by Administrative Leadership. The finding also indicated that TA for academic and behavior MTSS are significantly related, and TA in one area of MTSS can indirectly affect the other area through school leadership.
The mediation effect of Administrative Leadership was observed in MTSS implementation, with the effect being slightly larger for Behavior MTSS (b = 0.19) than Academic MTSS (b = 0.16). This finding can be interpreted as Administrative Leadership plays a more important role for the former than for the latter. Insufficient evidence exists to draw conclusions, but the difference might be due to relatively lower initial implementation status. The baseline Behavior MTSS feature SWIFT-FIT score (29%) was lower than Academic MTSS (39%), which was second lowest among the features. For the baseline, five schools (8%) lacked any Behavior MTSS components and they scored 0 on SWIFT-FIT for this feature. Forty schools (68%) lacked a universal (Tier I) behavior support system with fidelity or its fidelity was not measured. Fifty-three schools (90%) lacked any data-based behavior screening process. These schools used neither a behavior screening tool nor office discipline referral data to identify students who needed more intensive support. In contrast, many schools already had some levels of Academic MTSS, especially in reading instruction.
The low initial scores and relatively small improvement on MTSS features are consistent with findings from other investigations of MTSS. Operational transformation is a slow, arduous process in schools, indicative of a complete cultural shift in practice (McIntosh & Goodman, 2016). The mediation effect demonstrates the important role of Administrative Leadership in the process of school transformation. To install, implement, and sustain a complex system like MTSS, these findings suggest that even when TA is targeted to MTSS, meaningful change might not occur without the mediation of high-quality school leadership. The relationship between academic and behavior MTSS TA found in this study might be the result of shared components of these two arms of MTSS (Sugai & Horner, 2009). Perhaps school leadership quality that leads to MTSS implemented with fidelity in one area (e.g., academic) can accelerate MTSS implementation in the other area (e.g., behavior). Because MTSS has become an important practice in federal and state policy directives as well as inclusive educational praxis, these findings have import for related TA provider systems. Of particular importance is that these findings show MTSS implementation requires a slow transformational process relative to its supportive scaffolding components, such as Administrative Leadership, and that attention to mediating factors in installation, rather than TA directed solely to the mechanics of MTSS installation, is important.
The present study was conducted in the context of transformational school reform, with whole-system engagement including LEAs and SEAs. SWIFT’s theory of action positions the LEA as the point of intervention to build sustainable outcomes, while the SEA helps the LEA to build its capacity to be a primary source of technical support to sustain the framework at the level of schools (McCart et al., 2016). This whole approach enables schools to access and work with higher level agencies to install MTSS components efficiently and with a goal of sustainability. School installation and implementation of MTSS is likely, for example, to need support from its LEA for such actions as (a) selection of evidence-based curricula for universal instruction and interventions, (b) support of well-trained interventionists for additional and intensive interventions, (c) services and training for data-based decision making, and (d) support and monitoring of intervention fidelity. Higher level agency (LEA or regional entity) support may be essential for school transformation. Without ongoing multilevel alignment, the school is likely to be largely affected by the lack of ability to change the system and thus less likely to realize the positive student-level gains research has shown to be associated with MTSS transformation (McIntosh & Goodman, 2016).
The present findings are consistent with extant literature and provide further evidence for the importance of school leadership in systemic transformation. The definition of Administrative Leadership in the SWIFT framework incorporates the demonstration of leadership for effective inclusive education. McLeskey and Waldron (2015) pointed out that core values, such as shared vision, cannot be mandated or prescribed to educators. Instead, core values need to be cultivated by building trust, which can be demonstrated through (a) building relationships and displaying trust, (b) engaging educators in shared decision making, and (c) obtaining and providing resources to support educators. The two features in the Administrative Leadership domain, Site Leadership and Educator Support, coincide with the relationship/trust building components, which serve as a cornerstone of effective inclusive education. The findings in the present study suggest that school leadership serves as a backbone of MTSS. MTSS, as a domain of the SWIFT framework, drives equitable inclusive education by guiding evidence-based practices and instruction and by creating a framework for multilevel support based on student learning needs without regard to disability, cultural background, or linguistic needs. For school reform efforts that install or integrate academic and behavior MTSS to enhance equity and education for all students, monitoring fidelity of implementation including Administrative Leadership components would be critical.
Limitations and Future Research
All TA efforts need to be analyzed in various ways to understand their cumulative effects on school systems change. In the present study, SWIFT TA activities delivered to schools were analyzed. Given the theory of action that positions higher level agencies (LEA and/or SEA) as critical players for schools to attain sustainable change, some SWIFT TA targeted both the school and the higher level agencies together, and some TA activities were delivered to an LEA or SEA only. In the latter case, those data were excluded because SWIFT-FIT measured school attributes and the school was the unit of analysis in the present study. SWIFT TA delivered solely to increase LEA capacity to provide support, however, might well exert a positive influence on MTSS implementation in schools. Further analyses will need multilevel investigations with larger sample sizes to address this issue.
The findings in the present study were investigated with the initial stage of MTSS implementation. A longitudinal study would be beneficial to understand the features of MTSS implementation that enhance MTSS status to the maximum extent possible and with the greatest efficiency. For example, data from a District Capacity Assessment (DCA; Ward et al., 2015), which examines LEA capacity to provide ongoing support, could be included in future analyses to examine higher administrative-level effects on MTSS installation.
Finally, a future study with a larger sample size is needed to verify these findings. Bootstrapping can be applied even with small sample size in the range of 20 to 80 cases (Preacher & Hayes, 2004; Shrout & Bolger, 2002); however, some methodologists have expressed concerns about insufficient power and a tendency to exhibit an inflated Type I error rate when bootstrapping is used to test mediation in small samples (Koopman, Howe, Hollenbeck, & Sin, 2015). A larger sample size would deliver a more reasonable level of power.
Conclusion
This study of the influence of a particular TA model on school leadership and the implementation of MTSS to improve outcomes for all students, including students with disabilities and students classified in racial, linguistic, and socioeconomic subgroups, highlights the importance of a broad approach to bringing about desired changes. Others have demonstrated that MTSS is a driver for delivering equitable inclusive education. This study, however, highlights the significant mediating effects of high-quality school leadership on installing academic and behavioral MTSS. Moreover, it highlights the complexity and resultant difficulty in instantiating and fully implementing transformational school reform efforts such as MTSS.
Footnotes
Authors’ Note
Grace Zamora Duran and Tina Diamond serve as the Office of Special Education Programs project officers. The views expressed herein do not necessarily represent the positions or policies of the U.S. Department of Education. No official endorsement by the U.S. Department of Education of any product, commodity, service, or enterprise mentioned in this publication is intended or should be inferred.
Declaration of Conflicting Interests
The author(s) declared no potential conflicts of interest with respect to the research, authorship, and/or publication of this article.
Funding
The author(s) disclosed receipt of the following financial support for the research, authorship, and/or publication of this article: This article was produced under U.S. Department of Education, Office of Special Education Programs Grant No. H326Y120005, University of Kansas.