
Abstract
The least restrictive environment (LRE) mandate suggests a preference for educating students with disabilities in general education settings provided their needs can be met there. This study examined national trends in the educational placements of students with disabilities ages 6 to 17 in the 50 states and the District of Columbia from 1990 through 2015. Data were retrieved electronically from the U.S. Department of Education and the U.S. Census Bureau websites. Cumulative placement rates were then calculated. Findings indicate that from 1990 through 2015, (a) general education placements increased while more restrictive placements decreased, (b) students in secondary schools continued to be placed in more restrictive settings, and (c) the impact of disability categories on national LRE trends varied. Future research is needed to investigate the effect of increased identification rates in specific disability categories on national placement trends and explore how placement practices vary across schools, districts, and states.
Keywords
Introduction
Historically, students with disabilities were clustered in separate classrooms for instruction by disability category (Crockett, 2014). As early as the 1960s, scholars and advocates began to question the effectiveness of placing students by categories in separate class and school settings (Deno, 1970; Dunn, 1968; Goldstein, Moss, & Jordan, 1965; Johnson, 1962). In the 1970s, right-to-education cases emerged that included the presumption that students with disabilities be educated alongside their typically developing peers (Crockett, 2014). Subsequently, Congress passed the Education for All Handicapped Children Act (EHA, 1975), which included a mandate that students with disabilities receive a free appropriate public education in the least restrictive environment (LRE). This mandate is currently included in the Individuals with Disabilities Education Improvement Act (IDEA, 2004) and states, To the maximum extent appropriate, children with disabilities, including children in public or private institutions or other care facilities, are educated with children who are not disabled, and special classes, separate schooling, or other removal of children with disabilities from the regular educational environment occurs only when the nature or severity of the disability of a child is such that education in regular classes with the use of supplementary aids and services cannot be achieved satisfactorily. (IDEA, 2004, sec. 1412(a)(5)(A)
The LRE mandate provides a clear preference for educating students with disabilities in general education (GE) settings unless the individual needs of students cannot be met in these settings with the use of supplementary aids and services. Thus, schools must ensure that students are given opportunities to make adequate progress in GE before they are moved to more restrictive settings (Hyatt & Filler, 2011; Yell, 2016).
LRE placements have been influenced by accountability standards mandated in the No Child Left Behind Act of 2001, and later reauthorized in the Every Student Succeeds Act of 2015 (ESSA). These mandates strengthened the LRE mandate by requiring that students, including most students with disabilities, have access to the same academic content and achievement standards as their peers (McLeskey, Rosenberg, & Westling, 2018). Collectively these mandates have resulted in progressive movement toward the placement of students with disabilities in less restrictive settings over the past four decades (McLeskey, Landers, Williamson, & Hoppey, 2012; Reynolds & Birch, 1977).
While most scholars and practitioners agree with LRE in principle, controversy regarding the interpretation of this mandate in practice has persisted (Crockett, 2014; McLeskey et al., 2012). Some have argued that placements should primarily emphasize access to the GE curriculum and socialization with peers, whereas others have argued that student learning outcomes and program effectiveness are most important (McLeskey et al., 2012). This has resulted in some advocates who have argued that LRE is always the GE classroom (Jackson, Ryndak, & Wehmeyer, 2008), whereas others have contended that an overemphasis on where students are educated does not adequately consider the importance of instructional quality and student outcomes (Fuchs & Fuchs, 1994; Kauffman, 1993; McLeskey, 2007). Nonetheless, given that LRE is mandated, investigating where students with disabilities are educated is warranted.
McLeskey and his colleagues (2012) examined LRE data for all students with disabilities from 1990 through 2007. Data from that 18-year period revealed that placements in less restrictive settings increased substantially, as placements in more restrictive settings decreased. Much of this change was accounted for by placements of students with learning disabilities (LDs) in less restrictive settings. This investigation also found that while students at both elementary and secondary levels moved toward placements in less restrictive settings, this trend was substantially greater for secondary students.
The LRE mandate continues to be controversial (Crockett, 2014). Thus, the current investigation reexamines and extends the work conducted by McLeskey and his colleagues (2012) to examine the influence of LRE across the past 25 years. We suggest that by including this time frame, we can compare three points in time (i.e., 1990, 2007, 2015) to reveal a clearer picture of the current state of LRE across the United States. More specifically, the study addressed the following research questions: (a) How have national placement trends for all students with disabilities changed over the past 25 years (i.e., 1990–2015)? (b) How did placement trends for elementary (ages 6–11) and secondary (ages 12–17) students with disabilities influence national placement trends? (c) How did particular disability categories (i.e., autism, emotional behavioral disorders, intellectual disability [ID], LDs, other health impairments [OHIs], and speech/language impairments) influence national placement trends?
Method
Data Sources
As required under Section 618, Part B of IDEA, state education agencies (SEAs) are required to collect and report the numbers of students with disabilities in the categories listed in IDEA and the educational environment where these students receive instruction. These data are published in the annual Reports to Congress on the Implementation of the Individuals with Disabilities Education Act (U.S. Department of Education, 2016b). One purpose of these reports is to provide Congressional oversight of states’ implementation of Part B of IDEA, which presumes that students with disabilities should be educated in the LRE. States are currently required to report the number of students in each educational environment, or placement, for students in all disability categories. It is important to note that through 2005, states were required to report LRE data in terms of percentage of the day a student spends outside the GE classroom (e.g., educated outside GE for 21% to 60% of the school day); whereas beginning in 2006, states were required to report LRE data in terms of percentage of the day a student spends inside the GE classroom (e.g., educated inside the GE classroom for 40% to 79% of the school day). This change was thought to improve the reliability of data reporting. For the purposes of this investigation as shown in Table 1, we elected to use labels previously used by McLeskey and his colleagues (2012) that are more commonly used in schools and the professional literature to describe educational placements that still are consistent with definitions provided by the U.S. Department of Education through the IDEA Data Center (IDC; U.S. Department of Education, 2009). When students are educated 80% of the time or more in regular education, we use the term general education. For students who are educated inside the regular classroom between 40% and 79% of the school day, we use the term pullout. For students who are educated in the regular education classroom for less than 40% of the day, we use the term separate class, and for students who are educated in separate schools, residential facilities, homebound/hospital, correctional facilities, and parentally placed private schools, we use the term separate school.
Placement Setting Definitions.
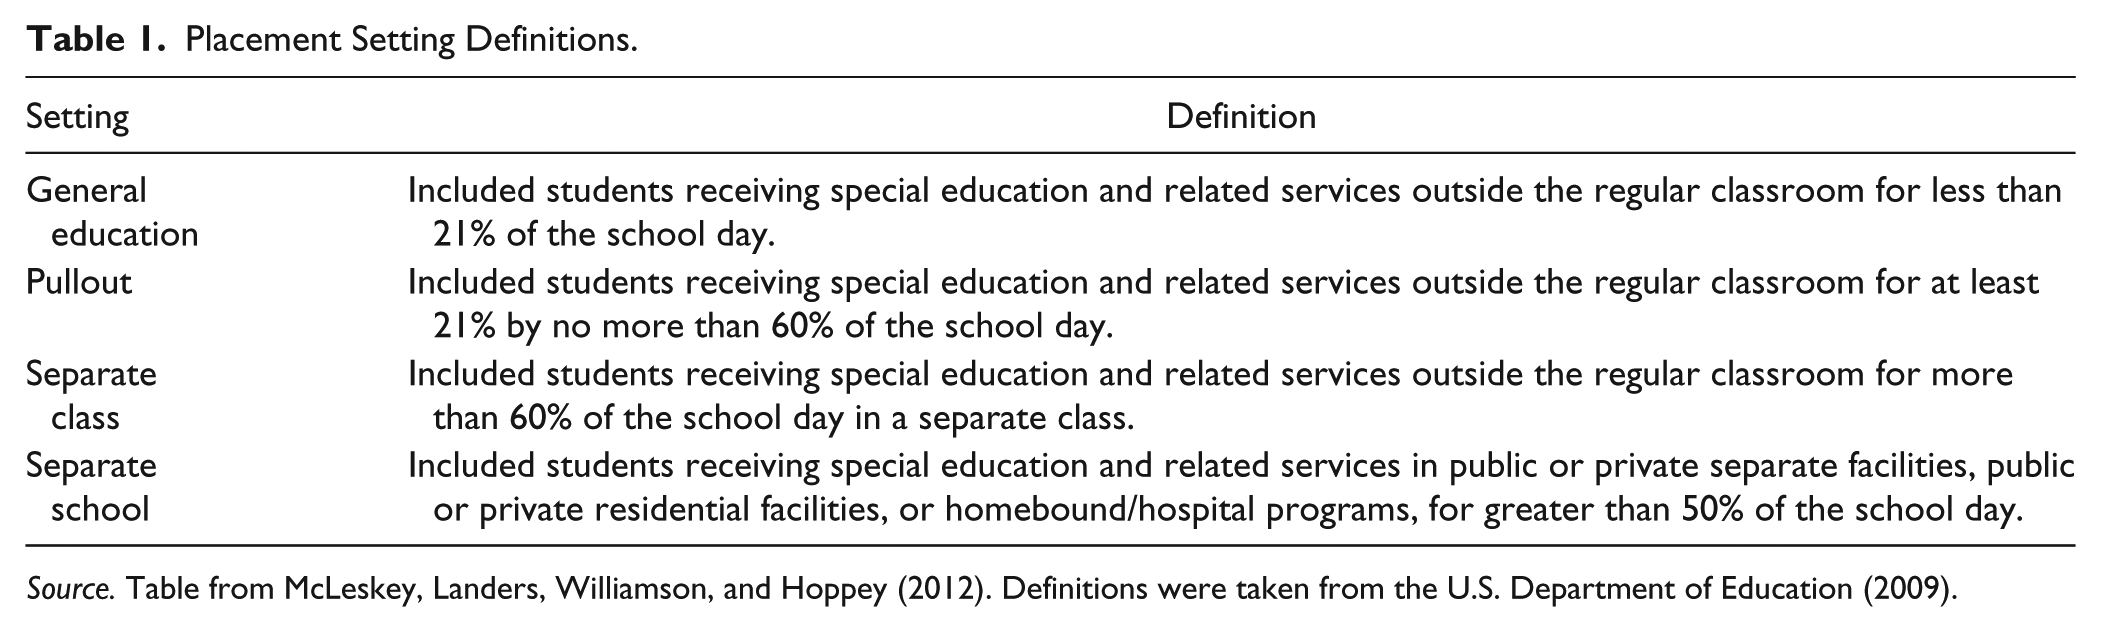
Source. Table from McLeskey, Landers, Williamson, and Hoppey (2012). Definitions were taken from the U.S. Department of Education (2009).
Data for this study were retrieved electronically from the U.S. Department of Education (2016a) website and from the U.S. Census Bureau (n.d.). We included all placement data for students with disabilities aged 6 to 17 from all 50 states and the District of Columbia and obtained the total resident population of students aged 6 to 17 from the Census Bureau. While these data are considered to be the most reliable data available regarding educational placements, the data are not without limitations (McLeskey et al., 2012; National Research Council, 2002). Thus, it is important to note that in 2016, Wisconsin’s data were flagged due to questionable data quality. As has been done for past reports, it is expected that Wisconsin will resubmit a corrected report. Given that the Wisconsin data would be unlikely to influence national trends, we have elected to present the data through 2015 to enable comparisons with earlier, published investigations. In addition, it is important to note that data were not collected for students with autism spectrum disorder (ASD) as a separate category until 1991 and that during that year only 30 states reported data. All data were exported into spreadsheets for analysis and crosschecked by members of the research team to ensure accuracy. During this process, one error was found and corrected (i.e., incorrect formula embedded in the spreadsheet).
Data Analysis
To analyze these data, cumulative placement rate (CPR) was used. This statistic has been used in previous studies of placement practices for students with disabilities (e.g., Danielson & Bellamy, 1989; McLeskey, Henry, & Axelrod, 1999; McLeskey, Hoppey, Williamson, & Rentz, 2004; McLeskey, Landers, Hoppey, & Williamson, 2011; McLeskey et al., 2012; Williamson, McLeskey, Hoppey, & Rentz, 2006). To calculate the CPR, the total number of students in a given placement setting is divided by the total resident population of school-aged children and multiplied by 1,000. The result thus indicates the number of students per 1,000 students who are educated in a given placement. This method allows changes in overall identification rates to be taken into account and simplifies interpretation of the results, whereas methods such as those used in the Reports to Congress provide only percentages of increase in settings without consideration of the impact that identification of students has on placement practices (McLeskey et al., 2012).
To investigate influences on national trends, we replicated the method used by McLeskey and his colleagues (2012). We examined subgroups of these data, including (a) placement data by age (i.e., ages 6–11 and 12–17) and (b) disability categories. This included LDs, ID, emotional/behavioral disorders (EBDs), OHIs, specific language impairments (SLIs), and autism (ASD).
Results
National Placement Trends Across All Disabilities
Table 2 provides CPRs for placement settings and overall identification of students with disabilities by year from 1990 to 2015, whereas Figure 1 graphically illustrates national placement trends. An examination of Figure 1 reveals an overall pattern of increasing placements in GE settings between 1990 and 2015. From one year to the next, CPRs in GE increased during 23 of 25 years, declining only between 2009 and 2010, and between 2011 and 2012. Overall, placements in GE settings more than doubled between 1990 and 2015 from 33.91 to 71.65. This resulted in an increase from 34% of students with disabilities who were educated in GE in 1990 to 64% in 2015.
Cumulative Placement Rate By Year and Setting.
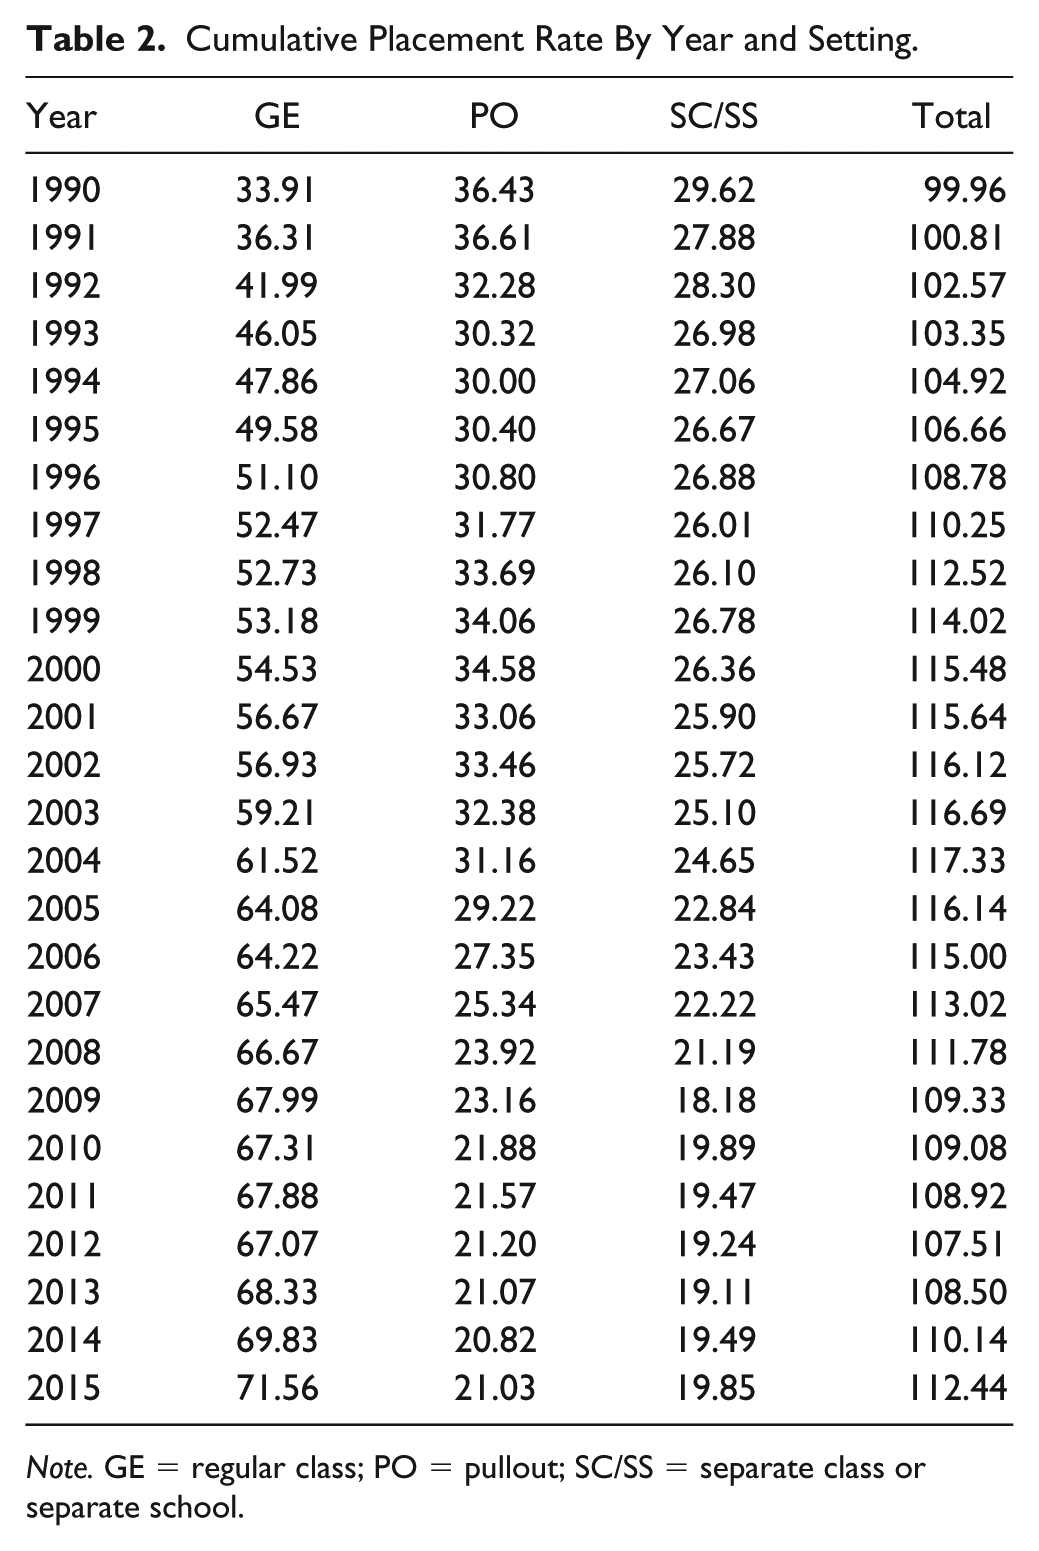
Note. GE = regular class; PO = pullout; SC/SS = separate class or separate school.
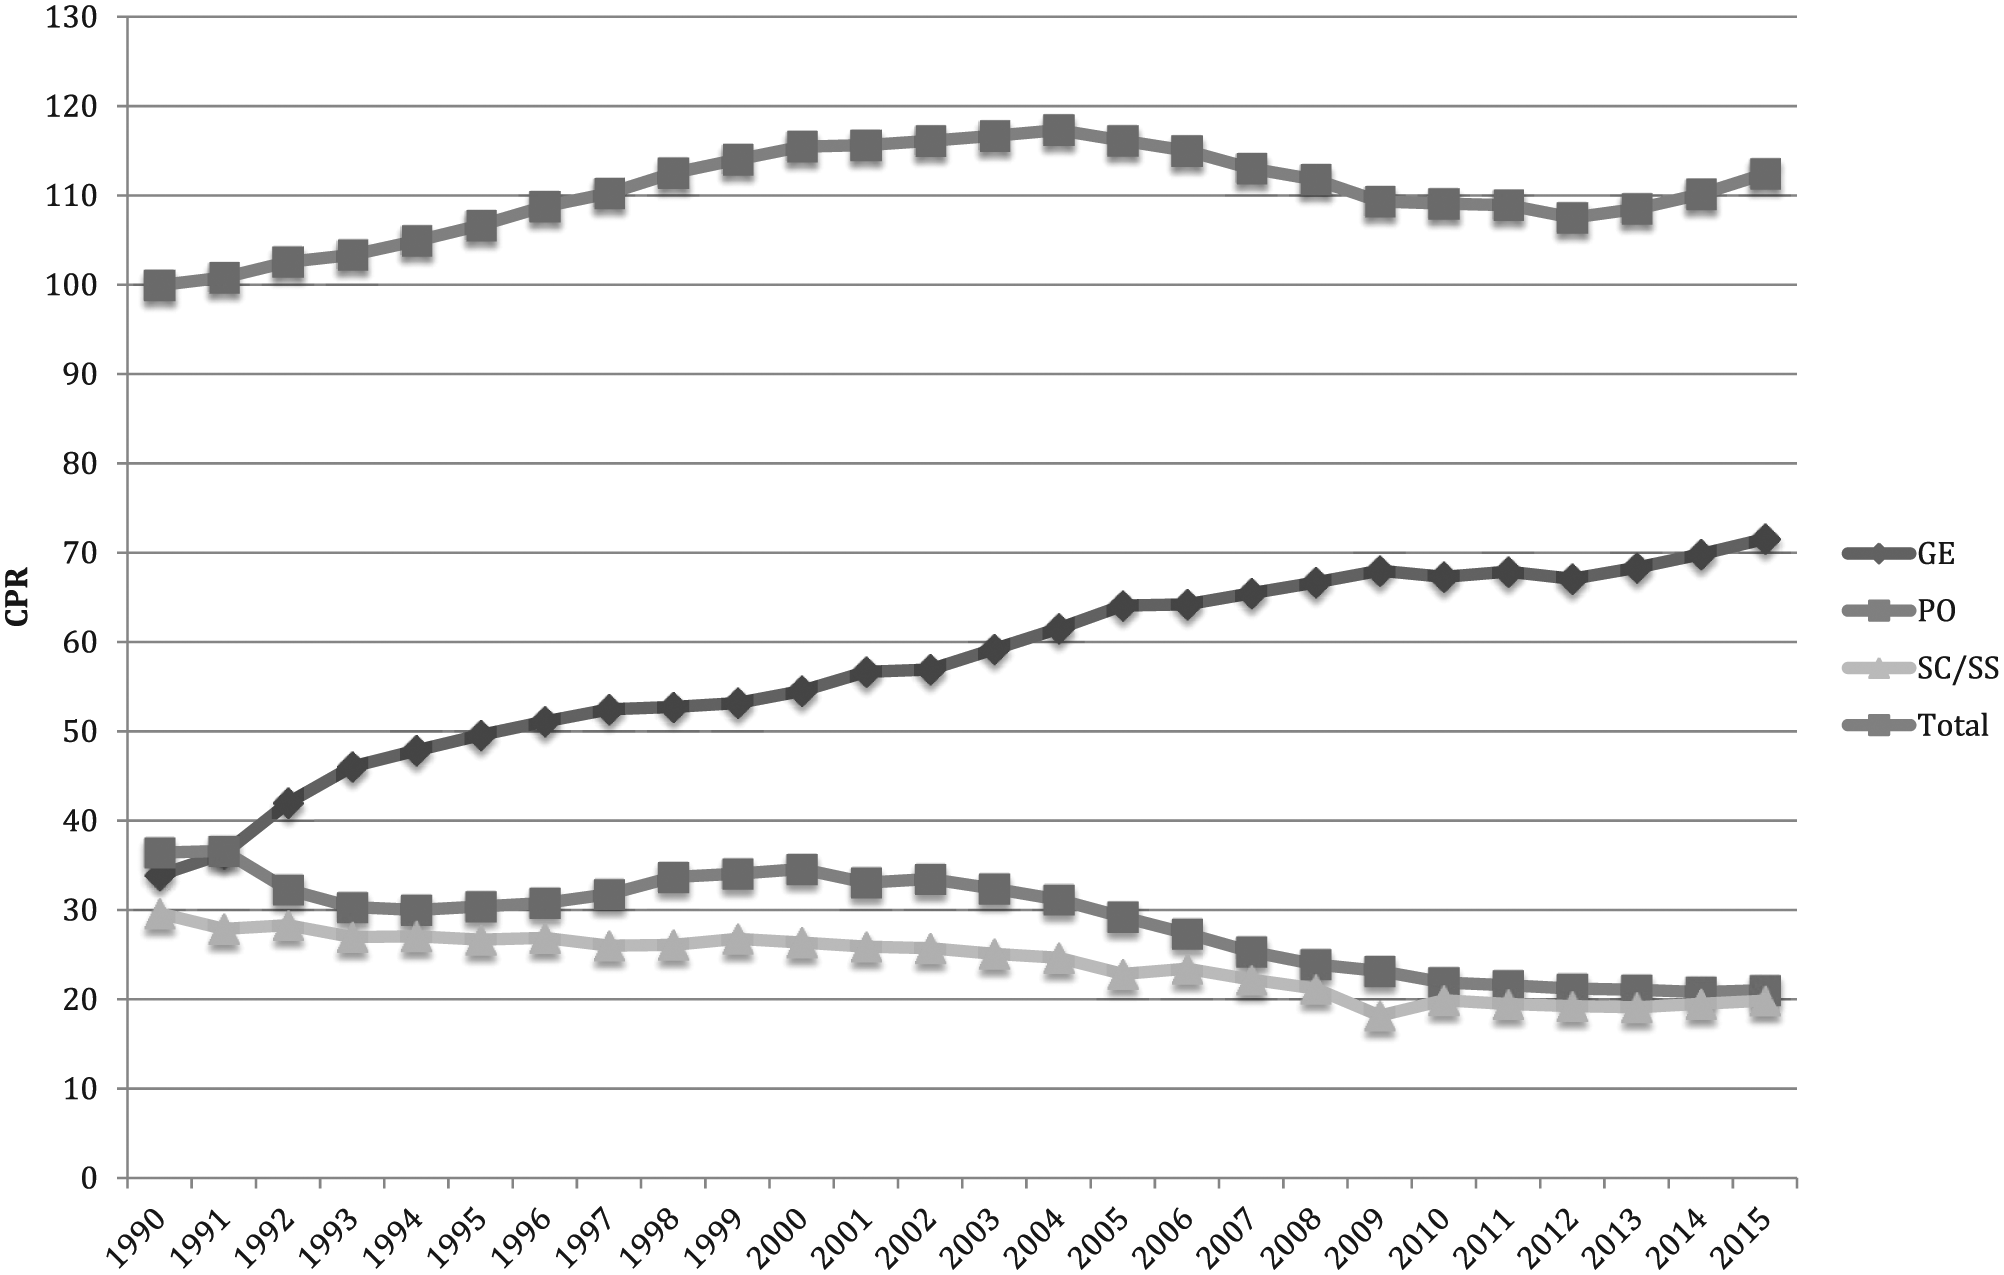
National placement trends for students with disabilities.
Figure 1 also illustrates that placement of students with disabilities in pullout settings between 1990 and 2015 decreased by 42%, from 36.43 to 21.03. This reflected a decrease from 36% of all students with disabilities who were educated in pullout settings in 1990 to 19% in 2015. The decline in these placements was less consistent than for GE, as the CPR increased 8 times between 1990 and 2002, and thereafter showed a consistent pattern of decreased placements except for a slight increase from 2014 to 2015. Finally, separate class/separate school placements followed a pattern similar to pullout settings, as overall placements declined by 33% from 29.62 to 19.85, and this decline was relatively inconsistent from year to year. In 1990, 30% of all students with disabilities were educated in these settings, compared with 18% in 2015.
A final noteworthy finding is that during the later part of the past 25 years, dramatic movement toward less restrictive placements slowed considerably. For example, prior to 2007, there was a trend toward substantially increased placements in GE settings, as the CPR changed from 33.91 in 1990 to 65.47 in 2007, an increase of 93%. In contrast, between 2007 and 2015, GE placements increased from 65.47 to 71.56, a change of only 9%. For students in pullout settings, the CPR decreased from 36.43 to 25.34 (30%) between 1990 and 2007, but only from 25.34 to 21.03 (17%) between 2007 and 2015. Similarly, for students in separate class/separate school settings, the CPR decreased from 29.62 in 1990 to 22.22 (25%) in 2007, but only from 22.22 to 19.85 (11%) between 2007 and 2015.
Factors Influencing Placement Trends
Previous research has revealed that examining differences in placement across age levels and disability categories can provide insight into factors that are most influential as changes in placement practices occur (e.g., McLeskey et al., 2012). In the following sections, we examine how changes in placement practices based on student age (elementary and secondary levels) and disability category have influenced overall placements between 1990 and 2015.
Trends by age level
To examine trends by age level, the placement practices for elementary students (i.e., aged 6–11) and secondary students (i.e., aged 12–17) in 1990, 2007, and 2015 were examined (see Table 2). These data indicate that in 1990, a substantially greater proportion of elementary students were placed in GE settings than were secondary students. This was likely influenced to some degree by an identification rate for elementary students that was about 15% higher than for secondary students. Between 1990 and 2015, the identification rate for secondary students increased at approximately 4 times the growth rate for elementary students, resulting in overall CPRs for these groups that were approximately equivalent in 2015.
Between 1990 and 2015, elementary student placements in GE settings grew by approximately 66%, whereas GE placements for secondary students grew by 235%. Changes for placements in pullout and separate class/separate school settings did not change as substantially as GE placements during this time. Placements in pullout settings for elementary students decreased by 49%, whereas similar placements for secondary students decreased by 35%. Placements in separate class/separate schools decreased by 26% for elementary students and decreased by 38% for secondary students.
It is noteworthy that much of the change in placements for elementary students occurred between 1990 and 2007 and then substantially leveled off between 2007 and 2015. While increased placements of secondary students in GE and reduced placements in pullout and separate class/separate school settings changed more substantially between 1990 and 2007, these trends continued at a lesser rate between 2007 and 2015. Finally, data in Table 3 reveal that while rates of GE placements grew more rapidly for secondary students between 1990 and 2015, these students continue to be placed in pullout settings more often and GE placements less often compared with elementary students.
Age Group Comparison by Placement Setting: 1990 and 2015.
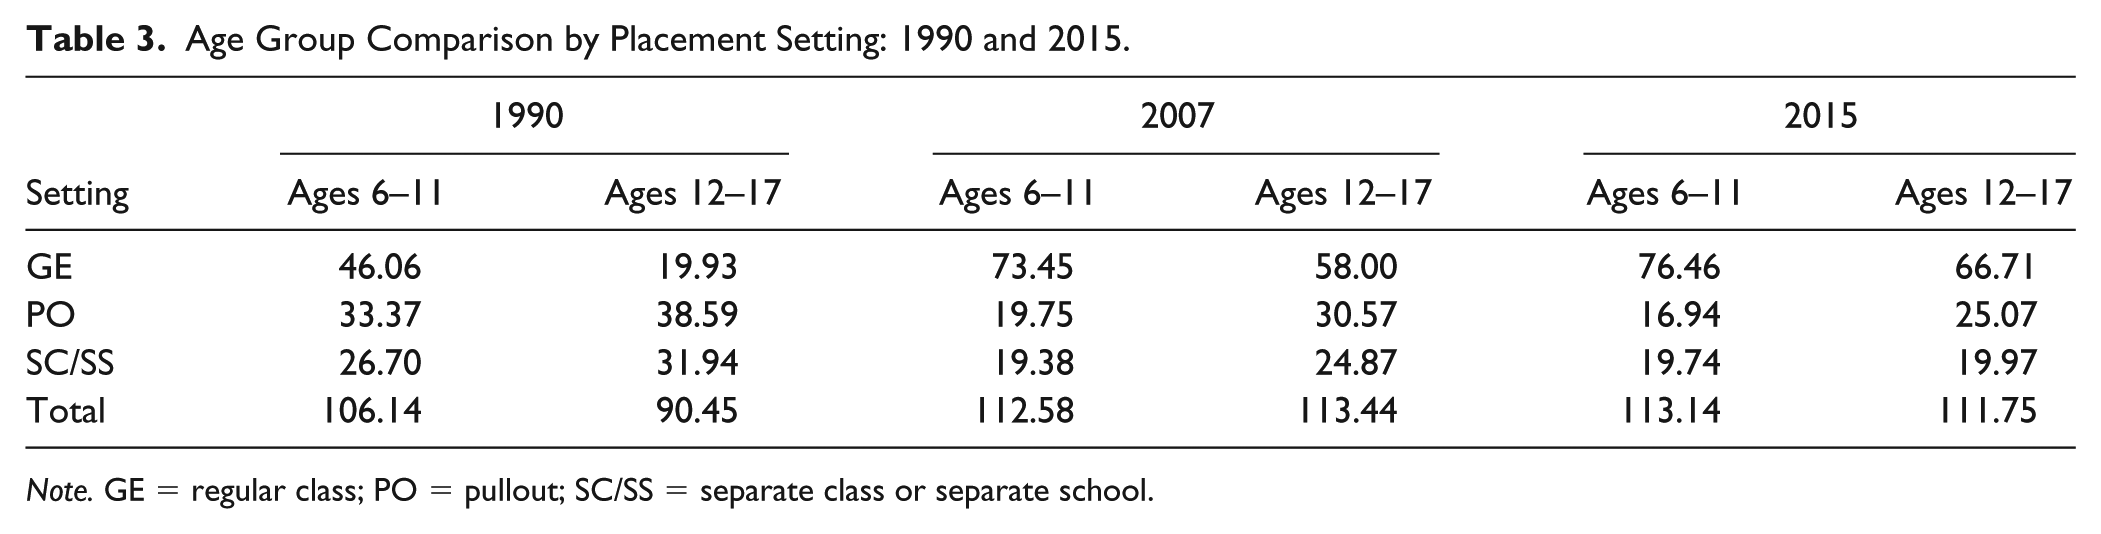
Note. GE = regular class; PO = pullout; SC/SS = separate class or separate school.
Trends in placements for students in high incidence disability categories
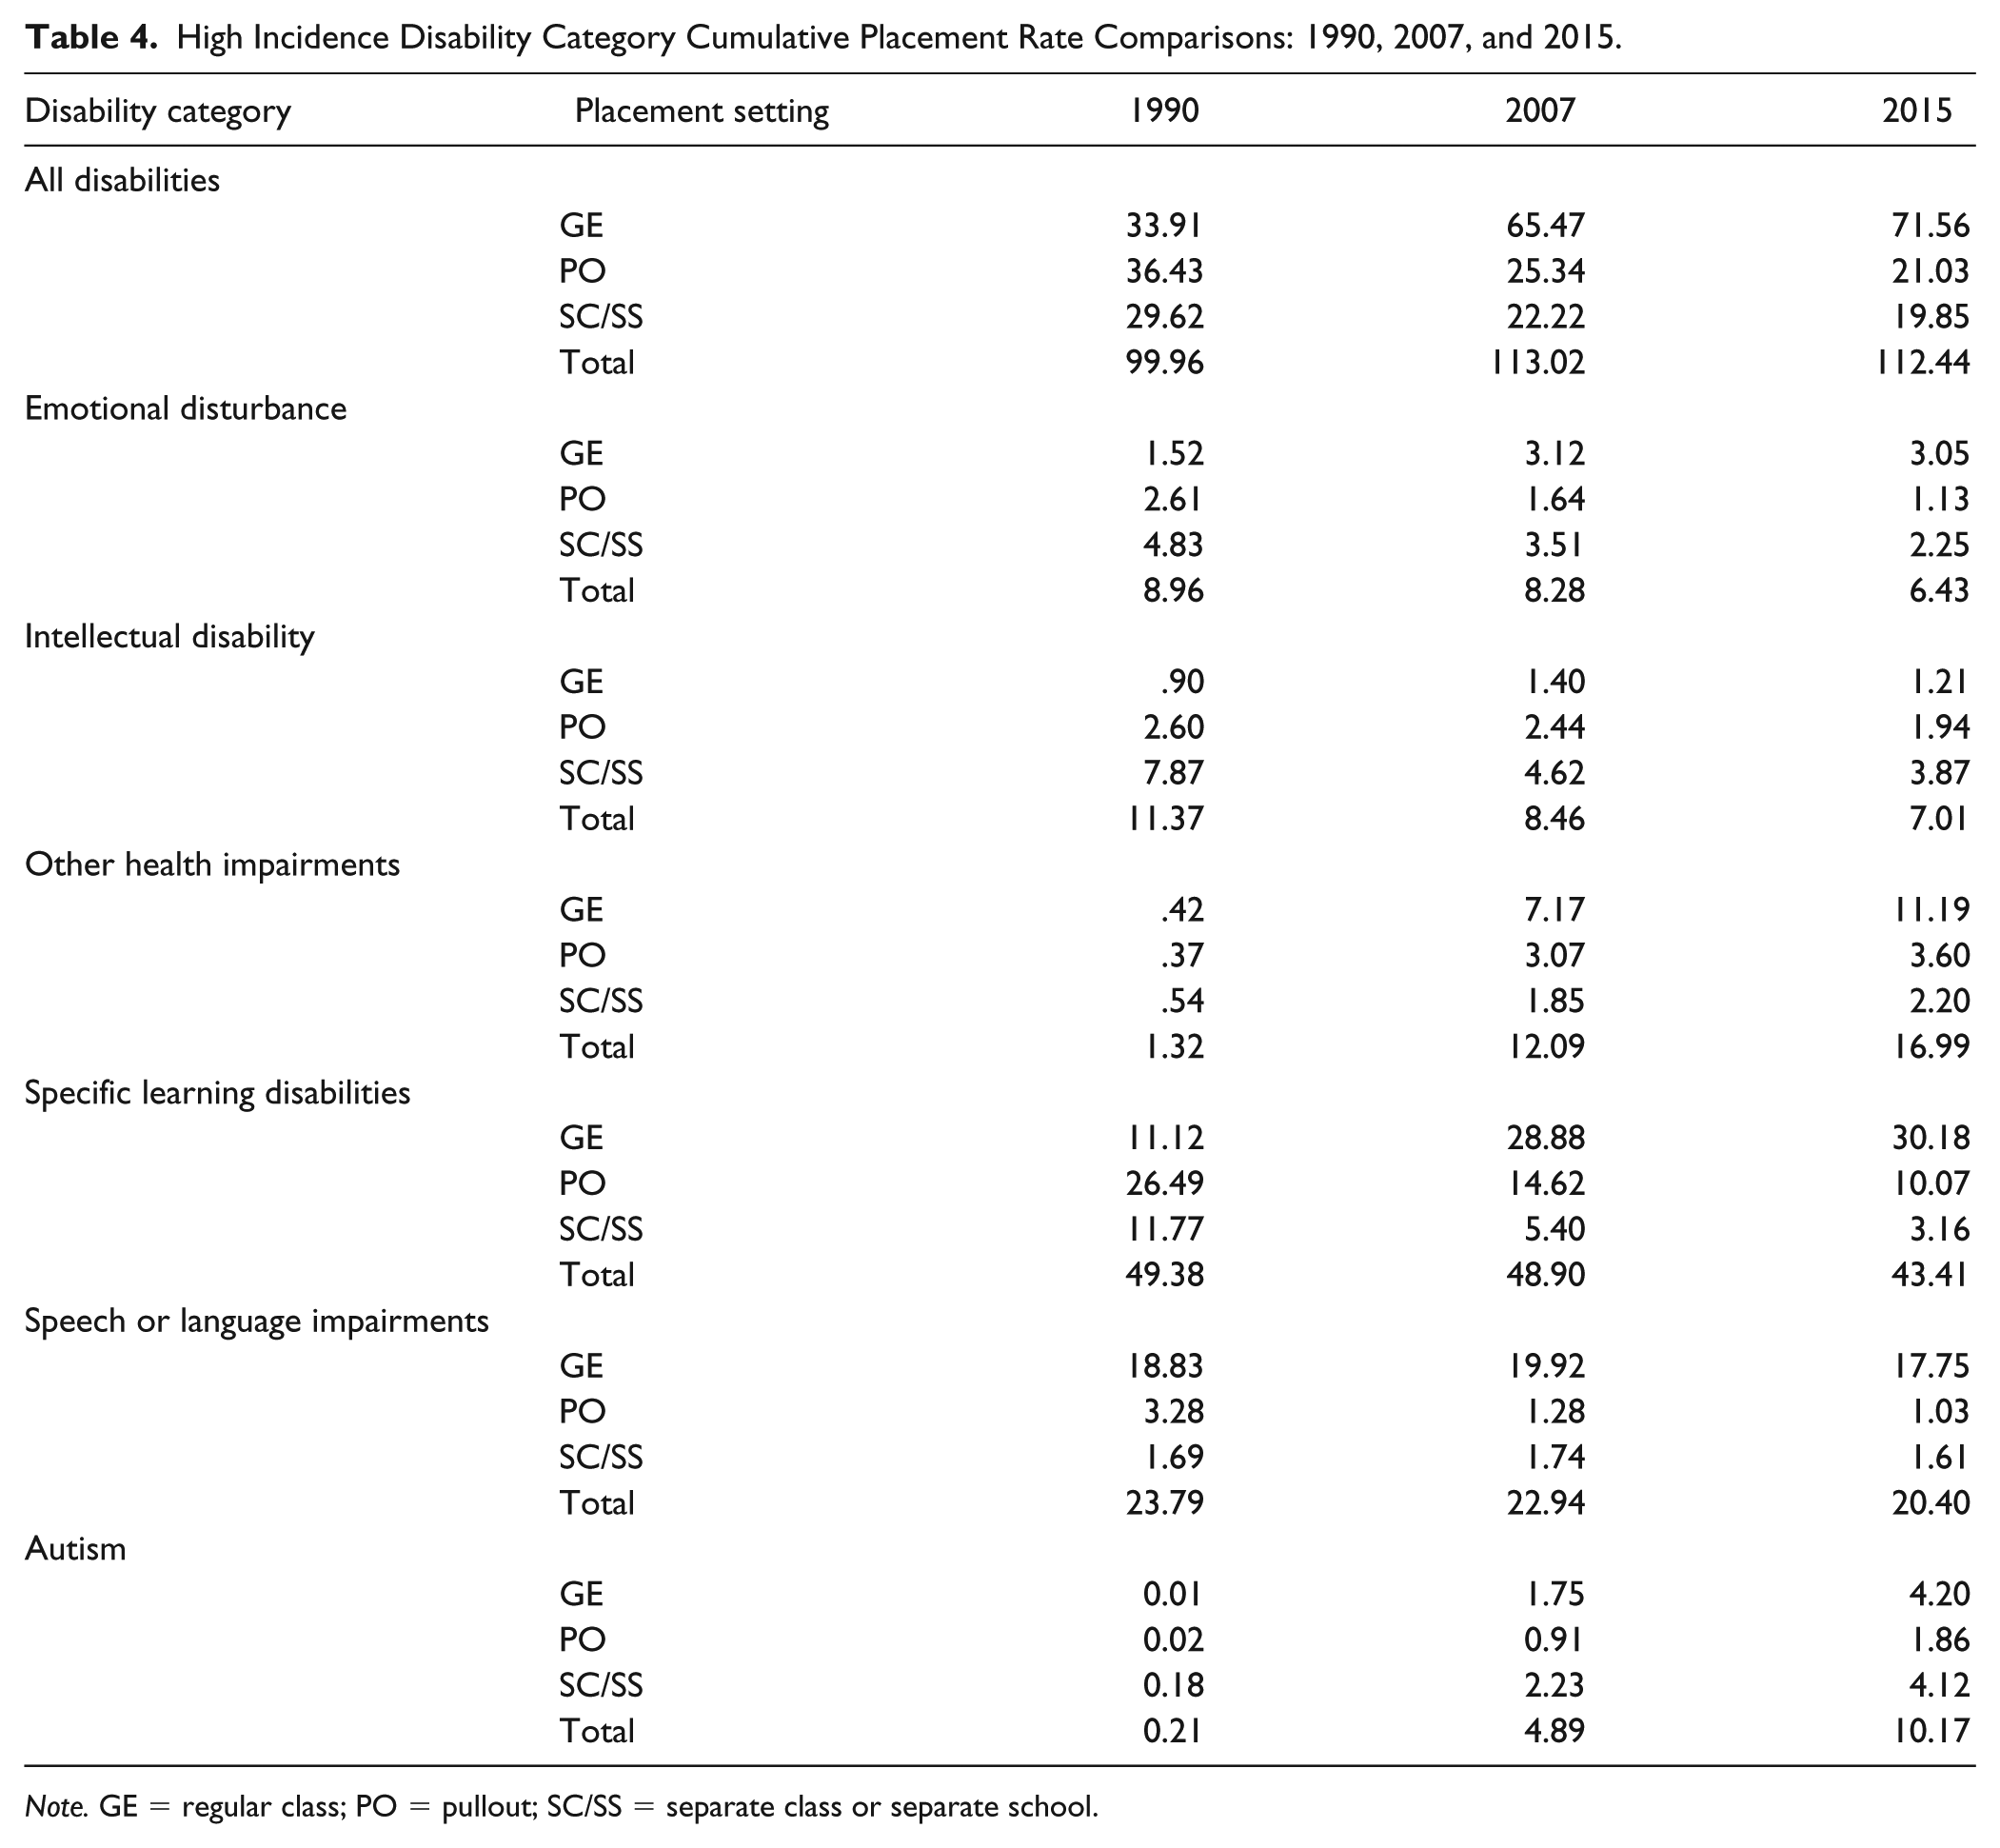
To explore how different disability categories contributed to national placement trends, data from 1990, 2007, and 2015 for six disability categories were examined (see Table 4). Included are the disability categories that have the highest number of students identified. Together, these categories represent approximately 93% of all students with disabilities. As Table 4 reveals, the largest number of students across these categories are identified with LD (CPR of 43.41), whereas the fewest students are identified with EBD (CPR of 6.43).
High Incidence Disability Category Cumulative Placement Rate Comparisons: 1990, 2007, and 2015.
Note. GE = regular class; PO = pullout; SC/SS = separate class or separate school.
Due to the number of students identified with LD, the LD category has had substantially more influence on national placement trends than other disability categories. It accounted for approximately 50% of both the increase in GE and the decrease in pullout placements between 1990 and 2015. The OHI and autism (ASD) categories also contributed to the increase in GE placements, whereas the ID and EBD categories contributed to some degree to the decrease in pullout placements. The LD category also substantially contributed to the decrease in separate class/separate school placements between 1990 and 2015, whereas the ID and EBD contributed to a lesser degree to this change. ASD and OHI were the only categories that had increases in students identified from 1990 through 2015. The identification of students with ASD increased by 4.715%, whereas the number of students identified with OHI increased by 1.187%. As noted earlier, ASD was not reported as a separate category until 1991 during which only 30 states reported data. At the same time, there were decreases in the number of students identified with LD (12%), EBD (28%), and ID (38%).
Discussion
Despite continuing controversies surrounding the LRE mandate and inclusive placement practices (Fuchs & Fuchs, 1994; Kauffman, 1993; McLeskey et al., 2018; McLeskey, 2007), this investigation revealed that the national trend toward less restrictive placements continued through 2015. However, it should be noted that placement trends have slowed considerably since 2007 (McLeskey et al., 2012). Between 1990 and 2007, there was a trend toward substantially increased placements of students with disabilities in GE settings (i.e., an increase of 93%); however, since that time the increase was only 9%. This trend of slowing changes in placement is also reflected in more restrictive settings. For example, students in pullout placements decreased by about 30% from 1990 to 2007, but only by 17% from 2007 to 2015. This trend continued as placements in separate class/separate school settings decreased by 25% between 1990 and 2007, but only by 11% between 2007 and 2015. The largest change in identification rate occurred between 1990 and 2007 (an increase of 13%), whereas the period between 2007 and 2015 saw a slight decrease in identification of less than 1% (0.51%), in the number of students identified with disabilities. Thus, we conclude that toward the end of the 25-year period examined, dramatic shifts were replaced by more modest shifts in placement trends.
A second noteworthy finding from this investigation is that changes in placements at both elementary and secondary levels have slowed considerably since 2007. From 1990 through 2007 in elementary schools, GE placements rose by 60%, whereas placements in more restrictive pullout and separate class/separate school settings decreased by more than 60% (McLeskey et al., 2012). Between 2007 through 2015, this trend slowed substantially, as GE placements rose by 4%, whereas placements in pullout and separate class/separate school settings decreased by 6%. At the secondary level, there was a substantial increase in GE placements from 1990 through 2007 (190%) with a far smaller increase since 2007 (15%). For more restrictive pullout and separate class/separate school settings, placements of secondary students decreased 49% between 1990 and 2007, but this trend slowed after 2007 with a 19% decrease. While overall trends at the elementary and secondary levels have continued to move toward less restrictive placements, it is important to note that students with disabilities in secondary schools remain more likely to be placed in restrictive settings. In 2015, 32% of elementary students were placed in either pullout or separate class/separate school settings, whereas 40% of secondary students were placed in these settings.
This study also examined the impact of disability categories on national placement trends. McLeskey and his colleagues (2012) speculated that as of 2007, growth in GE placements might have resulted from the identification of students with milder disabilities. In contrast, there were three placement patterns noted in this investigation. First, students labeled with LD, ID, and EBD experienced increased placements in GE settings and decreased placements in more restrictive settings (i.e., pullout and separate class/separate school), as identification of students with those disabilities decreased. During the 25 years under study, GE placements for students with LD increased by 171%, for students with ID by 34%, and for students with EBD by 101%. At the same time, more restrictive placements decreased by 65% for students with LD, 45% for students with ID, and 55% for students with EBD. Moreover, these changes occurred as the identification rates decreased over the past 25 years. These categories mirrored national trends of continued but slowing movement toward less restrictive settings as identification decreased.
The second pattern, noted only for students identified with SLI, was decreased placement in all categories and decreased identification. Placement decreases were offset almost entirely by decreases in identification. Placement of students with SLI declined across all settings by 3.41 and identification of students with SLI declined by 3.39. Thus, we conclude this category had little influence on the national LRE trends.
The third pattern was increased placements in all settings and increased identification. Students identified that OHI and ASD experienced dramatic increases in all placement settings and in identification. The increased identification of students with OHI and ASD (i.e., 15.67 and 9.96) exceeded the decrease in identification of students with LD (5.97), ID (4.36), EBD (2.53), and SLI (3.39) combined by 9.38 (i.e., 25.63 – 16.25 = 9.38). However, when interpreting these data, caution is needed. First, it might be tempting to conclude that these two categories had the most impact on national LRE trends, which was primarily due to increased identification. This interpretation is consistent with well-documented increases in the incidence of ASD and attention-deficit/hyperactivity disorder (ADHD) noted in prevalence studies (see Center for Disease Control and Prevention, 2014; Davidovitch, Koren, Fund, Shrem, & Porath, 2017). However, another compelling explanation is that changes in how students were identified might have resulted in movement between categories. For example, Williamson and her colleagues (2006) found that states had differing criteria for identifying individuals with ID that resulted in overlap between students being identified with LD instead of ID or vice versus from state to state. Moreover, changes made to the Diagnostic and Statistical Manual of Mental Disorders (5th ed., American Psychiatric Association, 2013) included revisions to criteria for diagnosing ASD and ADHD. Taken together, we suggest that the influence of OHI and ASD related to LRE should be interpreted with caution, as there are multiple plausible explanations as to why these two categories had significant placement changes.
Limitations and Directions for Future Research
The limitations of this study are primarily related to how data were collected and reported by the U.S. Department of Education. First, census dates are determined by states. The Office of Special Education Programs (OSEP) allows states to move their census date ±6 days year to year. Second, to address data quality issues found in earlier reports, the IDC was founded in 2013 and funded by an OSEP grant through the U.S. Department of Education. The IDC provides technical assistance to states to improve the quality of data they report to monitor state compliance with IDEA requirements. Historically, states revised submission data after data were reported and published. The advent of IDC has seemingly reduced but has not eliminated the number of corrections. For example, Wisconsin’s 2016 data were flagged due to concerns about overall quality. To preserve the ability to make comparisons with previous studies, only data through 2015 were used in this investigation. Also noted earlier, ASD was not a required reporting category until 1991, and only 30 states reported numbers in that category. We suggest the actual numbers were likely under reported that year. Furthermore, these data reveal little about the intensity of learning needs within particular disability categories (e.g., autism, IDs). It is impossible to draw conclusions about the quality of supports provided to students within these different settings. Taken together while these data are the best we have available, interpretations drawn from these data should be interpreted with caution.
Future research
Given the limitations of this investigation, additional research is needed to explore the influence of the rapid growth of students placed in the OHI category. As of 2015, nearly 17 students per 1,000 were identified as OHI; that is, more than all students identified with EBD and ID combined. Of those students, nearly a third were placed in more restrictive settings. As defined, students with this designation are noted to have a chronic health condition that affects their abilities to attend in educational environments. Conditions can range from ADHD to leukemia. It is possible that the students in this category might have previously been identified in another category (e.g., LD). Investigations might examine state LRE placement decisions, as a means to better understand the influence of OHI placements has on national trends. In addition, an examination of how different state policy interprets federal guidelines related to identification of students with OHI is also warranted. This would illuminate if placement changes were the result of category drift or real increases in the numbers of new students identified as prevalence studies might suggest.
The placement of students with ASD also requires closer examination. As noted earlier, states were not asked to report placements for students with ASD until 1991. Since that time, ASD has become the fourth most commonly identified disability reported by states behind LD, SLI, and OHI. Like OHI, this category may have overlapped with others (e.g., EBD). Thus, an exploration of how schools, districts, and states identify students with ASD seems warranted. Furthermore, this research should address the extent to which changes in identification rate have influenced placement practices for students with ASD.
Finally, it is important to note that the progressive march toward inclusion of students with disabilities across this time period continued to leave some students in the most restrictive placements. While the numbers of students with ID declined substantially over time, the proportion of these students placed in the most restrictive settings remained high. This is consistent with other studies (Morningstar, Kurth, & Johnson, 2017; Williamson et al., 2006). More than half of all students with ID were placed in the most restrictive settings in 2007 and again in 2015. It has been well documented that students would benefit from placements in GE classrooms (e.g., Wehmeyer, 2011).
Conclusion
Beginning in the 1960s, scholars and advocates began raising concern about the effectiveness of serving students with disabilities in segregated classrooms (Deno, 1970; Dunn, 1968; Goldstein et al., 1965; Johnson, 1962). Together, these concerns led to the passage of the LRE mandate, which presumed that students with disabilities should be educated alongside their peers in GE, unless there was a compelling reason for a more restrictive placement. National findings from this study also appear to suggest that the progressive move toward inclusion (Reynolds & Birch, 1977) is nearing a plateau. For example, as of 2015, CPR data indicate that 71.56 students with disabilities were educated in GE classrooms, compared with 40.88 in more restrictive settings. We conclude that absent additional innovation in practice or policy, dramatic shifts in placements such as those seen prior to 2007 seem far less likely to occur.
Footnotes
Declaration of Conflicting Interests
The author(s) declared no potential conflicts of interest with respect to the research, authorship, and/or publication of this article.
Funding
The author(s) received no financial support for the research, authorship, and/or publication of this article.