
Abstract
As transition services foster better post-school outcomes, all students with disabilities should be receiving these services as they traverse their final high school years. Using a national, web-based parent survey, we examined the frequency and correlates of the receipt of transition services for 189 students with disabilities. Parents reported their children’s age, functioning level, maladaptive behavior, and number of services received. Only 54% of the child of the participants received transition services. Students with higher (vs. lower) levels of adaptive skills were less likely to receive transition services. Students with more services on average and who were older were more likely to receive transition services. Implications are discussed for increasing the implementation of transition services for all students with disabilities and increasing parent knowledge of transition services and transition planning.
Because transition services provide adolescents with disabilities a bridge between school and post-school adult life, the 1990 reauthorization of the Individuals With Disabilities Education Act (IDEA) mandated that school districts provide transition services to all students aged 16 to 22 with disabilities. As a result, transition services are a part of every student’s Individualized Education Program (IEP), with the goal “to facilitate movement from school to post-school activities” to improve outcomes for students with disabilities. Outcomes emphasized in IDEA include “postsecondary education, vocational education, integrated employment (including supported employment), continuing and adult education, adult services, independent living or community participation” (IDEA, 20 U.S.C. 1401(34)).
In this sense, transition services should be both universal and individualized. In terms of universality, all students with IEPs should be receiving transition services from age 16 on (in some states, younger than 16); in contrast, all other special education services are provided on an “as needed” basis (e.g., an individual student only receives speech–language services if needed). At the same time, however, transition services should be individualized to the student’s specific needs and interests. Universally, transition services can be defined as a set of services that address any area of need for the student within the following categories: vocational training, planning for attending college, acquisition of independent living skills, and community participation (Individuals With Disabilities Education Improvement Act, 2004). More specifically and individually defined, transition services may include providing early and diverse employment experiences and job coaching; practice in applying for a job (interviewing, resumes, etc.); travel training and using transportation services; instruction in such independent living skills as financial literacy, self-care, domestic skills, and health and wellness; engaging in community activities and recreation; and visiting and applying to college (Johnson et al., 2002).
Given such universal-but-individualized services, transition services do appear to foster successful post-school outcomes for a more independent adult life. In studies using the National Longitudinal Transition Study–2 (NLTS-2) dataset, post-school outcomes for youth with disabilities are improving (Newman et al., 2009). From the 16 evidence-based practice predictors for better post-school outcomes, Test et al. (2009) found that participation in transition programs was a predictor of more successful post-school outcomes in both employment and postsecondary education. Similarly, Benz et al. (2000) found that completion of transition goals predicted better post-school outcomes. Parental involvement in transition planning can also be an important factor in post-school success for students with disabilities (Lindstrom et al., 2007; Test et al., 2009).
It remains unclear, however, whether schools are in procedural and substantive compliance with IDEA’s transition component. From NLTS-2 data, school personnel reported that 100% of students had transition component of the IEP when students had high-incidence disabilities (Trainor et al., 2015) or when students had mild intellectual disabilities (IDs; Bouck & Joshi, 2016). In studies that specifically reviewed IEP documents, however, schools were often not in compliance with providing transition services (Landmark & Zhang, 2013). Moreover, in interviews with culturally and linguistically diverse (CLD) families, Landmark et al. (2007) found that over half of parents did not know or knew very little about their child’s transition component of the IEP. Thus, it is possible that there is a discrepancy between the documentation of a transition service plan in the IEP and the implementation of transition services and the identification of transition services by parents—a discrepancy which we will further examine in this article.
Moreover, transition services may be provided as an afterthought to the IEP, often provided only in the final year the student is in school, when the student is older (deFur, 2003). Furthermore, transition-related goals are often vague and generic (Hetherington et al., 2010; Powers et al., 2005), with several court decisions noting that transition components of the IEP are often not individualized (Etscheidt, 2006; Katsiyannis et al., 2012). While transition services must be provided by public schools as mandated by IDEA, students with IEPs who are publicly placed in private schools also retain their rights under IDEA and the transition component must be provided (IDEA, 34 CFR § 300.146). Furthermore, private organizations also provide transition services, such as day programs for young adults with disabilities.
A further complication is that transition services may be unevenly distributed depending on the student’s type or severity of disability. For example, Landmark and Zhang (2013) found that students with emotional disabilities and learning disabilities were less likely to have employment preparation than students with developmental disabilities. Moreover, the IEPs of students with emotional disabilities were the least compliant with the transition component of IDEA. Taylor and Henninger (2015) found that adolescents with autism with lower adaptive behavior scores and more severe autism symptoms received more services. In the post-school years as well, there appears to be a decline in receipt of services for students requiring fewer adaptive supports (Taylor & Seltzer, 2011; Wagner et al., 2016). Similarly, Baer et al. (2011) found that students with high-incidence disabilities (e.g., learning disabilities, attention-deficit hyperactivity disorder [ADHD]) had less access to post-school services than those with ID.
Previous studies have focused on the specific disability labels (e.g., learning disability, ID, etc.) rather than focusing more in depth on characteristics of the individual student in regard to receipt of transition services. However, there is diversity in the characteristics within specific disability labels. Given that transition services are important for post-school outcomes, it is necessary to identify the specific characteristics of students who are more versus less likely to receive such services. Using a large, national survey of parents of transition-aged youth with disabilities, this study explored student characteristics as potential correlates to receiving transition services. Specifically, we examined two research questions:
We hypothesized that, even though all students should be receiving transition services, not all families of students aged 16 to 18 years will report receiving transition services. We also hypothesized that families of students with less support needs, more daily living skills and less severe behavior, and who are younger will be less likely to report receipt of transition services, similar to Landmark and Zhang (2013).
Method
Participants
This study included 189 family respondents of students with disabilities. Participants were a subset of the total sample of more than 1,500 families of students aged 3 through 22 years. Respondents were mainly mothers, who were White, married, and well-educated. Respondents worked an average of 25 hr a week, and most had annual household incomes of US$70,000 or greater. On average, parent respondents were slightly below 50 years of age (M = 49.85, SD = 6.19, range = 18–68 years; see Table 1).
Demographic Characteristics of Respondents.

For this study, we limited our analyses to families who had children who were 16 to 18 years of age and who received special education services. We excluded students who were 19 to 22 years of age because we could not determine whether students were in school receiving services under IDEA, receiving postsecondary education, or in another setting. As such, students ranged in age from 16 to 18 years, with an average age of 16.89 (SD = 0.79). The students, most of whom were male, attended public and private schools, and had a wide range of disabilities, including autism, learning disabilities, speech–language impairment, IDs, developmental delays, and emotional disturbance (see Table 2).
Demographic Characteristics of the Student.

Recruitment Procedures
In our attempts to attain a diverse national sample, we recruited participants in multiple ways. First, emails and flyers were sent to local, state, and national parent support groups; the Association of University Centers on Disabilities (AUCD); and all 106 parent training and information centers (PTIs) throughout the United States. Next, emails were sent to each agency listed in Wrightslaw Yellow Pages for Kids (http://www.yellowpagesforkids.com). From this website, more than 7,843 agencies were contacted. These agencies included local parent support groups (436); non-profit disability agencies (1,271), including chapters of The Arc; schools and educational agencies (1,386); attorney, advocacy, and legal agencies (1,725); and private service providers (3,025).
Procedures
In collaboration with other disability researchers and community advocates, the questionnaire was developed and revised. This survey, hereafter called the Parent–School Collaboration Survey, included both established scales and novel questions. Before piloting this survey with five parents of students with disabilities, we received feedback about the survey from 10 parents of individuals with disabilities, professors, students, and community advocates. Upon revision, the Institutional Review Board (IRB) approved the study. The questionnaire was then put onto a secure website of the University. As survey responses accumulated, they were stored on the REDCap program (Harris et al., 2009) and were downloaded periodically to guard against computer malfunctions. The study was posted on the internet from December 2010 until June 2011.
Although most surveys were completed electronically, respondents could also complete and return paper versions. Responding to both phone and email requests, more than 50 paper surveys were distributed. Only five paper-based responses were returned (these returned surveys were then entered onto the website). The Parent–School Collaboration Survey took approximately 20–25 min to complete. Upon going to the address of the website, respondents first saw a screen describing the study. Once agreeing to participate, the respondent was then directed to the second screen, which contained a brief description of the survey and the survey itself. Upon completing the survey, the respondent was thanked. Respondents then submitted their survey responses. By pushing the completion button, the survey was submitted to the website.
Parent–School Collaboration Survey
The Parent–School Collaboration Survey was comprised of distinct sections related to the parent, student, and parent–school relationship. For this study, we used the following measures: demographic information of the child and parent, the Scales of Independent Behavior–Revised (SIB-R; Bruininks et al., 1996), Daily Living Skills Survey (Maenner et al., 2013), and the Services Inventory (Summers et al., 2007).
Demographics
Respondents reported their role, age, income, ethnicity, work hours, level of education, and marital status. We also asked demographic questions regarding the child’s age, gender, disability type, grade, and school type (i.e., public or private).
SIB-R
We used the eight-item SIB-R, which provides a General Maladaptive Index (GMI), with higher scores inferring more serious maladaptive behaviors (Bruininks et al., 1996). The cutoff score for normal is 110 or below, cutoff for marginal to moderate is a score from 111 to 120, and the cutoff for serious to very serious is above a score of 121. Behaviors included externalizing, internalizing, and asocial behaviors; the summed score reflects both frequency and severity of the behaviors. The SIB-R has been used in previous studies with parents of transition-aged youth with disabilities with great reliability (e.g., α = .75; Burke & Hodapp, 2014). In this study, Cronbach’s alpha = .77.
Activities of Daily Living (ADL)
We used the Waisman Activities of Daily Living to measure ADL (Maenner et al., 2013). Parents answered the question, “To what extent can your child perform the following activities?” for each of the following 15 skills: walking, speaking, reading, eating, preparing meals, taking medications, grooming, performing household tasks, performing basic financial tasks, running errands, participating in leisure activities, living independently, working at a job, maintaining friendships, and maintaining intimate relationships. Answers were provided on a Likert-type scale ranging from 1 to 5 (not at all to very well). Item scores were summed to create a total score for each participant (minimum possible score = 15 and maximum = 75). Previous studies using the ADL demonstrated its high reliability (α = .91; Burke et al., 2012). In this study, Cronbach’s alpha = .93.
Services Inventory
Parents also noted whether their child received each of 13 services (yes or no), including transition services (Summers et al., 2007). For this study, for the dependent variable, we used one item of the Services Inventory: “Has your child received transition services?” For the other services, we calculated a total number of services score for all 12 services besides transition (minimum score = 0 and maximum score = 12). This scale has been used in other studies with high reliability (Mello et al., 2016). In this study, the Kuder–Richardson coefficient = .62.
Analyses
We conducted three sets of analyses. First, we determined the percentage of 16- to 18-year-old students with disabilities who were receiving transition services. To attain this percentage, we looked descriptively at the frequency of receipt of transition services, that is, the percentage of our sample who answered “Yes” to “Has your child received transition services?”
For the next set of analyses, we examined separately each of the potential correlates to the receipt of transition services. Using independent-samples t tests, those students who did versus did not receive transition services were compared on the following continuous variables: (a) maladaptive behavior, (b) daily living skills, and (c) total number of services (not including transition services). Using chi-square analyses, those students who did versus those who did not receive services were compared on age and type of school.
Our third analysis was a logistic regression to identify independent predictors of receiving transition services. In the initial regression analysis, daily living skills was shown to be non-linear. The non-linear term for maladaptive behavior was not significant. As such, because only daily living skills had a curvilinear relation with transition, we conducted a logistic regression with a restricted cubic spline term for daily living skills. A restricted cubic spline fits segments on the regression line with knots, the point where the slope changes (Harrell et al., 1988). Adding the restricted cubic spline to the regression model accounts for the non-linear relation between the dependent variable and the transformed independent variable. Thus, for the final analysis, we conducted a logistic regression with maladaptive behavior, restricted cubic spline (daily living skills), school type, and age as predictors for receipt of transition services.
Results
Overall Receipt of Transition Services
Only 54% of parents responded that their child received transition services. Although all students should be receiving these services, our sample indicated that only a little over half of all 16- to 18-year-old students with disabilities were receiving transition services.
Independent Analyses of Characteristics
Next, we compared students who received transition services and those who did not with respect to maladaptive behavior, daily living skills, number of services, type of school, and age. Students who received transition services were significantly more likely to have greater amounts of maladaptive behaviors, t(187) = −2.74, p < .01, effect size (ES) = 0.40. Students who received transition services also showed lower levels of daily living skills, t(187) = 2.00, p < .05, ES = 0.29. On average, students who received transition services received a greater number of (non-transition) special educational services, t(187) = −4.29, p < .0001, ES = 0.63. There was no difference in age and the receipt of transition services, χ2(1, N = 189) = 5.30, p = .071, ns, or by the type of school that the students attended, public versus private, χ2(1, N = 189) = 1.15, ns. See Table 3 for means and standard deviations of each measure between students who do and do not receive transition services.
Descriptive Statistics of Measures.
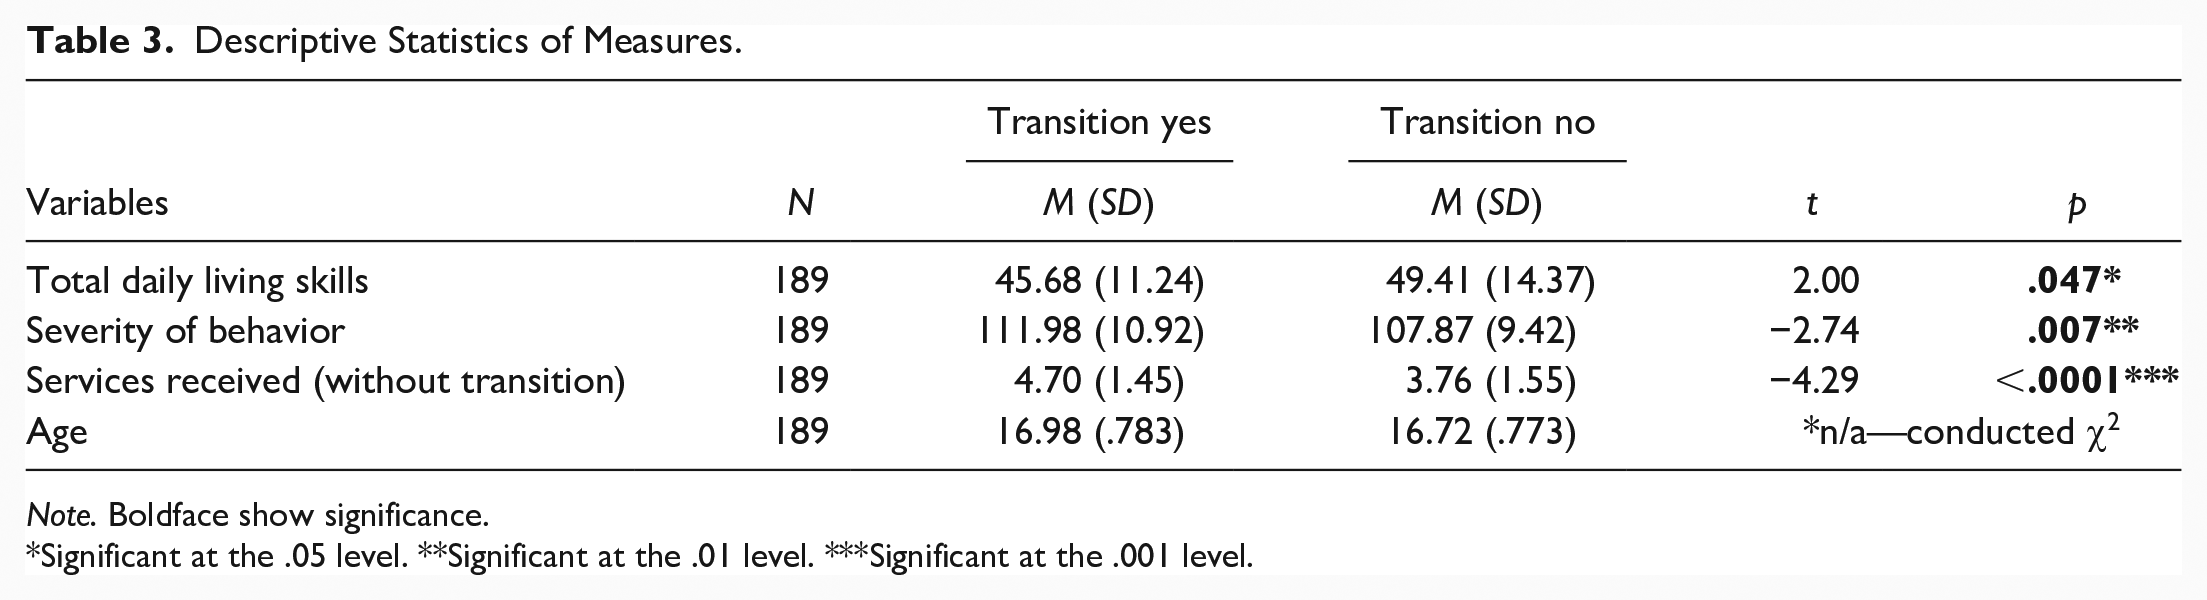
Note. Boldface show significance.
Significant at the .05 level. **Significant at the .01 level. ***Significant at the .001 level.
We conducted further descriptive analyses to understand the relations between our independent variables and receipt of transition services. To show more clearly the relations between potential correlates and percentages of students receiving transition services, we also performed a series of chi-square tests for daily living skills and maladaptive behaviors. To do so, we first determined the quartiles for daily living skills. Specifically, for daily living skills, the range of scores are from 17 to 75 and the first quartile cutoff was 39.32, the second quartile cutoff was 47.0, and the third quartile cutoff was 55.5. The chi-square analyses for the quartiles for daily living skills showed that those in the fourth quartile had the lowest percentage of students receiving transition services (36.4%), versus those in the first three quartiles, wherein 58.1% to 64.4% received transition services, χ2(1, N = 189) = 8.41, p = .038. Thus, we dichotomized the daily living skills score into two categories: high daily living skills (those whose average scores were 4.0 and above on the 15 daily living items, or total scores of 60 and above) and low daily living skills (i.e., total scores below 60). Only 30.3% (n = 10) of those students with high daily living scores (i.e., low support needs) received transition services compared with 59.0% (n = 22) of those with low daily living skills, χ2(1, N = 189) = 9.01, p = .003, ES = 0.44.
For maladaptive behavior, we used the cutoff scores for the SIB-R. We collapsed the five-category cutoff scores into three categories to analyze maladaptive behavior using chi-square analyses. The three categories were normal, marginal, and moderate to very serious behavior. There were more students with marginal (68.6%) and moderate to very serious behaviors (65.5%) who were receiving transition services than those with normal behaviors (47.2%), χ2(1, N = 189) = 6.87, p = .032. We then dichotomized maladaptive behavior into normal (scores from 90 to 110) and those with any behavior problems (scores ≥111); we found that 67.2% (n = 43) of students with any maladaptive behaviors received transition services compared with 47.2% (n = 59) of students with normal behavior scores, χ2(1, N = 189) = 6.81, p = .009, ES = 0.39.
Logistic Regression
First, we determined that the non-linear term for daily living skills was significant, χ2(1, N = 5) = 5.44, p = .02. See Figure 1 for the cubic spline term graph. The non-linear term for maladaptive behavior was not significant; thus, we used the original variable in the regression. Notably, we conducted a correlation matrix for the independent variables; we did not find any multicollinearity. To determine each independent variable’s independent contribution to whether students received transition services, we next conducted a logistic regression of receipt of transition with the following independent variables: maladaptive behavior, restricted cubic spline of daily living skills, age, and school type. Students with higher daily living scores were less likely to receive transition services than those with lower daily living scores. Specifically, students at the highest level of adaptive skills were less likely to receive transition services than all other levels of adaptive skills. Students who received more services on average were more likely to receive transition services. In addition, older students were more likely to receive transition services. Although in the univariate analyses, students with more maladaptive behaviors were less likely to receive transition services, when controlling for other variables, there was no difference in receipt of transition services for students with and without behavior problems. There was also no difference in school type and the receipt of transition services (see Table 4).
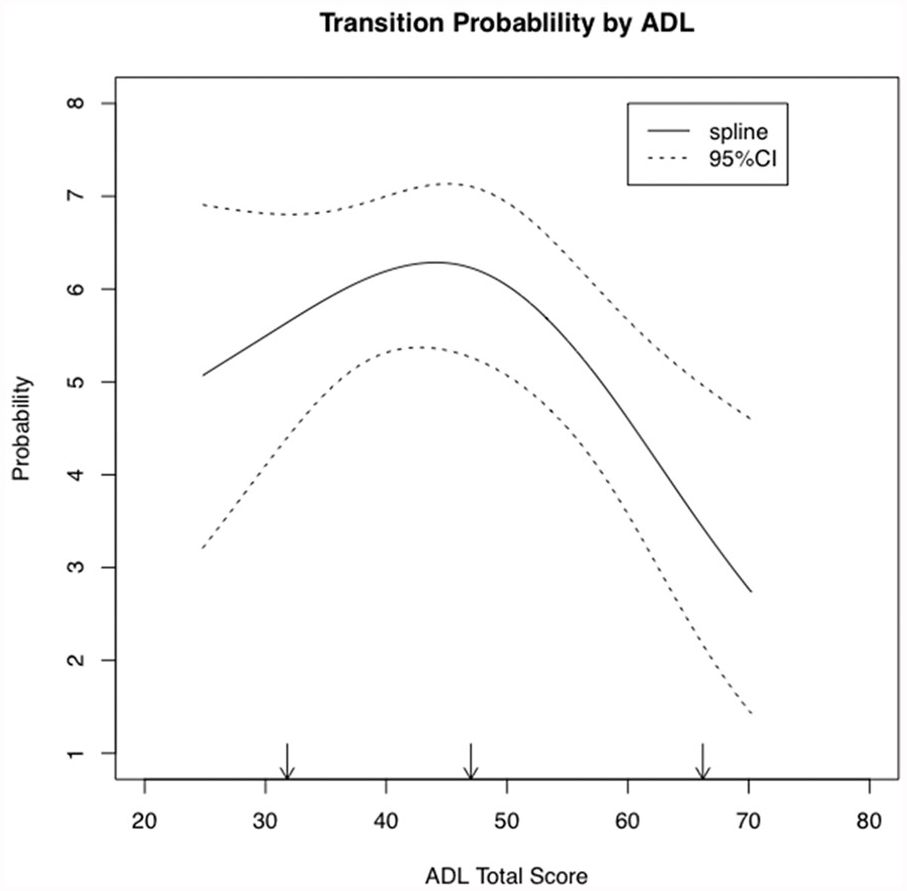
Graph of the restricted cubic spline term for ADL for the probability of receiving transition services.
Logistic Regression Results.

Note. CI = confidence interval. Boldface show significance.
Significant at the .05 level. **Significant at the .01 level. ***Significant at the .001 level.
Discussion
Since the 1990 IDEA reauthorization, which mandated transition services for all students with disabilities, studies have demonstrated that when students receive transition services, their post-school outcomes improve. But not all students receive transition services (Landmark & Zhang, 2013; Powers et al., 2005). By documenting how often students do not receive transition services and by identifying correlates of individuals most likely not to receive such services, this study adds to our knowledge about transition and has both practical and policy implications.
Our study had two main findings. First, slightly over half of parents reported that their children received transition services. This finding corresponds to previous studies that reviewed students’ actual IEPs, which also suggested that not all students receive transition services (Landmark & Zhang, 2013; Powers et al., 2005). At the same time, however, our study differed from previous studies in which the reporters were teachers and other school personnel. In those studies, school personnel reported that all transition-aged youth with disabilities received transition services (Joshi & Bouck, 2017; Trainor et al., 2015). Although discussed more fully below, this study’s parent-report percentage seems to more closely match compliance rates for transition services when researchers directly reviewed the presence or absence of transition services on each student’s IEP (Landmark & Zhang, 2013).
Our second finding pertained to specific student correlates of receiving transition services. We found that students who did not receive transition services were disproportionately likely to have higher levels of daily living skills and were slightly older. Such connections between not receiving transition services and adaptive levels were also not linear, in that participants with the highest levels of adaptive behavior seemed the least likely to receive such services. In addition, as shown in this and other studies, students who had greater support needs were most likely to have more comprehensive services, receiving more services in general (Taylor & Henninger, 2015).
Taken together, these results have several implications for transition services for students with disabilities. While it is generally accepted that students with less support needs (in terms of adaptive behavior) have better post-school outcomes than those with greater support needs (Grigal et al., 2011), such students still require transition services to improve post-school outcomes. Indeed, even for those who have less needs for support, there remains a gap between students with disabilities and their typical peers in regard to post-school outcomes in employment, independent living, and postsecondary education (Rojewski et al., 2015; Taylor et al., 2015). More concretely, students who had a transition component on their IEP that listed postsecondary accommodations were more likely to use disability-specific support in their postsecondary education experiences (Newman et al., 2016). For successful post-school outcomes, then, transition services are still needed for students with disabilities who have low support needs.
Beyond implications for individual students, implications also pertain to the parents of these students. First and most obviously, a discrepancy exists between stakeholders. In studies that use parents as reporters, large percentages of parents report that their transition-aged children are not receiving transition services; in NLTS-2 and other studies using school personnel as reporters, 100% of such students are said to be receiving such services (Trainor et al., 2015). Irrespective of who is “correct,” such discrepancies are troubling.
Although many potential reasons underlie this discrepancy, a few seem noteworthy. A first may concern the issue of what, exactly, constitutes transition services. As noted earlier, such services include practice applying for a job, including learning how to look for a job, develop a resume, and prepare for a job interview; actual experiences in working; planning for postsecondary education; and instruction in financial literacy, self-care, domestic skills, taking public transportation, and other adult skills. But it remains unclear the extent to which parents know that their children are receiving such instruction, or the degree to which teachers are communicating to parents about which specific skills their students are learning, or, more importantly, how such activities and skills fit within the larger transition process. At the very least, parents and teachers need to agree about what transition services are, how they work, and how they apply to each individual student.
On a deeper level, this discrepancy between parents and school personnel reflects the need for better parent–school partnerships and greater involvement by parents in determining transition services for their child. Thus, it is imperative that school policies and actual teacher practice work together to allow parents to become involved and meaningfully engaged in transition planning for their child. Ultimately, when students with disabilities exit school, it will be the parents and other family members who assist and advocate for students for post-school services, employment, and postsecondary education.
This idea of the importance of parental involvement is not new; several studies highlight the importance of parental involvement in transition services. Specifically, parent involvement has been associated with more positive post-school outcomes for adolescents with disabilities (Lindstrom et al., 2007), and parent involvement is a predictor for employment for students with disabilities (Test et al., 2009). In several studies, parents have reported wanting to be more involved in the transition planning process (Skaff et al., 2016; Trainor et al., 2015). Indeed, in interviews with parents of transition-aged youth with disabilities, Hetherington et al. (2010) reported that parents often felt like outsiders to the transition planning process and often had to advocate for their children during the transition process. In addition, parents sometimes feel like they do not have the knowledge of the post-school options in regard to the transition planning process (Chambers et al., 2004; Hetherington et al., 2010; Taylor & Henninger, 2015), and the views of parents and teachers often differed in regard to the transition-related strength and needs of the students (Carter et al., 2014). All of these studies highlight the need for greater communication between parents and teachers, as well as greater parental input into many aspects of the transition process.
Limitations
This study also had several limitations that must be addressed. First and most importantly, we did not define in the survey what we meant by “transition services.” While not providing a definition can leave it up to the parents to interpret what transition services mean, providing a definition can also limit responses. Furthermore, we did not ask the parents to rate the quality of the services. Reporting the receipt of transition services does not necessarily mean the students are receiving quality transition services. We also did not include students who were younger than 16 years; although some states provide transition services at younger ages, this practice is not uniform across the United States. Another limitation is that our respondents were predominantly White, well-educated, and middle-class mothers. It is important to include a more representative sample of families of students with disabilities, particularly those who are CLD, in future research on transition services. Finally, the data were collected prior to the passage of Workforce Innovation and Opportunity Act (WIOA) in 2014, which may differently affect the receipt of transition services.
Conclusion and Future Directions
Regardless of level of support needs and severity of behavior problems, all students with disabilities should be provided with transition services to meet their individual needs. As this study shows, however, only half of all 16- to 18-year-old students were receiving such services, and those not receiving transition services were disproportionately students with less support needs (i.e., were higher functioning). Yet, all students require such services, and these services need to involve partnerships among school personnel, parents, and the students themselves. Schools need to ensure that they are compliant with providing individualized and effective transition services, specifically because transition services are crucial for better post-school outcomes for all students with disabilities. Future research should focus on exploring the components of a quality transition plan and family involvement across disabilities and how these variables may lead to potentially more successful post-school outcomes. Future research should also focus on building targeted interventions and looking at infrastructures that can address both parent and student involvement in the transition planning process that, in turn, not only yields higher compliance but also implements effective quality practices for transition services.
Footnotes
Declaration of Conflicting Interests
The author(s) declared no potential conflicts of interest with respect to the research, authorship, and/or publication of this article.
Funding
The author(s) disclosed receipt of the following financial support for the research, authorship, and/or publication of this article: Support for this research was provided by the Maternal and Child Health Bureau of Health Resources and Services Administration (HRSA; Grant HRSA-H6MMC22711) and the Eunice Kennedy Shriver National Institute of Child Health and Human Development (P30 HD15052).