
Abstract
Individualized Education Program (IEP) meetings are an important component of special education; however, few students actually attend and meaningfully participate in their meetings. Using a large-scale national survey, this study examined student attendance and participation at IEP meetings and the predictors of these outcomes. Respondents were 1,183 parents of students with disabilities across all grade levels. Results indicated that only a third of students attended their most recent IEP meeting. Most students who did attend their meeting were not actively participating. Results from a factor analysis of participatory behaviors challenge previous conceptualizations of student participation. Predictors of student involvement included strength of the parent–teacher partnership, as well as certain student characteristics related to grade and disability type. Implications are discussed.
Keywords
Critical decisions about a student’s special education services and supports are made during the annual Individualized Education Program (IEP) meeting, such as determining classroom placement and goals for the year ahead. Although the Individuals with Disabilities Education Improvement Act (IDEA, 2004) spells out specific guidelines surrounding the creation and implementation of IEPs, relatively little emphasis is placed on the student’s role in this process. The law merely states that the student should be included in IEP meetings “whenever appropriate” and that they must be invited to attend the meeting (and their preferences be “considered”) if the purpose of the meeting includes planning for the postschool transition (§300.320). This lack of clear guidance leaves schools to determine students’ involvement in this crucial planning process.
While student attendance is a vital first step, students should be supported to actively participate and contribute to decision-making during IEP meetings (Chandroo et al., 2018; Test et al., 2004). Active participation in IEP meetings is associated with a myriad of benefits, including increased academic achievement (Barnard-Brak & Lechtenberger, 2010), a greater ability to set and accomplish goals (Benz et al., 2000), and a better understanding and more positive views of the entire IEP process (Martin, Van Dyke, Christensen, et al., 2006). Furthermore, participation can provide an opportunity for students to engage in their academic planning while developing and practicing self-determination skills (Williams-Diehm et al., 2008). However, even when students do attend their IEP meeting, few are active participants (Powers et al., 2005; Wagner et al., 2012). Despite the potential positive impact of student attendance and participation, few empirical studies have examined how to increase students’ involvement in the IEP process (Sanderson & Goldman, 2020).
Research on this topic that does exist has been fragmented, typically focusing on secondary students (Sanderson & Goldman, 2020), leaving younger, elementary-age students largely unexamined. Moreover, student participation has not been consistently defined and analyzed. Participation has been examined as a binary (yes/no) variable (e.g., Griffin et al., 2014; Wagner et al., 2012) or a small subset of behaviors (e.g., Cease-Cook et al., 2013; Kelley et al., 2011). Definitions and procedures for measuring participation are inconsistent across studies and do not take different types of participation into account. For example, two commonly used self-advocacy curricula, the Self-Advocacy Strategy (Van Reusen et al., 1994) and the Self-Directed IEP (Martin et al., 1996) share many similarities, but they ultimately conceptualize student participation in different ways. The Self-Advocacy Strategy primarily defines participation as the student providing input or sharing preferences about IEP content. On the contrary, the Self-Directed IEP considers student participation to be conducting administrative-type tasks that represent a leadership role at the IEP meeting, such as introducing team members. Although both notions are appropriate, it is unclear whether these are two distinct forms of participation or whether they are interrelated and together form a broader conceptualization of student IEP meeting participation.
Characteristics Associated With Student IEP Meeting Involvement
To attain a comprehensive understanding, we must consider characteristics of the student, their family, and their family’s relationship with the school that may be associated with student involvement during IEP meetings. Given the “requirements” for participation that begin when students become “transition-age” (IDEA, 2004), current grade level is likely related to student involvement at IEP meetings, with increased involvement as students get older. In a large-scale study, Wagner and colleagues (2012) found that less than half of middle school students (ages 11–14) attended their most recent IEP meeting. In contrast, studies of high school students report over 70% of students present at their meeting (Martin et al., 2004; Wagner et al., 2012). When present, older students are also more likely to participate at their meetings (Griffin et al., 2014; Wagner et al., 2012). However, no studies to date have considered changes in student IEP involvement (i.e., attendance and participation) across the full range of “school-age” students.
IEP meeting involvement may also vary by student disability and related characteristics. Specifically, students with low-incidence disabilities and greater support needs may be less likely to attend and/or participate in IEP meetings, even when in high school. In a nationally representative sample, high school students with autism spectrum disorder (ASD) or intellectual disability (ID) were the least likely to attend or participate in their transition planning meetings (Shogren & Plotner, 2012). Conversely, students with high-incidence disabilities may be more likely to be involved in their IEP meetings. Weidenthal and Kochlar-Bryant (2007) found that the large majority of students with a learning disability (LD) were present at their meetings. In fact, spending more time in general education and having higher cognitive and social skills have been linked to increased involvement in IEP meetings (Griffin et al., 2014; Wagner et al., 2012).
Parent characteristics may also predict student attendance and participation at IEP meetings. For example, benefits associated with higher household incomes (Dahl & Lochner, 2012) may extend to student involvement in IEP meetings. Wagner and colleagues (2012) found that annual household income over US$50,000 predicted adolescents’ participation in IEP meetings. Other characteristics that impact parent involvement in special education, such as level of education and race/ethnicity (Goldman & Burke, 2017), may also impact student involvement.
Finally, characteristics related to the family’s partnership with school personnel (Blue-Banning et al., 2004; Summers et al., 2005) have not yet been examined as potential predictors of student involvement at IEP meetings. Wagner and colleagues (2012) found that parent involvement, measured by the number of school events parents attended, significantly predicted student attendance and active participation at transition planning meetings. However, partnership is considered to be a broader, more meaningful term that encompasses family involvement, collaboration, communication, and other overlapping concepts (Summers et al., 2005). If parents have strong partnership with the school team and positive experiences at IEP meetings, student involvement may also be more likely (deFur, 2012).
Findings from this body of literature provide a preliminary idea of some factors that may be related to student involvement at IEP meetings. However, this limited research base needs to be expanded beyond transition-age students. To address gaps in the literature and provide an updated understanding of student involvement in IEP meetings, this study examined current trends across grade levels, including predictors of student attendance and participation. The following research questions guided this study:
Method
Participants
Survey respondents were 1,183 parents or legal guardians of school-age children with disabilities (hereafter referred to as “parent respondents”). Participants were eligible if they were (a) 18 years or older and (b) the parent or legal guardian of at least one child with disabilities. At the time of the survey, their child must have (a) been between the ages of 5 and 21 years (i.e., “school-age”) and (b) had a current IEP. Parent respondents resided across 50 states and were primarily White and female (see Table 1). Parent respondents ranged in age from 19 to 77 years, with a mean age of 44.14 (SD = 8.73) years. As shown in Table 2, the children of respondents (i.e., students with disabilities) were largely male and ranged in age from 5 to 21 years, with a mean age of 11.75 (SD = 4.09) years. Children were evenly dispersed across grade categories, with approximately 25% in each of the following groups: lower elementary (kindergarten [K]–Grade 2), upper elementary (Grades 3–5), middle school (Grades 6–8), and secondary school (Grades 9+). The mean functional ability level, measured by the WeeFIM™ on a scale from 18 to 126, was 97.22 (SD = 21.83); higher scores indicate greater independence. The most common disabilities included ASD, speech and language impairment, and LD.
Demographics of Parent Respondents.

Note. Respondents were not required to answer every survey item; this resulted in slightly varying ns for each demographic variable as shown above (range n = 1,152–1,181).
Demographics of Students With Disabilities.
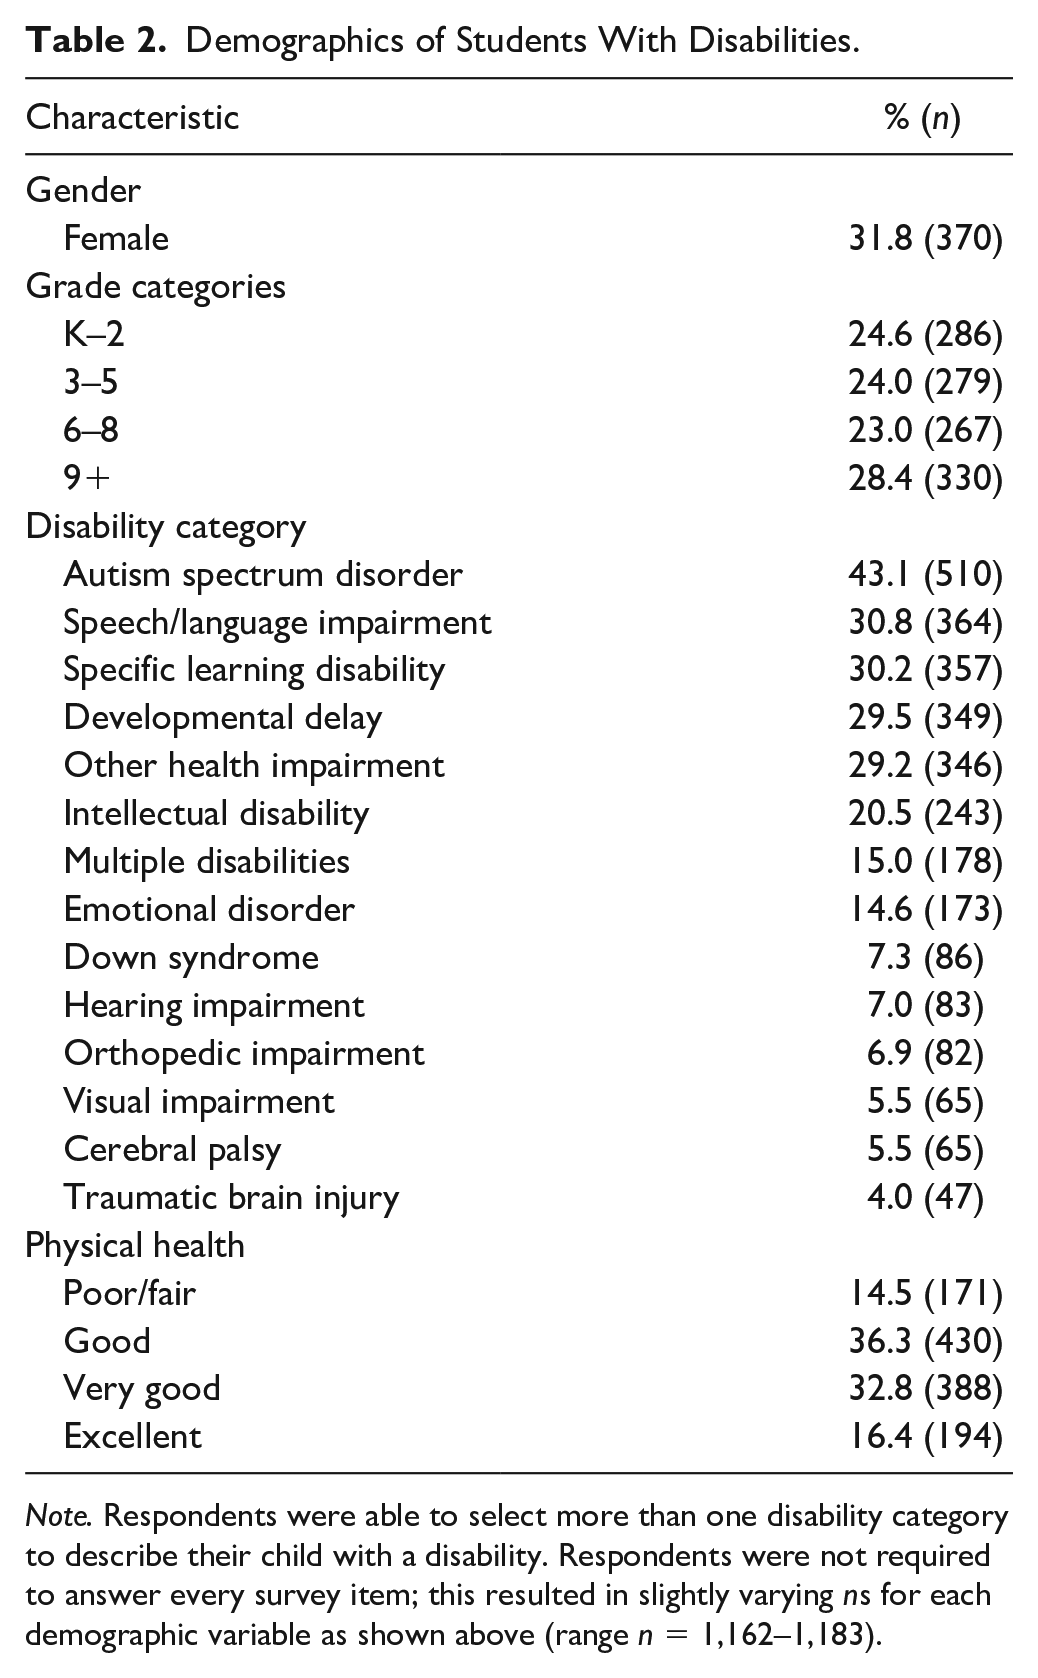
Note. Respondents were able to select more than one disability category to describe their child with a disability. Respondents were not required to answer every survey item; this resulted in slightly varying ns for each demographic variable as shown above (range n = 1,162–1,183).
Procedures
Based on prior studies of student IEP participation (e.g., Griffin et al., 2014; Martin et al., 2004; Martin, Van Dyke, Christensen, et al., 2006; Wagner et al., 2012), this survey was developed using an iterative process. An initial survey was pilot tested by two individuals with master’s degrees in special education and experience with the IEP process. Minor revisions were made based on feedback before submitting the study to the Institutional Review Board for approval. The survey was then uploaded to REDCap, a secure web-based application (Harris et al., 2009).
Participants were recruited in a variety of ways. E-mails and flyers were distributed to approximately 200 state and local chapters of the Arc (a national intellectual and developmental disability advocacy organization), 67 University Centers for Excellence in Developmental Disabilities, and numerous parent support groups (e.g., Parent Training and Information Centers) across all 50 states. Recruitment emails were also sent to more than 7,000 agencies listed in the Wrightslaw Yellow Pages for Kids with Disabilities. In addition, personalized phone calls and emails were sent to a subset of the above organizations that specialize in providing services to diverse families of youth with disabilities. Recruitment flyers were also posted on Facebook by the lead author and disability organizations.
The survey was posted on-line from September 2017 to January 2018. Survey instructions stated that only one parent or legal guardian per family could participate. If the family had more than one child meeting inclusion criteria, the respondent was directed to answer survey questions about their oldest qualifying child only. The survey consisted of four main sections, including information about (a) the parent respondent, (b) the parent respondent’s child with a disability, (c) the parent respondent’s partnership with school personnel, and (d) the student’s attendance and participation at their most recent IEP meeting. Branching logic was used throughout the survey, wherein participants only saw certain questions if they answered yes to a related question. For example, the parent respondent only saw survey questions about student participation during the IEP meeting if they answered that their child attended their most recent IEP meeting. All survey responses were submitted electronically in REDCap.
Dependent Variables: Student IEP Attendance and Participation
To measure attendance, respondents answered yes or no to the question, “Did your child attend his or her last IEP meeting?” To measure student participation, two scales were used to capture different facets of student participation from the literature. The first, the Student IEP Behavior Scale, was derived from five participatory behaviors addressed by the Self-Directed IEP curriculum (Martin et al., 1996). Respondents were asked to rate the extent to which their child participated in the following activities: (a) introducing IEP team members, (b) stating the purpose of the meeting, (c) reviewing past goals, (d) stating future goals, and (e) closing the meeting. Each participatory behavior was rated on a 5-point Likert-type scale (1 = not at all to 5 = extensively). The second scale, called the Student Input Scale, was based on five behaviors related to sharing input and preferences, as defined by the Self-Advocacy Strategy intervention (Van Reusen et al., 1994). Respondents were asked to rate the extent to which their child shared input or preferences about (a) school courses, (b) classroom placement, (c) strengths, (d) area(s) of need, and (e) IEP goals. Each student input item was rated on the same 5-point Likert-type scale.
Independent Variables: Child, Parent, and Partnership Characteristics
Characteristics of the child included current grade level (as a continuous variable), physical health status (1 = poor/fair to 4 = excellent), and the following dichotomous variables: diagnosis of each of Table 2’s disability categories, 100% of day in general education, and anticipated high school diploma. Functional ability level was measured using the Functional Independence Measure for Children (WeeFIM™), which includes 18 items on the amount of assistance required to complete basic tasks. Total scores range from 18 (requires total assistance in each activity) to 126 (total independence in each activity; α = .95). For children with disabilities, this measure has strong internal consistency reliability (>.90) and concurrent validity (>.85; Msall et al., 1996). In addition, child maladaptive behavior was measured using the eight-item General Maladaptive Index from the Scales of Independent Behavior–Revised. Each item is rated by how frequently the child engages in a specific maladaptive behavior (e.g., hurtful to self, destructive to property) from 0 (never) to 5 (1 or more times per day). Total scores range from 0 to 40 (internal consistency > .95, construct validity > .90; Bruininks et al., 1996).
Characteristics of the parents included age (continuous) and the following categorical variables: education, marital status, race/ethnicity, income, employment status, and physical health status. See Table 1 for response options. Characteristics of the partnership between the parent respondent and the personnel at their child’s school were measured in three ways. First, parent respondents rated the frequency of communication with their child’s teacher on a scale from 1 (daily) to 5 (less than once per month). To measure parents’ relationship with potential IEP team members, parents rated their relationship with each of the following six types of school personnel: special education teacher, general education teacher, principal, vice principal(s), related service providers, and district representative (e.g., Director of Special Education). Ratings occurred on a 5-point Likert-type scale, ranging from 1 (extremely negative) to 5 (extremely positive). Scores were summed, with a possible range from 6 to 30. The Family–Professional Partnership Scale–Family Version (FPPS; Summers et al., 2005) is an 18-item scale used to measure the partnership between parents and teachers (α = .93; Summers et al., 2005). Using the FPPS, parent respondents rated their satisfaction with their child’s teacher across various family- and school-focused collaborative competencies on a 5-point scale from 1 (very dissatisfied) to 5 (very satisfied). FPPS scores were calculated by summing item scores and could range from 18 to 90.
Analyses
To evaluate student attendance at IEP meetings, the percentage of students who attended their most recent IEP meeting was calculated for students overall and for each grade category (i.e., K–2, 3–5, 6–8, 9+). Attendance was compared across groups using chi-square. For students who attended their IEP meeting, scores from the Student IEP Behavior Scale and Student Input Scale were analyzed to determine their participation. For each scale, means and standard deviations were calculated for each of the five items. Total scores for each scale were calculated by summing five individual item scores for each respective scale, with possible ranges from 5 (did not participate at all) to 25 (participated extensively). Then, analyses of variance (ANOVAs) were conducted to compare mean total scores for each scale by grade categories. Tukey HSD tests were used post hoc to determine significant differences in group means between grade categories. To determine the relationship between participatory behaviors and student input during IEP meetings, responses to items from both scales were entered into a correlation matrix and a factor analysis. Variables with similar patterns of response were combined to simplify the data (Brown, 2015).
Finally, two separate regressions were conducted to identify the predictors of student IEP involvement. We used logistic regression to evaluate predictors of student attendance due to the dichotomous nature of this variable, and multiple linear regression to evaluate predictors of student participation. We included the aforementioned child and parent characteristics and parent–school partnership variables as predictors. To include more responses in the regressions, median scores from the WeeFIM and the FPPS were imputed for those who were missing two or fewer items within each 18-item measure (n = 83 and 113, respectively; Harrell, 2015).
Results
Student Attendance at IEP Meetings
Overall, 33% (n = 390) of students in this sample attended their most recent IEP meeting. Student attendance significantly differed across grade categories, χ2(3) = 277.44, p < .001. Whereas less than 15% of students attended their IEP meetings in each of the two lowest grade categories (i.e., n = 41 for K–2 and n = 37 for Grades 3–5), attendance rates increased to 30% for students in Grades 6 to 8 (n = 80) and 67.9% for students in Grades 9 and over (n = 224).
Student IEP Meeting Participation
To answer the second research question, scores from the Student IEP Behavior Scale and the Student Input Scale were examined separately. See Table 3 for individual item scores.
Student IEP Participation Item Descriptives and Factor Analysis Results.

Note. Individual items were scored on a scale from 1 to 5. Total scores for the Student IEP Behavior Scale and the Student Input Scale could range from 5 to 25, respectively. The total Student Participation score could range from 10 to 50. For Student IEP Behavior Scale, n = 371; for Student Input Scale, n = 367; for Total Student Participation Score, n = 360. IEP = Individualized Education Program.
Student IEP Behavior Scale items. bStudent Input Scale items.
Student IEP Behavior Scale
As shown in Table 3, mean levels of student engagement in each participatory behavior ranged from 1.57 (closing the meeting) to 2.23 (stating future goals) on a 5-point scale. Notably, over one fourth (28.3%) of students received the lowest score (i.e., did not participate at all) for all scale items. Across items, the mean total participatory behavior score was 9.20 (SD = 4.96) on a scale of 5 to 25. Mean total participatory behavior scores were significantly different between grade categories, F(3, 360) = 3.29, p < .05, with significant differences between students in Grades K–2 (M = 7.28, SD = 4.28) and Grades 9+ (M = 9.79, SD = 4.92), p < .05.
Student Input Scale
The mean level of participation for each student input behavior in this scale ranged from 1.73 (input on IEP goals) to 2.30 (input on school courses) on a 5-point scale (see Table 3). Again, large percentages of students did not participate at all across various scale items and approximately one fourth (25.6%) of students had a total score of 5 (i.e., not at all for each student input behavior). The mean total level of student input across items was 10.27 (SD = 5.31) on a scale of 5 to 25. Significant differences existed in total student input across grade categories, F(3, 357) = 7.00, p < .001, with significant differences between students in Grades K–2 (M = 7.05, SD = 4.12) and those in Grades 6 to 8 (M = 10.18, SD = 5.44) and 9+ (M = 11.07, SD = 5.27).
Student IEP Meeting Participation Factor Analysis
The total scores from each of the two student participation scales were highly correlated (Pearson r = .72). Ten items (i.e., five from the Student Behavior Scale and five from the Student Input Scale) were entered into a factor analysis with varimax rotation. All 10 variables formed a single factor that had high internal consistency (α = .92) and accounted for 59.0% of the total variance (see Table 3). Thus, a single combined total student participation score was calculated, with a possible range from 10 (not at all) to 50 (extensive participation). This total score was used for further analyses by grade categories and as the dependent variable for the regression.
The mean of the combined total student participation score was 19.47 (SD = 9.55). Notably, 17.2% (n = 62) of students in attendance at their IEP meetings did not participate at all using any of the 10 behaviors. This included 50.0% (n = 20) of students in K–2, 31.3% (n = 10) of Grades 3 to 5, 16.0% (n = 12) of Grades 6 to 8, and 8.2% (n = 17) of Grades 9+ (n = 3 grades unreported). Significant differences existed in total student participation scores between grade categories, F(3, 350) = 5.81, p = .001, with significant differences between students in Grades K–2 (M = 14.33, SD = 7.42) and Grades 6 to 8 (M = 19.07, SD = 9.45) and 9+ (M = 20.87, SD = 9.36).
Predictors of Student IEP Meeting Involvement
The logistic regression to determine the effects of the student, parent, and parent–school partnership characteristics on student attendance during IEP meetings was statistically significant, χ2(30) = 289.13, p < .0001. The following variables independently predicted the increased likelihood of student attendance: higher grade, spending all day in the general education setting, anticipated high school diploma, the presence of a visual impairment, and stronger parent–teacher partnership (i.e., higher FPPS scores). See Table 4.
Logistic Regression Results for Predictors of Student IEP Meeting Attendance.
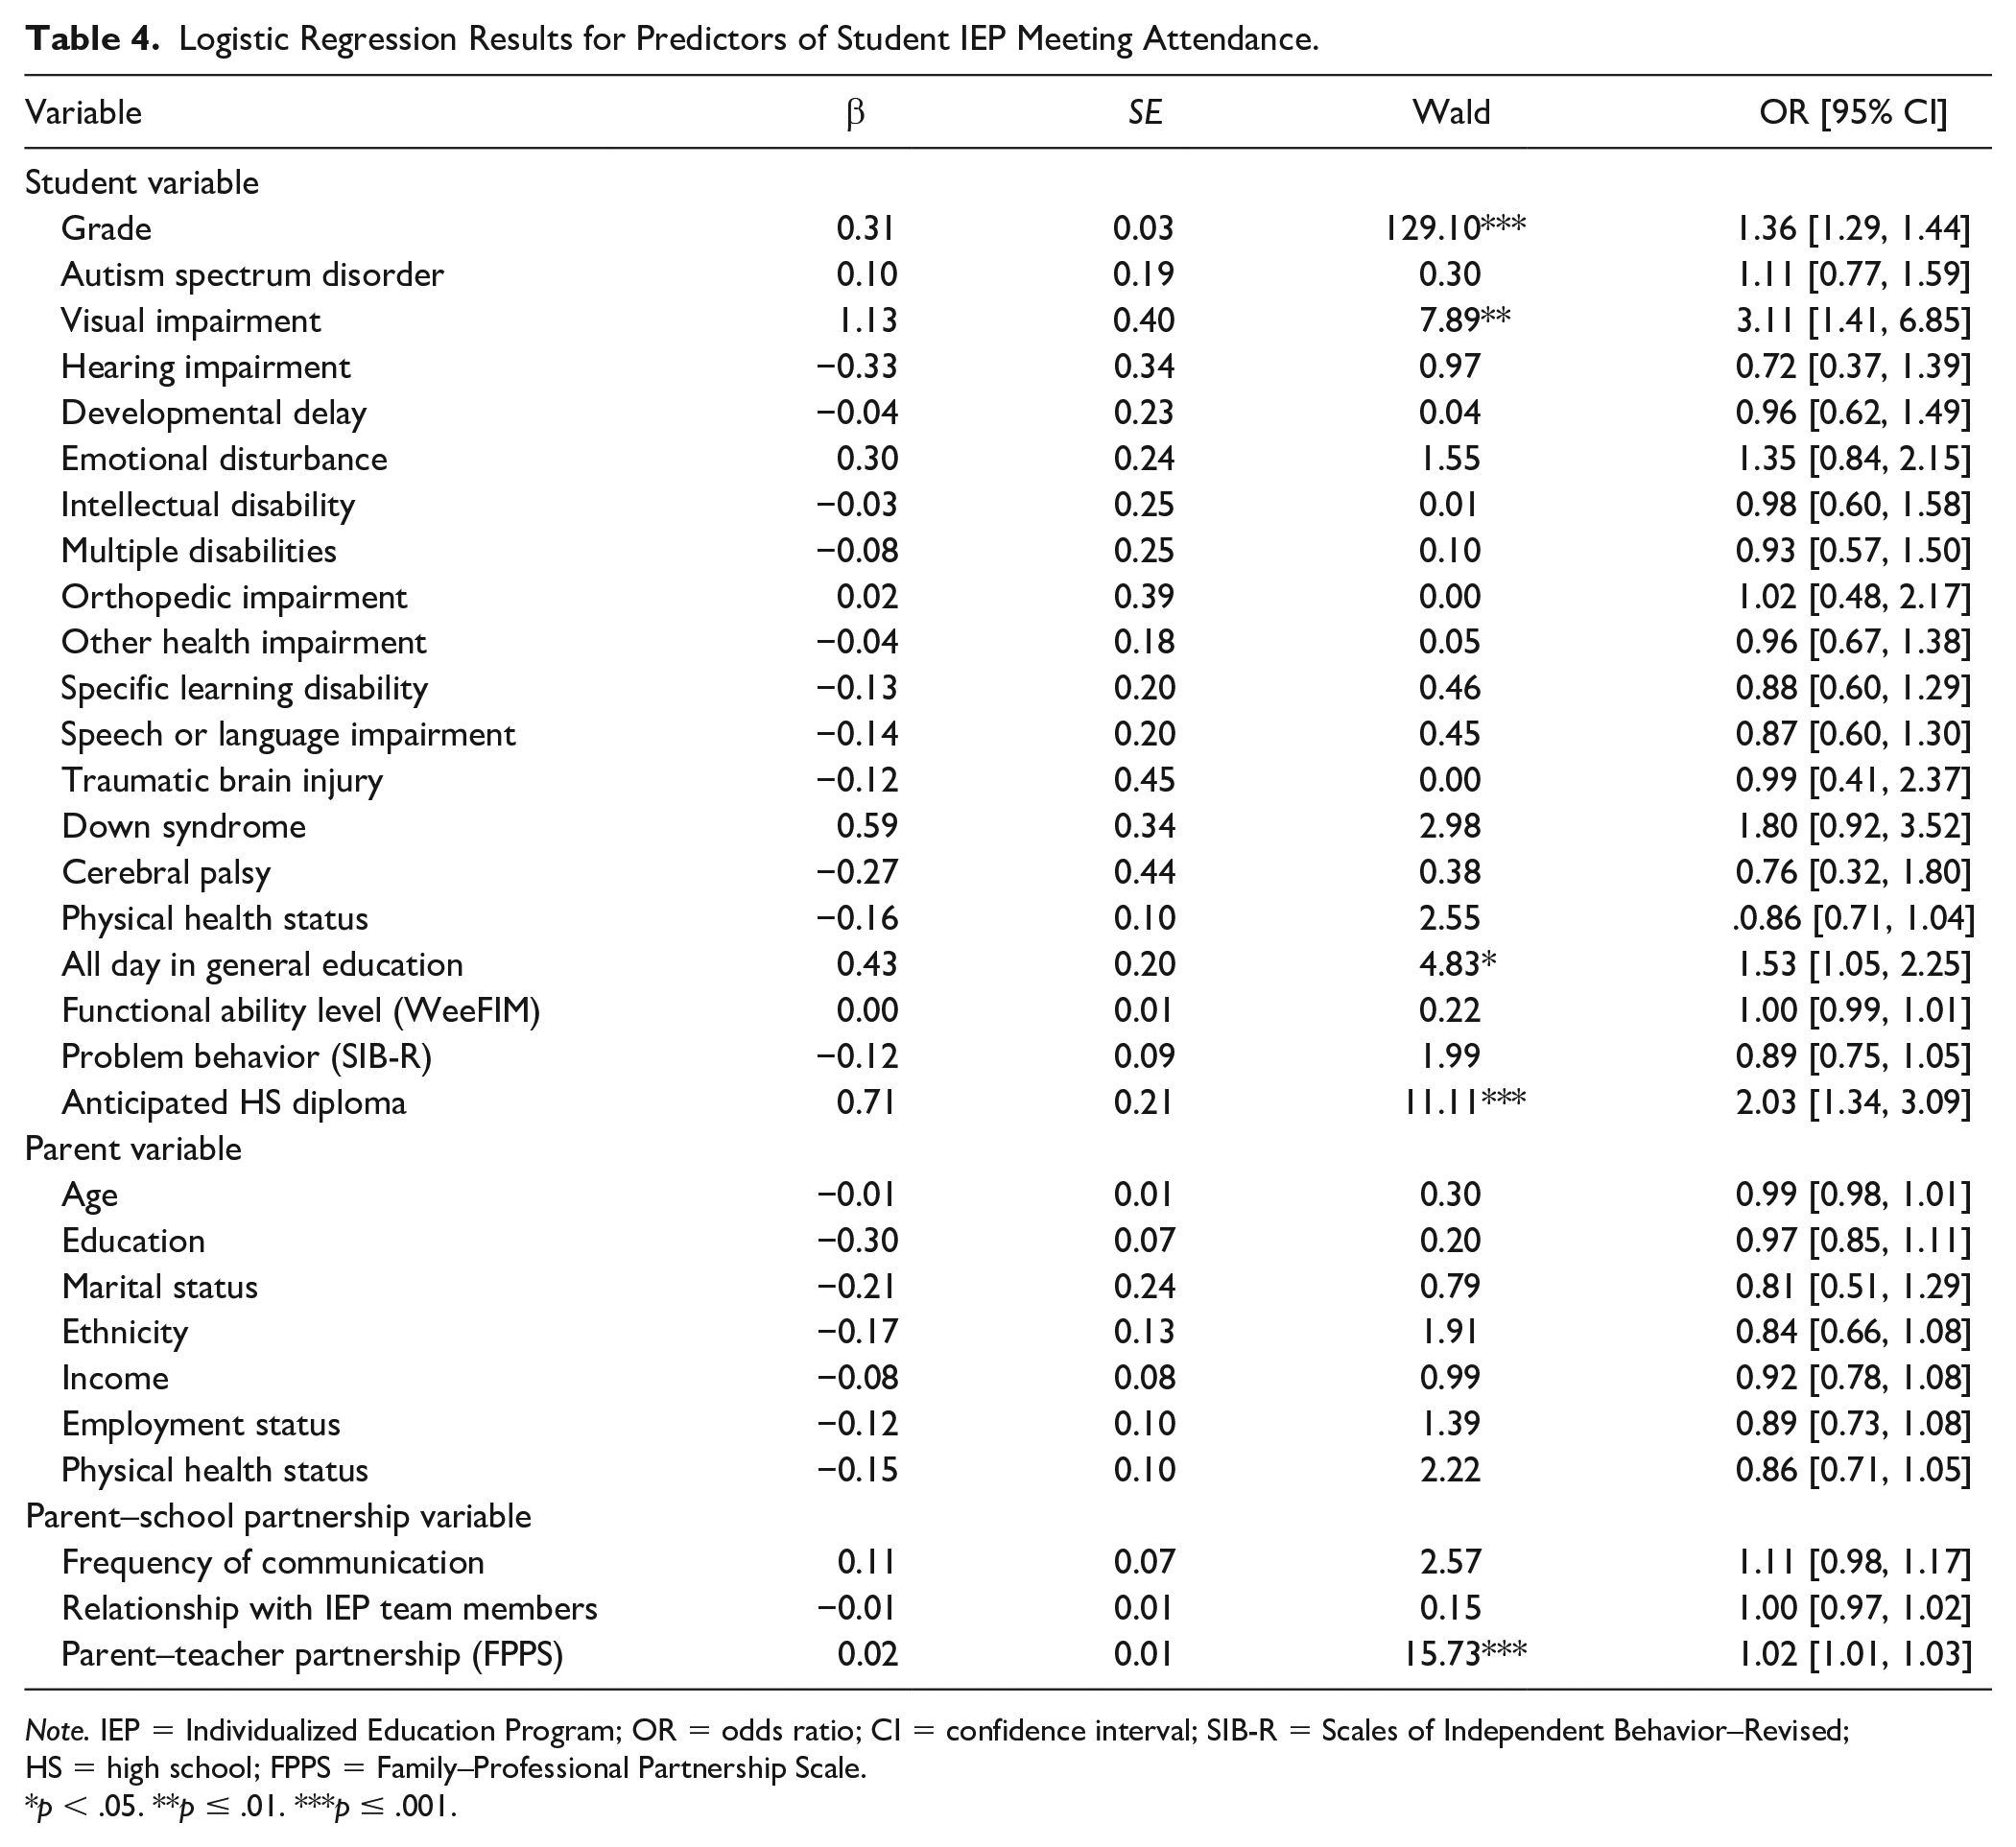
Note. IEP = Individualized Education Program; OR = odds ratio; CI = confidence interval; SIB-R = Scales of Independent Behavior–Revised; HS = high school; FPPS = Family–Professional Partnership Scale.
p < .05. **p ≤ .01. ***p ≤ .001.
A multiple regression analysis determined the independent variables significantly predicted student participation, F(30, 284) = 3.92, p < .0001 (adjusted R2 = .218). Higher levels of student participation were associated with higher grade, the presence of an orthopedic impairment, and stronger parent–teacher partnership (i.e., higher FPPS scores). The presence of Down syndrome was associated with decreased student participation. See Table 5.
Regression Results for Predictors of Student Participation During IEP Meetings.
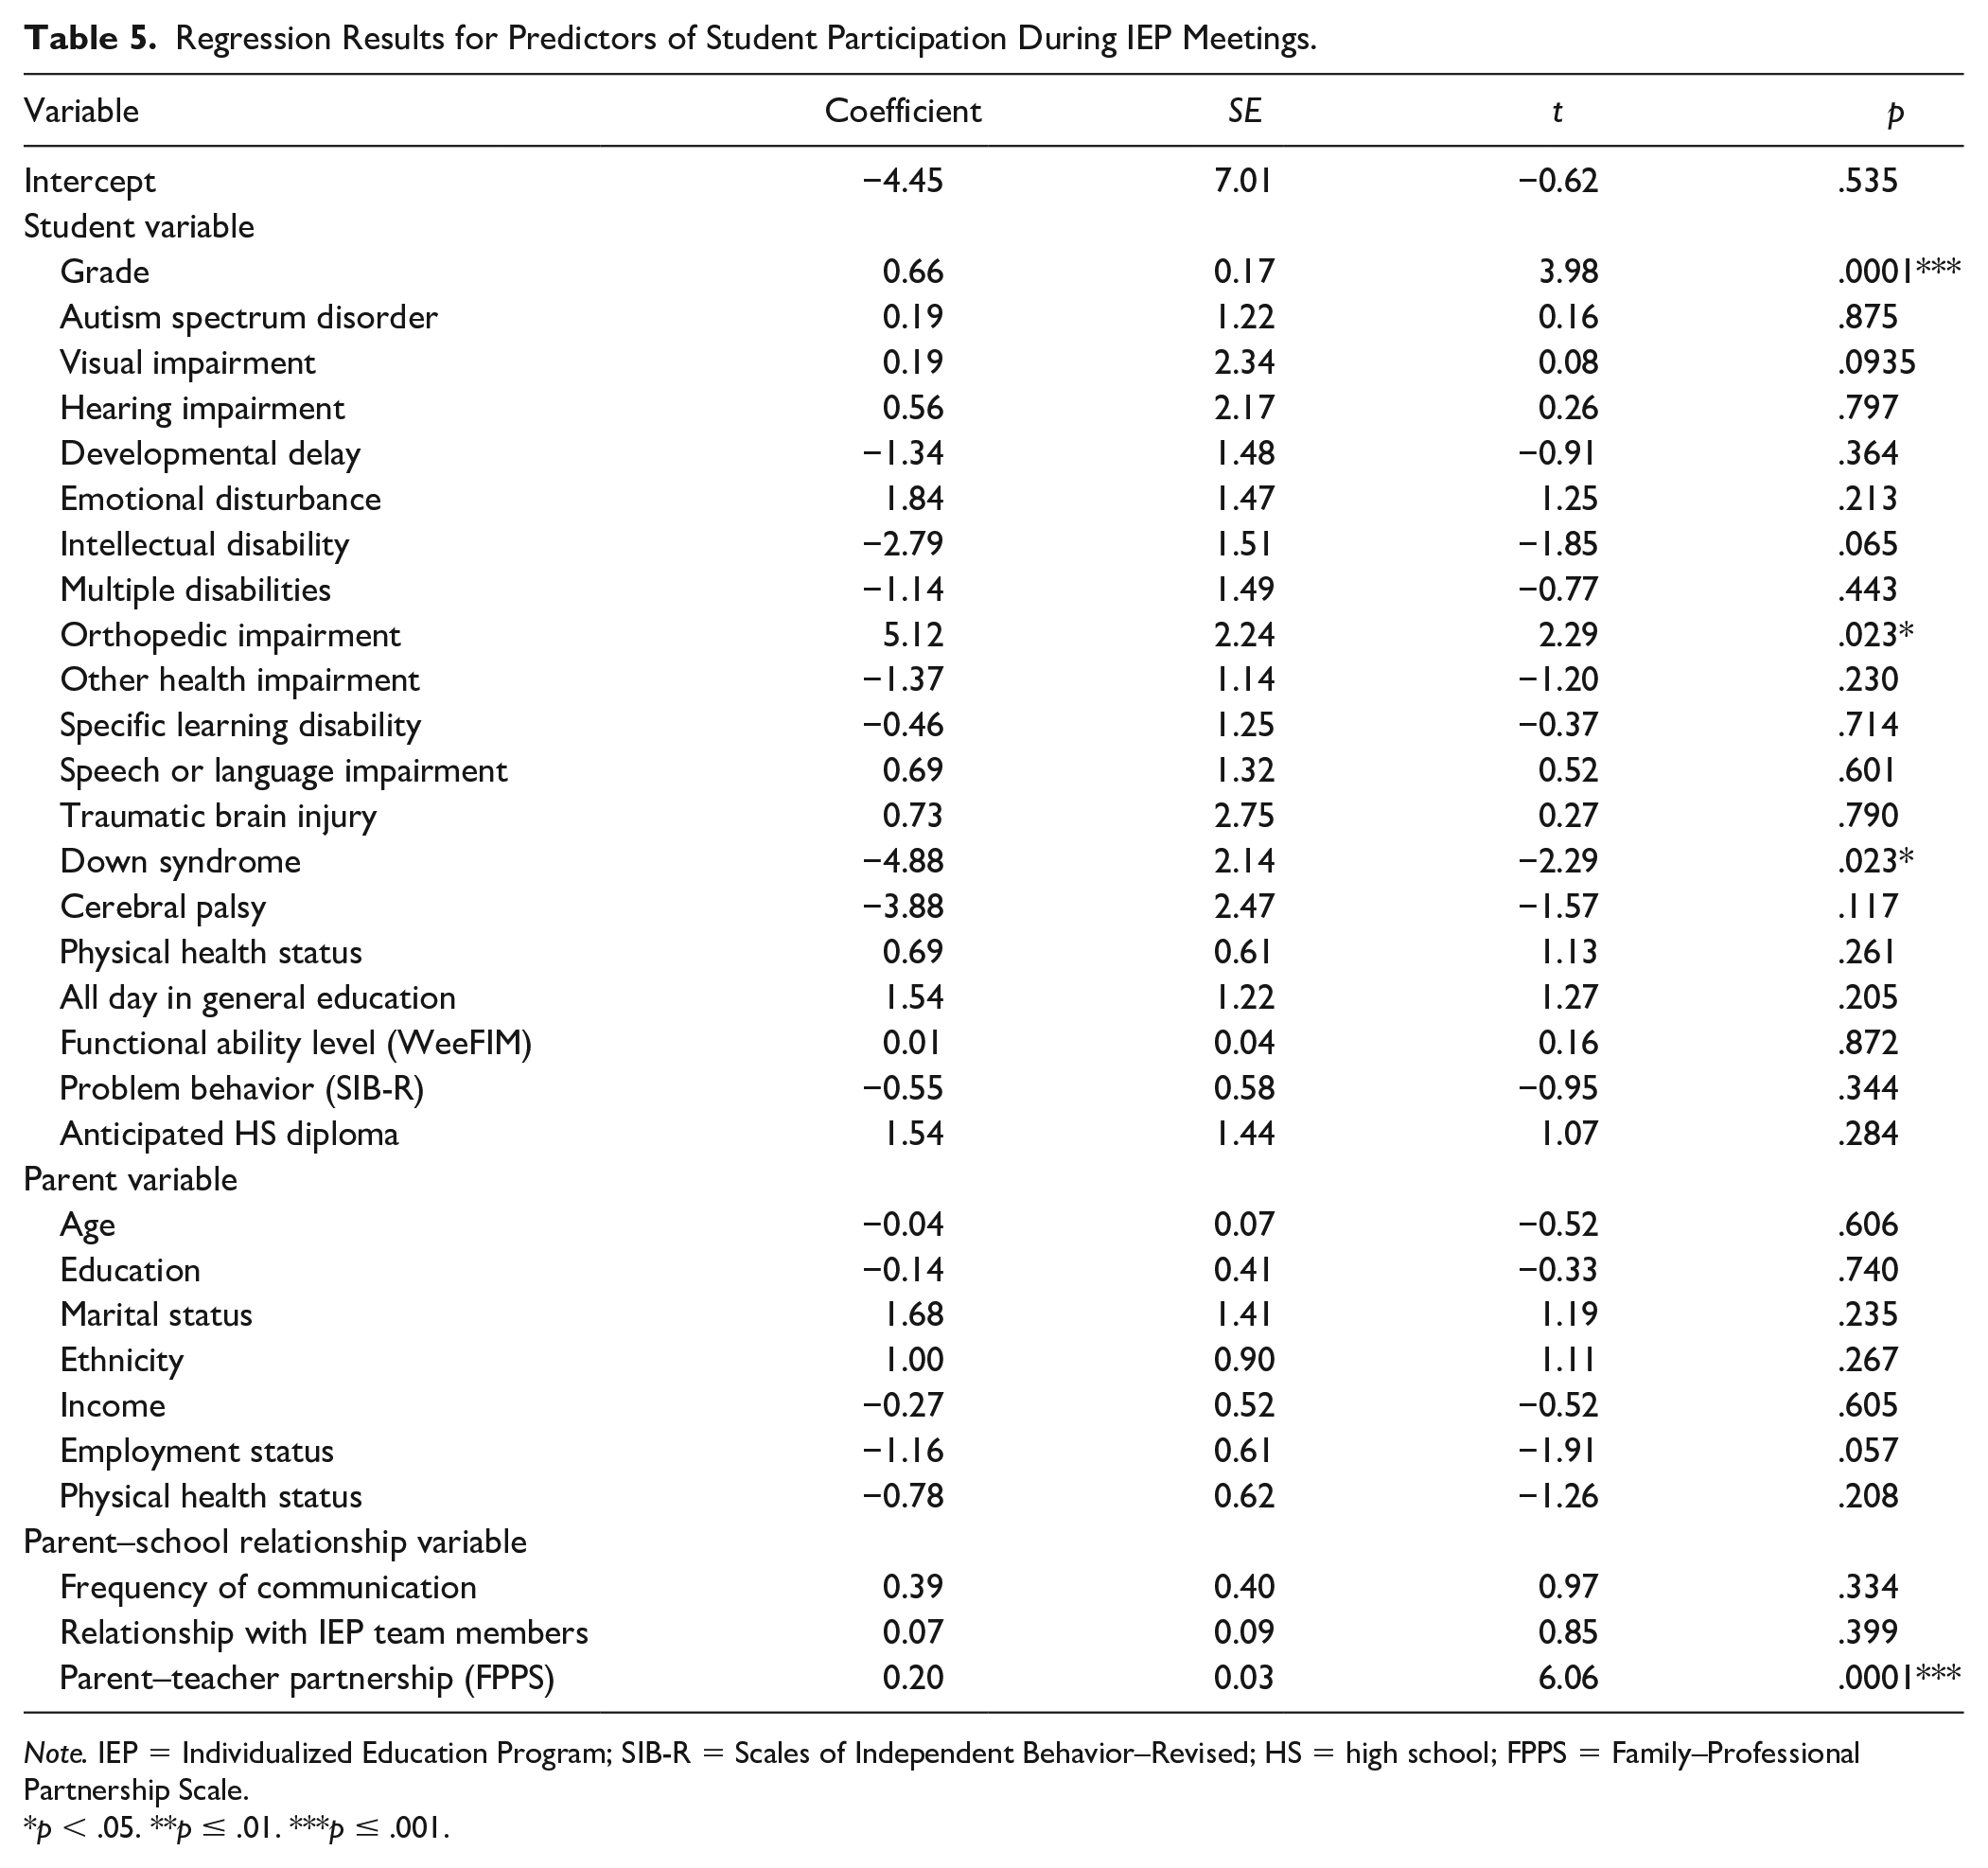
Note. IEP = Individualized Education Program; SIB-R = Scales of Independent Behavior–Revised; HS = high school; FPPS = Family–Professional Partnership Scale.
p < .05. **p ≤ .01. ***p ≤ .001.
Discussion
Using results from a large-scale national survey, this is the first study to provide insight into IEP meeting involvement for students across all grade levels. Our findings show the variety of behaviors that constitute student participation during IEP meetings, providing an in-depth examination of how students at different grade levels engage in their planning meetings. Findings also shed light on factors that predict student attendance and participation. We present four major findings that have implications for practice, research, and policy.
First, only one third of school-age students in our sample attended their most recent IEP meeting. However, attendance rates varied significantly by grade category. Small percentages (less than 15%) of students in elementary grades attended their IEP meetings. Attendance doubled for students in Grades 6 to 8, and then again more than doubled to 68% for students in Grades 9 and higher. Attendance should be encouraged starting in earlier grades to provide students with ongoing opportunities to participate in decision-making that has important ramifications for their future. By increasing the attendance of younger students, they can become familiar with the IEP process so they will be better prepared to learn and practice critical self-determination skills in the future. Although not well represented in our sample, this may be particularly impactful for students with disabilities and their families from culturally and linguistically diverse (CLD) backgrounds. CLD families are often not treated as equal members of the team and commonly experience IEP meetings that are dominated by professionals (Cobb, 2014).
Second, we found that students who do attend their IEP meetings are not actively participating. On average, students in our sample engaged in their meetings the equivalent of only “a little bit” across all 10 measured behaviors. Furthermore, 17% of the students in attendance could be considered inactive, not engaging in any of the participation behaviors at all. As with attendance, both participatory behaviors and student input during the IEP meeting steadily increased with grade. Still, of the secondary students in attendance at their most recent meeting, many did not participate at all—demonstrating this issue is not unique to younger students.
Although these findings paint a troubling picture, they are consistent with existing literature. Several studies examining middle and high school student attendance during IEP meetings have also found attendance rates of below 50% (Barnard-Brak & Lechtenberger, 2010; Wagner et al., 2012). Similarly, in terms of participation, Martin, VanDyke, Greene, et al. (2006) found that secondary students only spoke for approximately 3% of the meeting. Across studies, even when they attend, most students participate very little. When students are not given the tools to participate during their planning meeting (or are not invited to attend), they are not treated as a valued team member. As the IEP directly affects the student, and the meeting is the context for making important educational decisions, students should be given an opportunity—and the skills needed—to actively participate during the meeting (Chandroo et al., 2018).
A third major finding from this study redefines the concept of student participation. In the past, participation has been conceptualized as a dichotomous variable (e.g., Griffin et al., 2014) or a small subset of behaviors (e.g., Martin et al., 1996). However, because there are many ways for students with disabilities to participate during IEP meetings, a broader approach to measuring participation should be used. This study examined participatory behaviors and student input, two historically separate notions of participation and determined that they are, in fact, highly related. This combined factor provides a more comprehensive conceptualization of student participation.
Finally, predictors were identified for student IEP attendance and participation. Most of the significant predictors were characteristics of the student with disabilities, but they varied across outcomes. Enrollment in a higher grade was the only student characteristic that was a significant predictor of both attendance and participation. The logistic regression showed that students who spent all day in the general education classroom and anticipated a diploma were also 1.5 to 2 times more likely to attend their IEP meetings. These predictors are similar to findings from previous studies on IEP meeting attendance (Griffin et al., 2014; Wagner et al., 2012).
Across both outcomes, the higher the parent–teacher partnership, the more the student involvement. When parents had stronger partnerships with school personnel (measured by the FPPS), students were more likely to attend their IEP meeting and, once there, have higher levels of participation. Notably, this study was the first to examine the relationship between student involvement at IEP meetings and parent–school partnership. Although our findings on parent–teacher partnership are compelling, the benefits should be further explored. Families from CLD backgrounds experience unique barriers to collaborative partnership related to the “dynamics of power and privilege” in the special education system (Cobb, 2014, p. 50). CLD students and families are often viewed through a deficit-based lens (Harry, 2008), which greatly limits the development of respectful, bidirectional, collaborative relationships between schools and families. Such systemic issues need to be considered to build an understanding of strong partnership and IEP involvement for all students, including those from more diverse backgrounds who have historically been excluded and marginalized (Ko et al., 2020).
Implications for Research, Practice, and Policy
Results from this study have important implications for practice. Much work is needed to increase student involvement in IEP meetings—and this work can begin in the school setting in early grades. School districts can emphasize the importance of student involvement by training teachers to better incorporate students at IEP meetings. By training educators to involve students, IEP meetings can be changed from the current teacher-driven model to a more student-friendly approach (Chandroo et al., 2018) with benefits for students long before they turn 16.
In addition, our findings suggest that the partnership between parents and teachers should be actively promoted. Teachers must be trained to meaningfully support parents of students with disabilities, using culturally responsive practices to encourage participation in the educational decision-making processes (Rossetti et al., 2017) and treating them as valued members of their child’s IEP team (Staples & Diliberto, 2010). Building strong parent–teacher partnerships will empower parents (Blue-Banning et al., 2004) and, in turn, may positively influence student involvement during IEP meetings.
Results from this study also have research implications. Specifically, participatory behaviors and student input should no longer be considered two separate types of participation. Moving forward, researchers should measure the extent to which students engage in all 10 of the behaviors that comprise student participation and explore whether there are other behaviors that should be included. Only then can we begin to develop a comprehensive picture of the extent to which students are actively participating in their IEP meetings. In addition, these behaviors should be evaluated to determine whether they generalize to a more diverse student population. CLD students whose families hold collectivist values (vs. individualistic) may be hesitant to engage in self-advocacy during IEP meetings (Valenzuela & Martin, 2005). The current body of literature addresses this issue only conceptually (Ko et al., 2020)—more research is needed to identify and evaluate behaviors or practices that contribute to this important outcome, considering student involvement in the IEP process may aid in the development of culturally responsive IEPs (Barrio et al., 2017).
Research is also needed to further explore student characteristics that predict student IEP involvement. Given that the sample from this study primarily comprised White, middle-class students, future research should examine the predictors of attendance and participation for students from CLD backgrounds. Understanding the experiences of CLD students and families is imperative, given that students from diverse backgrounds experience unique barriers and now account for more than half of school-age students in the United States (de Brey et al., 2019). Further research is also needed to better understand how specific disabilities (i.e., visual or orthopedic impairment or Down syndrome) or disability characteristics relate to student involvement in IEP meetings.
Findings from this study also have policy implications. Moving beyond the current mandatory IEP meeting invitations for students 16 years and older, future legislation should require that students of all ages be invited to attend their meetings. Not only does student attendance at the meeting benefit the student, it also produces value-added benefits for other IEP team members. When students are present, team members feel more comfortable sharing their thoughts, better understand what to do after the meeting, and talk more about student strengths and interests during the meeting (Martin et al., 2004). This shift from a deficit to strengths-based approach may be particularly impactful for CLD students and their families, who are more often viewed through a deficit-based lens (Cobb, 2014). Although attendance itself is not enough, this is a valuable first step toward meaningful student participation at IEP meetings.
Limitations and Conclusion
This study has some limitations that should be noted. First, parent respondents were primarily well-educated, middle-class, White women. This is a common issue in survey research, despite efforts to recruit diverse samples (Hodapp et al., 2018). The views and experiences of this sample do not reflect those of diverse racial or ethnic groups or those from low socioeconomic levels. Indeed, research has shown that CLD students and their families face even greater barriers to collaborative partnership (Harry, 2008) and are often denied opportunities for meaningful participation at IEP meetings (Blackwell & Rossetti, 2014; Wolfe & Durán, 2013). In addition, results from this survey reflect the perspectives of parents only. Although our findings are consistent with the existing literature (Barnard-Brak & Lechtenberger, 2010; Wagner et al., 2012), other IEP team members may have different estimations of student involvement in IEP meetings. Finally, because respondents were able to select more than one disability to describe their child, we were unable to make comparisons across disabilities.
Even with these limitations, this study provides valuable information about student involvement during IEP meetings. The majority of school-age students in this sample were not at their meetings, and even when they were in attendance, students were not participating. Given the added barriers experienced by CLD students and families in being respected as equal members of the IEP team (Harry, 2008), our results—based primarily on the experiences of White, middle-class families—may actually overestimate student involvement. This would indicate an even greater need that must be prioritized in research and practice. Another finding redefines the way we measure and examine student participation, which also needs to be further studied to determine whether and how this definition applies to more diverse, representative students and families. Finally, we found that student involvement is largely linked to the strength of the parent–teacher partnership and student characteristics, with those students in higher grades attending and participating more during their IEP meetings. Interpreting these findings together, much work is needed to understand and improve active student participation during IEP meetings. Given that participation is linked to positive student outcomes, finding ways to meaningfully incorporate all students in their IEP meetings is critical to promoting self-determination in students and creating meaningful and effective IEPs.
Footnotes
Declaration of Conflicting Interests
The author(s) declared no potential conflicts of interest with respect to the research, authorship, and/or publication of this article.
Funding
The author(s) received no financial support for the research, authorship, and/or publication of this article.