



Abstract
Early Intensive Behavioral Intervention (EIBI) can be effective for supporting skills acquisition among children with autism spectrum disorder (ASD). Few studies have followed children with ASD who received EIBI into schools. The purpose of this study was to investigate educational outcomes specific to instructional placement, standardized test proficiency, and special education eligibility under the ASD category for children who received EIBI. Medicaid records were utilized to create a cross-systems data set of 3- to 5-year-old children with ASD (n = 667). Most students were placed in general education, and males and White students were more likely to receive special education services for ASD. Only half of the students participated in standardized testing and met proficiency standards. Implications for future research and advocacy for early intervention are discussed.
Early intensive behavioral intervention (EIBI), based on the principles of applied behavior analysis, is an evidence-based practice for increasing social communication and adaptive skills in children with autism spectrum disorder (ASD) (Caron et al., 2017; Eldevik et al., 2009; Howlin et al., 2009; Makrygianni & Reed, 2010; Reichow, 2012; Reichow & Wolery, 2009; Spreckley & Boyd, 2009; Virués-Ortega, 2010; Warren et al., 2011). EIBI is usually an intensive home- or center-based program delivered one to one for 25 to 40 hr per week for 2 years (Howlin et al., 2009; Lovaas, 1987; Reichow, 2012). EIBI effectiveness studies show significant gains in adaptive behavior, communication, socialization, daily living skills, and intelligence (Caron et al., 2017; Eldevik et al., 2009; Howlin et al., 2009; Makrygianni & Reed, 2010; Reichow, 2012; Reichow & Wolery, 2009; Spreckley & Boyd, 2009; Virués-Ortega, 2010; Warren et al., 2011). EIBI has been systematically reviewed and extensively studied (e.g., Caron et al., 2017); it remains one of the top evidence-based and cost-effective interventions for children with ASD. With the increasing trend in prevalence estimates for ASD over the past decade, service access and support early on is critical. Evaluation of the various long-term outcomes of children with ASD and their families, given their early intervention experience, is needed. The EIBI follow-up studies to date primarily focus on clinical measures of symptom severity or general intelligence. Fewer studies have reported educational outcomes for children who received EIBI.
Educational Outcomes of Children With ASD
In general, there is limited research on academic achievement and predictors of achievement for individuals with ASD. One reason may be that Individualized Education Programs (IEPs) are based on individual student’s needs, which makes aggregating and using the data as an educational outcome measure difficult. Another reason may be that there is variability across states and school districts regarding achievement testing inclusion practices and policies. In the research to date, academic achievement is most commonly measured by standardized achievement and intelligence quotient (IQ) testing (e.g., Woodcock–Johnson Tests of Achievement) and instructional placement setting (Keen et al., 2016). Overall, there are strong correlations between IQ and academic achievement, academic progress, and response to intervention for individuals with ASD (Keen et al., 2016; Kim et al., 2018; Mayes-Dickerson & Calhoun, 2003). Individuals with ASD with higher IQ tend to have better academic achievement overall (Eaves & Ho, 1997; Keen et al., 2016; Kim et al., 2018; Manti et al., 2011; Miller et al., 2017). Autism severity has also been reported to be related to academic achievement and performance in school (Eaves & Ho, 1997; Kim et al., 2018). In addition, better social skills functioning at the age of 6 years was significantly associated with greater achievement later on (Estes et al., 2011). In comparison with typically developing peers, at least in some studies, discrepant and variable achievement of students with ASD has been reported (Jones et al., 2009; Wei et al., 2015).
Reading and Mathematics
Keen and colleagues (2016) conducted a literature review on the academic achievement of students with ASD. In the review, Keen et al. reported that reading achievement was found to be commensurate with IQ for individuals with an IQ of 80 or greater. Among individuals with an IQ of below 80, reading achievement was a relative strength (Keen et al., 2016; Mayes-Dickerson & Calhoun, 2003). For mathematics, similar results were found with individuals with ASD with higher ability (i.e., higher IQ) having average to below average performance (Estes et al., 2011; Keen et al., 2016; Mayes-Dickerson & Calhoun, 2003; Troyb et al., 2014). Mathematics achievement has also been reported to be positively correlated with IQ (Assouline et al., 2012; Keen et al., 2016; Mayes-Dickerson & Calhoun, 2003).
There is significant variability apparent across both reading and mathematics achievement and discrepancies between predicted achievement based on IQ in some studies (e.g., Estes et al., 2011). Miller et al. (2017) characterized academic performance and predictors of achievement among 26 children with ASD. Multiple regression analyses indicated weaknesses in reading comprehension relative to word reading. Mathematics skills were observed to be better overall than reading skills, but math reasoning was lower than numerical operations among the sample. Miller and colleagues also found that preschool verbal abilities significantly predicted school-age reading comprehension and early motor functioning predicted later math skills (when controlling for IQ). Overall, intervention receipt has not been evaluated in relation to reading and mathematics achievement in school for students with ASD.
Instructional Placements
In the United States, the Individuals with Disabilities Education Improvement Act (IDEA, 2004) mandates that education for students with disabilities should be in the least restrictive environment appropriate for a given child. Among studies centered on EIBI effectiveness, 10 included school placement at follow-up. When compared with children who received treatment as usual, more children with ASD who received EIBI were placed in a general education classroom with or without support (Cohen et al., 2006; Lovaas, 1987; Magiati et al., 2007; McEachin et al., 1993; Remington et al., 2007; Sheinkopf & Siegel, 1998; T. Smith et al., 2000). Special education or self-contained classroom placements were the second most common instructional placements for children with ASD receiving EIBI (e.g., Remington et al., 2007). Moreover, higher IQ and younger age at EIBI intake were predictive of being placed in a general education classroom at 4 to 6 years of follow-up (Harris & Handleman, 2000). Lower IQ and being older at EIBI intake were predictive of special education classroom placement as well (Harris & Handleman, 2000). Previous research also indicated that children with ASD were more likely to receive less inclusive classroom settings in comparison with children with psychiatric diagnoses (Spaulding et al., 2017).
Purpose of the Present Study
Although some previous research has focused on the early predictors of academic achievement among children with ASD (e.g., Kim et al., 2018), and EIBI-specific treatment studies have evaluated instructional placement, the data are limited by size and scope and research is needed to examine specifically how children with ASD are performing academically in relation to prior EIBI intervention. In this study, we evaluated classroom placement and extend the previous literature on educational outcomes for students with ASD who received EIBI to include standardized testing participation and proficiency as well as special education eligibility status.
Method
Participants
This study was an observational study, utilizing a statewide sample. Administrative data were utilized to conduct a secondary analysis of a cohort of Medicaid-enrolled children in Minnesota. We used billing data from Medicaid-enrolled families to identify a cohort of 3- to 5-year-old children with a diagnosis of ASD. The International Classification of Diseases, Ninth Revision, Clinical Modification (ICD-9-CM) billing code 299.0 for autistic disorder was used to identify EIBI service recipients between January 1, 2008 and December 31, 2010. All children included in the sample received a medical diagnosis of ASD from a qualified medical professional and EIBI services before entering elementary school (n = 667). Table 1 displays the cohort demographics. Most participants (n = 667) identified were male (82.2%) and White (71.7%). Within the cohort, approximately 15% of the children were Black, 6% were Hispanic, 5% were Asian, and 2% were American Indian. The distribution of race in the sample is, overall, reflective of the U.S. Census distribution data for Minnesota (U.S. Census Bureau, 2010). The majority of the children were diagnosed with ASD by the age of 4 years (68.5%, age range = 2–6 years), and 92% had a comorbid intellectual disability (ID), language disorder, or developmental delay between 3 and 5 years of age. Language disorders were the most common, (39%) followed by unspecified ID (20.4%) for comorbid impairments. Upon entry into elementary school (i.e., between 2010 and 2014), 64.5% of the cohort qualified for free or reduced-price lunch, 1% were homeless, and 6% had limited English proficiency. The sample size changed by school year (SY) due to the age ranges included when creating the statewide cohort; the same children were followed each year upon entry to school. The percentage of children in each grade during follow-up is reported in Table 2.
Educational Outcomes for Minnesota Sample by School Year.

Note. The estimate for average special education service hours is represented by M (SD). SY = school year; ASD = autism spectrum disorder; MCA = Minnesota Comprehensive Assessment.
Indicates that the sample only includes third graders and above. bIndicates that only fifth graders participated. The grade-level percentages reflect the range of children in the cohort ages 3 to 5 years who entered elementary school between 2010 and 2014.
Educational Outcomes for Minnesota Sample by Demographic Averaged Across School Years (2010–2014).

Note. Chi-square tests were conducted for the last year of follow-up (2014) between each outcome to compare males and females, White students with non-White students, metro with non-metro residence, and ID with students with developmental delay or a language disorder. Bolded estimates indicate a statistically significant finding. ASD = autism spectrum disorder; MCA = Minnesota Comprehensive Assessment; ID = intellectual disability.
Indicates that the chi-square test was statistically significant at ≤.05. **Indicates p ≤ .001.
Measures
In this study, administrative data were extracted from three extant data systems. The data systems included the Medicaid Management Information System (MMIS), the Minnesota Automated Reporting Student System (MARSS), and Minnesota Comprehensive Assessments (MCAs). All data were collected in Minnesota and were entered by the stakeholder agency responsible for oversight of the data system. Data accuracy and quality assurance was conducted by each stakeholder agency. The data reported were used as indicators to ensure accountability and compliance with federal reporting guidelines for Medicaid reimbursement, IDEA, and the Elementary and Secondary Education Act (Office of Special Education and Rehabilitative Services, Office of Special Education Programs, U.S. Department of Education, 2020).
The MMIS is an automated system for payment of medical claims and capitation payment. We used MMIS billing and demographic data from 2008 to 2010 to create the cohort sample. We utilized EIBI (i.e., individualized skills training and family skills training) billing claims H2014 UA/HR, comorbid ID, and communication disorder codes from speech, occupational, and physical therapy for the sample. All billing claims were cross-referenced and validated with a list of Minnesota EIBI providers from the Minnesota Department of Human Services (DHS). Each EIBI provider focused on addressing the child’s medically necessary treatment goals and aimed to enhance functional communication, social skills, and other adaptive behaviors using strategies grounded in behavioral principles (DHS, 2018). Quality of service provision information was not available and may have varied by provider. DHS was tasked with oversight of the providers and each one was required to meet DHS service expectations and competencies.
All education data were from the Minnesota Department of Education’s (MDE) MARSS, which includes data from all school districts statewide. We used the MARSS data set in this study from the SYs 2010–2014 to evaluate the educational outcomes. MARSS data include, but are not limited to, attendance, special education service, primary disability diagnosis, district numbers, and eligibility for free or reduced-price lunch/meals.
The data included scores from the MCAs, state academic achievement tests that help districts measure student academic progress toward standards specified under the Elementary and Secondary Education Act. At third grade, students take the reading and math sections of the test, and in fifth grade, a science section of the test is also given. The MCA-II was used by school districts in this sample for the school/academic year 2011. The version was updated the following year and MCA-III was implemented for all subsequent years.
Procedure
All three data systems were combined and unique records were matched, using probabilistic matching of first name, last name, middle name, and date of birth with Link Plus. Link Plus is a public record linkage tool that was created by the Centers for Disease Control and Prevention (2020). Previous research has demonstrated that Link Plus has high levels of sensitivity and positive predictive values for data linkage (Campbell et al., 2008). The data linkage match rate across the three data systems was 94.5%. We used a randomized selection of the linked data to check the validity of the matched records (e.g., rechecked that their birthdate was consistent across linked records). Data across each data set were also assessed for completeness, accuracy, uniqueness, and consistency across years. Approximately, 9% of the sample participants had missing data during follow-up in one or more of the SYs evaluated. The secondary data linking and analysis were approved by data stakeholders and the university’s institutional review board. After each of the three data sets was linked, all data were de-identified for data analysis.
Dependent Variables
The dependent variables included meeting special education eligibility primarily for ASD (yes or no), the instructional placement (general education, special education resource room, separate classroom, or a separate school for special education), special education service hours, and MCA participation/scale scores for reading, math, and science subscales.
Instructional placement setting
Federal educational environment categories were used to assess instructional placement settings (Office of Special Education and Rehabilitative Services, Office of Special Education Programs, U.S. Department of Education, 2020). General education placement consisted of children with disabilities receiving special education and related services outside the general education classroom for less than 21% of the school day. A resource room placement included students who received special education and related services outside the general education classroom for 21% to 60% of the school day. A separate/self-contained class placement consisted of children receiving special education and related services outside the general education classroom for more than 60% of the school day. The most restrictive placement was a separate school placement and included students with disabilities receiving special education and related services for greater than 50% of the school day in a separate public or private facility. A categorical variable of instructional placement was created for each school year for each participant. Instructional placements are an indicator utilized in administrative/educational data sets but it is noteworthy that, in many states, placements are subjective and may be influenced by local policy and advocacy rather than a reflection of the student’s ability or needs. We included instructional placements in this analysis for comparison purposes with the extant literature on placement data for students with ASD.
ASD special education eligibility in school
All students who received special education services, or had a signed IEP, Individual Family Service Plan (IFSP), or Individual Interagency Intervention Plan (IIIP; a planning option for students who also receive services from a public agency in Minnesota), had a primary disability that made them eligible for special education reported in the MARSS data set (MDE, 2011). There are 13 potential disability categories that a student could qualify under for special education services (age range = 6–21 years) and 14 categories for early childhood special education (i.e., including Developmental Delay diagnoses used for birth to 6 years of age only). A binary variable was created for each school year, evaluated based on whether they met ASD eligibility as the primary disability for special education service (yes, no) in elementary school.
MCA participation and scores
A binary variable was created for all eligible (third grade or above) students for each school year for whether they took the MCA or not. There were three subscales: reading, mathematics, and science. Only fifth graders were eligible to take the science subscale and, due to a limited number of participants at that grade (n = 66), it was not included in the analyses. The MCA scale score categories were examined to assess proficiency within each subscale. Proficiency categories included the following: did not meet, partially met, met, and exceeded the standard. A binary variable was used to assess participation in the MCA tests and a categorical variable was utilized to assess proficiency.
Data Analysis
To determine the educational outcomes of children who received EIBI before entering elementary school, we examined individual frequencies and percentages across the dependent measures. Descriptive analyses of demographic information for all children included in the cohort are reported in relation to the educational outcomes during school follow-up. Chi-square tests of independence and odds ratios (ORs) were performed to examine the relationship between demographic groups (i.e., gender, race, residence, and ID) and each educational outcome for the last year of follow-up (e.g., Do males and females differ on whether they received a general education placement?). Significance testing was conducted at an alpha level of .05. Chi-square tests and ORs compared counts for each educational outcome in 2014 for male and females, White and non-White students, metro and nonmetro residence, and comorbid ID and developmental disability or language disorder demographic groupings. Metro and nonmetro residence designations were based on the U.S. Census Bureau definitions of population densities for rural and urban areas (U.S. Department of Commerce, 2012).
Results
Services Received
All children included in the cohort, ages 3 to 5 years, received EIBI services between 2008 and 2010. The average hours per week of EIBI received by the cohort was 20.23 hr (SD = 14.68 hr, Mdn = 13.81). Only 10% of the sample received 40 hr of service a week and 35% received the recommended 25 hr or more. The average age to start EIBI services was 4.70 years (SD = 1.24). Among children with comorbid disabilities, those with severe ID and unspecified intellectual disabilities received the most average hours per week (severe M = 19.98 hr, SD = 12.81; unspecified M = 19.49 hr, SD = 12.00). Children with language disorders received the least among those with comorbid disabilities (M = 17.34 hr, SD = 11.85). The total duration of EIBI receipt is unknown because this analysis only includes billing between 2008 and 2010. For most of the cohort, EIBI was delivered within their home (60%) or in a center-based program (34%). The EIBI service professionals were primarily licensed psychologists and board-certified behavior analysts (65%). More than half of the cohort received speech-language therapy along with EIBI. Approximately, 43% of the sample received occupational therapy and 12% of children in the cohort received physical therapy prior to entering elementary school.
Educational Outcomes
The grade levels represented in this sample include kindergarten to sixth grade (Table 1). Sixty children (9%) were lost to follow-up after they entered kindergarten. Overall, 94% of the cohort qualified for special education services across the school years examined. The SY2010 yielded the highest percentage of children in the cohort who qualified for special education services. The primary special education eligibility given for special education qualification was ASD for more than 70% of the cohort. The children who did not qualify under ASD were eligible for special education under ID or speech and language impairments. The average special education service hours ranged from 116 hr (SY2013) to 220 hr (SY2010). The most common instructional placement setting across the school years was general education, followed by self-contained classrooms. Instructional placement in separate restricted schools (i.e., the most restrictive placement) was the least common placement. For a majority of the children, the placement they entered in at kindergarten was the placement they remained in at follow-up. In addition, 46% to 59% of eligible students participated in MCA reading and mathematics standardized tests. Among eligible fifth-grade students, 36% participated in the MCA science test in SY2013, and 53% in SY2014.
Educational outcomes by demographics (Table 2)
Gender
Table 2 displays the average percentage for each demographic and educational outcome across all school years examined. Within the cohort, slightly more males (M = 95.3%, 94.4%–97.8%) than females (M = 93.1%, 92.5%–94.2%) qualified for special education across the school years examined. Males also had higher rates of primary educational diagnosis of ASD (M = 73.7%, 73%–74.8%) than females (M = 55.5%, 55.1%–56.8%). MCA participation was similar, with more than half of the males taking the test across 2012–2014. With regard to instructional placements, males and females also had similar rates, with approximately 40% of the sample receiving instruction in a general education setting across the school years. The relation between gender and an educational diagnosis of ASD was significant, χ2(1, N = 607) = 13.35, p < .001. Males were twice as likely, compared with females, to have met primary special education eligibility for ASD (OR = 2.20, 95% confidence interval [CI] = [1.43, 3.38]). The relation between gender and special education qualification, MCA participation, and a general education placement was not statistically significant.
Race/ethnicity
More than 90% of the cohort qualified for special education across racial groups and school years examined. All the students identified as Asian qualified for special education across each of the SYs. The second highest rate of students qualifying for special education was among students who were Black (M = 98.0%, 96.7%–98.9%) and the lowest rate was among students who were American Indian (M = 95.7%, 90.9%–100%) or Hispanic (M = 93.7%, 91.4%–95.2%). Students who were Asian also had the highest percentage of primary ASD eligibility across school years and American Indian students had the lowest percentage. Among the students eligible (by age) to take the MCA achievement tests, overall, more White students participated in the test but the highest percentage of students who participated were Hispanic. American Indian students had the lowest participation proportions across follow-up. Finally, White and Asian students had the most placements in a general education setting and Black students had the least.
The relation between race and qualification for special education χ2(1, N = 607) = 5.08, p = .02, an educational diagnosis of ASD, χ2(1, N = 607) = 3.90, p = .05, MCA participation, χ2(1, N = 429) = 7.08, p = .01, and receiving a general education placement, χ2(1, N = 607) = 9.41, p = .002 was statistically significant. The odds of students who were White to qualify for a special education placement were lower compared with students who were not White (OR = 0.32, 95% CI = [ 0.11, 0.91]). White students had higher odds of receiving a special education eligibility for ASD (OR = 1.46, 95% CI = [1.00, 2.14]), to participate in the MCA standardized testing (OR = 1.78, 95% CI = [1.16, 2.72]), and be placed in a general education classroom (OR = 1.80, 95% CI = [1.23, 2.64]) compared with students who were not White.
Residence
The seven-county Twin Cities metropolitan area (i.e., primarily urban) within Minnesota was compared with the nonmetro surrounding area (i.e., primarily rural). Special education qualification percentages were similar across metro and nonmetro areas (metro M = 95.9%, nonmetro M = 95.9%, 90.1%–97.4%). The metro area had higher rates of primary ASD diagnoses across school years and, overall, higher percentages of MCA participation compared with the nonmetro areas. Conversely, the nonmetro areas had more general education instructional placements (M = 47.3%, 45.8%–50.5% vs. M = 39.6%, 7.7%–42.2%, respectively).
The chi-square tests for the relation between residence and qualification for special education, χ2(1, N = 607) = 8.06, p = .01, receiving an educational diagnosis of ASD, χ2(1, N = 607) = 9.78, p = .002, and receiving a general education placement, χ2(1, N = 607) = 4.77, p = .03, were statistically significant. There was no difference observed between MCA standardized testing participation by residence. Students who resided in the metro areas had higher odds of receiving special education (OR = 2.59, 95% CI = [1.32, 5.11]) and an educational diagnosis of ASD (OR = 1.78, 95% CI = [1.24, 2.56]). Lower odds, however, were observed for MCA standardized testing participation (OR = 0.90, 95% CI = [0.59, 1.35]) and general education placements (OR = 0.68, 95% CI = [0.48, 0.96]) for students in metro areas in comparison with nonmetro areas.
Comorbid disability
Among children with comorbid language disorders, developmental delay, or an ID (mild, moderate, severe, profound, and unspecified), qualification and receipt for special education services was more than 95% across the SYs observed. Moderate ID and Mild ID had the highest rate of ASD as a primary special education qualification for services and severe ID had the lowest rate across school years. No children with profound ID participated in the MCA achievement tests, and severe ID comorbid diagnoses also had low rates of participation. Children diagnosed with developmental delay previously had the highest percentage of participation in the achievement tests across eligible school years. Similarly, children with comorbid profound ID and severe ID had the least number of general education instructional placements and children with language disorders had the most number of general education placements.
The relation between having a comorbid disability (e.g., an ID) and qualification for special education, χ2(1, N = 560) = 3.70, p = .05, participating in the MCA standardized testing, χ2(1, N = 404) = 23.11, p < .001, and receiving a general education placement, χ2(1, N = 560) = 25.12, p < .001, was statistically significant. There was no difference between meeting special education eligibility under ASD by comorbid disability status. Students who had an ID were at higher odds of receiving special education (OR = 3.25, 95% CI = [0.92, 11.50]) and participating in standardized testing (OR = 2.67, 95% CI = [1.78, 4.00]) than those students with developmental delay or a language disorder. Lower odds were observed for meeting special education eligibility under ASD (OR = 0.99, 95% CI = [ 0.69, 1.42]) and a general education placement (OR = 0.34, 95% CI = [ 0.22, 0.52]) for students with an ID in comparison with students with developmental delay or a language disorder.
Achievement test proficiency
Math
Figure 1 shows the frequency of children who met or exceeded proficiency in the math and reading subscale of the achievement test. Across all years examined, less than half of the children (30%–47%) who participated in the MCA math standardized test met the standard for proficiency. In general, more males than females met or exceeded the math standard and most were White (30%–43%) and lived in the metro area (29%–31%). More children who had a language disorder (11%) met or exceeded proficiency in comparison with children with developmental delay or an ID.
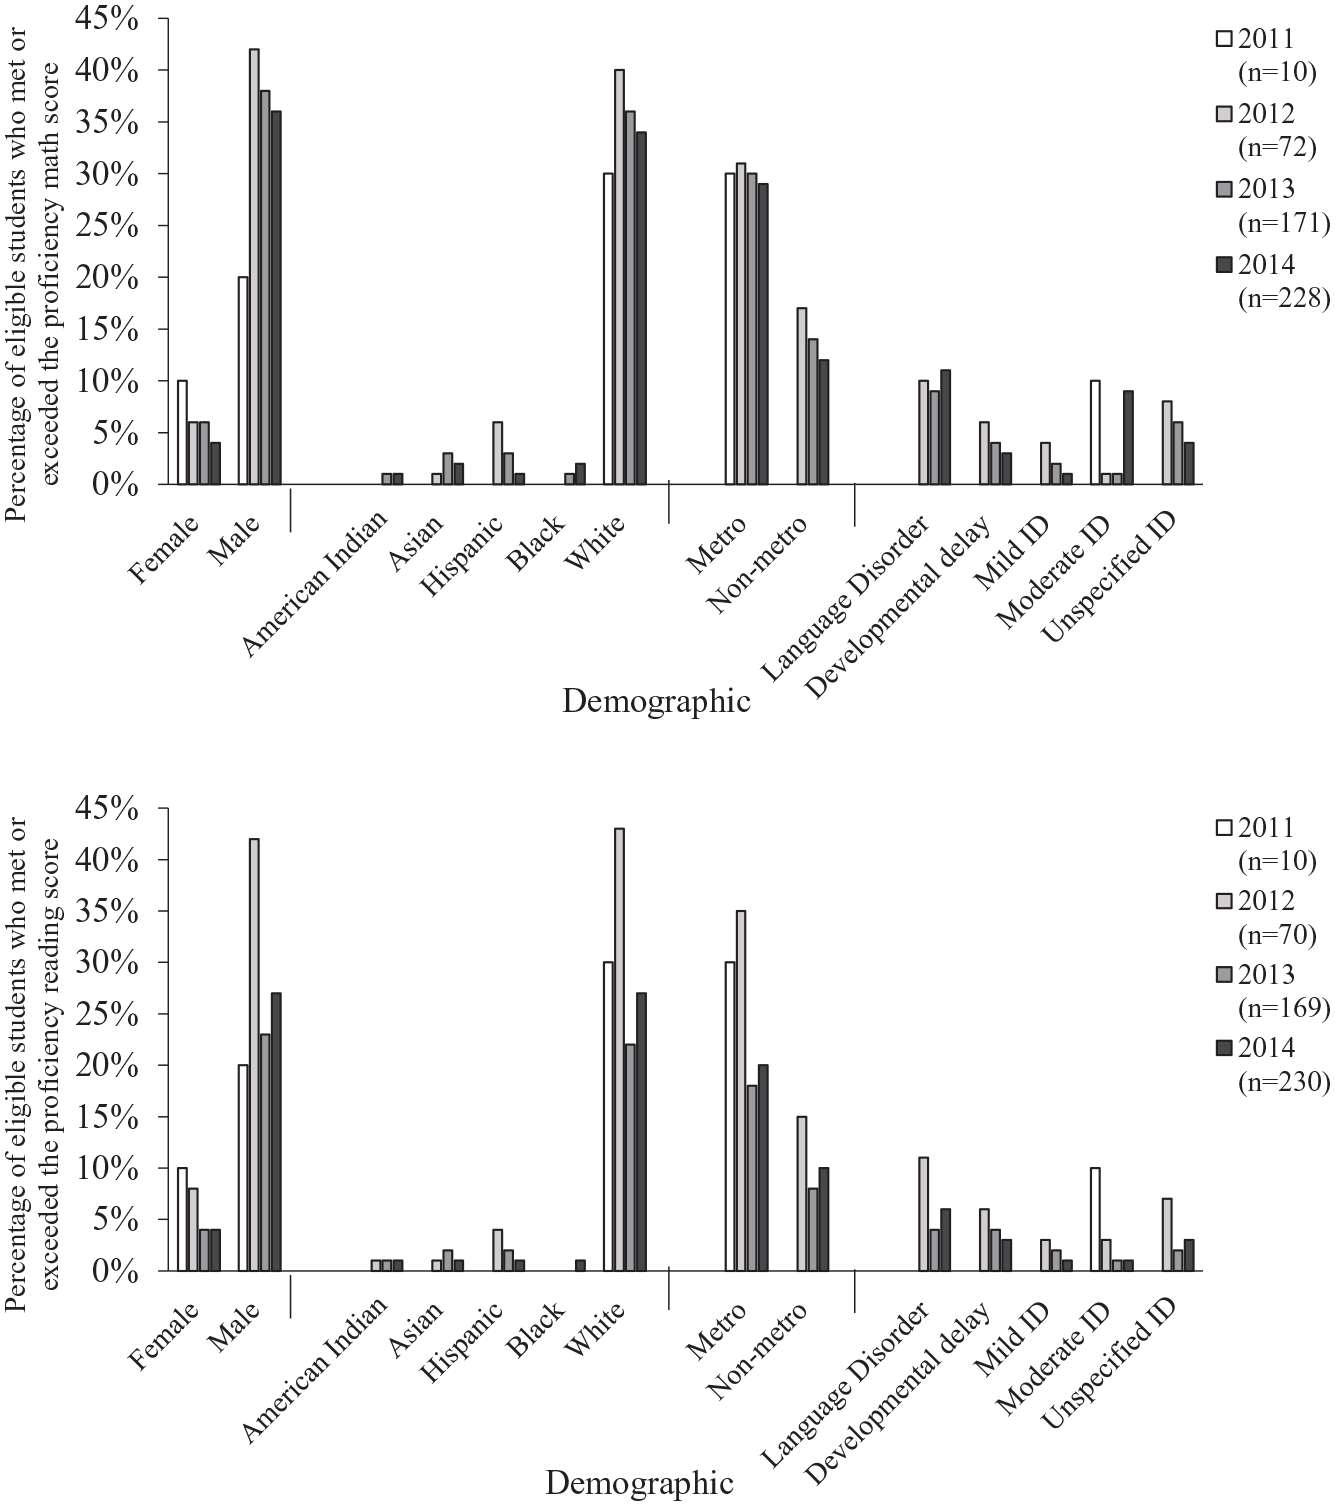
Percentage of students whose standardized math and reading scores from Minnesota Comprehensive Assessments met or exceeded proficiency by school year.
Reading
Across the follow-up years, only 27% to 50% of children met or exceeded proficiency on the reading subscale. Again, more males (20%–42%) than females met the standard, with a majority of the children being White (22%–43%) and living in the metro area (18%–35%). Among the few children with a comorbid disability who participated in the standardized test, children with a language disorder had the highest rate of meeting or exceeding the reading standards.
Instructional placements
Figure 2 displays the trends in instructional placements across the school years at follow-up. Rates were relatively stable across the school years, indicating that the placement the students were given for instruction did not tend to change over time. General education was the most common placement followed by self-contained classrooms.

Instructional setting placements for Minnesota Sample by school year.
Discussion
The purpose of this study was to examine the educational outcomes of a Medicaid-enrolled cohort of children with ASD who received EIBI, when they were approximately 3 to 5 years old, before entering elementary school. There is limited literature on the academic achievement and educational outcomes for children with ASD in general. Children enrolled in Medicaid and who received EIBI were the focus of this study. Although there is an evidence base specific to clinical measures regarding IQ and adaptive behavior for children with ASD and EIBI, fewer studies have focused specifically on long-term elementary school–age educational outcomes. These findings are informative for special educators, parents, and policy makers in that the descriptive data reveal some of the educational experiences of children with ASD.
Among the cohort evaluated, more than 94% qualified for special education services in elementary school at follow-up, with more than 70% qualifying under an ASD diagnosis. Approximately, half of the sample participated in the statewide standardized academic assessment (i.e., the non-adapted version). Overall, the most common instructional placement setting was general education, which is aligned with the national data from the Office of Special Education in the U.S. Department of Education on students with ASD under IDEA. In 2014, nationwide, approximately 14% of students ages 6 to 21 years received an instructional placement within a self-contained classroom (Office of Special Education Programs, U.S. Department of Education, 2017). Within our study cohort, the rates were higher, with 36% of students on average receiving special education within a self-contained classroom. All other instructional placements were similar to the national rates reported.
The cohort evaluated in this study is unique in that it is a statewide sample of Medicaid-enrolled children. Compared with the previous studies that followed children with ASD who received EIBI, our sample is disparate in that it is not from a disability center or clinical convenience sample, rather it is a community sample. The outcomes assessed and the findings, however, were similar despite the differences inherent to the sample included. Minnesota did not enact an insurance coverage mandate for EIBI until 2014, before the sample in this study received EIBI, which could have affected the availability of service providers and hours allocated to the cohort and thus the generalizability of our findings.
According to the U.S. Department of Education, under IDEA, the number of students served nationwide (age range = 3–21 years) in public school was 6.5 million, or 13% in 2014 (i.e., the last year of follow-up in this study). Of the students with disabilities served in 2014 under IDEA, 8% received services to address a diagnosis of ASD. Within Minnesota, specifically, approximately 10% of students ages 6 to 21 years in the state in 2014 were served under IDEA for a disability and 1.35% had an ASD diagnosis (Office of Special Education Programs, U.S. Department of Education, 2015). Minnesota reported the highest percentage (14% of 6- to 21-year-olds with ASD) of service for students with ASD compared with the other states in 2014 (Office of Special Education Programs, U.S. Department of Education, 2015).
The educational outcomes by demographic descriptive analyses for the cohort indicated that males were more likely than females to qualify for special education services and were more likely to meet special education eligibility under ASD and be given a primary diagnosis of ASD at elementary school age. Statewide in Minnesota in 2014, males made up 85% of students ages 6 to 21 years with a diagnosis of ASD versus 16% of females (Office of Special Education Programs, U.S. Department of Education, 2015). These rates are similar to the national prevalence estimates, which indicate that males are diagnosed at a rate of 4:1 in comparison with females (Baio et al., 2018). Although there were less females in the cohort, it appears that females were less likely to have an educational diagnosis once they entered school. This could reflect resilience and gains related to EIBI or possible bias resulting from a camouflaging effect of autism-related symptomology.
Results from this study also indicated that students identified as Asian had the highest rates of special education eligibility and primary ASD diagnosis across each of the SYs. These rates reflect the national distribution of ASD diagnoses in public schools, with Asian students having the highest rates of receiving special education services for an ASD diagnosis (21%), in comparison with White (10%) and Black (7%) students, for instance (Office of Special Education Programs, U.S. Department of Education, 2017). It is not clear why these discrepancies exist but they may represent underlying bias that needs to be addressed in an equitable way. A majority of White students participated in the MCA standardized testing but the highest percentage of students who participated were Hispanic. Of note is that there were, overall, a small percentage of Hispanic children in the cohort. The distribution of Hispanic children is consistent with the statewide trends of both Black and Hispanic children being less likely to be identified with ASD compared with White children (Baio et al., 2018). It is unclear why, in our sample, Hispanic children had the highest participation rates for taking the MCA; it could be due to advocacy or the different school district policies in place at the time. In addition, Black students had the least placements in general education within the cohort. This reflects a state-specific disparity; the national data conversely shows that approximately 57% of Black students with disabilities are served primarily in general education instructional placements (Office of Special Education Programs, U.S. Department of Education, 2015).
Regarding regional differences, special education qualification percentages were similar across metro and nonmetro areas examined. The metro area (i.e., a proxy for urbanicity) had higher rates of primary ASD diagnoses and MCA participation compared with the nonmetro areas; however, the nonmetro areas had more general education instructional placements. Previous research suggests that rural areas are associated with delayed diagnoses of ASD and more challenges to accessing to autism-related services than urban areas (Mandell et al., 2005; Murphy & Ruble, 2012).
Students with Moderate ID and Mild ID had the highest rate of ASD as a primary educational diagnosis for services and severe ID had the lowest rate of ASD across school years. Children who were diagnosed with developmental delay previously had the highest percentage of participation in the achievement tests across eligible school years. These results align with previous studies that suggest that, among students with ASD, those with higher IQ/less severe ASD do better academically in both mathematics and reading (e.g., Eaves & Ho, 1997; Estes et al., 2011). Similarly, children with comorbid profound ID and severe ID had the least number of general education instructional placements and children with language disorders had the most number of general education placements.
For students participating in the standardized academic testing, 40% were proficient (i.e., met or exceeded standards) in mathematics and 31% were proficient in reading. Compared with the most recent standardized testing completed in Minnesota in 2018, proficiency percentages across third, fourth, and fifth graders among special education students ranged from 25% to 40% for mathematics and from 28% to 33% for reading (MDE, 2018). The results from this study fall within the ranges observed among students in special education and, in comparison with students not receiving special education services within Minnesota in 2018, more than 55% were proficient in mathematics and reading subscales (MDE, 2018). White students primarily met proficiency standards within the sample (27%–34%), similar to the 2018 Minnesota records which indicated that 33% to 50% of White students in special education were proficient compared with 7.8% to 13.4% of Black students in special education (MDE, 2018).
The pronounced differences in terms of both educational experiences (i.e., instructional placement) and achievement between the students from culturally and linguistically diverse communities and White students with ASD resemble the disparities in academic achievement of students without disabilities. Racial disparities are common in terms of age of identification of ASD, access to autism-related services, and educational service receipt as well (e.g., Bilaver et al., 2020). Why underperformance and a widening achievement gap for both students with and without disabilities within the United States is routinely observed is most likely related to structural and systematic racism and policies. The findings from this study emphasize the need for system-wide changes to better meet the needs of Black, Indigenous, and other students of color. In addition, socioeconomic status could have contributed to the differences observed and needs to be evaluated further in relation to race. The performance disparities are clear and need to be addressed rigorously.
Limitations
There were several noteworthy study limitations. The study was observational and retrospective, and the educational outcomes were limited to those available in administrative databases (i.e., MCA-III scores and placement information). Other indicators for academic achievement and what services in elementary school that children were receiving were not available, such as the IEPs for the students receiving special education services. In addition, the outcomes evaluated are not necessarily indicators of success in school but rather describe the educational experiences of the cohort. The sample is exclusively from one state (Minnesota) and only included families using Medicaid for services; therefore, the findings should be interpreted cautiously in terms of external validity. No information on family education, income, or socioeconomic status, other than qualification for free or reduced-price meals, was available. The sample was primarily children who were White, which also makes the generalizability of this study limited. Quality of EIBI service was not assessed or known. There are standards of practice for EIBI service providers, but there may be variability in terms of curriculum or type of EIBI service provided, which could account for differences in outcomes. Similarly, the total quantity and duration of EIBI receipt is unknown; the children evaluated in this study may have continued to receive EIBI once they entered elementary school. Finally, we did not evaluate whether intervention dosage or service receipt (i.e., 20 hr a week vs. 40 hr a week of EIBI) affected the educational outcomes reported because our data were limited to a specific date range but this is a future analysis that will be important to conduct.
Future Directions
Given incidence trends and growing prevalence, a more concerted effort is needed to measure and track academic/educational achievement among individuals with ASD, in relation to intervention history, to evaluate growth and identify areas of need in relation to early intervention content and dosage. EIBI has been well-documented to produce adaptive behavior gains for children with ASD, but how those gains related to late school/education outcomes in terms of academic performance is less clear. A 10-year follow-up on children who received EIBI showed that gains made during EIBI maintained and a reduction in autism symptoms was evident (D. P. Smith et al., 2019). The sustainability of the gains and trajectory of individuals with ASD throughout their elementary and secondary school experience will be important to continually examine and evaluate, ultimately, through to postsecondary and community living outcomes. Medicaid and other existing administrative databases should be leveraged to continue to answer population-level questions to provide a policy-level perspective on effective intervention and treatment services throughout the life span for individuals with ASD. As the empirical base continues to grow specific to intervention dosage, timing, and durability over short time scales, longitudinal, population-level cohort studies will become increasingly important as intervention efforts are taken to scale (e.g., school districts and states). Considering the heterogeneity of ASD, a specific focus of future work will need to be finer grained understanding of predictors of academic success, so that educational systems are informed about what is working, for whom, and under what conditions—in this case, prior early intervention experience—to optimize supports for educational success for students with autism.
Footnotes
Declaration of Conflicting Interests
The author(s) declared no potential conflicts of interest with respect to the research, authorship, and/or publication of this article.
Funding
This material is based upon work supported by the National Science Foundation under grant No. SMA1338489. Any opinions, findings, and conclusions or recommendations in this material are those of the author(s) and do not necessarily reflect the views of the National Science Foundation.
